






Abstract
When people move their eyes, the eye-centered (retinotopic) locations of objects must be updated to maintain world-centered (spatiotopic) stability. Here, we demonstrated that the attentional-updating process temporarily distorts the fundamental ability to bind object locations with their features. Subjects were simultaneously presented with four colors after a saccade—one in a precued spatiotopic target location—and were instructed to report the target’s color using a color wheel. Subjects’ reports were systematically shifted in color space toward the color of the distractor in the retinotopic location of the cue. Probabilistic modeling exposed both crude swapping errors and subtler feature mixing (as if the retinotopic color had blended into the spatiotopic percept). Additional experiments conducted without saccades revealed that the two types of errors stemmed from different attentional mechanisms (attention shifting vs. splitting). Feature mixing not only reflects a new perceptual phenomenon, but also provides novel insight into how attention is remapped across saccades.
Keywords
The human sensory systems are constantly bombarded with information and cannot process everything in the environment. Eye movements and spatial attention are two fundamental means by which the visual system filters the complex environment. Eye movements are particularly interesting both in terms of their frequency (multiple times each second) and the additional challenge the movements introduce for spatial stability. With each movement, the images hitting the retinae change dramatically. How can one attend to a world-centered (spatiotopic) location when the underlying visual representations are coded in retinotopic (eye-centered) coordinates (Cohen & Andersen, 2002; Gardner, Merriam, Movshon, & Heeger, 2008; Golomb, Chun, & Mazer, 2008; Golomb, Nguyen-Phuc, Mazer, McCarthy, & Chun, 2010), even at higher stages of processing (Golomb & Kanwisher, 2012a; but see Crespi et al., 2011; d’Avossa et al., 2007)? The brain may solve this problem in part by predictive remapping (Duhamel, Colby, & Goldberg, 1992), that is, by updating receptive fields—or spatial pointers (Cavanagh, Hunt, Afraz, & Rolfs, 2010)—with each saccade, sometimes even before it is executed. However, visual stability requires not only that spatial locations be updated, but also that the updated spatial information is correctly bound to features in the environment.
We have recently argued that updating of spatial attention across saccades entails two distinct processes: a rapid (sometimes anticipatory) remapping to the new location (Rolfs, Jonikaitis, Deubel, & Cavanagh, 2011) and a slower process of extinguishing the previous representation (Golomb et al., 2008; Golomb, Marino, Chun, & Mazer, 2011; Golomb et al., 2010). Here, we predicted that if the attentional-updating process is not complete by the end of the saccade, such that both representations are temporarily active at the same time (the newly remapped location and the not-yet-extinguished previous location), people might be susceptible to errors beyond spatial misperception. Might we even find a mixing of features at these two locations? Furthermore, might such mixing be found not only when eye movements occur, but also whenever two attentional traces are active at the same time?
We used a continuous-report paradigm (Wilken & Ma, 2004; Zhang & Luck, 2008) in which subjects were presented with an array of four colored stimuli and were instructed to report the color of a designated stimulus by clicking the appropriate place on a color wheel (Fig. 1). The target location was cued before the saccade, but all four colors were presented simultaneously after the saccade—thus, this task was not about trans-saccadic integration of color (integrating features from the same location at two points in time; Hunt & Cavanagh, 2011; Wittenberg, Bremmer, & Wachtler, 2008), but the ability to correctly bind features to their locations (associating a single color with a single location; Treisman, 1996). Whereas previous studies have reported peri-saccadic errors involving spatiotemporal mislocalization (Burr, Ross, Binda, & Morrone, 2010; Ross, Morrone, & Burr, 1997) or general perceptual impairments (Latour, 1962; Ross, Morrone, Goldberg, & Burr, 2001), the current study is, to our knowledge, the first to investigate distortions of feature binding following a saccade. Furthermore, we predicted a novel, specific disruption of binding: After a saccade, the presence of a retinotopic distractor (but not a distractor at a control location) would systematically distort perception at the spatiotopic location via either erroneous swapping of retinotopic and spatiotopic features or perhaps even feature mixing, producing a blended percept.
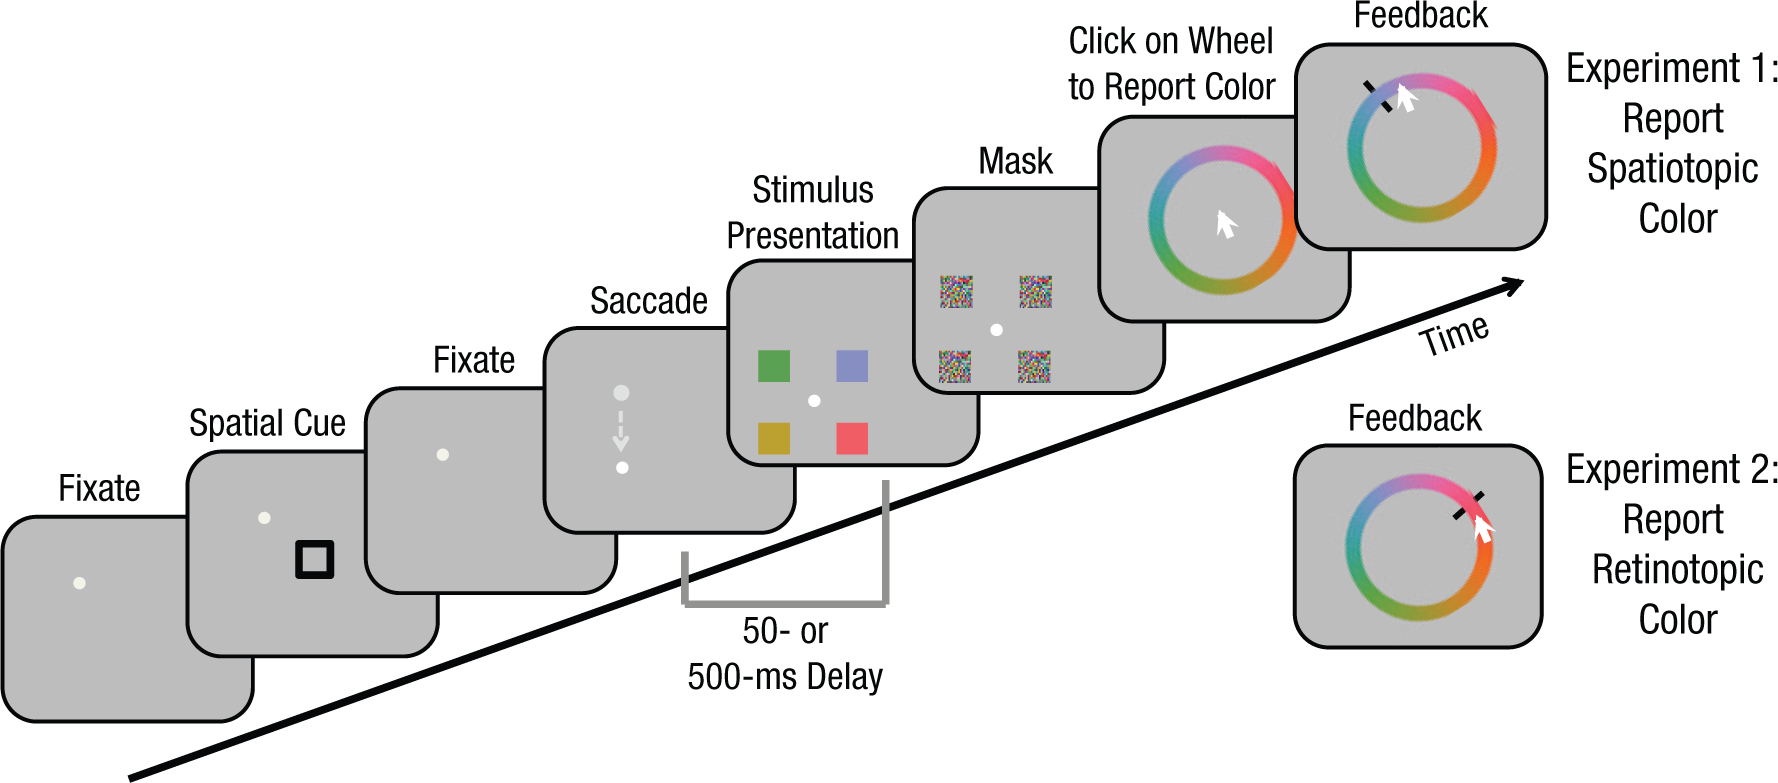
Sample saccade trial from Experiments 1 and 2. Trials began with a fixation dot, followed by a black square that functioned as a spatial cue. Subjects were instructed to report the color of whichever stimulus subsequently appeared at the cued location, in either spatiotopic (Experiment 1) or retinotopic (Experiment 2) coordinates. The fixation dot moved to a new location prior to stimulus presentation, and subjects needed to accurately make a saccade to the new fixation location. At either 50 ms or 500 ms after completion of the saccade, an array of four colored stimuli appeared for 50 ms, followed by a mask array. After the fixation dot and masks disappeared, a color wheel (at a random rotation) was presented at the center of the screen. Subjects moved the mouse to report the appropriate target color. On no-saccade trials, the fixation dot never moved, but the trial sequence was otherwise the same. Note that the fixation dot could move horizontally or vertically, and cue location and stimulus colors were also varied.
In the present experiments, we tested this hypothesis that distortions in feature binding are present immediately following a saccade when attention is to be maintained at a spatiotopic location (Experiment 1). We also compared it with other scenarios involving potentially ambiguous attentional states: when attention is maintained at a retinotopic location across a saccade (Experiment 2) and when attention is shifted (Experiment 3) or split (Experiment 4) across two locations in the absence of a saccade.
Method
Subjects
Experiment 1 included 16 subjects (8 female, 8 male; mean age = 27.2 years), and Experiment 2 included 9 subjects (5 female, 4 male; mean age = 23.9 years); 3 subjects participated in both experiments. Experiments 3 and 4 included 12 subjects (6 female, 6 male; mean age = 18.7 years) and 18 subjects (11 female, 7 male; mean age = 22.3 years), respectively. Additional subjects were excluded for not successfully performing the task (> 50% probability of random guessing on no-saccade trials, γ parameter from the basic mixture model described in the Analyses section). See the Supplemental Material available online for additional details on subjects and exclusions.
Experimental setup
Stimuli were generated using the Psychophysics toolbox extension (Brainard, 1997) for MATLAB (The MathWorks, Natick, MA) and presented on a 21-in. flat-screen CRT monitor. Subjects were seated with their head resting on a chin rest 64 cm from the monitor. Eye position was monitored using ISCAN (Woburn, MA; Experiments 1 and 2) and EyeLink 1000 (SR Research, Kanata, Ontario, Canada; Experiments 3 and 4) eye tracking systems recording pupil and corneal reflection. The monitors were color calibrated with a Minolta CS-100 colorimeter.
Procedure
Experiment 1: spatiotopic task
Each trial in Experiment 1 began with a white fixation dot presented at one of four locations on the screen (arranged as the corners of an 8.7° × 8.7° square; see Fig. 1). Once subjects were accurately fixating for 1 s (determined by real-time eye tracking), a spatial cue (a black 2° × 2° square) was presented for 500 ms. After another 1-s fixation period, on half of the trials, the fixation dot jumped to a horizontally or vertically adjacent position. On these saccade trials, subjects had to immediately move their eyes to the new location. On the other half of trials (no-saccade trials), the fixation dot remained at the original location, and subjects held fixation for an equivalent amount of time based on average saccadic latency from a prior study (~350 ms). Both the location of the cue (any of five locations on the screen: center, center top, center bottom, left center, or right center) and the presence and direction of the saccade were randomized.
After a delay of either 50 ms or 500 ms from the time of successful saccade completion (the early-postsaccade and later-postsaccade conditions, respectively), an array of four squares, each with a different color, appeared at equidistant locations around fixation (7.4° eccentricity). The colored squares appeared for 50 ms, followed by 200 ms of masks (squares colored with a random color value at each pixel location, covering each of the four stimulus locations). A large color wheel (diameter = 16.4°) was then presented in the center of the screen—at a random rotation—and subjects clicked with the mouse to report the color of the square that appeared at the same spatiotopic (absolute) location as the cue. They were then given feedback showing them the correct color.
On saccade trials, one of the four colored stimuli appeared at the spatiotopic location of the cue—this was the color that subjects were supposed to report. Another stimulus occupied the same retinotopic location as the cue, and the two remaining stimuli occupied the mirror-symmetric control locations. On no-saccade trials, the cued location was both spatiotopic and retinotopic, and the other three stimuli were all considered control locations. The color at the cued (spatiotopic) location was chosen randomly on each trial from 180 possible colors, which were evenly distributed along a circle in Commission Internationale de l’Éclairage (CIE) L*a*b* color space (according to the parameters in Zhang & Luck, 2008). The colors of the remaining stimuli were chosen so that the retinotopic and equidistant control stimuli were equally different from the spatiotopic color, but in opposite directions (90° clockwise or counterclockwise along the color wheel, with direction randomly varying from trial to trial). The stimulus at the diagonal location was set 180° away in color space.
At any point in the trial, if the subject’s eye position deviated more than 2° from the correct fixation location, or if saccadic latency was greater than 600 ms, the trial was immediately aborted and repeated later in the block.
Experiment 2: retinotopic task
The stimuli and task in Experiment 2 were identical to that in Experiment 1, except that subjects reported the color of the stimulus at the retinotopic (not spatiotopic) location of the cue.
Experiment 3: shift-attention task
In Experiment 3, subjects remained fixated on a central dot throughout the trial (Fig. 2a). One of four peripheral locations was cued for 250 ms, as in the previous experiments. On half of the trials (shift trials), a second cue appeared after a 1-s delay in a different location for 50 ms. After either a 50-ms or 500-ms delay, the array of four colored squares appeared for 50 ms, followed by the masks and color wheel as in Experiments 1 and 2. The task was to report the color that appeared at the most recent location of the cue; that is, subjects had to shift attention from the original location to the final location. On no-shift trials, a second cue never appeared, and subjects simply reported the color at the initially cued location. Inclusion of no-shift trials ensured that subjects had to attend to the first cue and could not simply wait for the second.
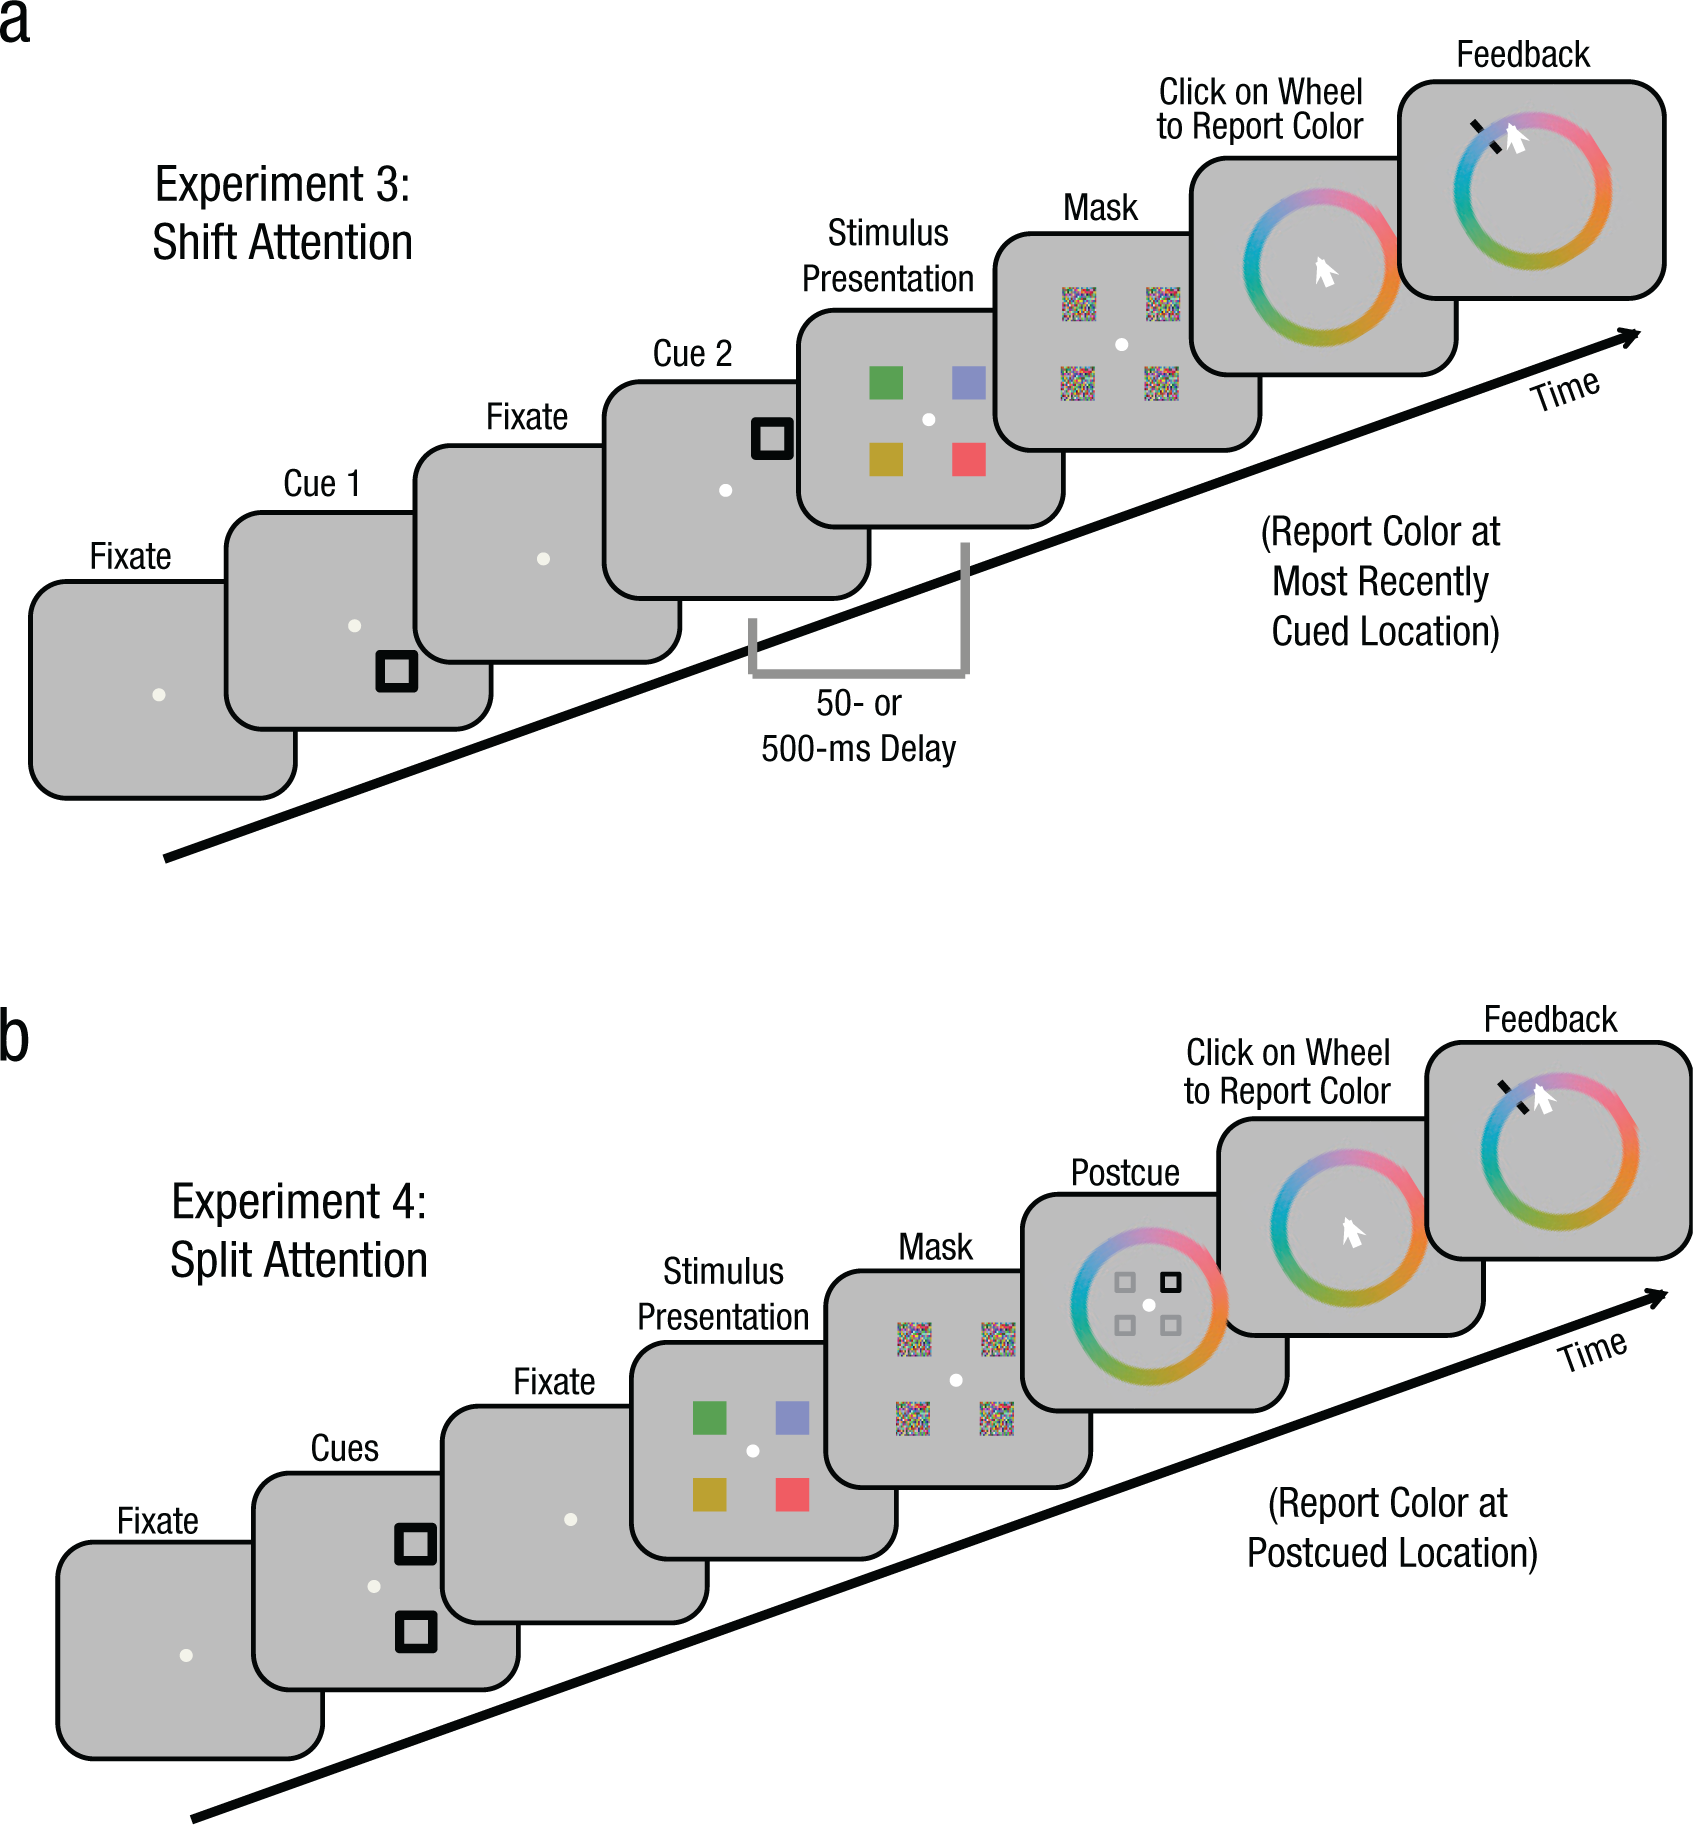
Trial sequence for Experiments 3 and 4. As in Experiments 1 and 2, trials in Experiment 3 (a) began with a fixation dot and a brief spatial cue. Subjects were instructed to attend to the cued location to report the color of the stimulus that subsequently appeared there. On shift trials (shown here), a second cue appeared before stimulus presentation, and subjects needed to shift their attention and report the color at the final cued location. On no-shift trials, subjects received only the first cue. The rest of the trial sequence was the same as in Experiments 1 and 2. In Experiment 4 (b), subjects received two simultaneous cues and were told to attend to both locations while keeping their eyes on the fixation dot. Stimuli and masks were then presented as in the earlier experiments, except that a postcue appearing with the color wheel instructed subjects which of the two locations to report.
Experiment 4: split-attention task
In Experiment 4, subjects fixated on a central dot, and two of the four stimulus locations were simultaneously cued (Fig. 2b). Subjects were instructed to attend to both locations (split attention). After 1 s, the four colors appeared, followed by the masks, as in the previous experiments. When the color wheel appeared, a postcue was presented indicating which of the locations to report. The postcued location was always one of the two precued locations, but which one was unpredictable.
Analyses
The location on the color wheel where subjects clicked on each trial was recorded and converted into a difference score in degrees of visual angle. For Experiment 1, the correct spatiotopic color was represented as 0°, and retinotopic and control distractors were aligned at 90° and −90°, respectively. For the remaining experiments, the difference scores were aligned as follows—Experiment 2: retinotopic color at 0° and spatiotopic color at 90°; Experiment 3: final cued location at 0° and original cued location at 90°; Experiment 4: color at the postcued location at 0° and color at the other attended location at 90°. The mean of the distribution was calculated separately for each subject and condition, and two-tailed t tests were run to determine whether the means were significantly different from zero.
The distribution of responses was also fit with probabilistic models (Bays, Catalao, & Husain, 2009; Zhang & Luck, 2008) accounting for various sources of error.
Model A: Basic mixture model combining a circular Gaussian (von Mises) probability density function and a uniform guessing component:
where θ is the difference in radians between the reported and target color values, γ is the proportion of trials in which the subject responded at random, and φ is the von Mises distribution with mean µ and concentration κ (SD =
Model B: Model combining three Gaussian distributions, centered on the spatiotopic target, retinotopic distractor, and control distractor color values, respectively:
where the means of the von Mises distributions (φ) are fixed at 0 (spatiotopic target), π (retinotopic distractor), and −π (control distractor). β is the probability of misreporting the retinotopic color value, δ is the probability of misreporting the control color value, and the parameters κ0, κπ, and κ−π (SD =
Model C: Combination model allowing for both a shift in spatiotopic percept and a misreport of retinotopic distractor colors, plus guessing:
where γ is the probability of random guessing, β is the probability of misreporting the retinotopic color value (defined by a von Mises distribution with a fixed mean of π and flexible κπ), and µ and κ are the mean and concentration, respectively, of the primary von Mises distribution.
Maximum-likelihood estimates of the parameters µ, κ, κ0, κ−π, κπ, γ, β, and δ were obtained separately for each subject and condition using MATLAB’s fminsearch optimization procedure (Nelder & Mead, 1965). A range of initial parameter values were tested to ensure that global minima were reached.
Results
In Experiment 1, response distributions on no-saccade trials were centered on the correct spatiotopic color value (Fig. 3); means were not significantly different from 0° (ts < 1, ps > .38, for both early and later delays). However, when the stimuli were presented 50 ms after completion of a saccade, the distribution was subtly but significantly shifted in color space in the direction of the retinotopic distractor color (shift = 7.7°), t(15) = 3.12, p = .007. This shift was present only at the early-postsaccade delay: When stimuli were presented 500 ms after the saccade, the distribution was again centered around 0°, t(15) = 0.22, p = .828; a pairwise comparison confirmed that the retinotopic bias was significantly greater in the early-postsaccade than in the later-postsaccade condition, t(15) = 2.25, p = .040.
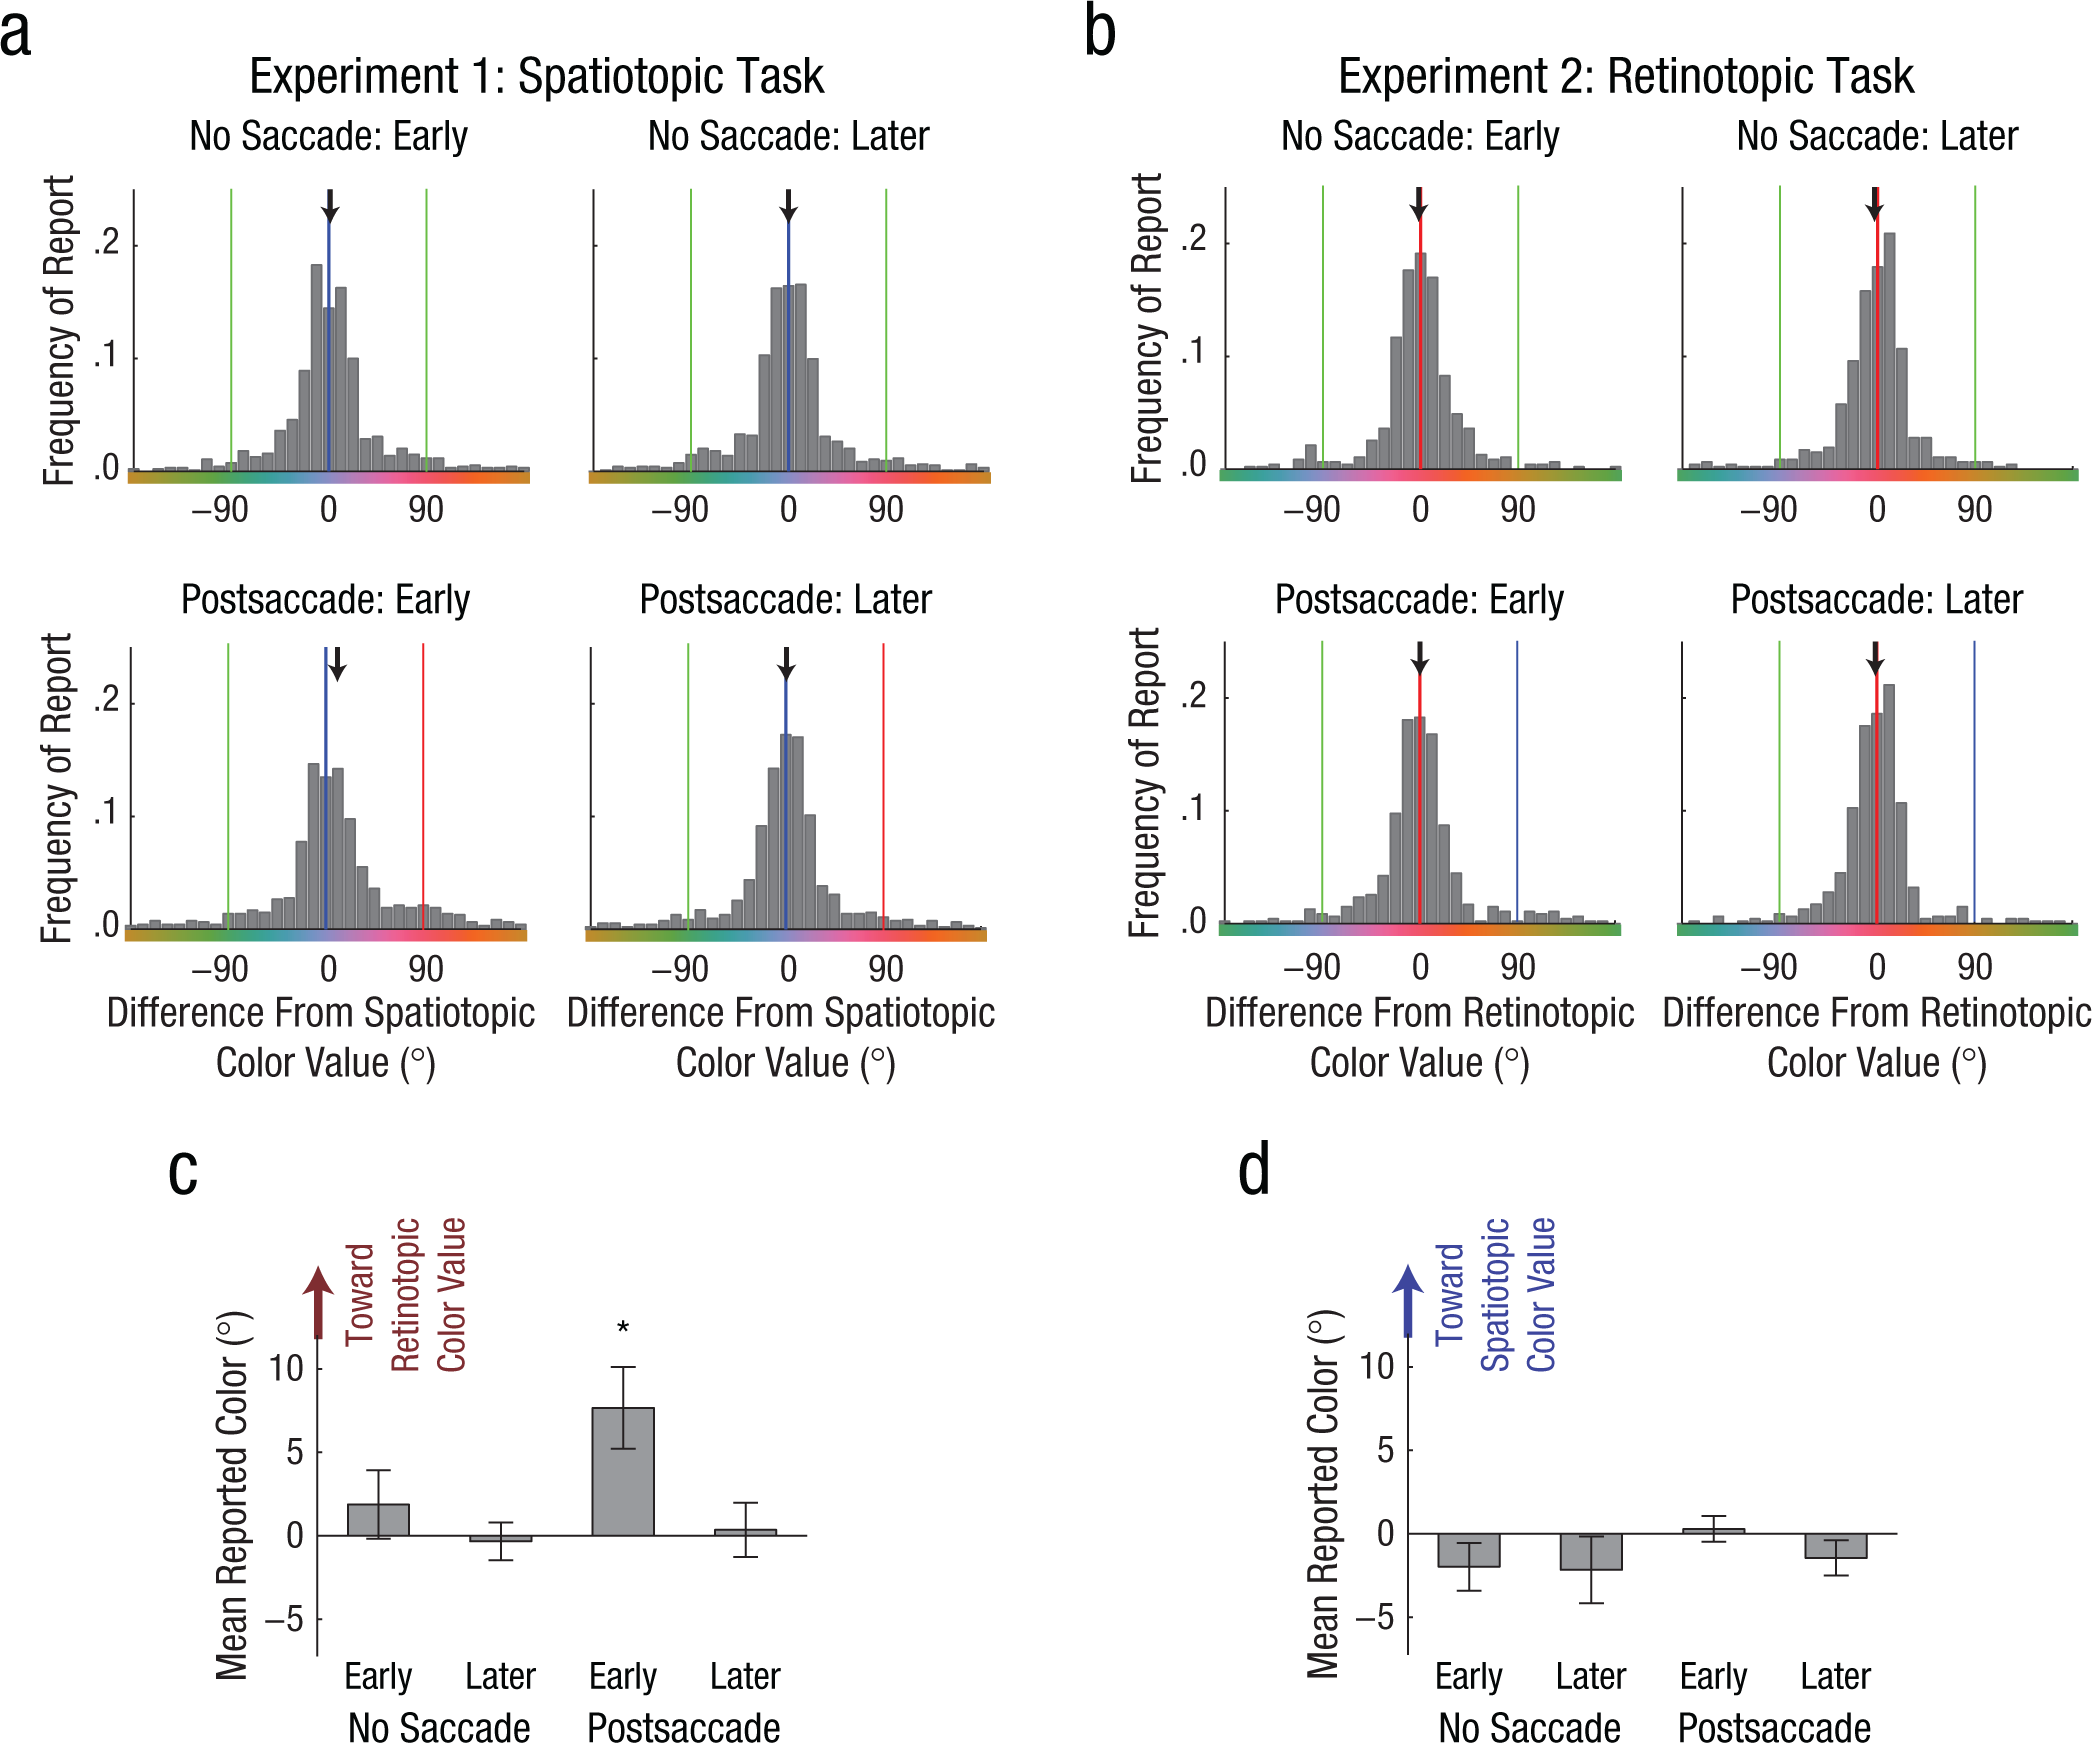
Observed data for each of the four conditions in Experiment 1 and Experiment 2. For Experiment 1 (N = 16), the histograms show frequency of report (combined across subjects) as a function of difference in color value relative to the correct spatiotopic color (a). Difference scores were calculated by aligning all trials such that the spatiotopic color was defined as 0°, and the retinotopic distractor color was +90°. For Experiment 2 (N = 9), the histograms show frequency of report (combined across subjects) as a function of difference in color value relative to the correct retinotopic color (b). Difference scores were calculated by aligning all trials such that the retinotopic color was defined as 0°, and the spatiotopic color was +90°. Note that the color strips in the histograms are for illustrative purposes only. Spatiotopic, retinotopic, and control color values are indicated in the histograms with blue, red, and green lines, respectively. The black arrows indicate the means of the distributions. In the bottom row, mean reported color (difference from correct color value) is replotted for each condition in Experiment 1 (c) and Experiment 2 (d). Error bars show ±1 SEM; the asterisk indicates a significant difference from zero (p < .05).
In Experiment 2, subjects performed the same task but reported the retinotopic color. Strikingly, there was no influence of the spatiotopic distractor on the retinotopic percept (Figs. 3b and 3d). None of the means significantly deviated from 0°; in fact, at the critical early-postsaccade delay, the mean color reported was only 0.29° different from the true retinotopic color, t(8) = 0.372, p = .720, and there was no significant difference between postsaccade conditions, t(8) = 1.19, p = .270. A between-groups comparison revealed a significant difference between the retinotopic bias in Experiment 1 and the spatiotopic bias in Experiment 2, t(17.8) = 2.87, p = .010, equal variances not assumed; linear mixed model: F(1, 23) = 4.837, p = .038.
These two experiments reveal a highly selective new form of perceptual interference: Systematic color misperception is induced following a saccade, driven only by a retinotopic distractor (equidistant control distractors do not alter the spatiotopic percept, nor do spatiotopic distractors alter the retinotopic percept), and only for a brief period of time. What is the source of this interference? To evaluate contributions of different sources of error, we fit the data with probabilistic mixture models (Fig. 4).
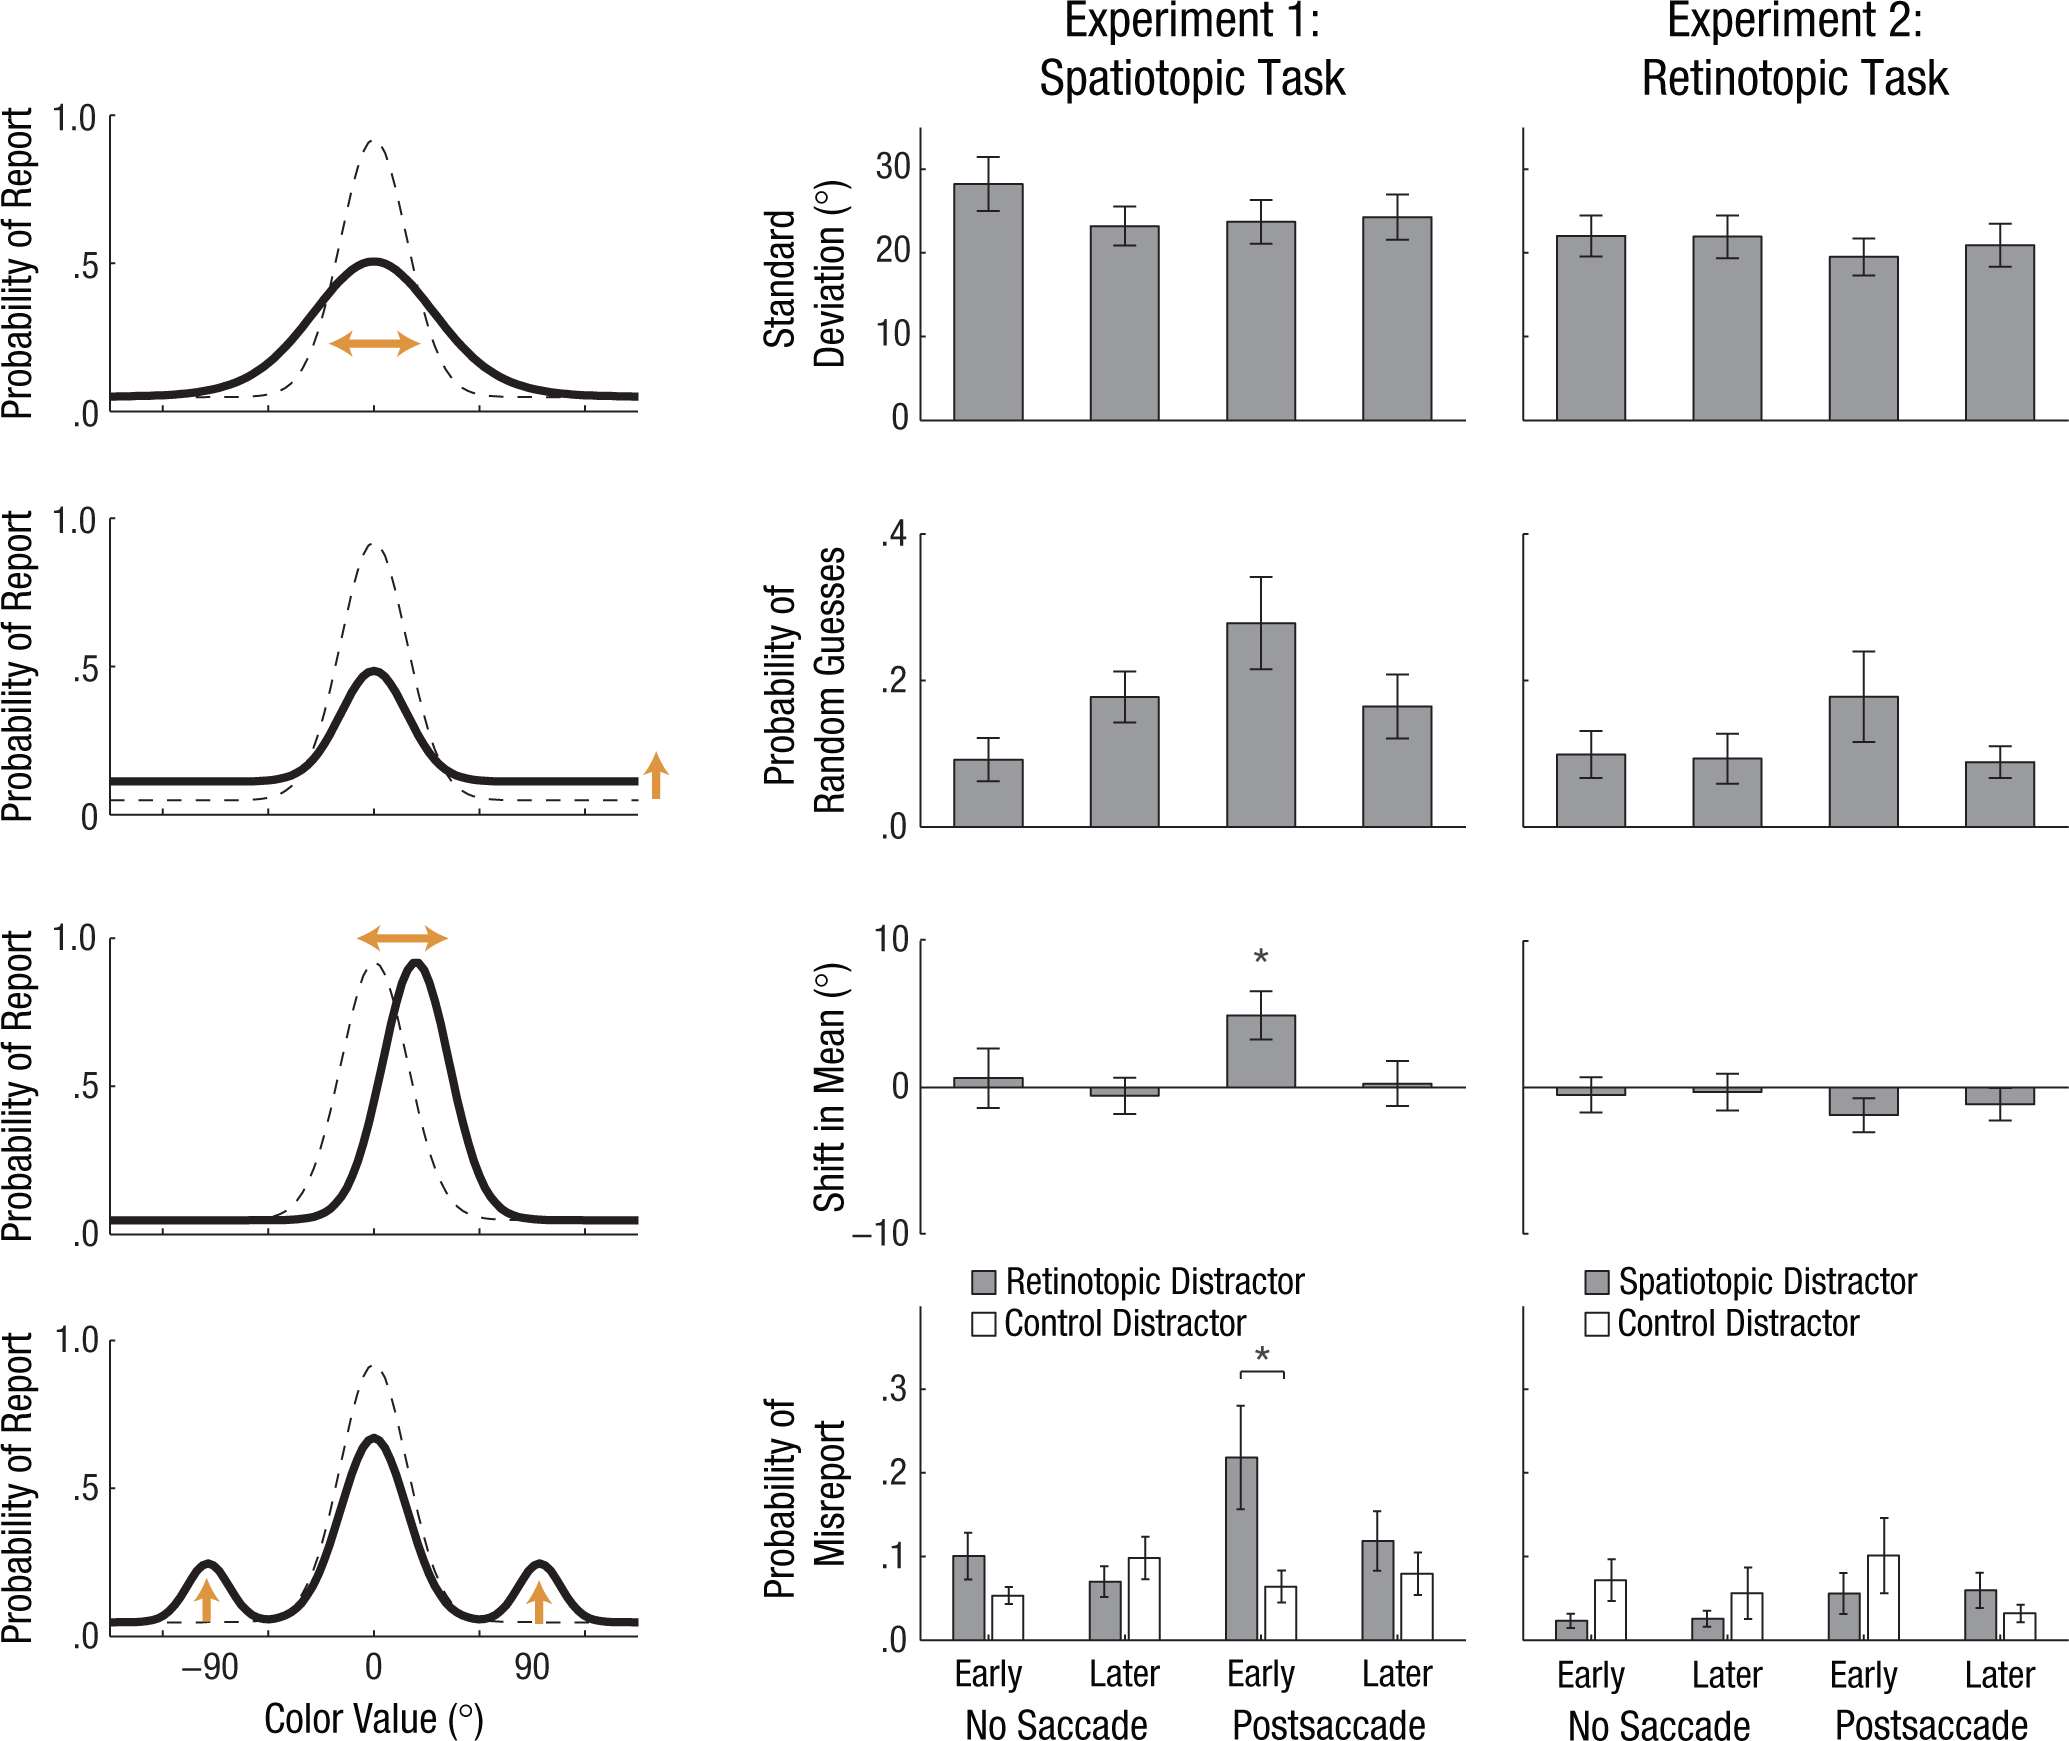
Maximum-likelihood-estimate fits of the data in Experiments 1 and 2 for different parameters of the mixture models. Each row reflects a possible error source (illustrated by the cartoon model at the left) and the corresponding best-fit parameter value for each condition (bar graphs). The top three rows show standard deviation, probability of random guesses, and shift in mean, respectively, calculated from Model A. The bottom row shows the probability of misreporting one of the adjacent distractor colors instead of the target color, calculated from Model B. In the cartoon models, the dashed lines represent a baseline no-saccade distribution, and the thick black lines depict possible ways the distribution could change after a saccade, as a result of increases in the corresponding error source. Models were fit separately for each subject, and then parameter values were averaged across subjects. Results are shown separately for Experiments 1 (N = 16) and 2 (N = 9). The asterisks indicate a significant difference from zero or between conditions (third and bottom rows, respectively; p < .05). Error bars show ±1 SEM.
A standard mixture model (Zhang & Luck, 2008) assumes that performance can be characterized as a mixture of trials in which the subject successfully perceived the stimulus (with some Gaussian deviation around the correct response, such that standard deviation reflects the resolution of the representation) and trials in which the subject randomly guessed (uniform distribution). Mixture models can also test another important source of error: the probability of misreporting (swapping) one of the distractor colors instead of the target color (Bays et al., 2009). We thus asked whether the reported retinotopic bias was driven by a shift in the mean of the Gaussian distribution or an increase in the probability of retinotopic swapping. Given the large number of free parameters in the models, we first tested each of these effects in isolation and then tested a combined model including both types of error.
In the first model (single Gaussian distribution plus guessing), standard deviation did not significantly differ across delays (ts < 1 and ps > .6 for both tasks). The probability of random guessing was slightly higher in the early-postsaccade condition in both tasks—though only significant in Experiment 1, t(15) = 2.30, p = .036; Experiment 2: t(8) = 1.28, p = .236. Critically, however, the mean of the distribution representing the “successful” trials was significantly shifted in the early-postsaccade condition of Experiment 1 in the direction of the retinotopic distractor color, t(15) = 2.97, p = .010.
In the second class of models, we estimated the probability of misreporting one of the neighboring distractors instead of the correct target color. A misreport of the retinotopic or control colors would result in additional peaks in the distribution at 90° and −90°, respectively. (Although distributions were aligned for figures and analyses with the retinotopic color set at 90°, in the actual task, the retinotopic color was equally likely to be colored 90° or −90° different from the spatiotopic color.) The probability of misreporting one of the distractor colors was relatively low in most conditions (Fig. 4); however, the probability of misreporting the retinotopic color doubled in the postsaccade early condition and was significantly greater than control misreport at this delay, t(15) = 2.35, p = .033.
Fitting the data with a combination model (Figs. 5a and 5b) revealed significant effects of both sources of retinotopic interference: The model captured the increased probability of retinotopic misreport, but even after accounting for these trials, the primary distribution was still significantly shifted toward the retinotopic color value at the early-postsaccade delay, t(15) = 2.52, p = .024. In other words, even on trials on which subjects think they are reporting the correct spatiotopic color, the retinotopic color is unconsciously bleeding into the spatiotopic percept.
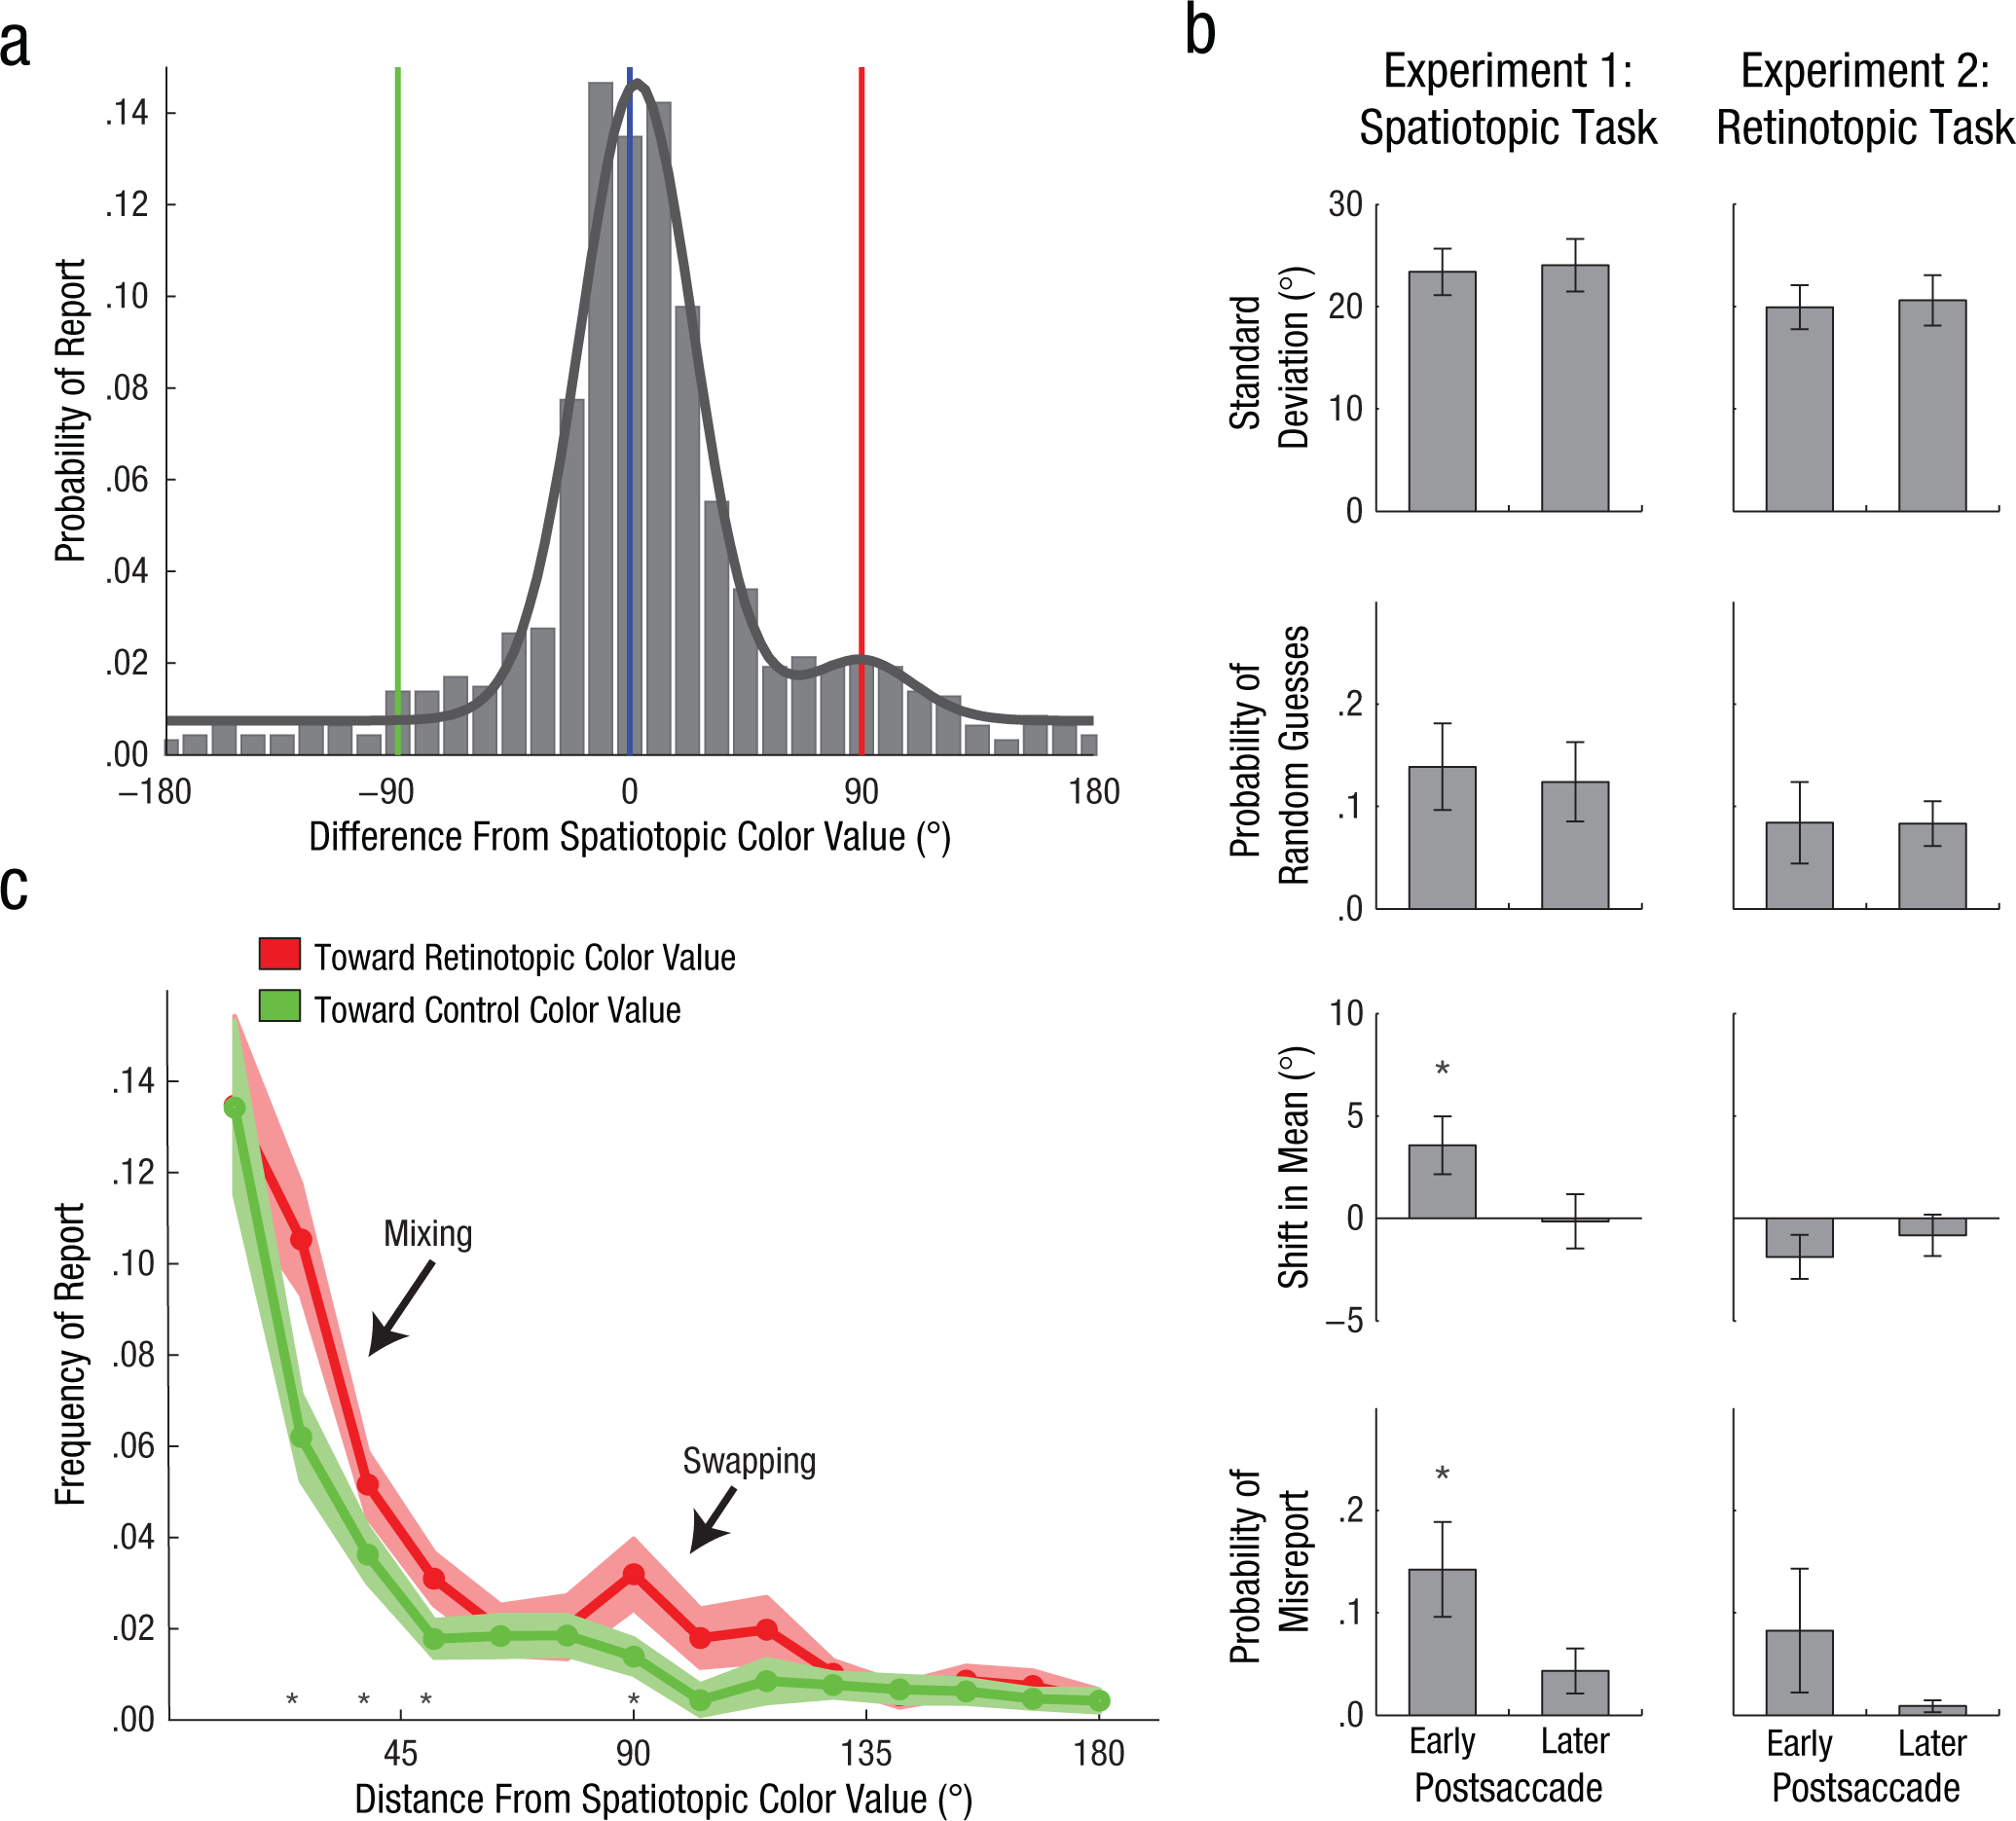
Combination model and two types of binding errors (Experiments 1 and 2). The graph in (a) shows the data from the early-postsaccade condition of Experiment 1, plotted as a histogram showing frequency of report (combined across subjects) as a function of difference in color value relative to the correct spatiotopic color. The dark gray line shows the best-fitting combination model (Model C). Spatiotopic, retinotopic, and control color values are indicated with blue, red, and green lines, respectively. The graphs in (b) show the best-fit parameter values for each source of error in Model C, for both Experiment 1 (N = 16) and Experiment 2 (N = 9). The top three rows show standard deviation, probability of random guesses, and shift in mean, and the bottom row shows the probability of misreporting the critical distractor (retinotopic distractor in the spatiotopic task and spatiotopic distractor in the retinotopic task). Parameters are shown only for the postsaccade conditions, because the misreport distribution in this model is specifically defined for the retinotopic or spatiotopic distractor (Experiments 1 and 2, respectively). The asterisks indicate a result significantly different from zero (p < .05). Error bars represent ±1 SEM. The graph in (c) presents the same data as (a) plotted in a different way, in which the two halves of the histogram are folded over one another for comparison. Raw data were binned as a function of absolute distance from the correct spatiotopic color value. The arrows highlight the two portions of the curve where the reported color is shifted more toward the retinotopic distractor color than the control color; small shifts reflect mixing and large shifts reflect swapping. The mixing and swapping errors in (c) correspond to the shift in mean and increased probability of misreport, respectively, in (b). Shaded areas indicate ±1 SEM; asterisks indicate bins in which the two curves differed significantly (p < .05).
To test the dual sources of error in a different way, we binned the raw data as a function of absolute distance from the correct spatiotopic color value (Fig. 5c). This was done to directly compare the retinotopic and control halves of the distribution. Critically, there were two distinct portions where the curves diverged. Responses in the retinotopic direction were more common than in the control direction in the bin centered at 90°, t(15) = 2.17, p = .046, which is consistent with misreport (swapping). But retinotopic influence was also significant at much smaller deviations in color space (bins centered at 26°, 39°, 51°: ts > 2.62, all ps < .02), which supports the perceptual-mixing hypothesis.
Finally, in Experiments 3 and 4, we tested whether these two sources of error are caused only by eye movements or whether they would be present in other tasks involving the shifting or splitting of attention without saccades. Experiment 3 was designed to induce shifting of spatial attention from one location to another without involving saccades. We found clear evidence for swapping errors at the early delay (Fig. 6a), with subjects more likely to erroneously report the color at the original cue location than at the equidistant control location—bins centered at 64°, 77°, and 90°: t(11) = 2.25, p = .046; t(11) = 2.79, p = .017; and t(11) = 3.14, p = .009, respectively; model fits for probability of Cue 1 versus control misreport: t(11) = 2.18, p = .052. However, we did not find evidence for mixing errors in this context, t(11) = 0.38, p = .713.
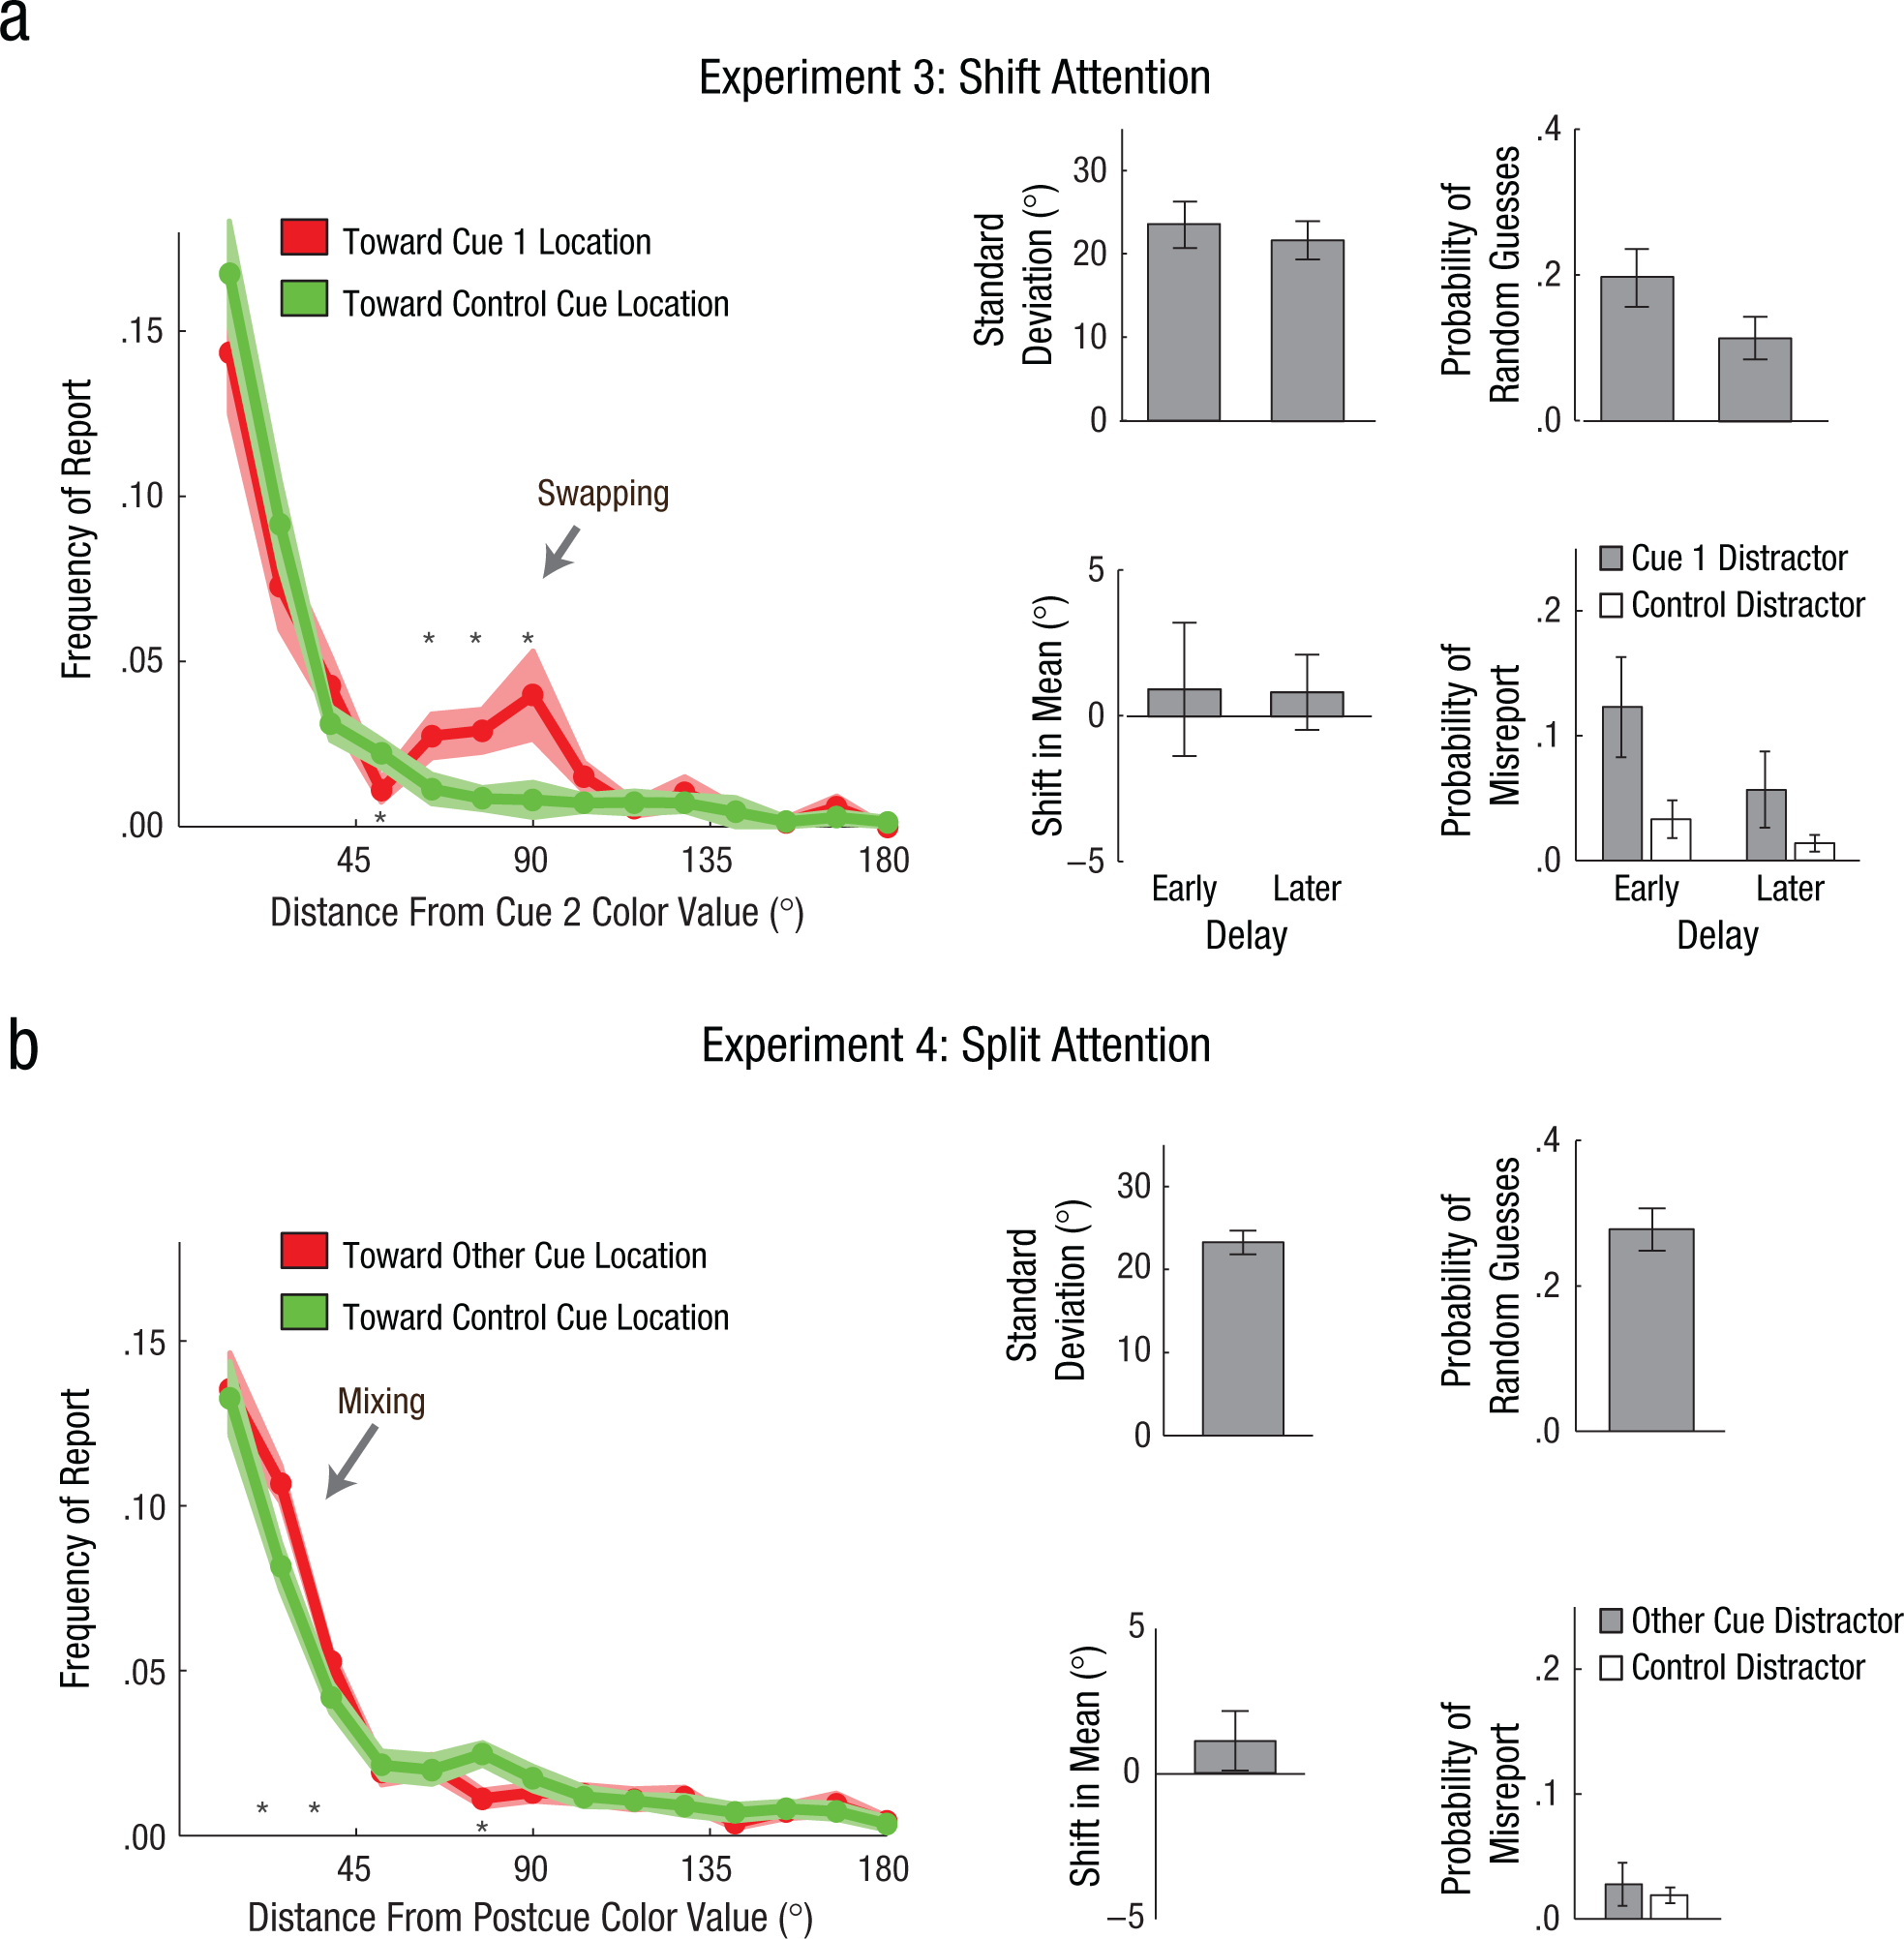
Results from Experiment 3 (a) and Experiment 4 (b). In the left panels, frequency of report is plotted as a function of absolute distance from the correct color value (Cue 2 in Experiment 3 and the postcue in Experiment 4), with the two halves of the histogram folded over one another for comparison. Red and green curves show responses that were shifted toward each of the two adjacent distractor colors in each experiment. The arrows highlight the portions of the curve where large swapping errors (Experiment 3; greater frequency of reporting the color value of Cue 1 than of the control distractor) and smaller mixing errors (Experiment 4; greater frequency of reporting a color value shifted toward the other cue than toward the control distractor) were evident. Shaded areas indicate ±1 SEM; asterisks indicate bins in which the two curves differed significantly (p < .05). For Experiment 3, only the early post-shift delay is plotted. In the right panels, bar graphs show the best-fitting parameter values for the following error sources: standard deviation, probability of random guesses, and shift in mean (all from Model A) and probabilities of misreport for each distractor (from Model B). For Experiment 3, the parameters are shown separately for each delay condition. Error bars show ±1 SEM. Experiment 3: N = 18; Experiment 4: N = 12.
In contrast, in Experiment 4, when attention had to be shared between two locations, the pattern of responses was consistent only with mixing errors (Fig. 6b), with subjects more likely to make subtle errors in the direction of the other cued color than the direction of the control color—bins centered at 26° and 39°: t(17) = 3.05, p = .007, and t(17) = 2.15, p = .046, respectively; mean of combination model distribution shifted toward other cued color: t(17) = 2.31, p = .034. Swapping errors were not seen in this context—probability of misreport for other cue versus control: t(17) = 0.54, p = .594. A significant between-groups interaction with Experiment (3, 4) × Tail (other cue, control) × Bin (1–14) confirmed the difference in error patterns in the shifting versus splitting contexts, F(4.2, 116.8) = 3.79, p = .005 (equal variances not assumed).
Discussion
This article documents a new perceptual and attentional phenomenon: the systematic distortion of color perception caused by residual retinotopic interference. Our primary goal was to better understand how attention remaps across saccades and whether this process affects feature binding. We discovered a pattern of binding errors—a systematic bias—that not only carries important implications for stability across saccades but also sheds light on attentional mechanisms in general.
The distortion we found after a saccade was highly spatially and temporally specific. It occurred only for a brief period after each eye movement, temporally overlapping with the “retinotopic attentional trace” (Golomb et al., 2008; Golomb et al., 2010). It was driven by the presence of a distractor color in the retinotopic—but not equidistant control—location. And finally, it was asymmetric: The spatiotopic task was susceptible to retinotopic interference, but not vice versa, which is particularly notable given that spatiotopic coordinates are the more ecologically relevant and intuitive coordinate system.
Critically, this perceptual distortion arose from two distinct types of errors: a swapping of features (Treisman & Schmidt, 1982), and a mixing, or blending, in feature space between features from two different locations. Perceptual blending has been reported in other contexts; for example, an object’s features may be biased by or averaged with the features of other objects in the display or in memory (Brady & Alvarez, 2011; Hsieh & Tse, 2009; Huang & Sekuler, 2010). However, here it is particularly notable how specific—and distinct from swapping—the mixing is. Our additional experiments conducted without saccades suggest that these two types of errors stem from different attentional mechanisms. Swapping errors were found when subjects shifted the locus of attention from one location to another and misreported the color at the previous location, as if attention had not had time to update on those trials. Mixing errors, by contrast, were found when subjects simultaneously attended to two locations (but were tested only on one). These data suggest that swapping errors stem from incomplete updating, whereas mixing errors occur when two locations simultaneously share attentional resources.
This set of findings has potential implications for attentional updating in a wide range of contexts, as future studies may explore more fully. In terms of remapping of attention across saccades, it follows from the retinotopic attentional trace that delayed spatial updating could cause feature errors after a saccade, but we could not predict whether these errors would be swapping or mixing. The fact that both types of feature errors occur immediately following a saccade indicates that not only does attention take time to update following each saccade, but also—crucially—at some point during the remapping process, attention is simultaneously selecting two different locations. (Moreover, unlike the attention shifting and splitting contexts, in the saccade context, subjects were not explicitly attending to two different locations; the task was to maintain attention at a single spatiotopic location, which makes the binding errors even more remarkable.)
These data support the hypothesis that the remapping of attention entails two temporally overlapping stages: updating to the spatiotopic location and disengaging from the previous retinotopic location. We have previously raised the idea of a two-stage remapping process; for example, based on evidence that there is a point in time when both retinotopic and spatiotopic locations are facilitated, but not the locations in between (Golomb et al., 2011). However, these prior results could be caused by two independent processes or phases (i.e., a “turning on” of the new location that occurs before the “turning off” of the previous location) or by a single-stage remapping process that occurs with variable latency (such that on some trials, attention has already updated to the spatiotopic location, and on others, it is still stuck at the retinotopic location). If the latter were true, then in the current study, we should expect a mixture of fast remapping trials, in which subjects would correctly report the color at the spatiotopic location (within some normally distributed variance), and slower remapping trials, in which swapping errors would result from attention being still stuck at the retinotopic location. In other words, in a one-stage model, on any given trial, attention should be either still stuck at the retinotopic location or already updated to the spatiotopic location, but not both. The existence of mixing errors suggests that there is a period of time when both locations are still active. Thus, even after spatial pointers have been updated to the correct spatiotopic location, lingering facilitation at the retinotopic location means that retinotopic distractors can continue to interfere with perception.
These data converge to paint a picture in which retinotopic representations are the “native language” of the visual system, and although spatial pointers or receptive fields can shift to the updated location in anticipation of a saccade (Cavanagh et al., 2010; Duhamel et al., 1992; Rolfs et al., 2011), lingering processing at the previously attended retinotopic location can carry costs for stability even after the saccade is completed. A system in which retinotopic representations serve as the default but can be converted into other reference frames on demand allows for flexible and neurally efficient representations (Cohen & Andersen, 2002), but it can also carry costs for behavior, such as a loss of spatial precision with each update (Golomb & Kanwisher, 2012b). The current study reveals that these potential costs are not limited to the encoding of spatial locations but affect the binding of features to those locations, as features from two different locations may be simultaneously bound to the same object.
The ability to maintain or remap spatial attention is an important aspect of visual stability, and our study provides a striking example of how the perceptual world is not nearly as stable as it feels. Understanding the mechanisms—and errors—of attention across eye movements is crucial, as saccades are arguably the most frequent shifts of attention made during daily life (2–3 per second). Crucially, it is not just location information that is disrupted by a saccade; object features can also be distorted, and these distortions can reflect something more complicated than simple location swapping. Such perceptual instabilities could have important consequences for real-world visual processing, when multiple objects are often simultaneously present in the environment.
Footnotes
Acknowledgements
We thank Colin Kupitz and Carina Thiemann for data-collection assistance; Aude Oliva for use of the eye tracker in Experiments 1 and 2; and Timothy Brady, Talia Konkle, Andrew Leber, and Ed Vul for helpful discussion.
Declaration of Conflicting Interests
The authors declared that they had no conflicts of interest with respect to their authorship or the publication of this article.
Funding
This study was funded by National Institutes of Health Grants R01-EY13455 (to N. Kanwisher) and F32-EY020157 (to J. D. Golomb).

References
Supplementary Material
Please find the following supplemental material available below.
For Open Access articles published under a Creative Commons License, all supplemental material carries the same license as the article it is associated with.
For non-Open Access articles published, all supplemental material carries a non-exclusive license, and permission requests for re-use of supplemental material or any part of supplemental material shall be sent directly to the copyright owner as specified in the copyright notice associated with the article.
