
Abstract
Lubinski, D., Benbow, C. P., & Kell, H. J. (2014). Life paths and accomplishments of
mathematically precocious males and females four decades later. Psychological
Science, 25, 2217–2232. (Original DOI:
In Figure 2a in this article, the x-axis label “Top-Centile Cutoff” should be “Top-Decile Cutoff,” and in Figures 2b and 2c, the x-axis label “Top-Centile Median” should be “Top-Decile Median.” That is, the cutoffs and medians graphed were computed for the top 10% of participants, not the top 1%. The legend for Figure 2 also incorrectly referred to the “top centile” instead of the “top decile” in two places. The corrected figure and legend are printed below.
The error also appeared three times in the text where the figure was discussed. The second sentence of the second paragraph of the Income section should have said, “Figure 2a displays median annual incomes and the cutoffs for the top quartile and top decile of annual incomes for married and unmarried men and women in each cohort.” The second sentence of the following paragraph should have read, “Figures 2b (Cohort 1) and 2c (Cohort 2) display median incomes of all married participants by sex, along with median incomes for the top quartile and top decile of the married participants; the graphs also show the corresponding median incomes of participants’ spouses.” And the last sentence of that paragraph should have said, “Similarly, to the extent that female participants earned more (i.e., top quartile and top decile), the likelihood that their spouses earned less than they did increased, and the income difference between them and their spouses became more pronounced as well; this difference achieved significance in Cohort 1, zs ≥ 3.83, ps < .001, but not in Cohort 2, because of small sample sizes for women, z = 1.39 (see Table S5).”
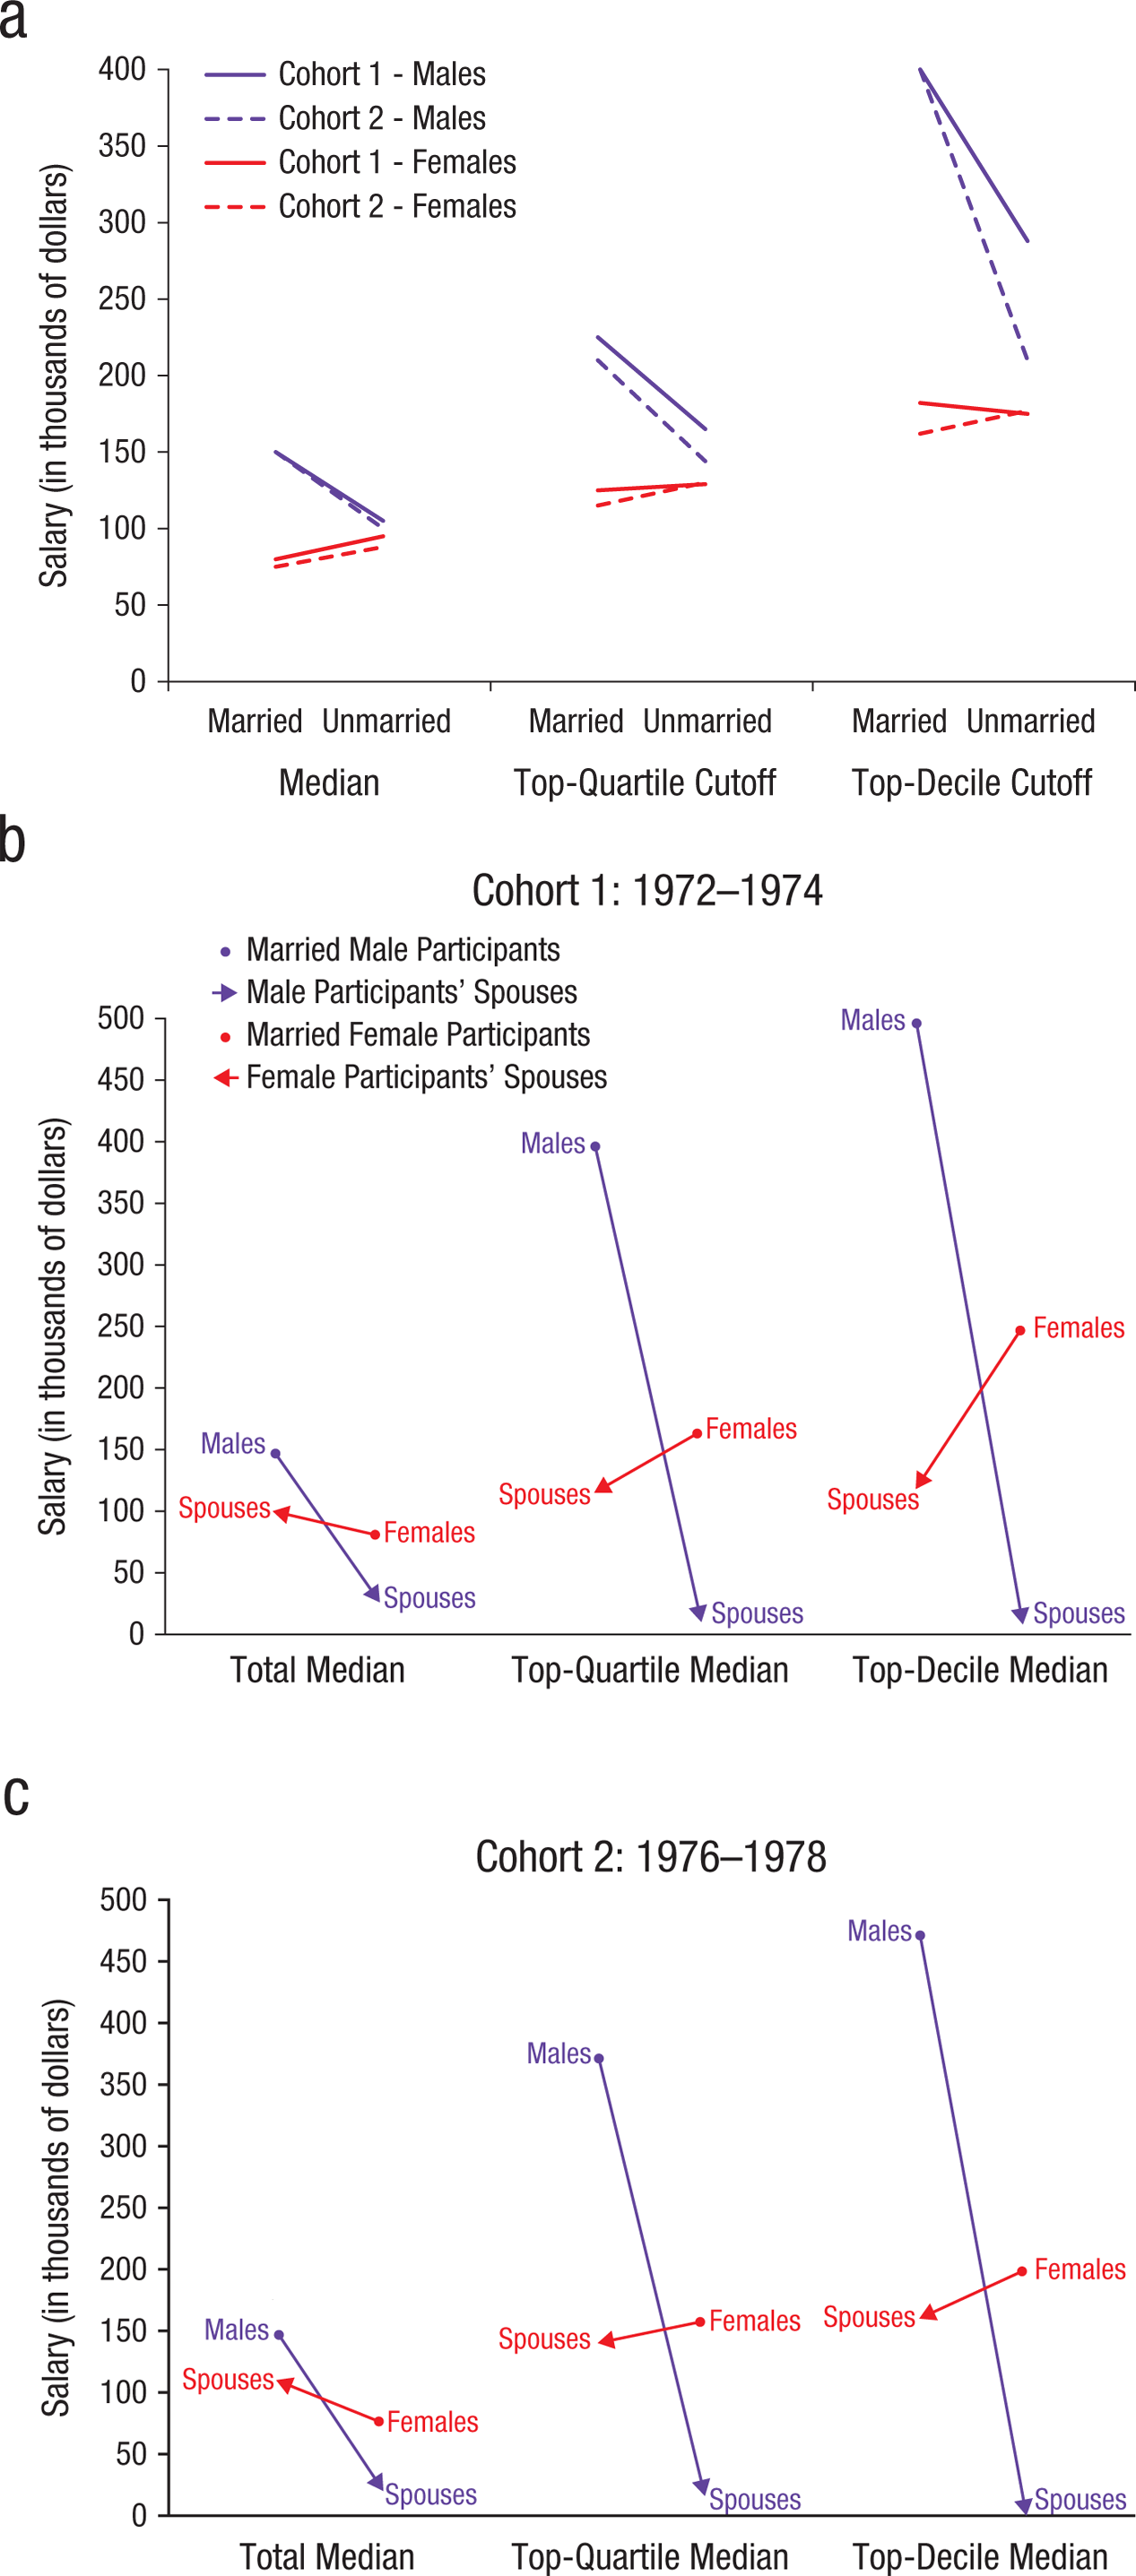
Annual incomes of participants and their spouses. The graph in (a) shows median annual incomes and the cutoffs for the top quartile and top decile of annual incomes for married and unmarried male and female participants in Cohorts 1 and 2 (Cohort 1: ns = 521 married males, 318 married females, 114 unmarried males, and 105 unmarried females; Cohort 2: ns = 249 married males, 111 married females, 58 unmarried males, and 38 unmarried females). Note that in 2013, the median annual incomes of males and females (ages 45–54 years) in the United States were, respectively, $43,000 and $25,000 (U.S. Census Bureau, 2014a). The graphs in (b) and (c) present median, top-quartile median, and top-decile median incomes for married male and female participants in Cohorts 1 and 2 and their spouses (total ns: 517 males and 318 females in Cohort 1, 249 males and 111 females in Cohort 2).