
Abstract
Vision in the fovea, the center of the visual field, is much more accurate and detailed than vision in the periphery. This is not in line with the rich phenomenology of peripheral vision. Here, we investigated a visual illusion that shows that detailed peripheral visual experience is partially based on a reconstruction of reality. Participants fixated on the center of a visual display in which central stimuli differed from peripheral stimuli. Over time, participants perceived that the peripheral stimuli changed to match the central stimuli, so that the display seemed uniform. We showed that a wide range of visual features, including shape, orientation, motion, luminance, pattern, and identity, are susceptible to this uniformity illusion. We argue that the uniformity illusion is the result of a reconstruction of sparse visual information (from the periphery) based on more readily available detailed visual information (from the fovea), which gives rise to a rich, but illusory, experience of peripheral vision.
Vision in the fovea, the center of the visual field, is accurate and detailed. In the periphery, however, visual resolution and color sensitivity are limited (Anderson, Mullen, & Hess, 1991; Westheimer, 1982). Retinal output to the cortex for stimuli in the periphery has limited spatial resolution and color information. This makes it more difficult to identify pictures (Thorpe, Gegenfurtner, Fabre-Thorpe, & Bulthoff, 2001) or read words (Rayner & Bertera, 1979) presented in the periphery. Introspectively, vision seems rich and detailed for most of the visual field (Block, 2007, 2011; Lamme, 2006; Rahnev et al., 2011). How can this seemingly rich visual experience result from limited retinal output? Perhaps people’s actual experience is rich and detailed because the brain supplements the details and richness when bottom-up input is poor.
Here, we investigated a series of novel visual illusions. This new class of illusions supports the idea that rich visual experience is reconstructed by the brain. The illusion appears when viewers are presented with a display that contains different but related central and peripheral stimuli (see Fig. 1 for two examples; four additional examples of the uniformity illusion with different stimuli are presented in the appendix). The peripheral stimuli are perceived to assume the features of the central stimuli. This transition of perceptual content can take several seconds, which gives rise to a shift in the perceived properties of the peripheral stimuli. In Figure 1, the peripheral stimuli are the same in both images. Yet when viewers keep their eyes focused on the center for a few seconds, the peripheral stimuli take on the identity of the central stimuli, turning to hexagons in Figure 1a or circles in Figure 1b.
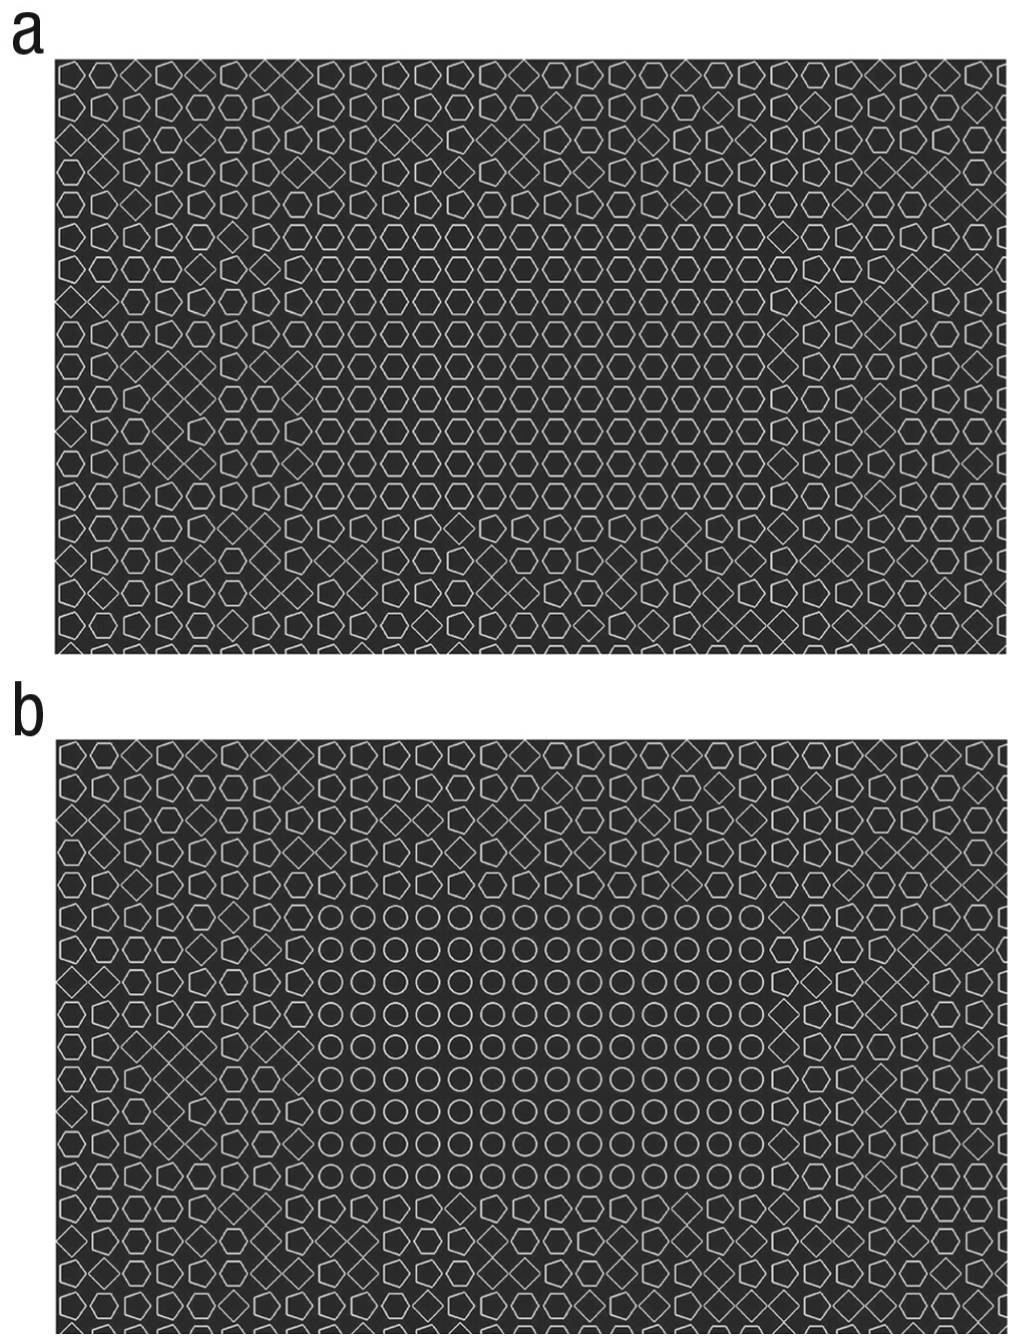
Two examples of a display that can evoke a uniformity illusion. The central stimuli are (a) hexagons or (b) circles, and the peripheral stimuli in both cases are other shapes arranged in a random order. When the central stimuli are viewed from close range so that the display fills the visual field, observers typically report that the peripheral stimuli assume the shape of the central stimuli. (For a variety of examples featuring characteristics other than shape, see www.uniformillusion.com.)
It seems that almost anyone who views the displays will experience a uniformity illusion. In addition to presenting this subjectively experienceable illusion, we conducted eight experiments that had four goals. The first goal was to illustrate that the illusion consistently arises for a wide range of stimuli. Participants were shown displays in which the characteristics of the center and the periphery differed in terms of shape, pattern, luminance, orientation, shade, identity, or motion, and participants were asked to indicate when the display appeared uniform (Experiments 1–7). To test whether participants were able to correctly identify changes, we also included change trials, in which the display physically became uniform. The second goal was to quantify the basic properties of the illusion: how often it occurs and how long it takes to arise. Baseline speed and accuracy was assessed in Experiments 6 and 7 using trials in which the center and the periphery were identical from the start of the trial. The third goal was to explore one important parameter that appears to influence the illusion, namely the amount of similarity (or dissimilarity) between the stimuli in the central patch and in the periphery. In Experiments 1 through 7, there was either a small or large difference between stimuli in the central patch and periphery, which allowed us to explore the effect of similarity on the occurrence and timing of the illusion. Finally, Experiment 8 addressed whether the subjective experience of the illusory uniformity shift was similar to the subjective experience of a physical uniformity shift. To this end, we focused on metacognition.
Method
Participants
We recruited 20 participants, all of whom were naive to the purpose of the experiments. Participants 1 to 12 (average age = 28.5 years; 8 females, 4 males) completed Experiments 1, 4, and 5. Participants 1 to 11 (average age = 27.3 years; 8 females, 3 males) completed Experiments 2 and 3. Participants 11 to 15 and 17 to 19 (average age = 31.6 years; 4 females, 4 males) completed Experiment 6. Participants 11 to 20 (average age = 34.2 years; 5 females, 4 males) completed Experiment 7, and Participants 11 to 15 and 17 to 20 (average age = 31.7 years; 5 females, 4 males) completed Experiment 8. All participants had normal or corrected-to-normal vision. All experiments were approved by the ethics committee of the University of Sussex. Informed consent was obtained from all participants before the experiments began. Our aim was to include around 10 participants in each experiment (see Bonneh, Cooperman, & Sagi, 2001). Sample size varied slightly per experiment because some individuals were willing to participate for longer periods of time, completing more experiments, while other individuals completed only one or a few experiments.
Procedure
General
In all experiments, participants were seated in a darkened room, with their chin on a chin rest, at a distance of 63 cm from a 21.5-in. LED screen (height: 26.8 cm, width: 47.6 cm). During trials, they were instructed to fixate on a central spot and to avoid blinking. Throughout the experiment, their eye movements were tracked with an EyeLink 2000 eye tracker (SR Research, Mississauga, Ontario, Canada). If participants moved their eyes away from the fixation spot (threshold for a saccade was set at 108°/s) or blinked, the trial was aborted and replaced by a similar trial (with the same conditions as on the aborted trial) to ensure the same amount of trials per condition.
Experiments 1 through 5
Each trial in the first five experiments started with a fixation point presented for 1.5 s. Then the central patch was presented, and the periphery faded in (which took approximately 2 s). After the periphery was completely faded in, the entire screen remained visible either for 10 s or until the participant indicated perceptual uniformity (see Fig. 2). Participants were instructed to click with the mouse as soon as the entire screen appeared to be uniform but to not do anything when the central patch and the peripheral patch appeared to be different. For each experiment, participants were explicitly instructed what the response and no-response conditions entailed (e.g., click only when the orientation of the line segments on the screen are all the same; do not click when there are line segments with deviating orientation). Each experiment had a different type of stimulus array; the defining characteristic of the central stimulus, and thus the illusory percept, depended on shape (Experiment 1), orientation (Experiment 2), luminance (Experiment 3), shade (Experiment 4), or motion (Experiment 5). Figure 3 shows example displays from Experiments 1 through 5. Tables 1 and 2 specify the characteristics of the stimuli and background in each experiment.
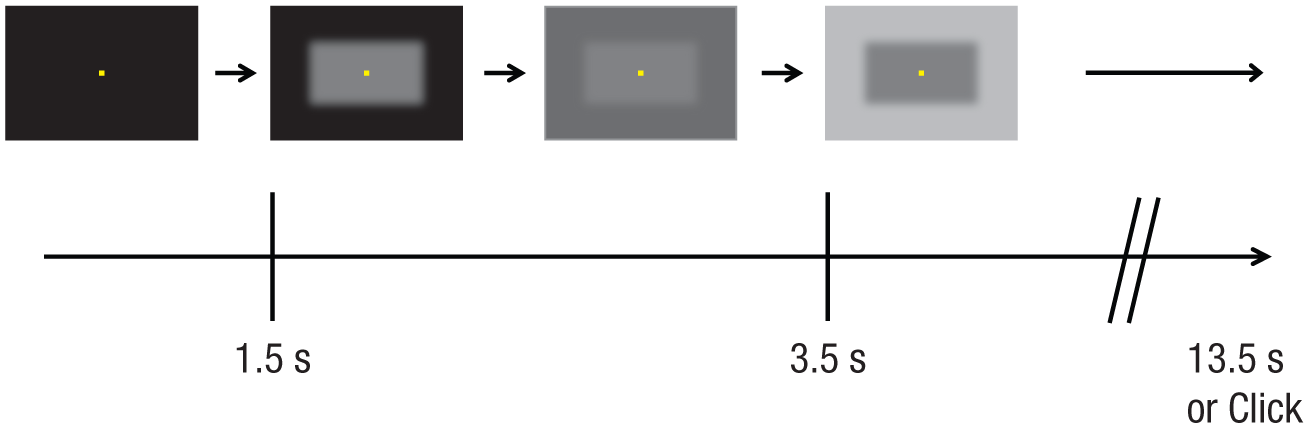
Illustration of a no-change trial sequence in a uniformity experiment. Trials began with a fixation display, after which the central patch appeared at full strength while the periphery faded in across the following 2 s. The entire display remained visible for 10 s or until the participant clicked to indicate that he or she thought the entire display was uniform. This trial sequence was the same in Experiments 1 through 7; the stimuli in this example are from Experiment 3 (luminance).
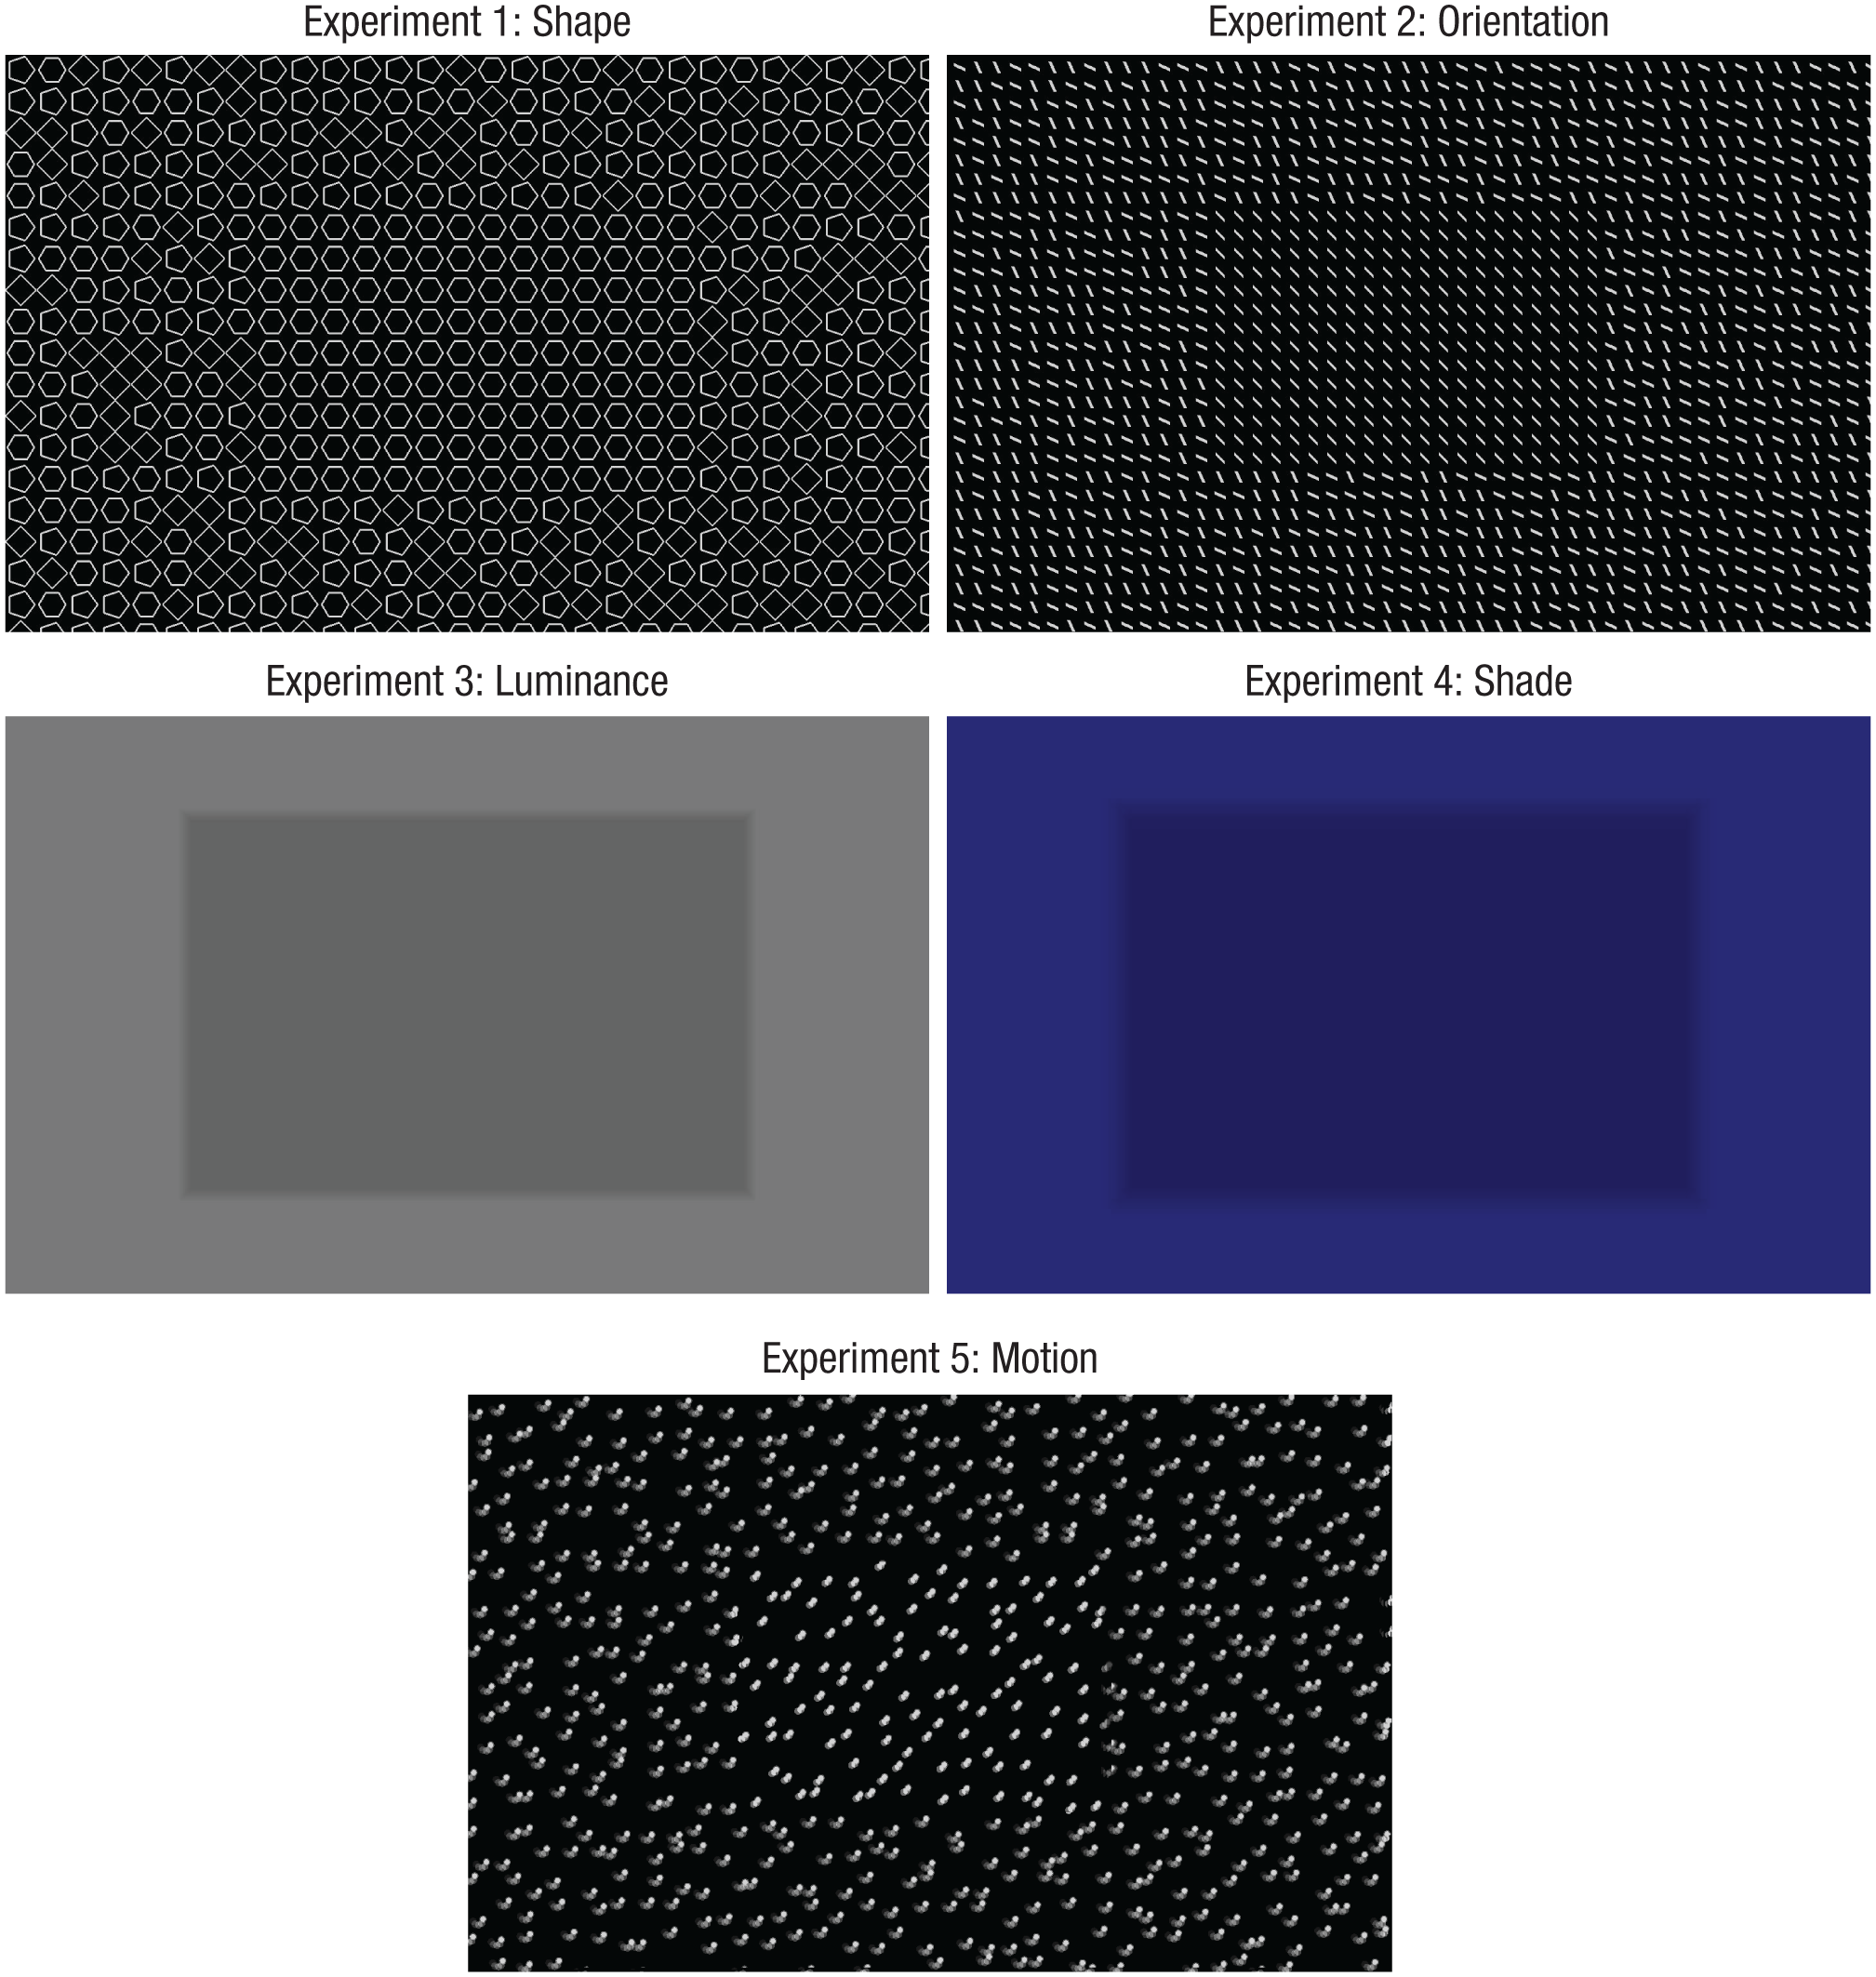
Sample stimulus displays used in Experiments 1 through 5.
Stimulus and Background Characteristics in Experiments 1 Through 7
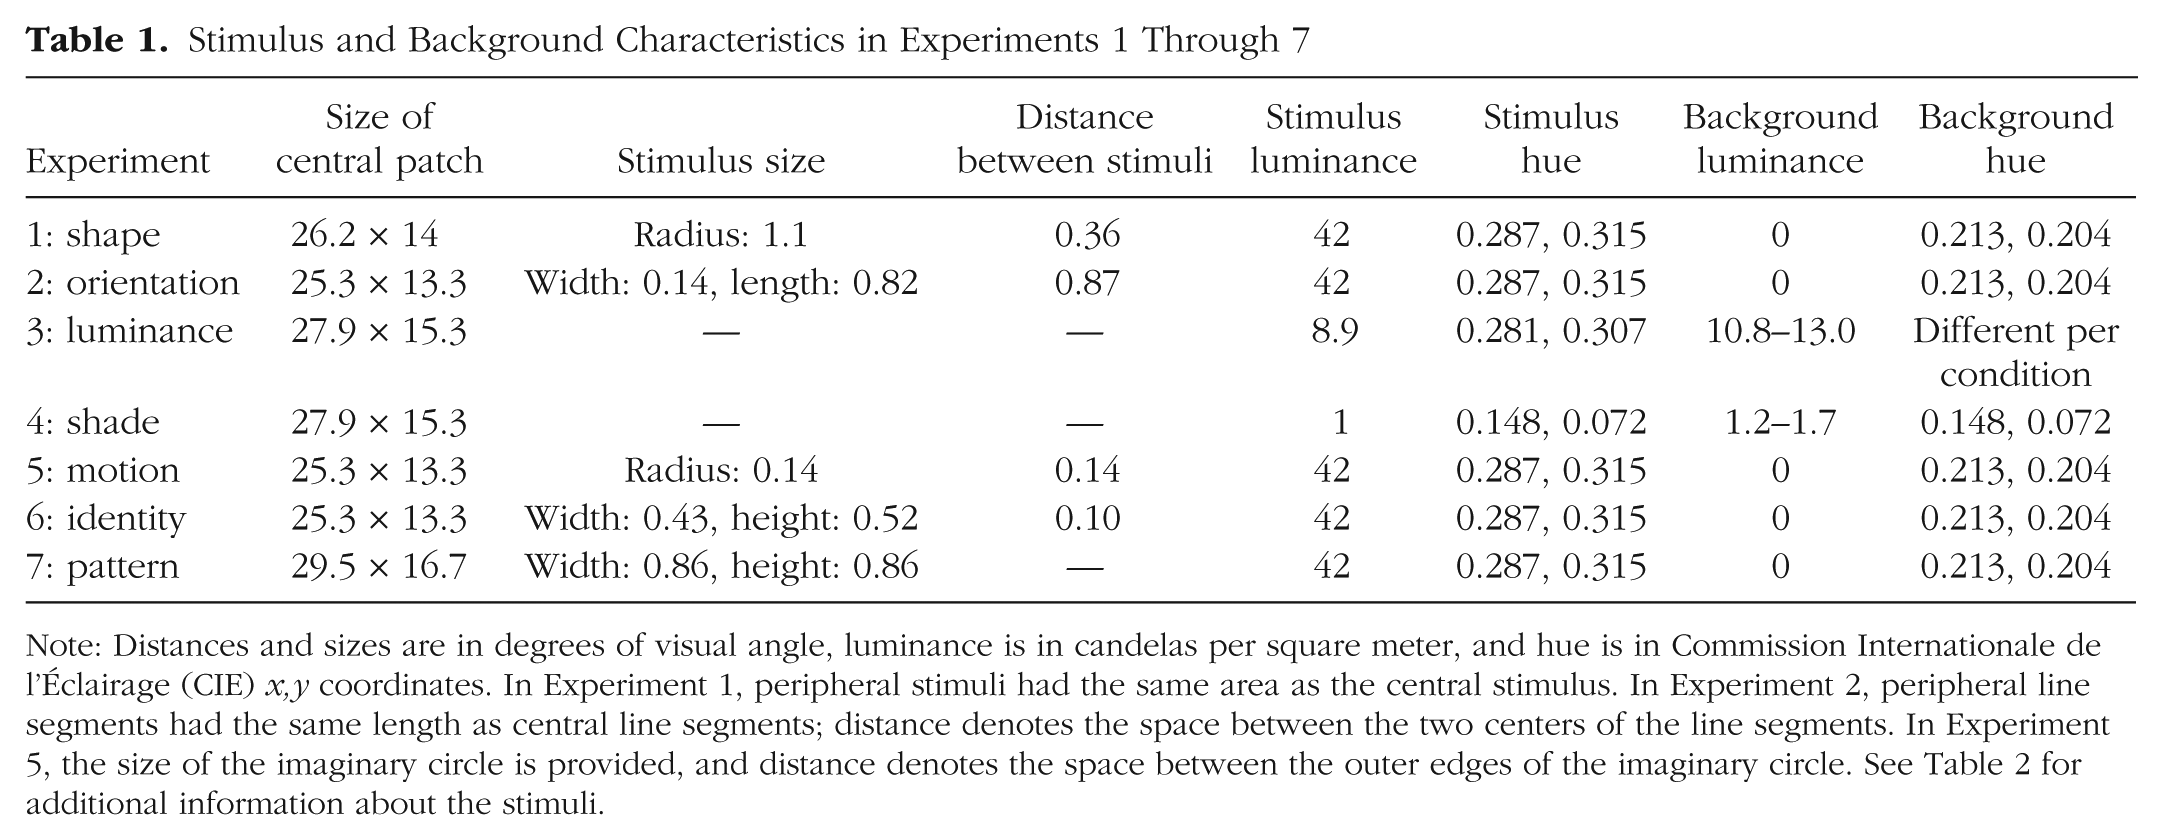
Note: Distances and sizes are in degrees of visual angle, luminance is in candelas per square meter, and hue is in Commission Internationale de l’Éclairage (CIE) x,y coordinates. In Experiment 1, peripheral stimuli had the same area as the central stimulus. In Experiment 2, peripheral line segments had the same length as central line segments; distance denotes the space between the two centers of the line segments. In Experiment 5, the size of the imaginary circle is provided, and distance denotes the space between the outer edges of the imaginary circle. See Table 2 for additional information about the stimuli.
Differences Between the Central and Peripheral Stimuli in Experiments 1 Through 7
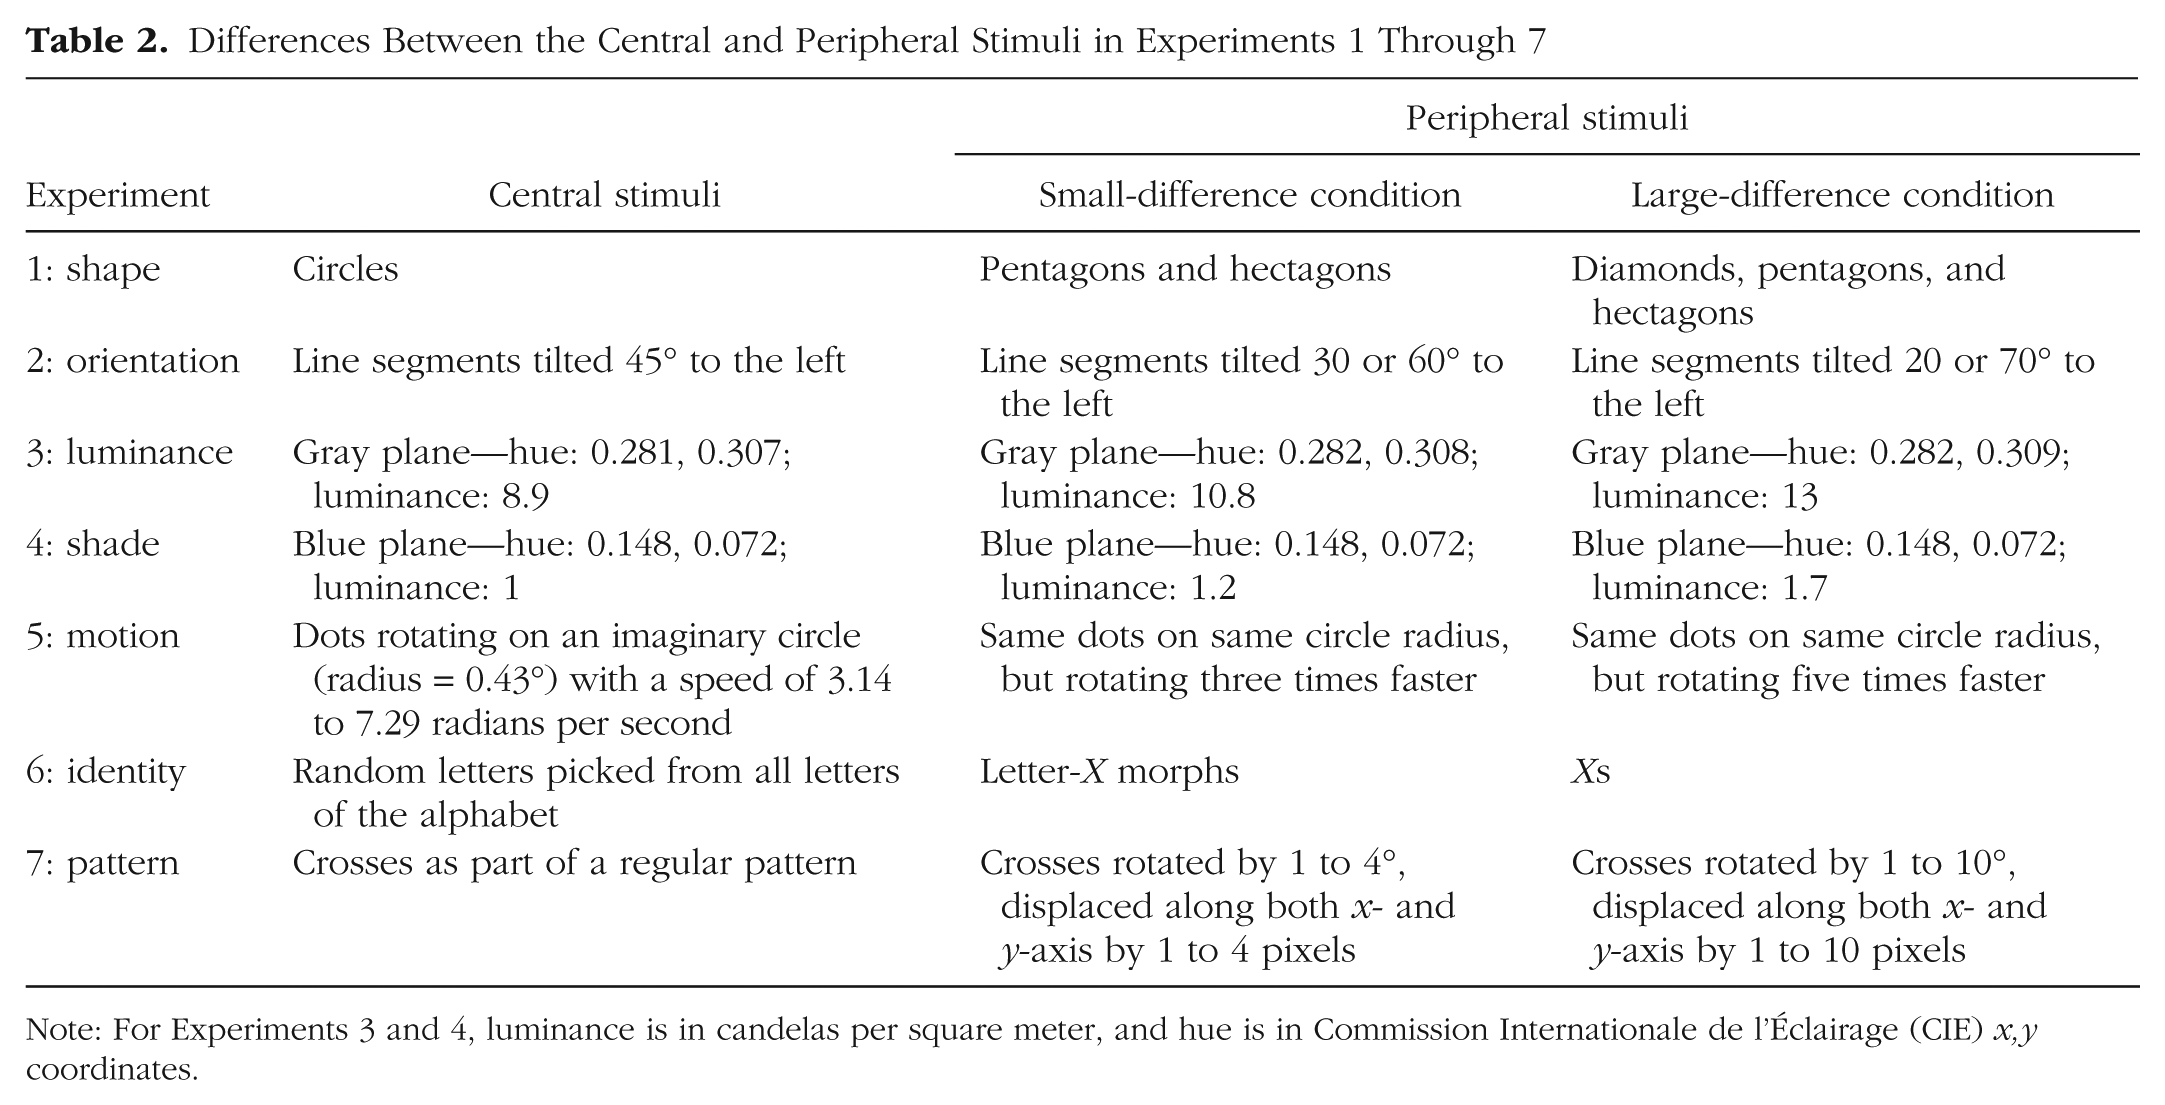
Note: For Experiments 3 and 4, luminance is in candelas per square meter, and hue is in Commission Internationale de l’Éclairage (CIE) x,y coordinates.
There were two trial types: (a) no-change trials, in which the peripheral area remained dissimilar from the central patch for the duration of the trial, and (b) change trials, in which we mimicked the experience of the uniformity illusion by slowly changing the peripheral area to match the actual characteristics of the center patch. This change would start at a randomly chosen moment between 2 and 3 s after fade in of the periphery was completed and would maximally take 6 s. Change trials were included to test whether participants were able to accurately respond to physical shifts to uniformity.
Because it was possible that participants would notice slight movements in the periphery during change trials in Experiments 1 and 2, we presented “blips” after fade in of the periphery every 250 ms for 6 s. A blip consisted of a blank screen presented for 16 ms. On change trials, actual changes to peripheral stimuli would always coincide with a blip to prevent participants from noticing these movements. For instance, when a line segment changes its orientation without blips, motion is detectable. Consequently, if the stimuli were presented without blips, there would be a difference between no-change trials (in which there is no perceivable motion of the stimuli) and change trials (in which there would be perceivable motion of the stimuli). By introducing the blips, all trial types were equated with regard to perceivable motion.
For both change and no-change trials, there was either a small difference or a large difference between the central and peripheral patches. How we defined small and large differences between the center and the periphery varied per task (the corresponding stimulus characteristics are specified in Table 2). There were four illusion conditions: 20 small-difference/no-change trials, 20 large-difference/no-change trials, 10 small-difference/change trials, and 10 large-difference/change trials. These 60 trials were presented in three blocks of 20 trials each. Each experiment lasted approximately 25 min.
Finally, in Experiments 3 (luminance) and 4 (color), the boundary between foreground and background plane was “soft,” in the sense that there was a small area (with a width of approximately 0.3° of visual angle) on all sides of the central plane between the center and periphery that linearly transitioned from foreground color or luminance to background color or luminance.
Experiments 6 and 7
Experiments 6 and 7 (identity and pattern uniformity; see Fig. 4 and Tables 1 and 2) had the same four illusion conditions as Experiments 1 through 5 plus an additional trial condition in which there was no difference between the central patch and the peripheral area from the start of the trial. These no-difference trials allowed us to quantify the ability to detect uniformity and the time it takes to respond to (physical) uniformity, to function as a baseline for the illusion conditions. The 20 trials of each condition were randomly distributed throughout the experiment. These 100 trials (40 of which contained no real uniformity at any moment during the trial) were presented in five blocks of 20 trials each, preceded by a 20-trial practice block (these trials were not included in the analysis). Blips were introduced in these experiments in the same manner as in Experiments 1 and 2. Each experiment lasted approximately 50 min.
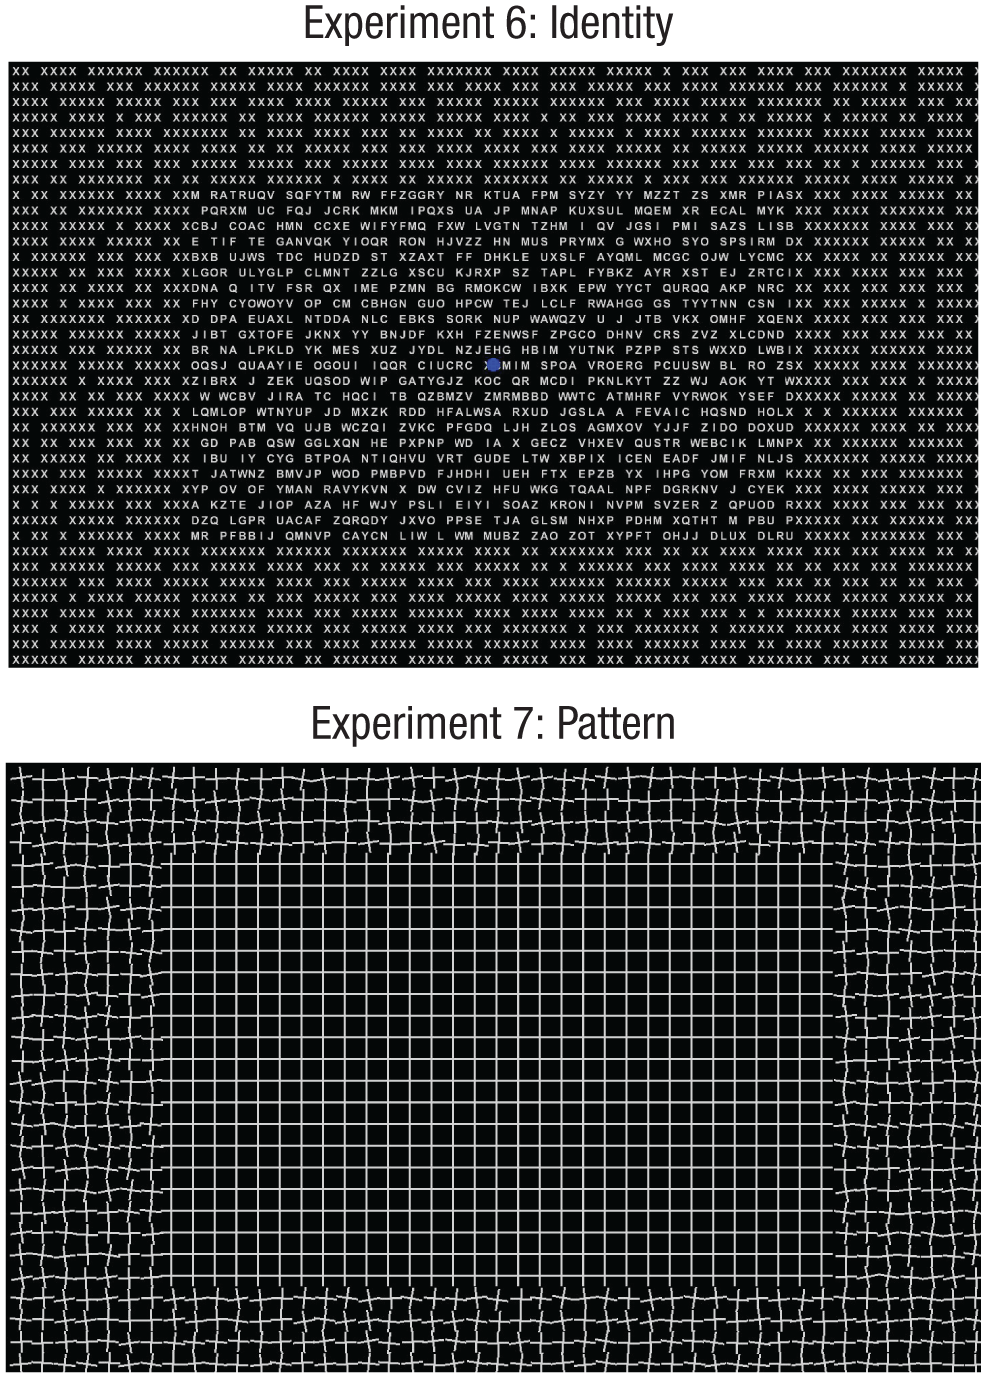
Sample stimulus displays used in Experiments 6 and 7.
Experiment 8
Experiment 8 was a letter-confidence task in which the stimuli were identical to the ones used in Experiment 6: Xs in the periphery and mixed letters in the center (large-difference condition) and X morphs (a morph of X and another letter of the alphabet) in the periphery and mixed letters in the center (small-difference condition). These stimuli were selected because Experiment 6 showed that the letter stimuli evoked the uniformity illusion consistently and within a short amount of time following peripheral fade in. In a given trial of Experiment 8, the peripheral stimuli could be mixed letters, uniform Xs, or X morphs, whereas the central patch could be empty, filled with mixed letters, or filled with uniform Xs (see Fig. 5). All combinations between peripheral patch and central patch could occur, except that the central patch could not be empty when the peripheral patch contained morphs. This meant that there were eight conditions in total. There were 20 trials per condition, and all trials were randomly intermixed throughout the experiment. The resulting 160 trials were divided into eight blocks of 20 trials each.
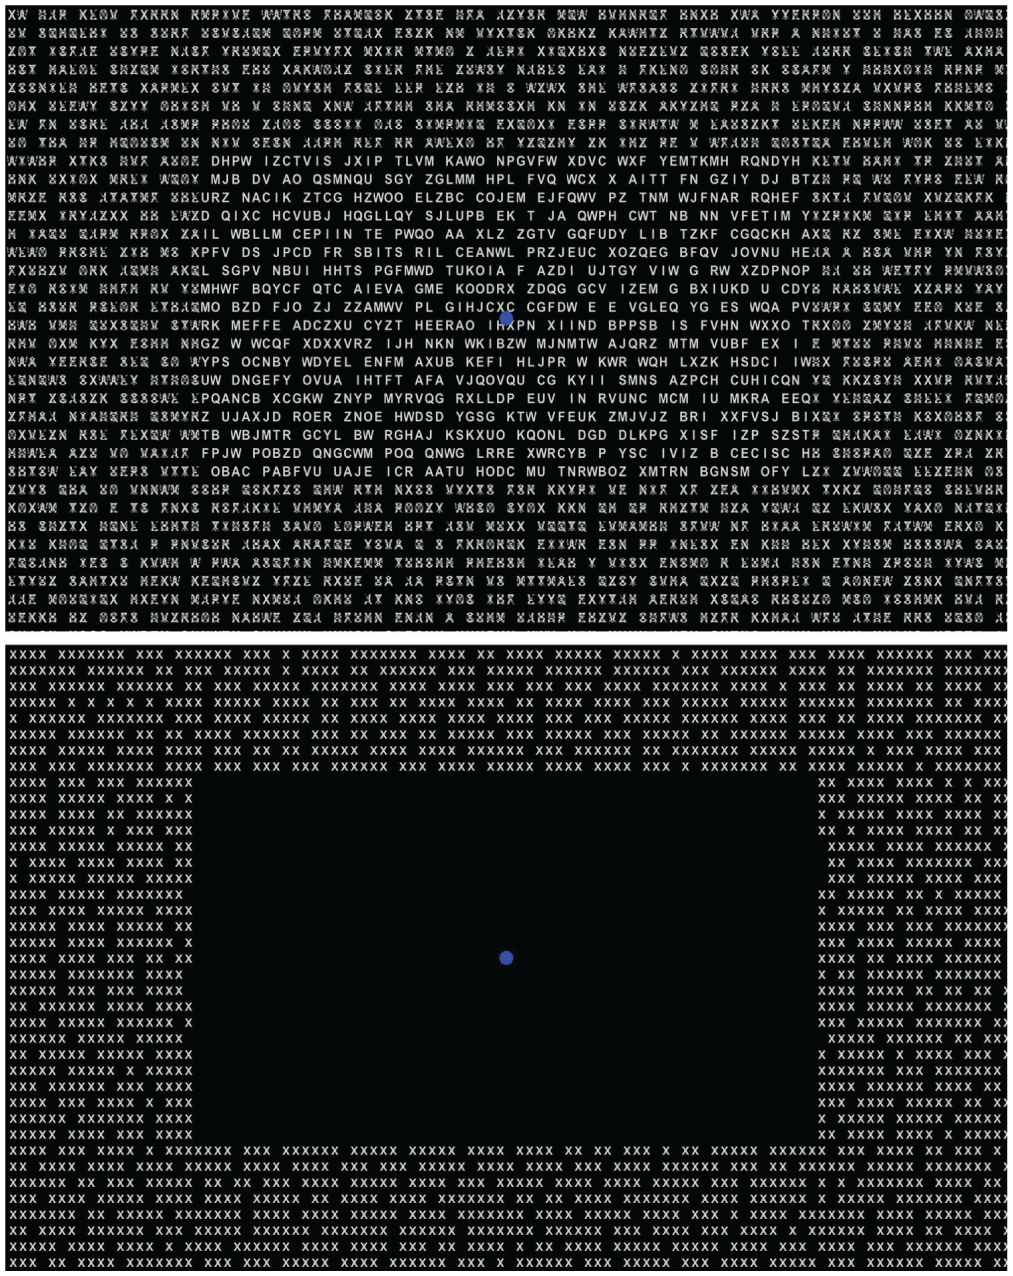
Two stimulus displays from Experiment 8. The stimuli were the same as those used in Experiment 6, but they were combined in different ways, and the display (after the periphery had faded in) remained visible for 6 s. After the display disappeared, participants’ task was to indicate the identity of the stimuli in the periphery and rate their confidence in this judgment. The periphery could contain mixed letters, uniform Xs, or X morphs, and the center could be empty, contain mixed letters, or contain uniform Xs. In these examples, the top panel shows a display containing X morphs in the periphery and mixed letters in the center, whereas the bottom panel shows a display containing Xs in the periphery and an empty center.
As in the previous experiments, the trial started with a central fixation spot presented for 1.5 s. Then, the central patch was presented, and the periphery faded in. In this case, after fade in, the stimuli remained visible for 6 s and then disappeared. At the end of the trial, participants indicated with a nonspeeded forced choice whether the peripheral stimuli were mixed letters or uniform Xs. Participants next indicated how certain they were about their judgment by choosing one of four boxes numbered from 1 (total guess) to 4 (very certain).
Data analysis
Experiments 1 through 7: control analyses
For both change and no-change trials (excluding trials in which participants responded prior to the onset of the change), we calculated the percentage of trials in which participants indicated that they had seen a uniformity shift. For no-change trials (in which the uniformity illusion could occur), participants indicated that they had seen a uniformity shift on 68% of the trials (ranging from 46–93% over the seven experiments). For change trials (in which an actual uniformity shift occurred), participants indicated that they had seen a uniformity shift on 89% of the trials (ranging from 71–96% over the seven experiments). Participants were significantly more likely to indicate that they had seen a uniformity shift on change trials than on no-change trials, t(6) = 3.44, p = .01, which (a) shows that participants were paying attention to the displays and not just pushing the response button randomly and (b) suggests that participants were able to accurately report their perceptual experiences.
Experiments 1 through 8: illusory-shift analyses
In no-change trials, a response was classified as indicating an illusory shift to uniformity when participants clicked the mouse at any point during the trial. On change trials, a response was classified as indicating an illusory shift to uniformity when participants clicked the mouse before the peripheral stimuli started changing. All other responses were coded as having no illusory shift. To determine the occurrence of illusory shift, we calculated the number of trials in which participants indicated a uniformity shift relative to the total number of trials. For the reaction times, the time from complete fade in of the periphery until the mouse click indicating uniformity was calculated for each level of difference between the central and peripheral stimuli.
Results
Experiments 1 through 5
The percentage of illusory-uniformity responses relative to the total amount of trials was calculated for each experiment, for the two levels of difference between the central and peripheral stimuli. In all five experiments, the uniformity illusion consistently occurred (M = 83% of trials, varying from 74–91%), which indicates that shape, orientation, luminance, and motion are all susceptible to the uniformity illusion. Reaction times indicated that participants needed to fixate on the center for at least 2 s before the uniformity shift occurred (M = 2.8 s, range = 1.8–5.2 s over the five experiments).
Figure 6 illustrates the results of the five experiments, specifying both the rate of report for illusory uniformity shifts and time to illusion onset for displays in which the difference between the central patch and the periphery was both large and small. As the figure shows, when the difference between the periphery and the central patch was larger, participants were less likely to see the uniformity illusion. Moreover, when the difference between stimuli in the center patch and the periphery was larger, the uniformity illusion was slower to develop, although this difference did not reach significance in Experiments 3 (luminance) and 5 (motion). The relevant results are summarized in Table 3.
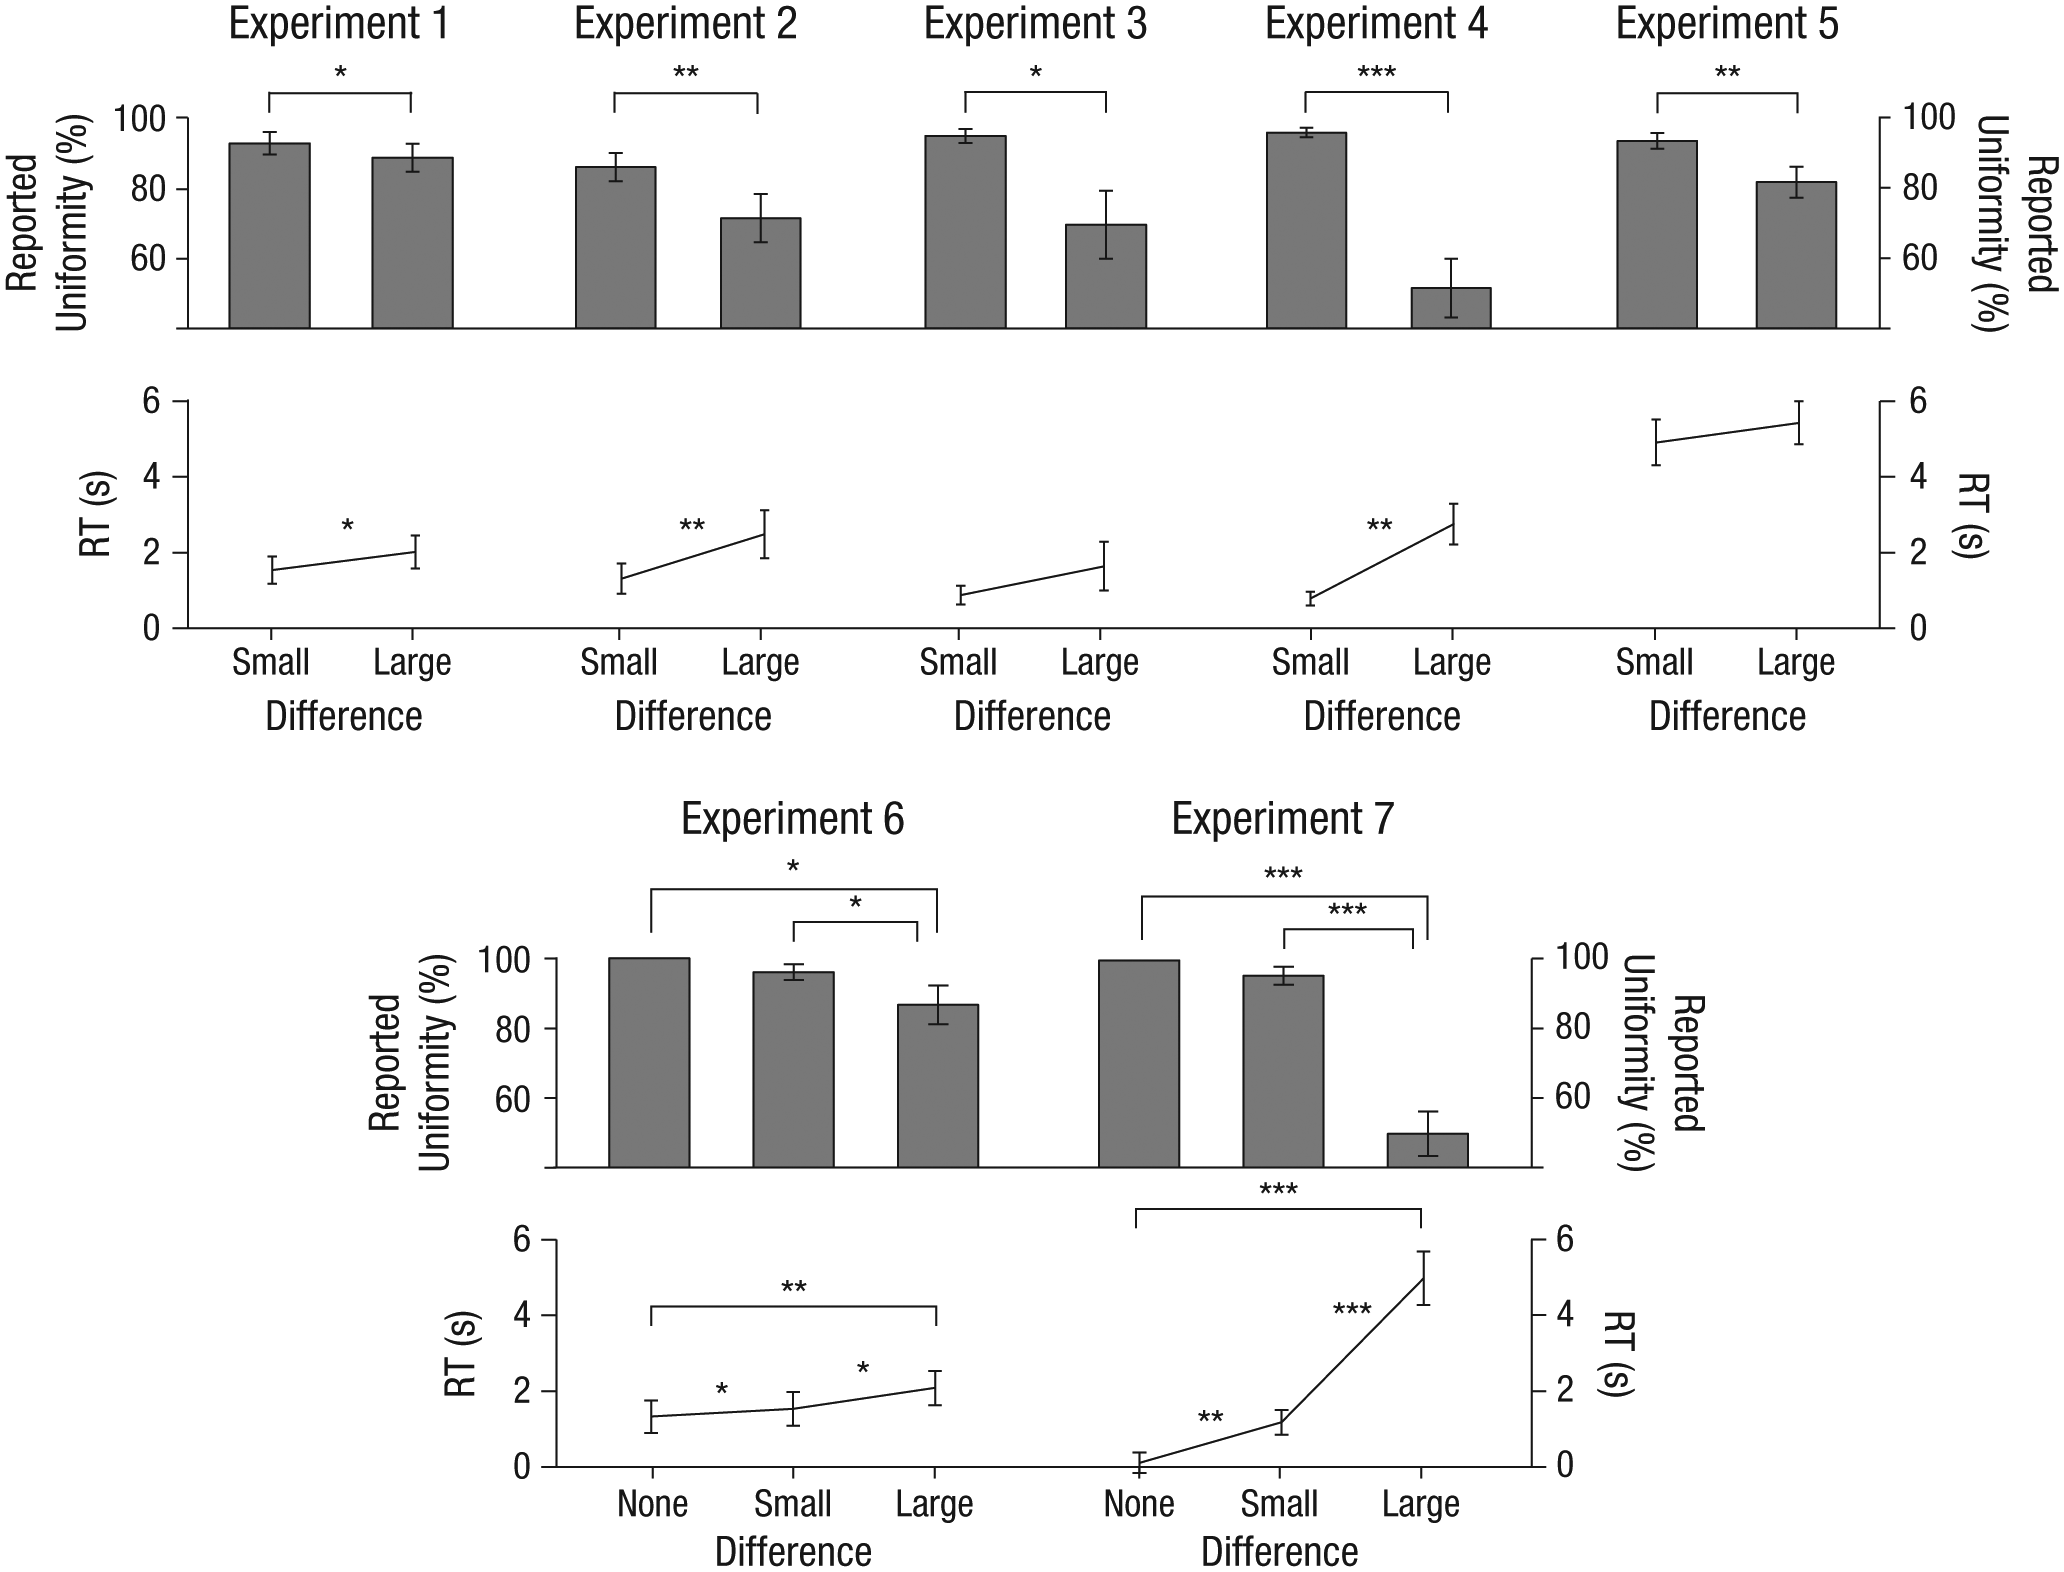
Mean percentage of trials on which participants indicated a uniformity shift (top rows) and mean reaction time (RT) to reported uniformity (bottom rows) as a function of difference condition, separately for Experiments 1 through 7. Significant differences between conditions are indicated by asterisks (*p < .05, **p < .01, ***p < .001). Error bars indicate ±1 SE.
Mean Percentage of Reported Uniformity and Reaction Time From Experiments 1 Through 5
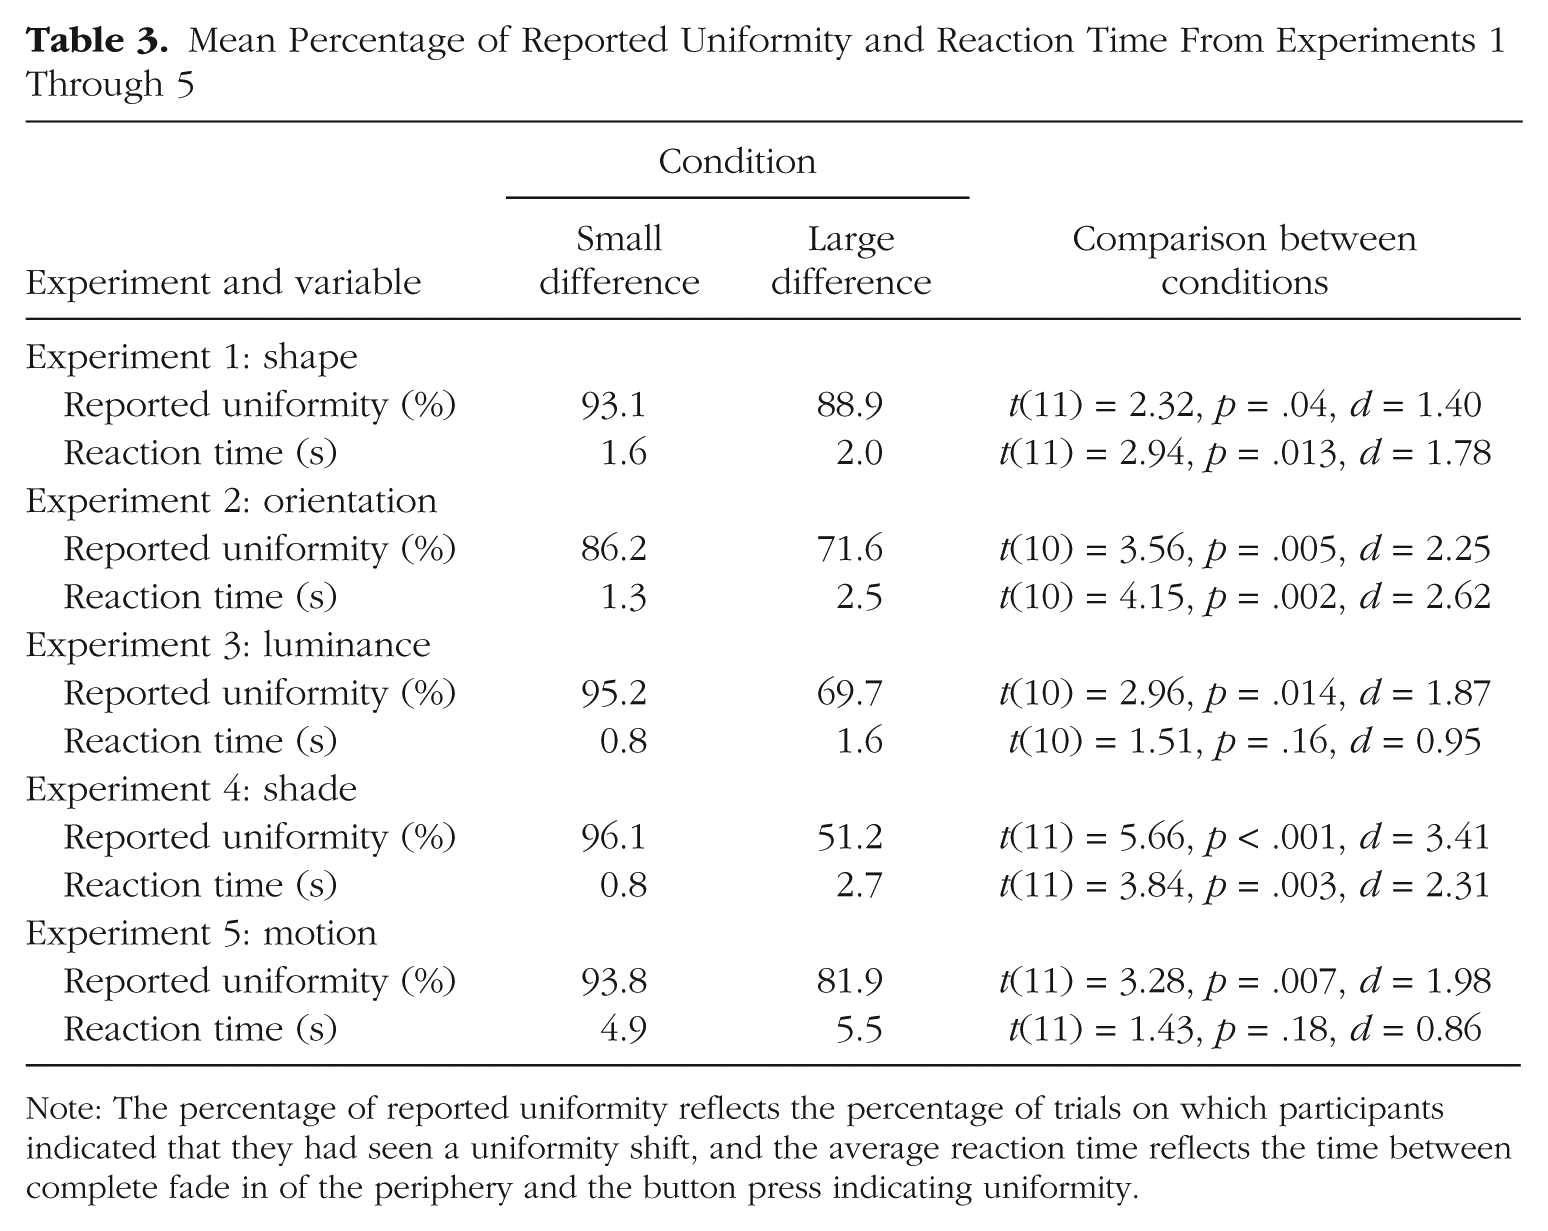
Note: The percentage of reported uniformity reflects the percentage of trials on which participants indicated that they had seen a uniformity shift, and the average reaction time reflects the time between complete fade in of the periphery and the button press indicating uniformity.
Experiments 6 and 7
In the no-difference trials of Experiments 6 and 7, the periphery and central patch were identical from the fade in of the periphery, and these trials therefore functioned as a baseline to indicate how accurately participants detected uniformity and how long it took for them to report uniformity when uniformity was present. Participants were highly accurate in detecting that the central patch was identical to the periphery, and they were relatively fast to respond. The other two types of trials, in which the periphery differed from the central patch, showed a strong potential to evoke uniformity illusions. In Experiment 6, the uniformity illusion occurred about 1.8 s after display onset when the identity of the stimuli in the center and the periphery differed (Xs compared with other letters), and in Experiment 7, the uniformity illusion occurred about 3.2 s after display onset when the pattern in which stimuli were presented was different between the central patch and the periphery. When compared with the baseline condition (no-difference trials), this shows that the time the uniformity illusions takes to develop can vary quite dramatically for different stimuli: The identity uniformity illusion occurred almost immediately, whereas the pattern uniformity illusion took more time to develop.
As in Experiments 1 through 5, when the difference between the periphery and the central patch was larger, participants were less likely to see the uniformity illusion. When participants did see the illusion, it was slower to develop. For the relevant analyses of variance and follow-up t tests for Experiments 6 and 7, see Table 4.
Mean Percentage of Reported Uniformity and Reaction Time From Experiments 6 and 7
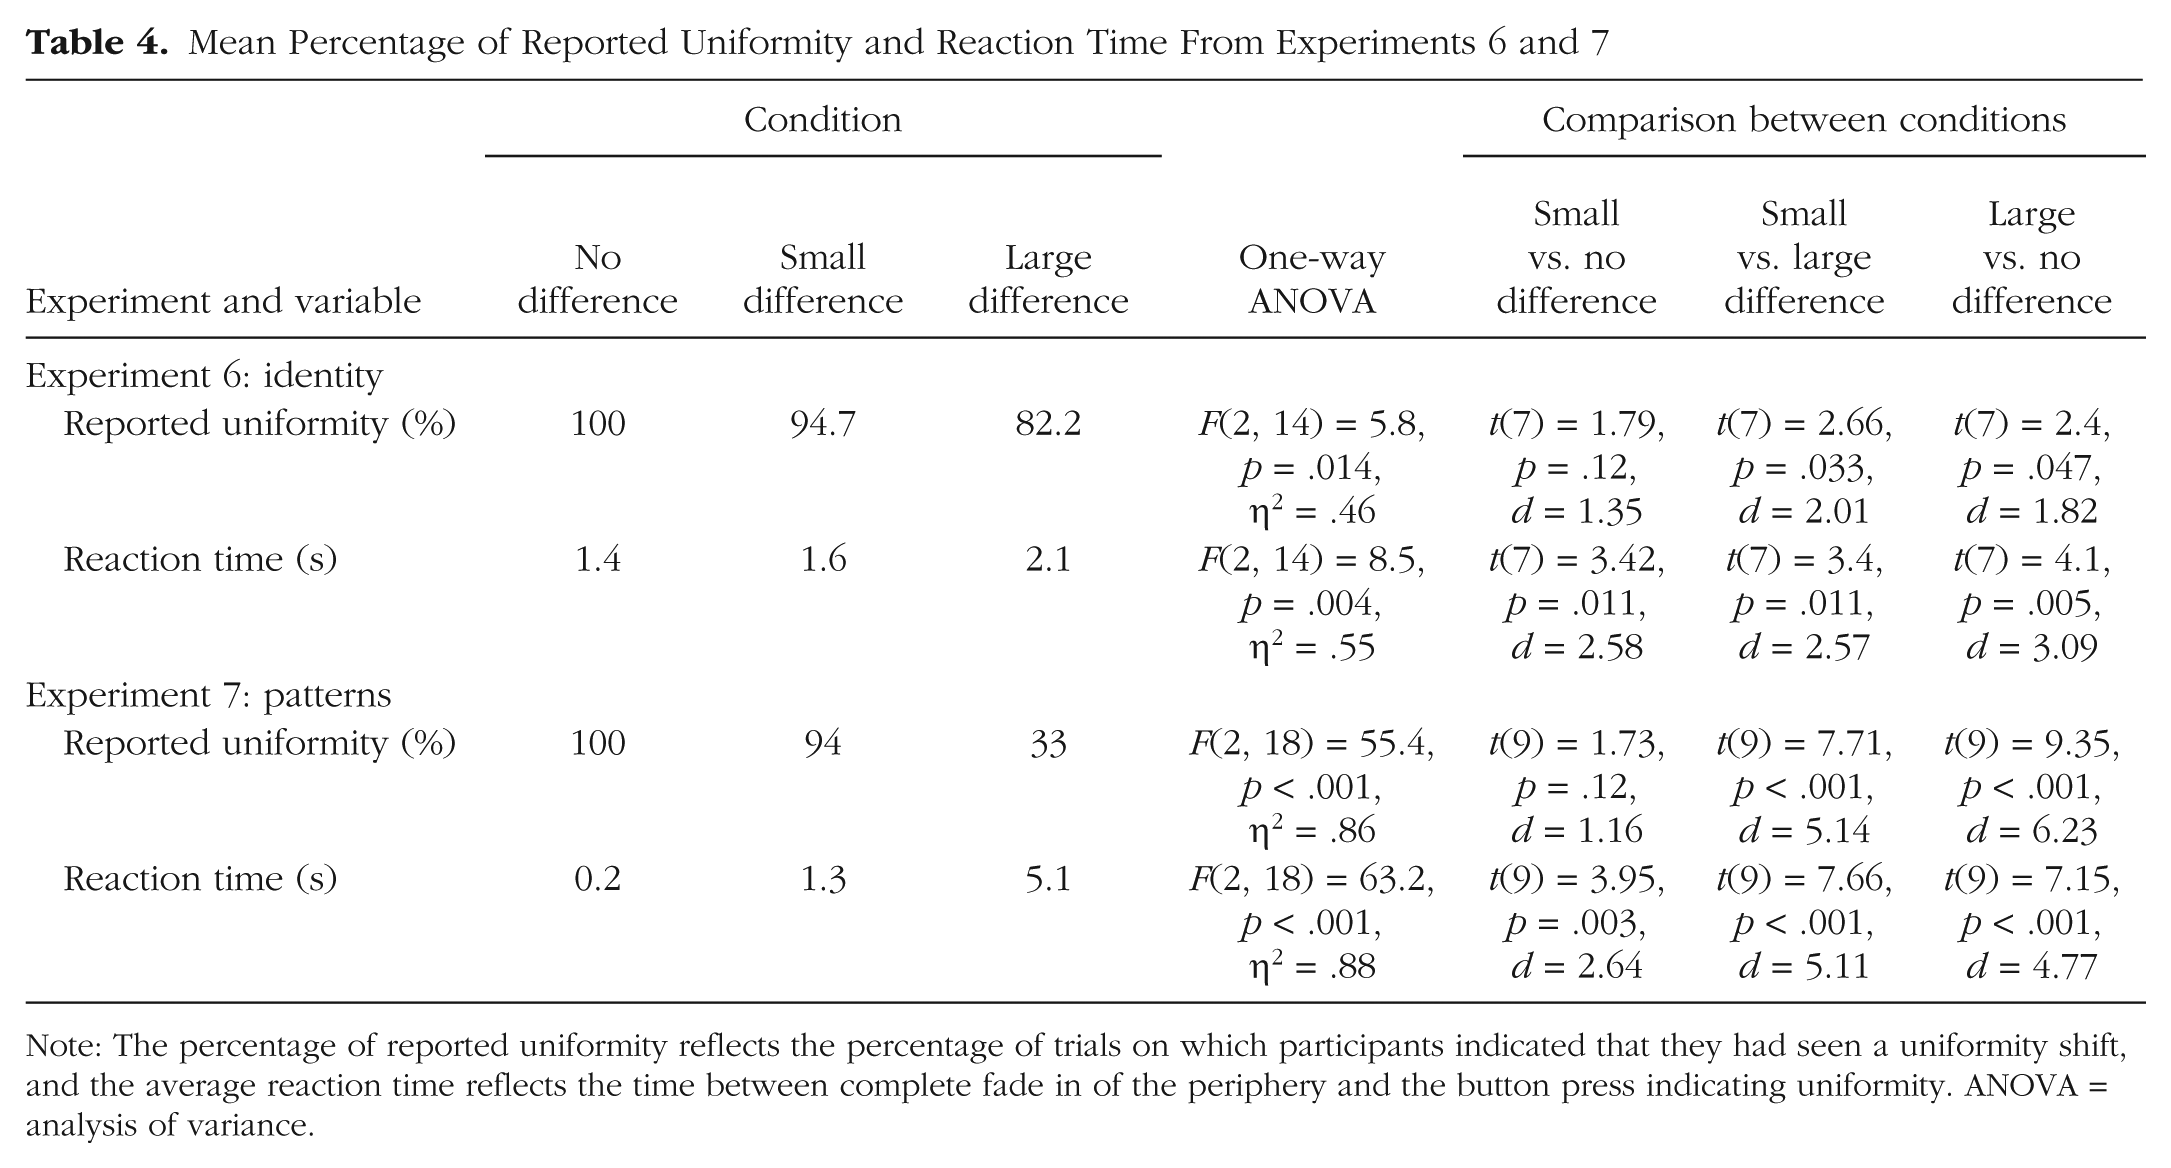
Note: The percentage of reported uniformity reflects the percentage of trials on which participants indicated that they had seen a uniformity shift, and the average reaction time reflects the time between complete fade in of the periphery and the button press indicating uniformity. ANOVA = analysis of variance.
Experiment 8
The results of Experiments 1 through 7 suggest that participants can see a change in the periphery although the physical display remains the same. However, this still leaves the possibility of a response bias: Perhaps participants did not actually see a change but simply reported seeing a change. Experiment 8 was designed to address this issue by measuring metacognition. Participants indicated the specific nature of the stimuli they saw in the periphery at the end of each trial. This change in the design allowed us to explore whether people had an illusory experience (when they reported the stimuli from the central patch in the periphery, while the true peripheral stimuli were different) and test their subjective confidence in that judgment for illusory as well as real perception. The responses and confidence judgments of the participants are summarized in Table 5 and Figure 7.
Mean Percentage of Reported Letters and Confidence Judgments From Experiment 8
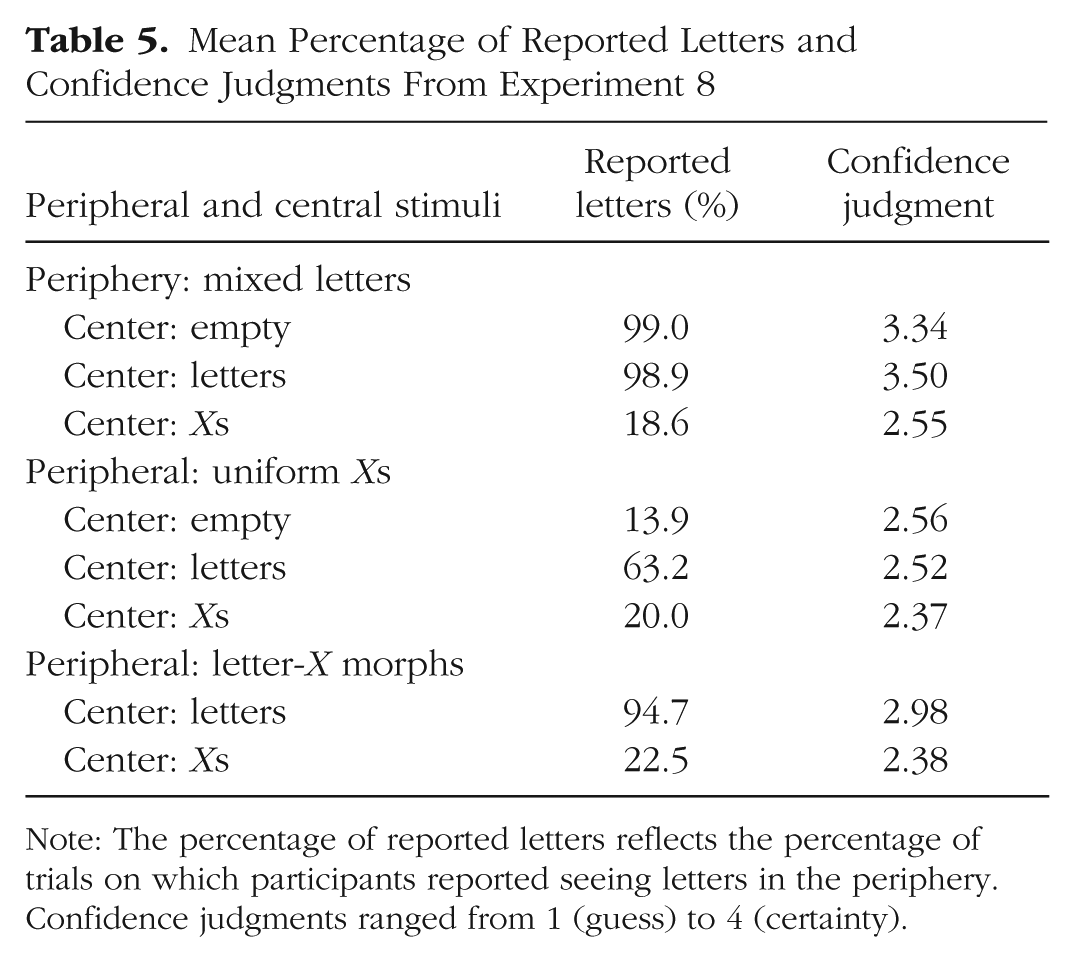
Note: The percentage of reported letters reflects the percentage of trials on which participants reported seeing letters in the periphery. Confidence judgments ranged from 1 (guess) to 4 (certainty).
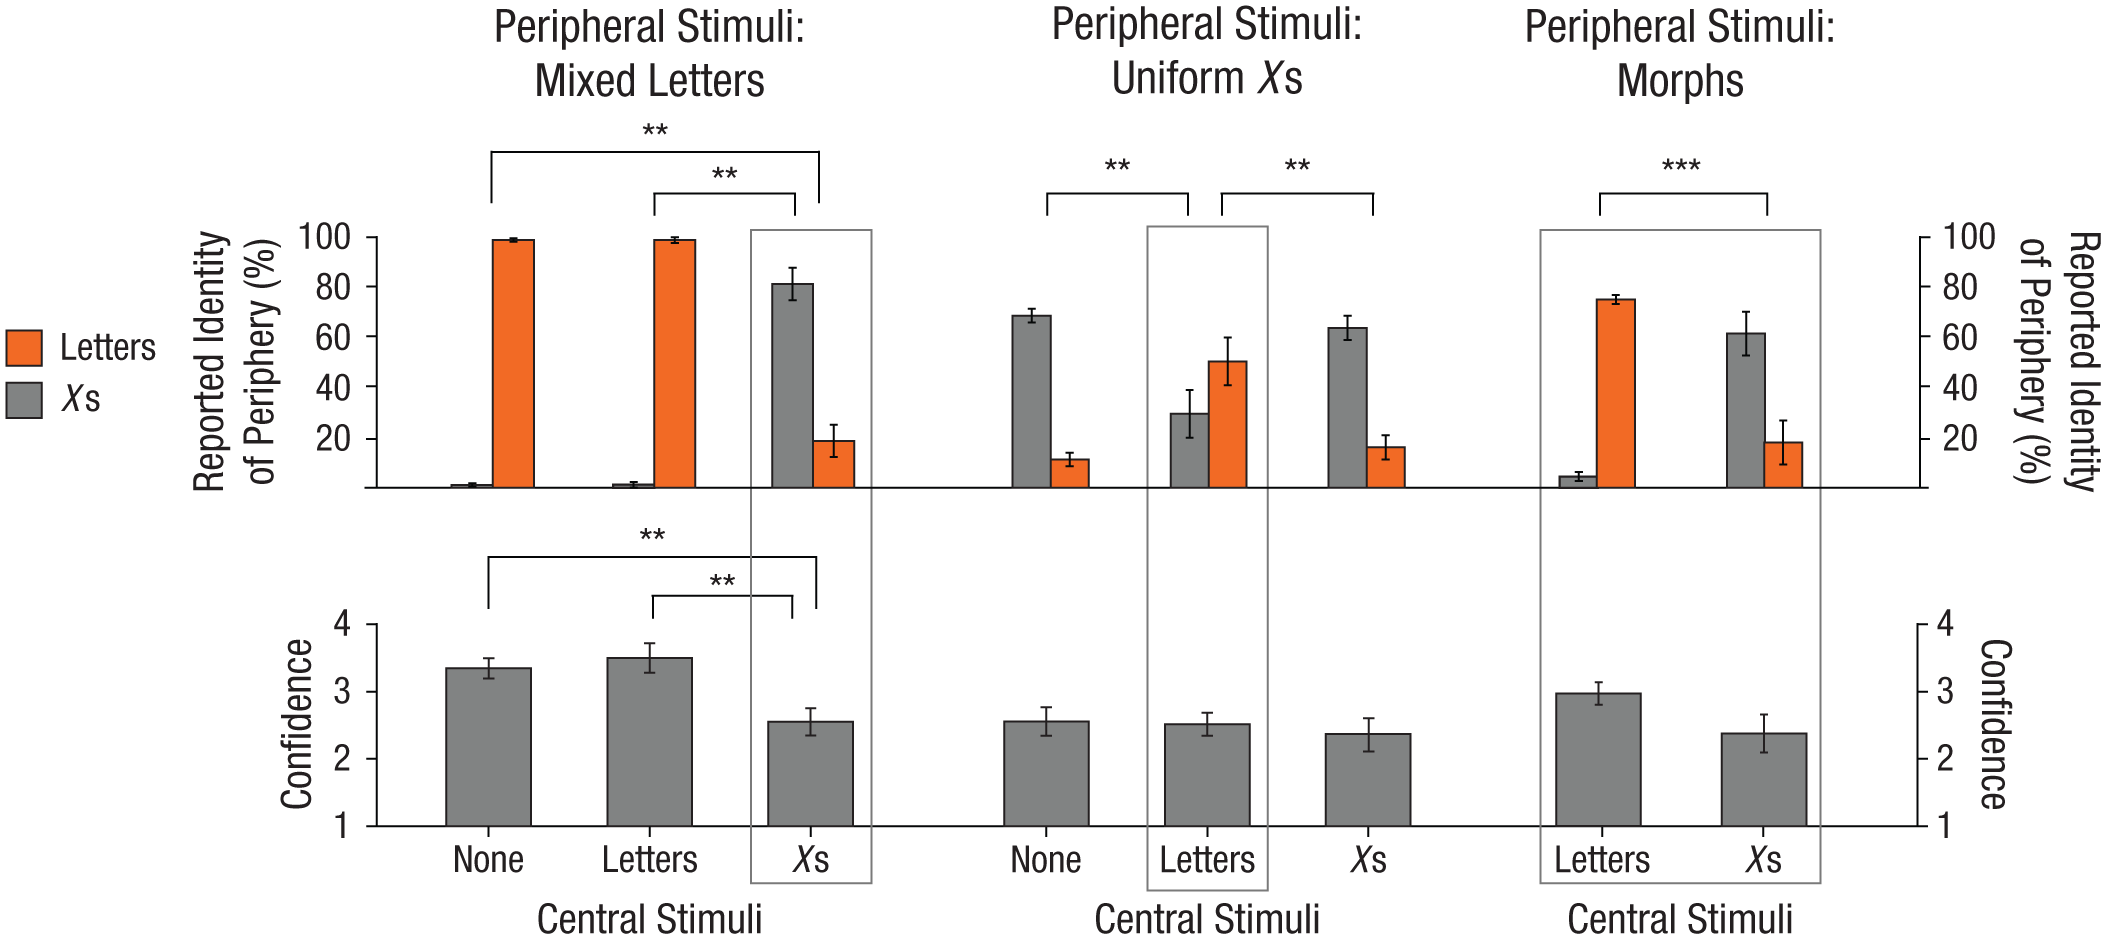
Mean percentage of trials in Experiment 8 on which participants reported seeing mixed letters or uniform Xs in the periphery (top row) and their average confidence in their judgments (bottom row; 1 = guess, 4 = certainty). Results are shown separately for each combination of peripheral and central stimuli. Conditions in which illusory uniformity shifts occurred are indicated by gray boxes. Significant differences between conditions are indicated by asterisks (**p < .01, ***p < .001). Error bars indicate ±1 SE.
The nature of the stimuli in the central patch changed the perception of the periphery when the periphery consisted of mixed letters, F(2, 16) = 151.4, MSE = 0.014, p < .001, η2 = .95, when the periphery consisted of uniform Xs, F(2, 16) = 12.4, MSE = 0.053, p = .001, η2 = .61, and when the periphery consisted of morphs, t(8) = 6.45, p < .001, d = 4.3. When the periphery consisted of uniform Xs, presenting mixed letters in the center increased the percentage of letter reports for the periphery compared with when the center was empty, t(8) = 4.49, p = .002, d = 2.99, or filled with Xs, t(8) = 2.92, p = .017, d = 1.95. When the periphery consisted of mixed letters, presenting uniform Xs in the center increased the percentage of X reports for the periphery compared with when the center was empty, t(8) = 11.52, p < .001, d = 7.68, or filled with mixed letters, t(8) = 10.51, p < .001, d = 7.4.
Table 5 shows that confidence was not extremely high but still above the average of 2 in all conditions and overall seemed relatively similar for judgments of real and illusory displays. When the peripheral stimuli were mixed letters, the presence of a uniformity illusion (i.e., seeing uniform Xs in the periphery) was accompanied by a slight decrease in confidence in that report, F(2, 16) = 15.1, MSE = 0.14, p < .001, η2 = .65. However, when the peripheral stimuli were uniform Xs, confidence was equally high when these stimuli were misperceived as mixed letters as when they were correctly perceived as uniform Xs, F(2, 16) = 1.46, MSE = 0.195, p = .26, η2 = .15.
Discussion
Experiments 1 through 7 show that fixating on centrally presented stimuli can reliably create an illusory perception of uniformity in peripheral stimuli and that this effect can occur for stimuli of different shape, orientation, luminance, shade, motion, identity, and pattern. Participants reported the uniformity illusion in 33% to 96% of displays, depending on the type of stimulus and the degree of difference between the central and peripheral patches. These results illustrate a novel visual illusion in which the perceived pattern of the peripheral vision is uniformly changed to that of central vision. Somewhat similar phenomena have been reported previously (Kanai, 2005; MacKay, 1964). However, the previous reports were anecdotal, and our present set of experiments is the first to systematically illustrate this phenomenon with a wide range of visual attributes. Experiment 8 showed that participants rated their perception of illusory uniform stimuli and physically uniform stimuli with equal confidence. However, there was a subtle difference in confidence ratings for peripheral mixed letters, which suggests that illusory uniformity might be somewhat different from the experience of physical uniformity. Overall, this series of experiments illustrates the strength and versatility of the uniformity illusion.
The uniformity illusion builds up gradually: All experiments indicated that the illusion occurs only after maintaining fixation on the central patch for some time. The exact time varied per stimulus type, with the motion uniformity illusion taking longest to develop. Moreover, all eight experiments showed that when central and peripheral stimuli were more dissimilar, participants less often reported seeing uniformity, and if they did, time to onset of the illusion increased. This delay suggests that adaptation to peripheral signals may play an important role in the reduction of visibility of the original peripheral stimuli (Ditchburn & Ginsborg, 1952). Future research should explore the exact role of adaptation within the visual system to determine the exact role it plays in the uniformity illusion.
Another key feature of the uniformity illusion is that visual information in the periphery does not disappear when the observer adapts to it. Instead, the observer perceives the central stimuli to be present in the periphery as well. In this regard, the illusion is similar to the phenomenon of perceptual misbinding described by Wu, Kanai, and Shimojo (2004), in which dots in the periphery are perceived to have the same combination of features (color and direction of movement) as the stimuli that are perceived in the center of the visual field. However, one important difference between this illusion and the uniformity illusion is that the perceptual-misbinding illusion occurs immediately and does not require adaptation (Kanai, Wu, Verstraten, & Shimojo, 2006). Other illusions in which visual information is added to the subjective percept, such as the filling in of the blind spot, the watercolor illusion (Pinna, Brelstaff, & Spillmann, 2001), neon color spreading (Grossberg & Mingolla, 1985), visual phantoms (Kitaoka, Gyoba, & Sakurai, 2006; Sakurai & Gyoba, 1985; Tynan & Sekuler, 1975), lightness illusions (Kitaoka et al., 2006; Zavagno & Caputo, 2001), and filling in of amodally completed Kanisza figures (Kanizsa, 1976), also occur without preceding adaptation.
Given the relatively large amount of time before the uniformity illusion occurs, it seems most related to Troxler fading, in which small “empty” patches or objects (such as yellow circles) are filled in with static background texture (Balas & Sinha, 2007; Ramachandran & Gregory, 1991) or moving background texture (Bonneh et al., 2001; Ramachandran & Anstis, 1990) after observers fixate a central point for an extended period of time. However, in contrast to the relatively local nature of perceptual filling in, the uniformity illusion affects large parts of the visual field involving long angular distances.
The uniformity illusion occurs for a wide range of stimulus types. This suggests that the uniformity illusion is guided by a general mechanism of visual processing. One possibility is that the illusion is rooted in the principle that the brain implements a “hierarchical prediction machine” (Clark, 2013, p. 181). According to this view, the following cascade of events may underlie the uniformity illusion. Initially, the incoming visual information of the center and periphery of the display is strong enough to generate an accurate percept of the entire visual display. Second, as the observer maintains fixation on the center of the display, sensory input from the periphery deteriorates more than information from the center (Schieting & Spillmann, 1987; Smith, Singh, Williams, & Greenlee, 2001). Third, in the ongoing cycle of adjusting predictions relative to sensory prediction errors, the peripheral visual input loses its informative strength (Riggs, Ratliff, Cornsweet, & Cornsweet, 1953). Finally, the prediction of the identity of the elements in the visual field is dominated by the more reliable information from the center of the visual field, possibly combined with a default prior of surface uniformity. With the peripheral visual input too weak to update the current predictions, this process causes the properties of the central stimuli to be projected across the periphery.
It remains to be seen whether the perceptual filling in of the periphery with the stimuli presented in the central patch truly represents an active perceptual process in which the central stimuli are “projected” onto the periphery. This question reflects an ongoing discussion about the nature of filling-in illusions in general (Dennett, 1992; Pessoa, Thompson, & Noë, 1998): Are the illusory parts of the visual scene actively generated (filled in), or are these illusory patches the result of a more passive process in which the periphery only appears to be filled in with information that receives more attention? Experiments focusing on the neural activation underlying other filling-in illusions, such as neon color spreading, have shown evidence for active filling in at the earliest stages of perception (Chong, Familiar, & Shim, 2016; Hsieh & Tse, 2009; Komatsu, 2006; van de Ven, Jans, Goebel, & De Weerd, 2012). However, the current experiments do not provide direct evidence for active filling in of the periphery. It is possible that the subjective experience of uniformity is instead due to attenuation of information that distinguishes the differences between the central patch and the periphery, which causes observers to perceive the whole visual field as uniform. A study of perceptual metamers by Freeman and Simoncelli (2011) indeed shows that when viewing natural images, participants can fail to detect substantial distortions to the periphery (while preserving low-level image properties). At the present time, therefore, it is impossible to decide whether the uniformity illusion is based on active filling in or passive assumptions about the nature of a visual stimulus. We have observed, however, that when the central patch in a display evoking the uniformity illusion suddenly changes (e.g., the central stimuli are lines tilting to the left within a periphery of lines with mixed orientations, and after 60 s the central lines tilt right), the illusory periphery seems to persists for a while before the periphery changes to the identity of the central patch. It thus seems the illusion is not immediately halted or overwritten when observers see new central information. This persistence of the illusory periphery (which can be viewed at uniformillusion.com/p/luminance-illusion-change.html) suggests a relatively active form of filling in. More supporting (neural) evidence should be gathered, however, before any strong conclusion can be drawn about the processes underlying the uniformity illusion.
Uniformity illusions appear for displays with very different characteristics, ranging from a display filled with objects moving at different speeds to a uniformly gray display with a difference in luminance. We have created further examples for color, blurriness, density, and size (see the appendix). Much like binocular rivalry (Tong, Nakayama, Vaughan, & Kanwisher, 1998), the uniformity illusion can directly manipulate the content of visual perception and has been the basis of many studies exploring consciousness. The extremely wide range of features for which uniformity illusions occur, combined with their global effects on the percept, provides exciting additional potential to study how the brain constructs (visual) conscious experiences.
In summary, this novel visual illusion suggests that conscious visual experience reflects active reconstruction in which precise foveal information replaces imprecise peripheral information. This may explain why conscious experience appears to be rich and detailed across the entire visual field, despite the impoverished informational contents in peripheral vision.
Footnotes
Appendix
Action Editor
Ed Awh served as action editor for this article.
Declaration of Conflicting Interests
The authors declared that they had no conflicts of interest with respect to their authorship or the publication of this article.
Funding
This research was supported by Intra-European Fellowships Marie Curie Grants No. 300184 to Y. Pinto and No. 329134 to M. Otten. The Sackler Centre for Consciousness Science is supported by the Dr. Mortimer and Theresa Sackler Foundation.