
Abstract
Can our native language influence what we consciously perceive? Although evidence that language modulates visual discrimination has been accumulating, little is known about the relation between language structure and consciousness. We employed electroencephalography and the attentional-blink paradigm, in which targets are often unnoticed. Native Greek speakers (N = 28), who distinguish categorically between light and dark shades of blue, showed boosted perception for this contrast compared with a verbally unmarked green contrast. Electrophysiological signatures of early visual processing predicted this behavioral advantage. German speakers (N = 29), who have only one category for light and dark shades of blue, showed no differences in perception between blue and green targets. The behavioral consequence of categorical perception was replicated with Russian speakers (N = 46), reproducing this novel finding. We conclude that linguistic enhancement of color contrasts provides targets with a head start in accessing visual consciousness. Our native language is thus one of the forces that determine what we consciously perceive.
Keywords
The interplay between language and color perception provides one of the most striking examples of linguistic relativity, suggesting that language influences perception (Wolff & Holmes, 2011). For instance, stimuli from different linguistic categories are easier to discriminate than stimuli from the same category (a phenomenon known as categorical perception; A. L. Gilbert, Regier, Kay, & Ivry, 2006; Goldstone & Hendrickson, 2010; Winawer et al., 2007; but see Brown, Lindsey, & Guckes, 2011). Current theories propose transient categorical warping of perceptual space due to the activation of categories via verbal labels (Lupyan, 2012), tuning perception to features that are relevant for the given category (Cukur, Nishimoto, Huth, & Gallant, 2013; C. D. Gilbert & Li, 2013). Here, we investigated whether language affects not only how but also if we perceive a stimulus in the first place: Can the structure of our native language influence visual consciousness?
Only a fraction of the visual stimuli we are presented with reaches conscious perception. Identifying the factors beyond immediate sensory processing that influence what we consciously perceive is essential for a comprehensive understanding of human sensation and perception. Here, we employed the attentional-blink paradigm (Raymond, Shapiro, & Arnell, 1992) to demonstrate that linguistic categories, such as the color words of our native language, are one such factor. Although physically, the wavelengths of light that humans perceive as colors form a smooth continuum, different languages categorize colors differently (Regier & Kay, 2009).
We used event-related potentials (ERPs) of the electroencephalogram (EEG) to uncover electrophysiological correlates of categorical perception and relate brain activity to visual consciousness. Categorical perception entails modulations of early visual ERP components. Specifically, the amplitude of the P1 component, reflecting sensory processing in the extrastriate visual cortex (Di Russo, Martinez, Sereno, Pitzalis, & Hillyard, 2002), varies as a function of linguistic categories for colors (Forder, He, & Franklin, 2017; Thierry, Athanasopoulos, Wiggett, Dering, & Kuipers, 2009) and objects (Maier, Glage, Hohlfeld, & Abdel Rahman, 2014). Thierry et al. (2009) measured ERPs in response to standard-deviant stimulus pairs of light and dark green or blue in an oddball paradigm. For Greek speakers, the shades of blue crossed a linguistic boundary, whereas they fell into the same category for English speakers. Greek speakers showed distinctive ERP responses to blue deviants in the P1 component and the visual mismatch negativity, peaking around 200 ms, indicating that color categories are reflected in sensory stages of perception and influence brain processes relevant for visual discrimination.
We adapted established color stimuli (Thierry et al., 2009) for an attentional-blink paradigm, in which two targets, T1 and T2, were presented within a rapid-serial-visual-presentation (RSVP) stream. Detection rates of T2 varied as a function of the lag between T1 and T2 (i.e., three vs. seven pictures), with better performance at long lags relative to short lags (Martens & Wyble, 2010). Electrophysiological studies have shown that the disruption of visual processing occurs relatively late, whereas early stages up to around 150 ms after stimulus presentation unfold similarly for detected and missed targets (Sergent, Baillet, & Dehaene, 2005; Vogel, Luck, & Shapiro, 1998). Later stages after 200 ms, associated with attentional selection or visual working memory encoding, are strongly affected. The earliest robust correlate of the “blink” was the N2 component (Sergent et al., 2005), which may reflect competition between T1 and T2 for visual consciousness.
If one’s native language provides different basic-level terms for two colors, linguistic warping should increase the salience of this color contrast. More salient stimuli, in turn, are more prone to enter conscious perception (Chua, 2005; Itti & Koch, 2001; Shapiro, Caldwell, & Sorensen, 1997). Thus, for Greek speakers who apply the categories ble and galazio, a stimulus containing these shades of blue should have increased salience and gain an advantage in the competition for visual consciousness. On the basis of these assumptions, we aimed to demonstrate a new effect of linguistic categories on perception: that the linguistic color code that one has learned influences the chances of seeing or missing a stimulus.
Experiment 1
We tested native Greek speakers, expecting to replicate an attentional-blink effect with lower T2 detection rates in the Lag 3 compared with the Lag 7 condition. If more salient color contrasts help to overcome the attentional blink, hit rates should be highest in a mixed-green-and-blue color condition containing a stronger chromatic difference. Crucially, Greek speakers should perform better for T2 targets containing blue compared with green contrasts, helped by the linguistic category boundary between ble and galazio.
In ERPs, we expected the onset of categorical perception—a divergence between blue and green targets—to occur in the P1 component. Both the mixed and the blue contrast should facilitate attentional selection, as reflected in the N2 component. Additionally, neural signatures of categorical perception should predict detection behavior. For instance, the early sensory categorical-perception signal (P1 component) could increase the chances of blue targets to reach visual consciousness and boost perception.
Method
Participants
Thirty-four healthy participants with normal or corrected-to-normal vision and normal color vision, according to the short version of Ishihara’s (2014) Test for Colour Deficiency, volunteered for the study. They were native Greek speakers who had been monolingual at least until the age of 5 years. We chose Greek speakers specifically because they make a basic-level distinction between light and dark shades of blue (Athanasopoulos, 2009). This means that the exact meaning of the English word blue is not expressible in Greek, and speakers must differentiate between light and dark blue (Winawer et al., 2007). English speakers, in comparison, can optionally differentiate between light and dark blue by using non-basic-level terms (e.g., sky blue). Participants provided written informed consent prior to participation. The study was conducted according to the principles expressed in the Declaration of Helsinki and was approved by the local ethics committee. Participants received either course credit or monetary compensation of €8 per hour.
To the extent feasible, we aimed to recruit participants with a short stay in Germany and few German skills, and we indicated so on recruitment flyers. However, no participants were excluded on the basis of their time spent in Germany or their proficiency in German. On average, participants had spent 2 years in Germany (M = 24.48 months, SD = 23.85, range = 2–110). Data from 4 participants were excluded on the basis of predefined task performance criteria (below 50% T1 performance or above 50% false alarms in target-absent trials in the Lag 3 condition). Data from another 2 participants were excluded on the basis of their individual color naming (sorting light and dark blue into the same category). We chose (conservatively) not to exclude participants sorting the green stimuli into different categories, even though this might have diluted the categorical-perception effect. The final sample consisted of 28 right-handed participants (15 female, 13 male; age: M = 28.00 years, SD = 4.44).
The sample size was planned on the basis of a behavioral pilot study with 8 participants, in which bottom-up contrast was manipulated in gray-scale stimuli. The pilot study yielded an unstandardized coefficient of 0.20 for the effect of contrast on hit rates. Assuming a considerably smaller coefficient of 0.15 for a top-down color contrast, we ran a simulation using the SIMR package in the R programming environment (Green & MacLeod, 2016; R Core Team, 2014) to estimate the expected power to secure the fixed effect of color contrast given different sample sizes. With 500 randomizations, the simulation showed that a sample size of 25 would be needed to achieve 82% (95% confidence interval, or CI = [78.5, 85.5]) power. For good EEG data quality, we aimed for a higher sample size of about 30 participants.
Procedure
All participants completed the Language Experience and Proficiency Questionnaire (Marian, Blumenfeld, & Kaushanskaya, 2007) before the experiment. Participants received a consent form and all written instructions before and during the attentional-blink task in Greek. During EEG preparation, interaction with the participants in German or English was kept at a minimum, and participants read a book or browsed the Internet in Greek. For the attentional-blink task, participants were seated in a dark, electromagnetically shielded, and sound-attenuated test cabin. After the task, all participants remained seated and freely named the four colors involved in the experiment. Next, to confirm language-typical color categorization, they were shown two slides with 15 blue and then 15 green stimuli, including the stimuli used in the task, and asked to assign them to categories.
In the attentional-blink task, two targets, T1 and T2, were to be detected in an RSVP stream of distractors (see Fig. 1). Each participant performed 528 trials. In each trial, following a 450-ms fixation cross, 13 shapes were presented for 41 ms each with blank screens of 53 ms in between. Participants looked for the occurrence of a semicircle (T1) and a triangle (T2). T1 always occurred, whereas T2 was absent in 18.2% of the trials. T2-absent trials allowed us to estimate the false alarm rate of each participant. (Also, to make ERP components stand out more clearly, we plotted ERP curves with the Target 2–absent condition subtracted from each curve; e.g., blue – T2 absent and green – T2 absent). The position of T2 was either seven (Lag 7) or three (Lag 3) pictures after T1. After each RSVP stream, participants were asked to successively report the direction of the semicircle and—if present—the direction of the triangle and to rate the subjective visibility of the triangle on a 4-point scale (nothing, slight impression, strong impression, complete).
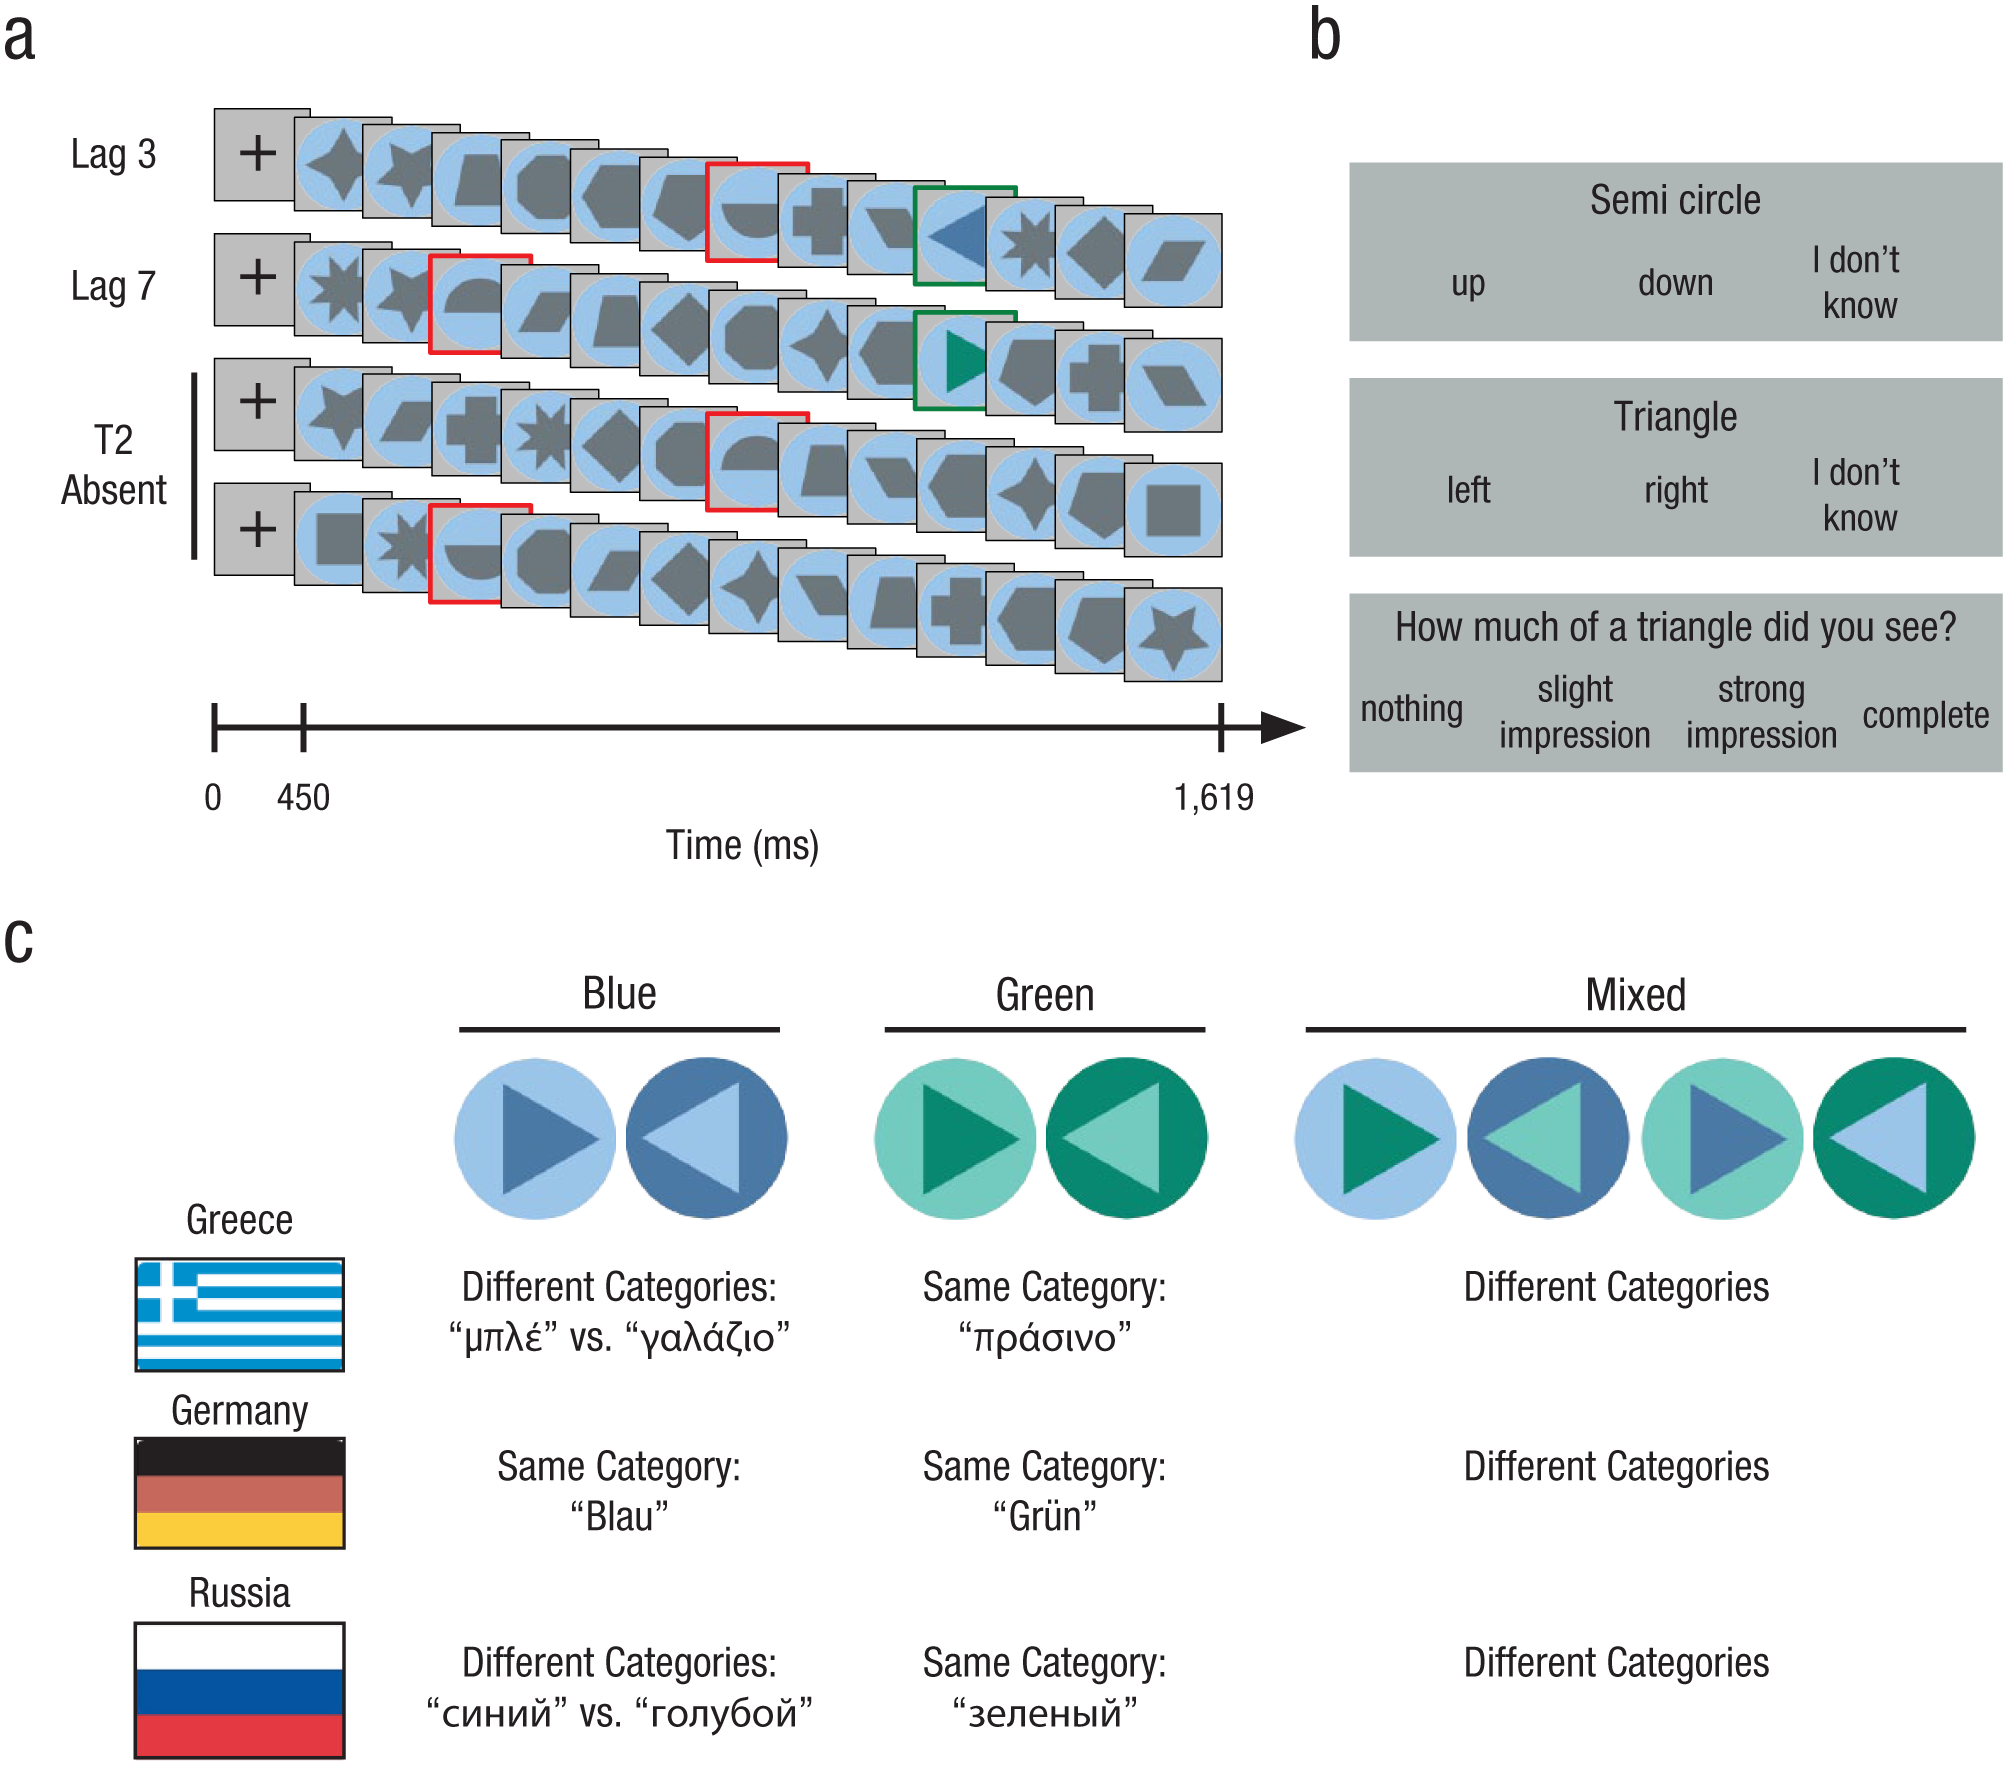
Trial sequence, rating scales, and stimulus design of the attentional-blink task. While viewing rapid-serial-visual-presentation (RSVP) trial sequences (a), participants attended to semicircles (Target 1, or T1) and triangles (Target 2, or T2). In all T2-present trials, T2 occurred at Position 10 in the RSVP stream (highlighted in green for purposes of illustration). T1 appeared in each trial in one of two positions: Lag 3 or Lag 7 trials (highlighted in red). The lags between T1 and T2 corresponded to 282 ms (Lag 3) and 658 ms (Lag 7). In T2-absent trials, only T1 occurred. After each RSVP, participants answered a sequence of three forced-choice questions (b) from which we derived whether a trial was a hit or a miss. For T2 stimuli (c), each of the color contrasts blue, green, and mixed occurred equiprobably and with triangles pointing in both directions. Crucially, for Greek and Russian speakers (Experiments 1 and 3), the blue stimuli fell into different basic-level categories. For German speakers (Experiment 2), there was no basic-level linguistic contrast.
All trial types (Lag 3 or 7, T2 present or absent, different color conditions) were presented in random order. Lag 3 trials were more frequent than Lag 7 trials (86.4% vs. 13.6% of T2-present trials) because this is where a strong attentional-blink effect was expected. Lag 3 trials were thus more informative about electrophysiological processing associated with access to visual consciousness. To keep the experiment duration as short as possible, we increased the relative frequency of Lag 3 trials.
Materials
Stimuli were presented on a calibrated 19-in. LCD monitor with a 75-Hz refresh rate and a resolution of 1,280 × 1,024 pixels, positioned at a distance of 70 cm from each participant’s eyes. The monitor was switched on at least 1 hr before the start of the experiment to ensure correct color presentation. Distractors and targets were geometric shapes on a colored background circle subtending 2.9° of visual angle (see Fig. 1). T1 stimuli were gray semicircles, with the round side facing either up or down. T2 stimuli were colored triangles, pointing either to the left or to the right. Distractor shapes were gray polygons other than semicircles or triangles (13 different shapes).
The crucial color-contrast manipulation was implemented in the contrast between the triangle’s color and the background circle’s color (see Fig. 1c): light blue versus dark blue (hereafter referred to as blue contrast), light green versus dark green (green contrast), and light/dark blue versus light/dark green (mixed contrast). The green contrast was measured to be equally salient to the blue contrast (Thierry et al., 2009). The mixed contrast served as a manipulation check: In addition to crossing a category boundary, it contained a stronger bottom-up chromatic difference than the two other contrasts. This allowed us to simultaneously assess the effects of top-down (linguistic) and bottom-up color contrast.
We reproduced the Munsell colors used in the studies by Athanasopoulos (2009) and Thierry et al. (2009), measured with a ColorCAL MKII Colorimeter (Cambridge Research Systems, Rochester, England). These colors were as follows (Commission Internationale de l’Éclairage, CIE, 1931 chromaticity coordinates x and y and luminance Y are given in parentheses): dark blue 5PB/value 4 (x = 0.234, y = 0.230, Y = 10.8), light blue 5PB/value 7 (x = 0.259, y = 0.264, Y = 41.7), dark green 5G/value 4 (x = 0.259, y = 0.397, Y = 10.6), and light green 5G/value 7 (x = 0.279, y = 0.377, Y = 41.5) with constant Munsell chroma 6 (saturation). The distractor shapes were rendered in gray tones fitted in luminance to the light and dark colors: dark gray (x = 0.312, y = 0.321, Y = 10.7) and light gray (x = 0.312, y = 0.321, Y = 41.7). The monitor background was middle gray (x = 0.312, y = 0.321, Y = 36.5).
Analysis of behavioral data
Behavioral data were analyzed with binomial generalized linear mixed models (GLMMs), given that hit rates in the attentional-blink task followed a binomial distribution. Analyses were done in R (R Core Team, 2014) using the lme4 package (Bates, Mächler, Bolker, & Walker, 2014) and the lmerTest package (Kuznetsova, Brockhoff, & Christensen, 2016) to calculate p values. GLMMs contained the fixed factors lag and color contrast, modeled as sliding difference contrasts. Sliding difference contrasts compare the means of adjacent levels of a fixed factor (e.g., Lag 3 vs. Lag 7 or green vs. blue color contrast). To test all three levels of the factor color contrast against each other, we ran models with two different factor-level orders (i.e., green, blue, mixed and blue, green, mixed). Models corrected for by-participant random intercepts and, where applicable, random slopes for the within-subjects factors lag and color contrast. Random-effects structures were determined using singular value decomposition, removing random slopes that prevented model convergence or explained zero variance, in order to avoid overparameterization. Fixed-effects structures were optimized using the anova function of the stats package in R and on the basis of the Akaike information criterion (AIC) and the Bayesian information criterion (BIC), which decrease with increasing model fit. We used the keepef function from the remef package (Hohenstein & Kliegl, 2015) to compute predicted partial effects for illustration.
EEG recording and analysis
The EEG was recorded with sintered Ag/AgCl electrodes at 64 scalp sites according to the extended 10-20 system. The sampling rate was 500 Hz. During recording, low- and high-cutoff filters (0.032 Hz and 1,000 Hz) were applied, and all electrodes were referenced to the left mastoid. Electrode impedance was kept below 5 kΩ. Electrooculograms were recorded from electrodes next to both eyes and from above and below the left eye. After the main experiment, participants made prototypical eye movements in a calibration procedure for later artifact correction. Off-line preprocessing steps were made in MATLAB (Version 2014a; The MathWorks, Natick, MA) using the EEGLAB toolbox (Delorme & Makeig, 2004). After rereferencing the continuous EEG to a common average reference, we removed eye movement artifacts with a spatiotemporal dipole modeling procedure using Brain Electrical Source Analysis software (Ille, Berg, & Scherg, 2002). Remaining artifacts were eliminated with an automatic artifact-rejection procedure (amplitudes exceeding ±200 µV or changing by more than 50 µV between two successive samples or by 200 µV within intervals of 200 ms). Artifact-free data were segmented into epochs of 1 s, time locked to the onset of T2, including a 200-ms prestimulus baseline interval. ERPs were low-pass filtered at 40 Hz and baseline corrected using the 200-ms time window before T2 onset.
Single-trial ERPs were time locked to the onset of T2, averaged across time windows of interest, and after confirming normal distribution, subjected to linear mixed models (LMMs; Frömer, Maier, & Abdel Rahman, 2018). We tested for associations between the fixed factor color contrast (modeled as sliding difference contrast) and mean ERP amplitudes in a predefined posterior region of interest (see the Results section). We chose LMMs mainly because participants differed in the strength of the behavioral attentional-blink effect, which led to unequal numbers of hit trials across participants entering the ERP analysis. LMMs are robust against differences in trial numbers across participants because they allow correcting for by-participant random intercepts as well as random slopes regarding the influence of the fixed effects (Baayen, Davidson, & Bates, 2008). Models corrected for by-participant random intercepts and, where applicable, random slopes for the within-subjects factor color contrast. Random-effects structures were determined using singular value decomposition, removing random slopes that prevented model convergence or explained zero variance. Model selection was based on likelihood-ratio tests as well as the AIC and BIC. Data and code used for all analyses can be accessed at osf.io/sqp6z.
Results
Color naming
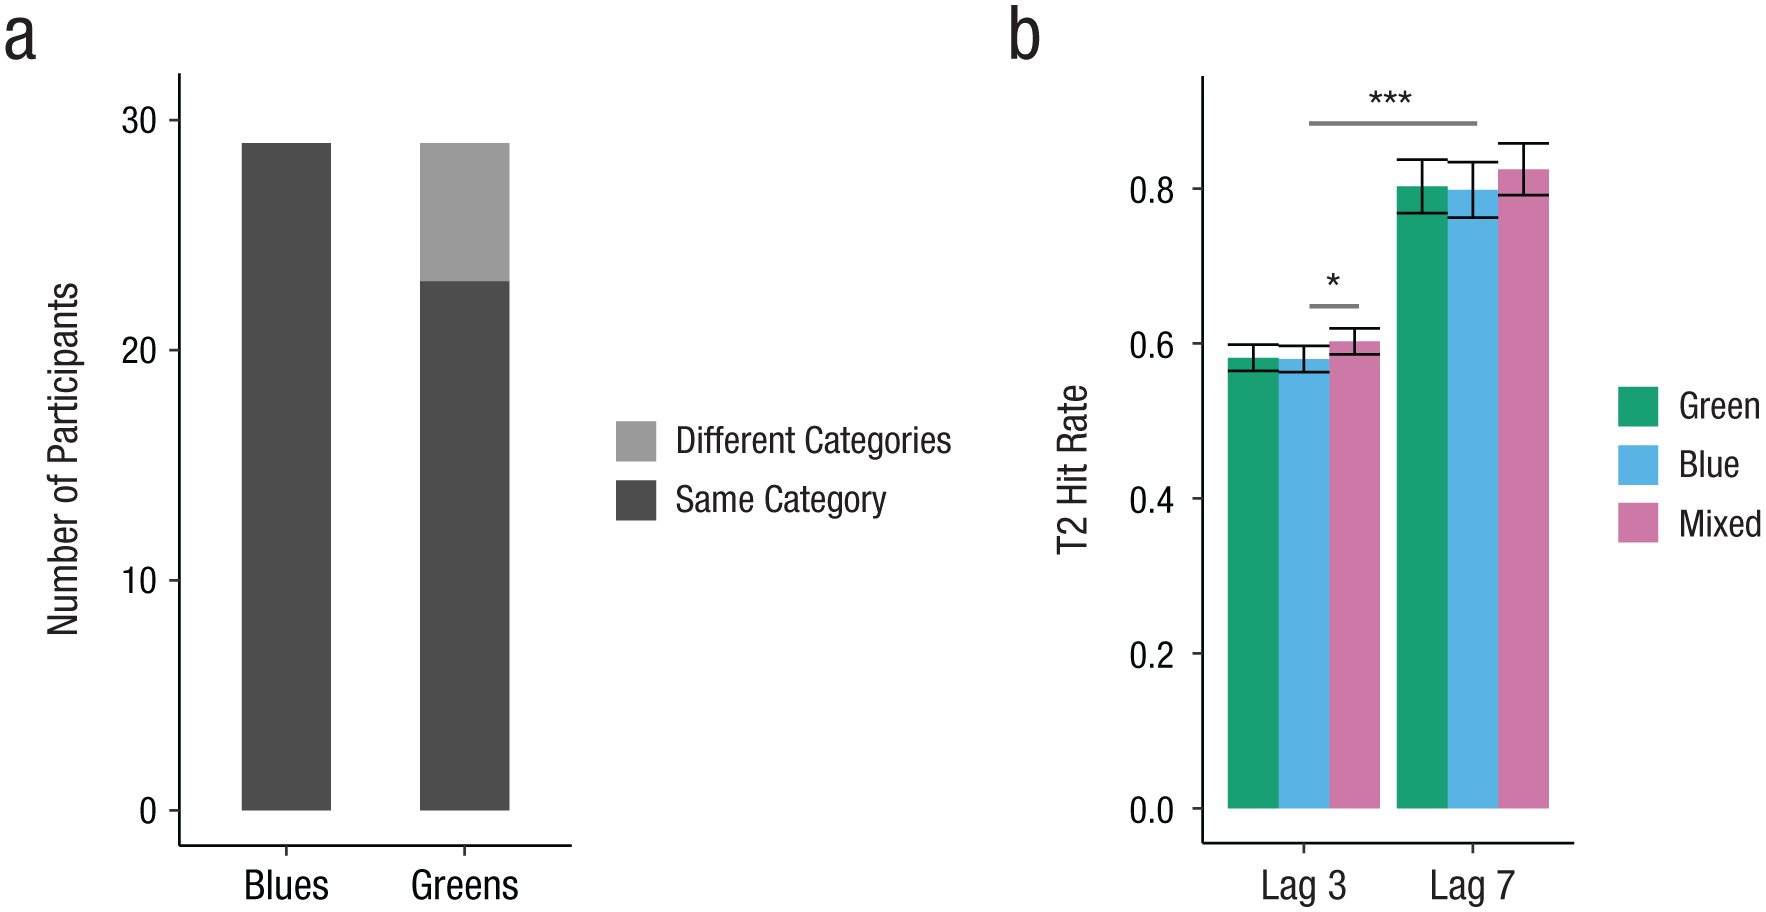
All participants in the final sample sorted light blue and dark blue stimuli into different basic color categories (see Fig. 2). Most participants (75.0%) placed light and dark green stimuli into the same category.
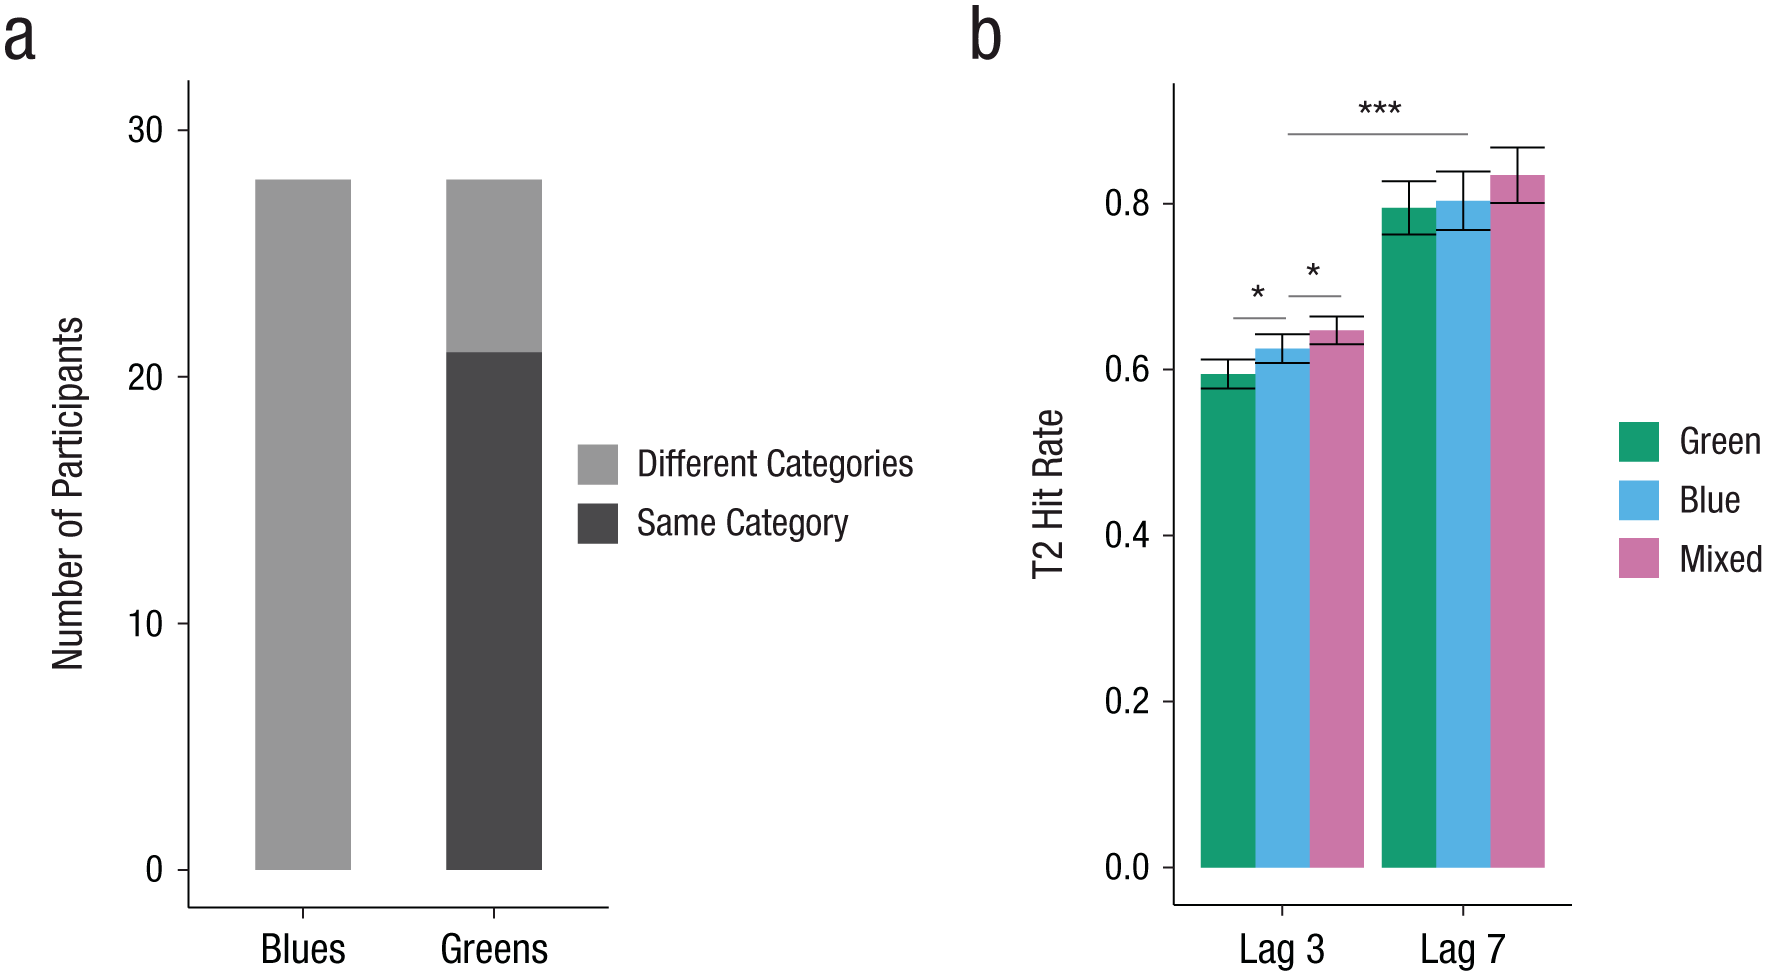
Experiment 1: behavioral results. The number of participants who sorted shades of blue and shades of green into the same category and different categories is shown in (a). Greek speakers’ hit rates for Target 2 (T2) in the attentional-blink task (b) are shown for each lag and color contrast. The difference between Lags 3 and 7 is the attentional-blink effect. Error bars represent 95% confidence intervals. Asterisks indicate significant differences (*p < .05, ***p < .001).
Behavioral results
Mean T1 accuracy was 85.8% (95% CI = [85.2, 86.4]). In T2-absent trials, the mean correct rejection rate was 89.0% (95% CI = [87.7, 90.3]). Only T2-present trials in which T1 was correctly identified were selected for further analysis. A trial was considered a hit if both T1 and T2 were seen and correctly identified (correct report of T1 and at least a “slight impression” and correct direction of T2 reported). We tested for the presence of an attentional-blink effect and effects of color contrast on hit rates. Table 1 displays the estimated effect sizes of the fixed effects, standard errors, and z scores, as well as estimates of the square root of the variance components (SD) for this analysis. As shown in Figure 2, mean hit rates differed between Lag 3 (M = 62.2%, 95% CI = [60.9, 63.5]) and Lag 7 (M = 81.1%, 95% CI = [78.6, 83.6]). Binomial GLMM analysis revealed a main effect of lag (i.e., an attentional-blink effect). Further, hit rates in the mixed condition were higher than in both the green and the blue contrast conditions across both lags, yielding significant differences between the color contrasts mixed and blue as well as mixed and green. Crucially, participants accomplished more hits in the blue condition than in the green condition, as confirmed by a main effect for the difference between the blue and the green contrasts. These results suggest that linguistic categorization benefited T2 detection and classification. There was no interaction of the factors lag and color contrast, and removing this interaction did not decrease but slightly increased model fit (ΔAIC = −3, ΔBIC = −18). Taken together, these results confirm the predicted hit rate pattern depending on color contrast (i.e., mixed > blue > green).
Experiment 1: Generalized-Linear-Mixed-Model Statistics for Mean Hit Rates
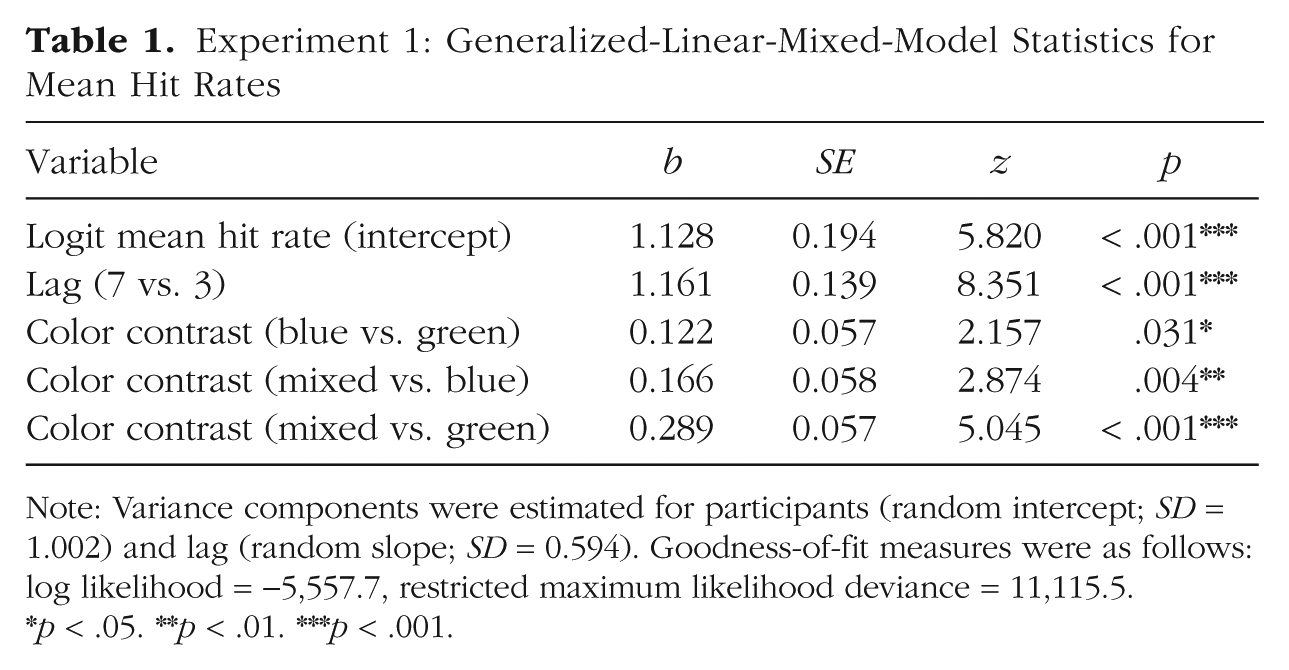
Note: Variance components were estimated for participants (random intercept; SD = 1.002) and lag (random slope; SD = 0.594). Goodness-of-fit measures were as follows: log likelihood = −5,557.7, restricted maximum likelihood deviance = 11,115.5.
p < .05. **p < .01. ***p < .001.
To test the presence of the categorical-perception effect also specifically for Lag 3, in which the attentional-blink effect was observed and to which ERP analyses were restricted (see the Procedure subsection in the Method section), we recomputed the same GLMM, but with color contrast nested within lag. As shown in Figure 2, the hit rate in the mixed condition (64.7%) was higher than in the blue condition (62.5%, b = 0.15, z = 2.50, p = .013) and the green condition (59.4%, b = 0.29, z = 4.69, p < .001). Importantly, the statistical difference between the blue and green conditions was also observed within Lag 3 (b = 0.13, z = 2.18, p = .030).
EEG results
We analyzed effects of color contrast in Lag 3 hit trials, focusing on components associated with early visual processing (P1) and encoding of targets into visual working memory (N2). For both components, we selected a posterior region of interest consisting of electrodes Oz, O1, O2, POz, PO3, PO4, PO7, and PO8. On average, the P1 peaked between 100 ms and 140 ms, and the N2 peaked between 220 ms and 300 ms.
In the P1, mean amplitude was larger in the blue condition compared with the green and the mixed conditions (see Fig. 3). Table 2 displays the coefficients of the fixed effects, standard errors, and t values, as well as estimates of the square root of the variance components (SD) and goodness-of-fit parameters of the LMM analysis. The LMM analysis revealed a significant difference between the color contrasts blue and green. There was no significant difference between the color contrasts mixed and green, but a statistical trend for the difference between mixed and blue.
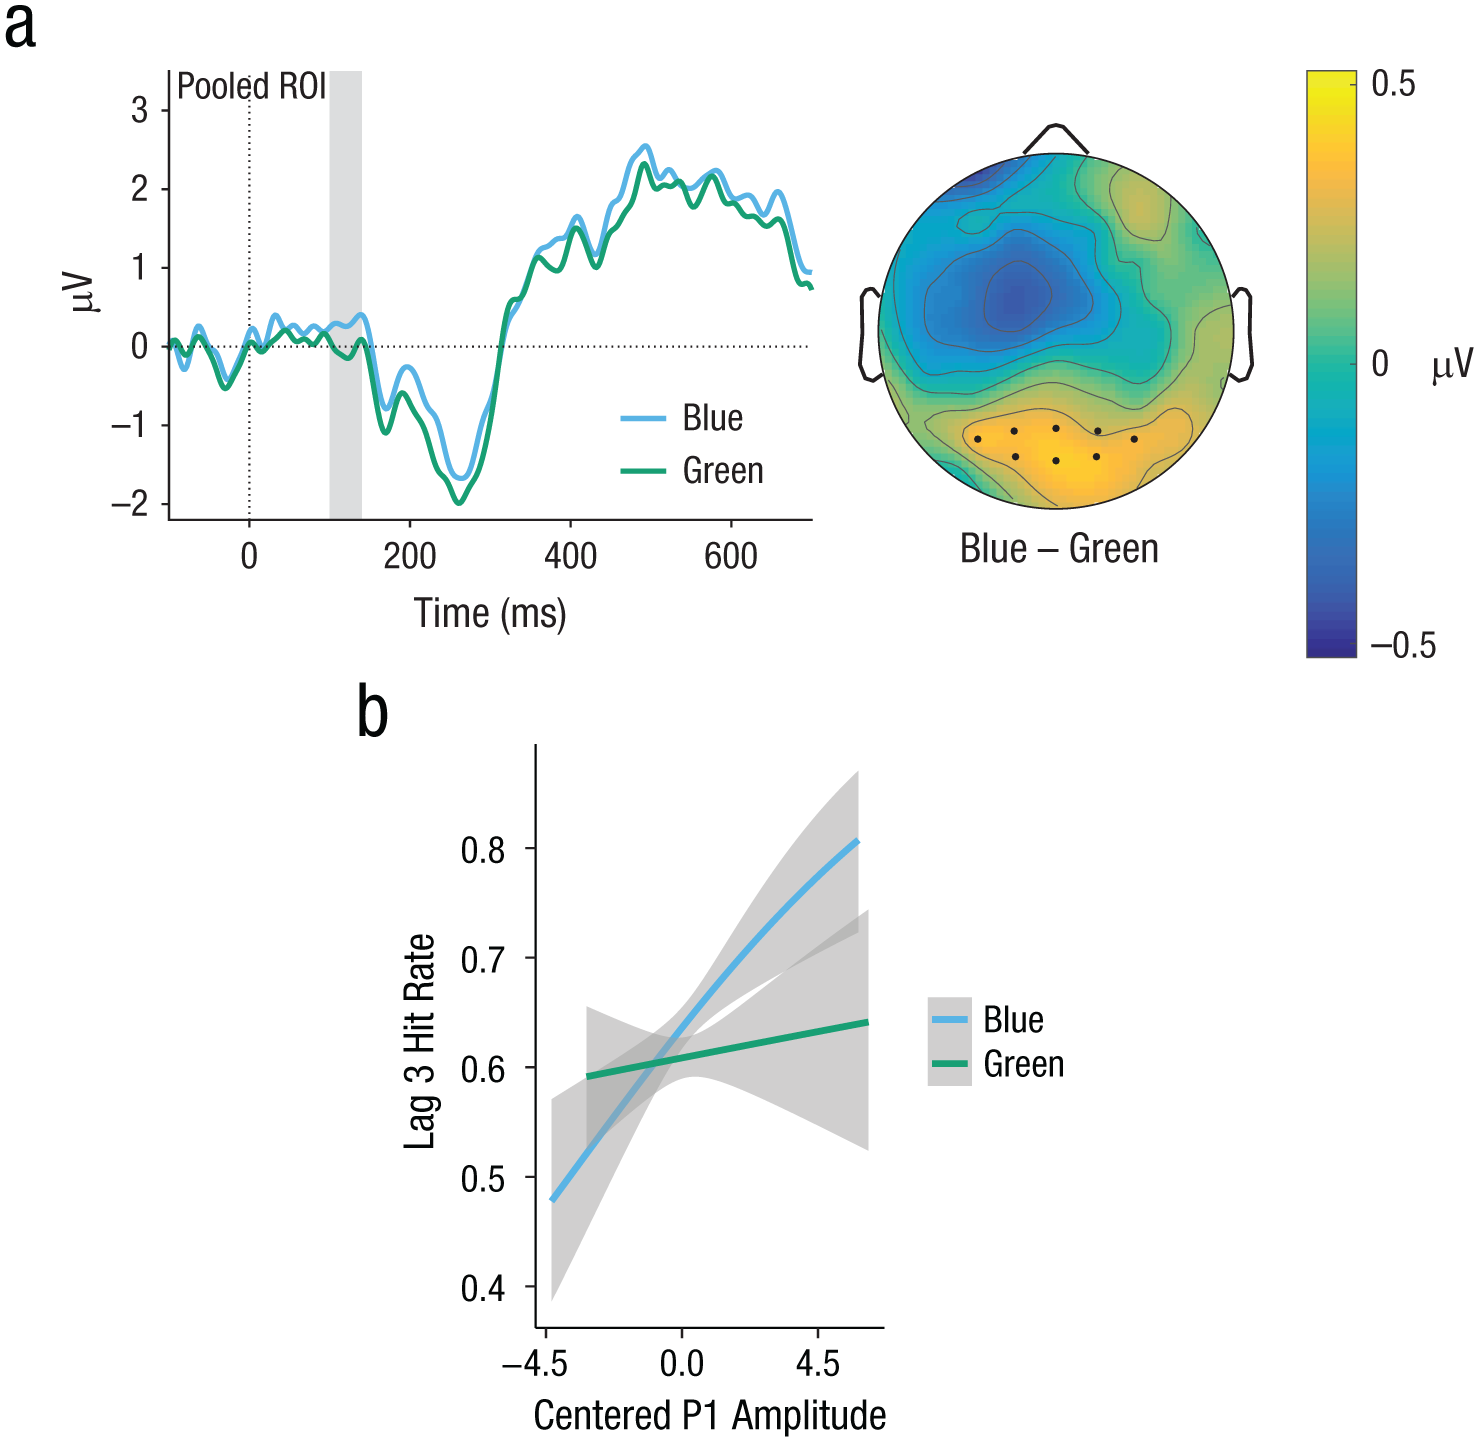
Experiment 1: event-related-potential (ERP) results in the P1 component (gray-shaded region). ERP curves (a) are shown for hits in the blue and green color-contrast conditions, along with a topographical differences map (blue vs. green). To make ERP components stand out more clearly, we plotted ERP curves with the Target 2–absent condition subtracted from each curve, which removes most of the activity related to Target 1 processing and noise resulting from the rapid serial visual presentation. Region-of-interest (ROI) electrodes are marked by dots. The graph (b) shows the predicted partial effect of the association between P1 and task performance (interaction of P1 Amplitude × Color Contrast). Note that the regression lines shown are not necessarily straight because logit-transformed hit rates were back transformed for plotting. Gray shading indicates 95% confidence intervals.
Experiment 1: Linear-Mixed-Model Statistics for Mean Event-Related-Potential Amplitudes in the P1 and N2 Time Windows
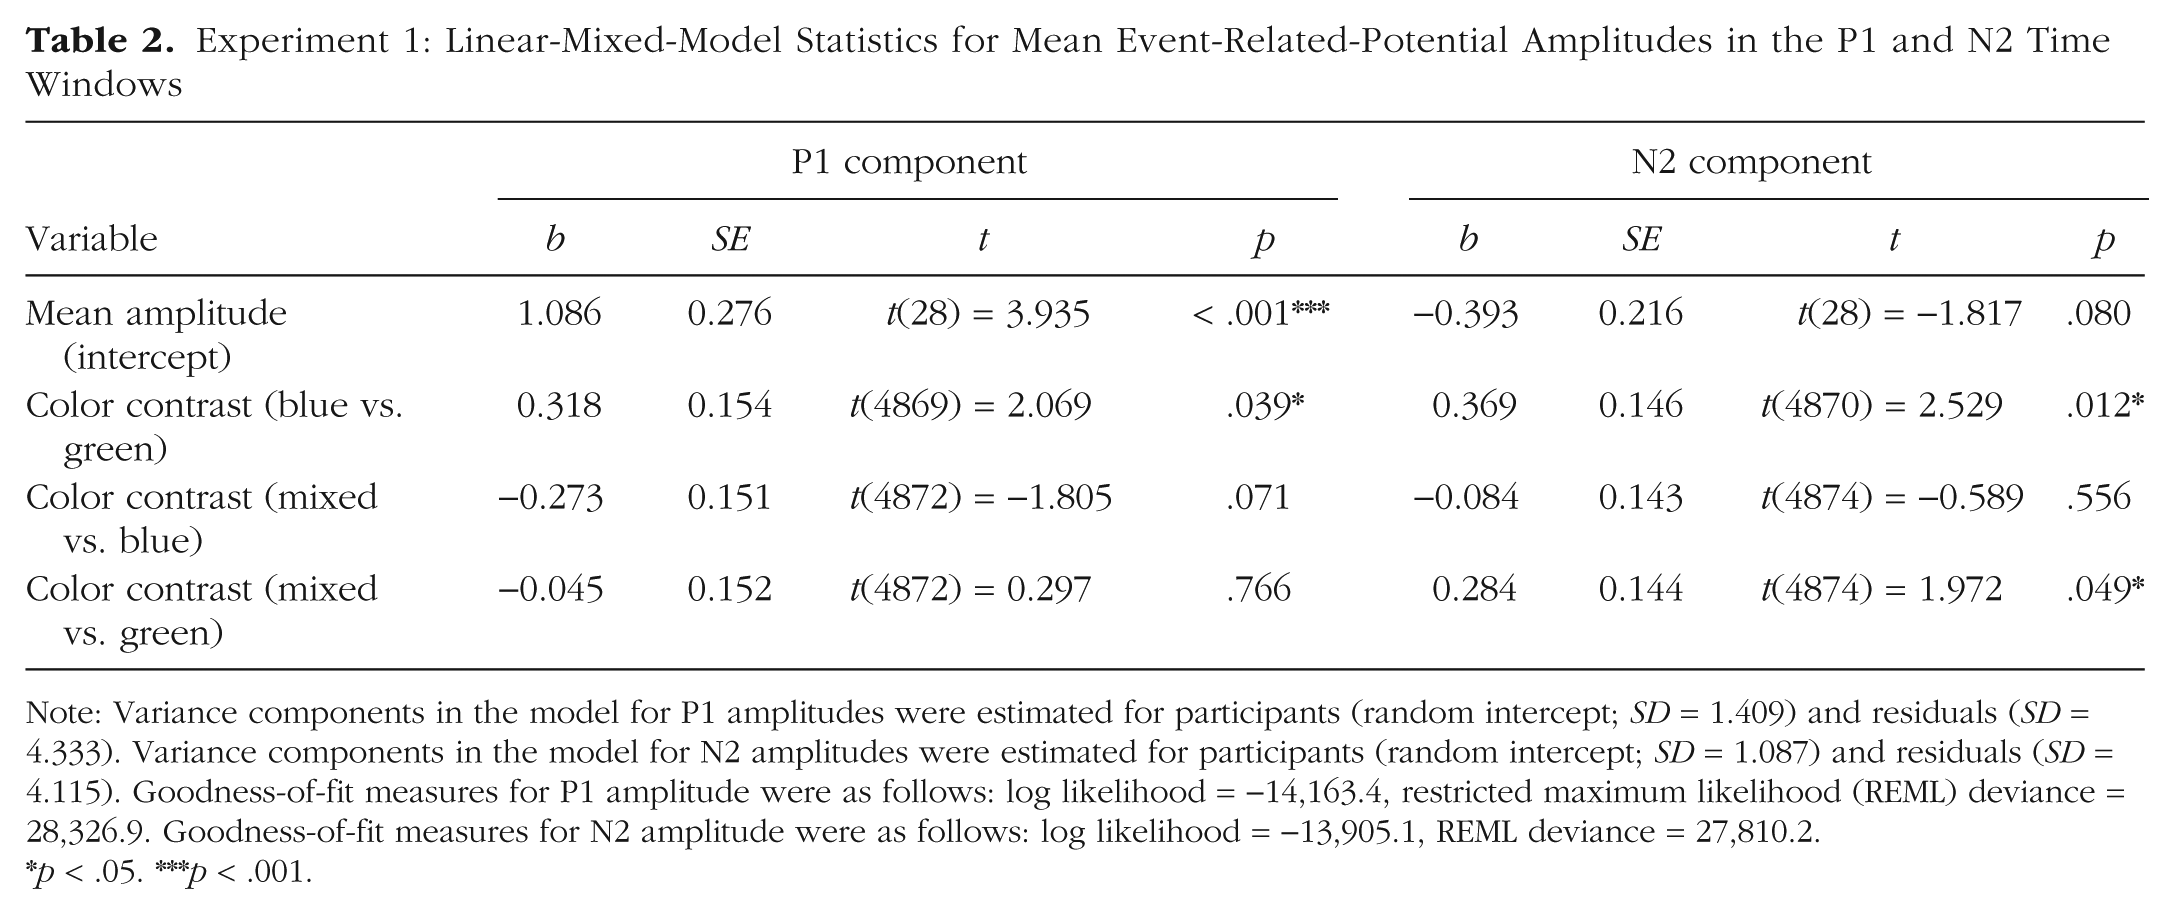
Note: Variance components in the model for P1 amplitudes were estimated for participants (random intercept; SD = 1.409) and residuals (SD = 4.333). Variance components in the model for N2 amplitudes were estimated for participants (random intercept; SD = 1.087) and residuals (SD = 4.115). Goodness-of-fit measures for P1 amplitude were as follows: log likelihood = −14,163.4, restricted maximum likelihood (REML) deviance = 28,326.9. Goodness-of-fit measures for N2 amplitude were as follows: log likelihood = −13,905.1, REML deviance = 27,810.2.
p < .05. ***p < .001.
In the N2, mean amplitudes in both the mixed and the blue conditions were reduced compared with the green condition (see Fig. 4). The LMM analysis revealed a significant difference between the color contrasts mixed and green as well as blue and green, but no significant difference between mixed and blue (see Table 2).
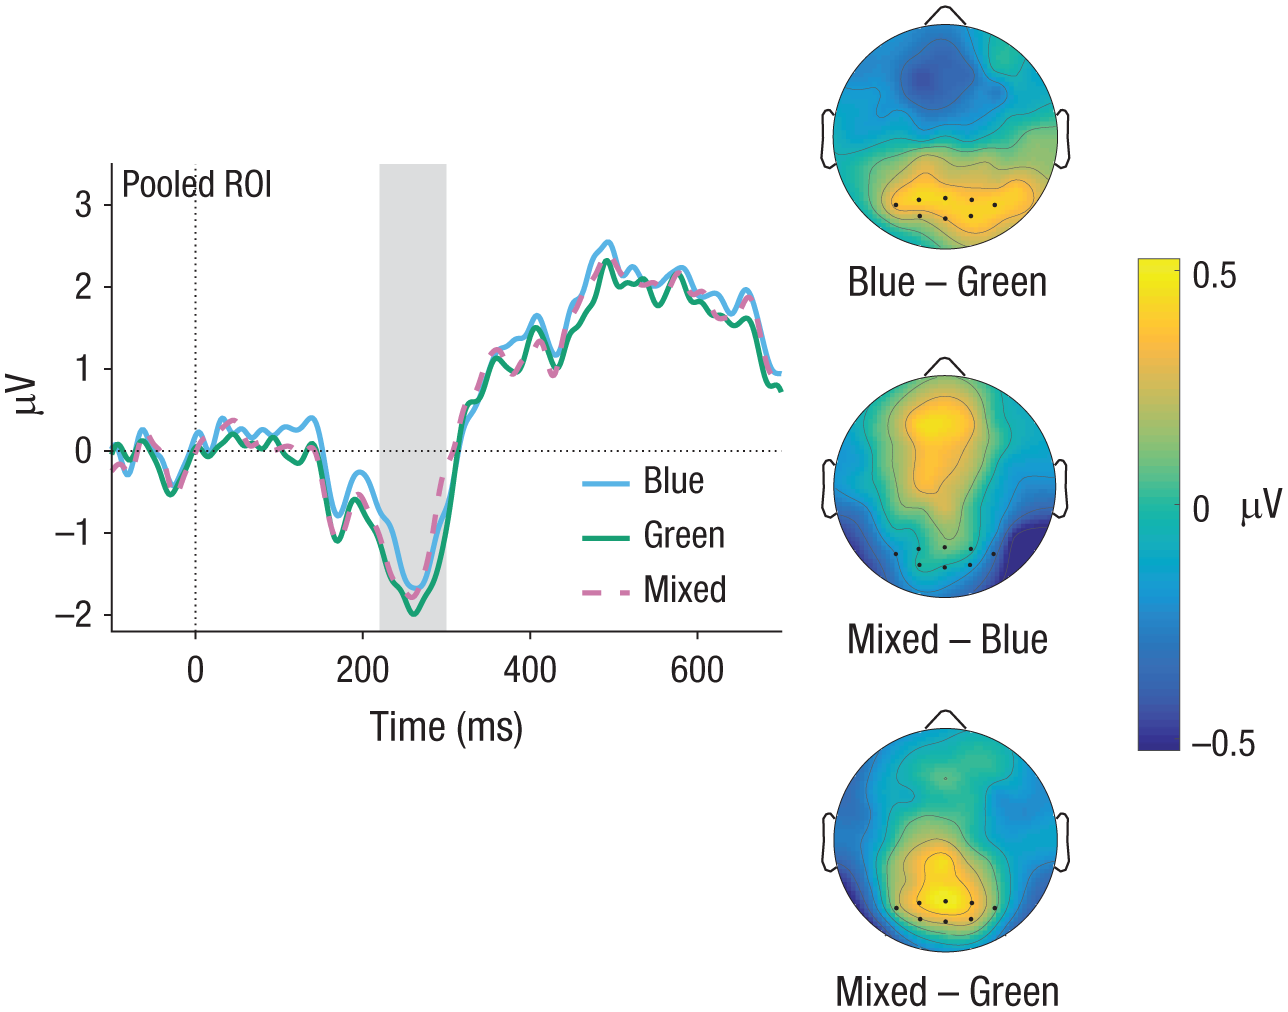
Experiment 1: event-related-potential (ERP) results in the N2 time window (gray-shaded area). ERP curves are shown for hits for the blue, green, and mixed color contrasts. The topographical difference maps show results for the contrasts of blue versus green, mixed versus blue, and mixed versus green. To make ERP components stand out more clearly, we subtracted the ERP of the Target 2–absent condition from each curve. Region-of-interest (ROI) electrodes are marked by dots.
To specifically test the association between the effects of color contrast in ERPs and detection behavior, we entered P1 amplitude and N2 amplitude as covariables in a binomial GLMM to predict hit rates. There were main effects of both P1 amplitude (b = 0.09, z = 2.93, p = .003) and N2 amplitude (b = −0.28, z = −8.79, p < .001). Further, there was an interaction of color contrast (blue vs. green) × P1 amplitude (b = 0.14, z = 2.19, p = .029). This means that the larger P1 in processing blue targets compared with green targets was associated with facilitated conscious perception of T2. Figure 3b illustrates the predicted partial effect of this interaction. There were no interactions between color contrast and N2 amplitude, and removing them improved model fit (ΔAIC = −7.3, ΔBIC = −36.2).
Discussion
Results showed a classical attentional-blink effect. As predicted, the increased chromatic stimulus contrast in the mixed condition benefited T2 detection. Crucially, the linguistic distinction of light and dark shades of blue enhanced detection rates compared with the matched green contrast.
ERPs revealed further evidence for categorical-perception effects on visual consciousness. The blue and green contrast conditions diverged in the P1 and N2 components. Additionally, we observed an effect of the mixed contrast compared with the green contrast in the N2. The P1 effect is in line with previous studies (Forder et al., 2017; Maier et al., 2014; Thierry et al., 2009), extending evidence on categorical perception in early visual processing to the attentional-blink paradigm. The early onset in the P1 suggests that categorical perception can indeed be a genuine perceptual effect.
The N2 showed relative amplitude reductions in color contrasts associated with higher T2 hit rates (i.e., mixed and blue compared with green). This time window being crucial for visual consciousness, this suggests a link between detection behavior and electrophysiological differences in the processing of T2s with different color contrasts.
We specified the relation between electrophysiological signatures and behavior by testing the predictive value of the ERP effects for T2 detection. P1 and N2 amplitudes predicted conscious perception of T2. Whereas the association of the N2 and the attentional-blink effect is well established, the P1 has not been seen as a primary correlate of conscious perception in the attentional blink (Sergent et al., 2005). This might be different here because of the color-contrast manipulation. Indeed, as a core finding, the larger P1 amplitude for T2s in the blue condition compared with the green condition predicted T2 detection. To our knowledge, this establishes the first direct link between early neural signatures of categorical perception and a perceptual benefit. Linguistic modulations of early visual processing thus have the potential to induce behavioral changes. We argue that color terminology increased the salience of the blue contrast in native Greek speakers because of linguistic warping of perceptual space, facilitating recognition of visual features (e.g., a triangle). This should provide blue T2s with a head start in the competition for visual consciousness.
Experiment 2
In Experiment 1, the green contrast was used as a control condition for the blue contrast, both colors being measured as equally salient according to the Munsell color system as in previous studies (e.g., Thierry et al., 2009). Thus, with the green contrast as a control, Experiment 1 was a valid test of categorical perception. However, inaccuracy of measuring or the Munsell color system itself could still have induced differences in bottom-up salience, independently of linguistic categories. To rule out this alternative, we replicated the experiment with native German speakers who make no basic-level distinction between the two shades of blue. They should have shown an equal attentional-blink effect for blue and green stimuli in behavior and electrophysiological correlates. Reduced attentional-blink effects in the chromatically more salient mixed condition observed in Experiment 1 should have been replicated.
Method
All materials, EEG recording procedures, and data-analysis methods were the same as those used in Experiment 1.
Participants
Thirty-eight healthy participants with normal or corrected-to-normal vision and normal color vision volunteered for the study. Participants were native German speakers who had been monolingual at least until the age of 5 years. They provided written informed consent prior to participation. The study was conducted according to the principles expressed in the Declaration of Helsinki and was approved by the local ethics committee. Participants received either course credit or monetary compensation of €8 per hour. Data from 5 participants were excluded on the basis of predefined task-performance criteria (below 50% T1 performance or above 50% false alarms in target-absent trials in the Lag 3 condition). Data from another 4 participants were excluded on the basis of their individual color naming (sorting light and dark blue into different categories). Importantly, although native German speakers can, of course, distinguish verbally among shades of blue (e.g., sky blue, ultramarine blue), there is only one basic-level category, unlike in Greek or Russian. Greek and Russian speakers must verbally distinguish light and dark blue (Winawer et al., 2007). The final sample consisted of 29 right-handed participants (15 female, 14 male; age: M = 27.03 years, SD = 4.76).
Procedure
Experiment 2 followed the same procedure as Experiment 1, except that all written forms and instructions were given in German.
Results
Color naming
All participants in the final sample placed light and dark blue stimuli into the same category (see Fig. 5). Similar to the performance of the Greek speakers of Experiment 1, most of the participants (79.3%) placed the green stimuli into the same category.
Experiment 2: behavioral results. The number of participants who sorted shades of blue and shades of green into the same category and different categories is shown in (a). German speakers’ hit rates in the attentional-blink task (b) are shown for each lag and color contrast. The difference between Lags 3 and 7 is the attentional-blink effect. Error bars represent 95% confidence intervals. Asterisks indicate significant differences (*p < .05, ***p < .001).
Behavioral results
Mean T1 accuracy was 83.1% (95% CI = [82.5, 83.7]). In T2-absent trials, the mean correct rejection rate was 92.0% (95% CI = [90.9, 93.1]). General task performance was thus comparable with that of Experiment 1. Only T2-present trials in which T1 was correctly identified were selected for further analysis. We first tested for the presence of an attentional-blink effect and effects of color contrast on hit rates. Table 3 displays the model estimates for this binomial GLMM analysis. In line with an attentional-blink effect, mean hit rates differed between Lag 3 (58.8%, 95% CI = [57.5, 60.1]) and Lag 7 (80.9%, 95% CI = [78.3, 83.5]; see Fig. 5). Hit rates in the mixed contrast condition were higher than in both the green and the blue contrast conditions, yielding significant differences between the color contrasts mixed and blue as well as mixed and green. Crucially, there was no effect for the difference between the blue and green color contrasts. This pattern was confirmed within Lag 3, with a higher hit rate in the mixed condition (60.3%) compared with the blue condition (58.0%, b = 0.14, z = 2.18, p = .030) as well as the green condition (58.2%, b = 0.12, z = 1.97, p = .049). As predicted, there was no difference between the blue and the green conditions (b = −0.01, z = −0.21, p = .832).
Experiment 2: Generalized-Linear-Mixed-Model Statistics for Mean Hit Rates
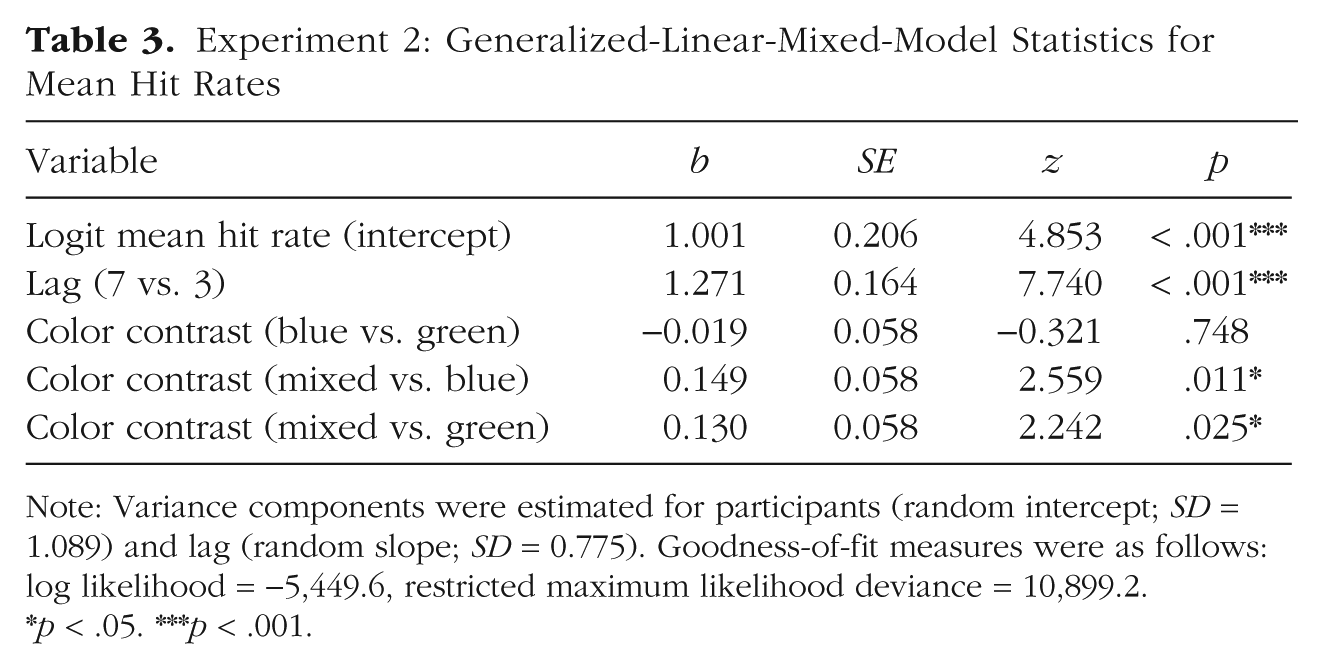
Note: Variance components were estimated for participants (random intercept; SD = 1.089) and lag (random slope; SD = 0.775). Goodness-of-fit measures were as follows: log likelihood = −5,449.6, restricted maximum likelihood deviance = 10,899.2.
p < .05. ***p < .001.
EEG results
On average, the P1 peaked slightly later in Experiment 2 compared with Experiment 1 (120–170 ms vs. 100–140 ms, respectively). Entering the same time window as in Experiment 1 (100–140 ms) did not change the pattern of results. As shown in Figure 6 and Table 4, P1 amplitudes did not differ as a function of color contrast.
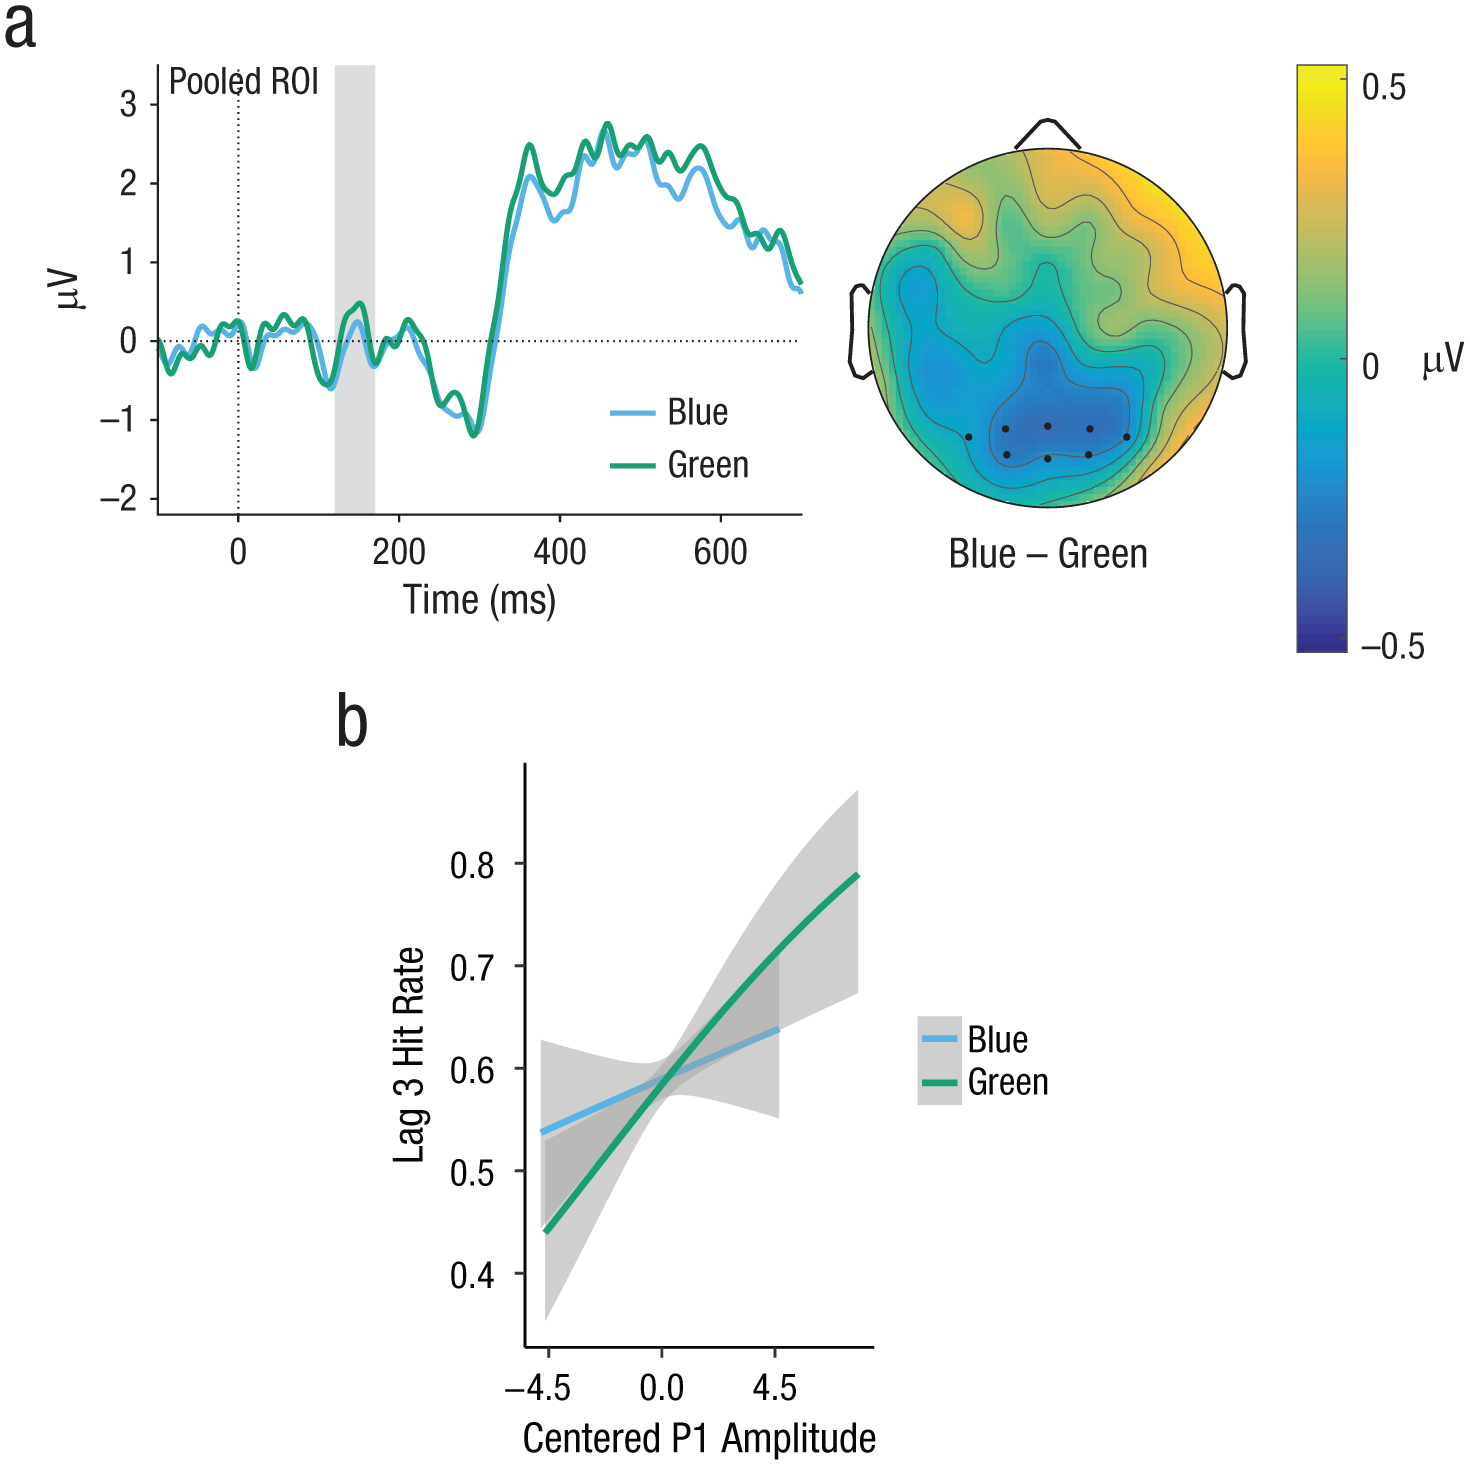
Experiment 2: event-related-potential (ERP) results in the P1 component (gray-shaded region). ERP curves (a) are shown for hits in the blue and green color-contrast conditions, along with a topographical differences map (blue vs. green). To make ERP components stand out more clearly, we subtracted the ERP of the Target 2–absent condition from each curve. Region-of-interest (ROI) electrodes are marked by dots. The graph (b) shows the predicted partial effect of the association between P1 and task performance (interaction of P1 Amplitude × Color Contrast). Note that the regression lines shown are not necessarily straight because logit-transformed hit rates were back transformed for plotting. Gray shading indicates 95% confidence intervals.
Experiment 2: Linear-Mixed-Model Statistics for Mean Event-Related-Potential Amplitudes in the P1 and N2 Time Windows
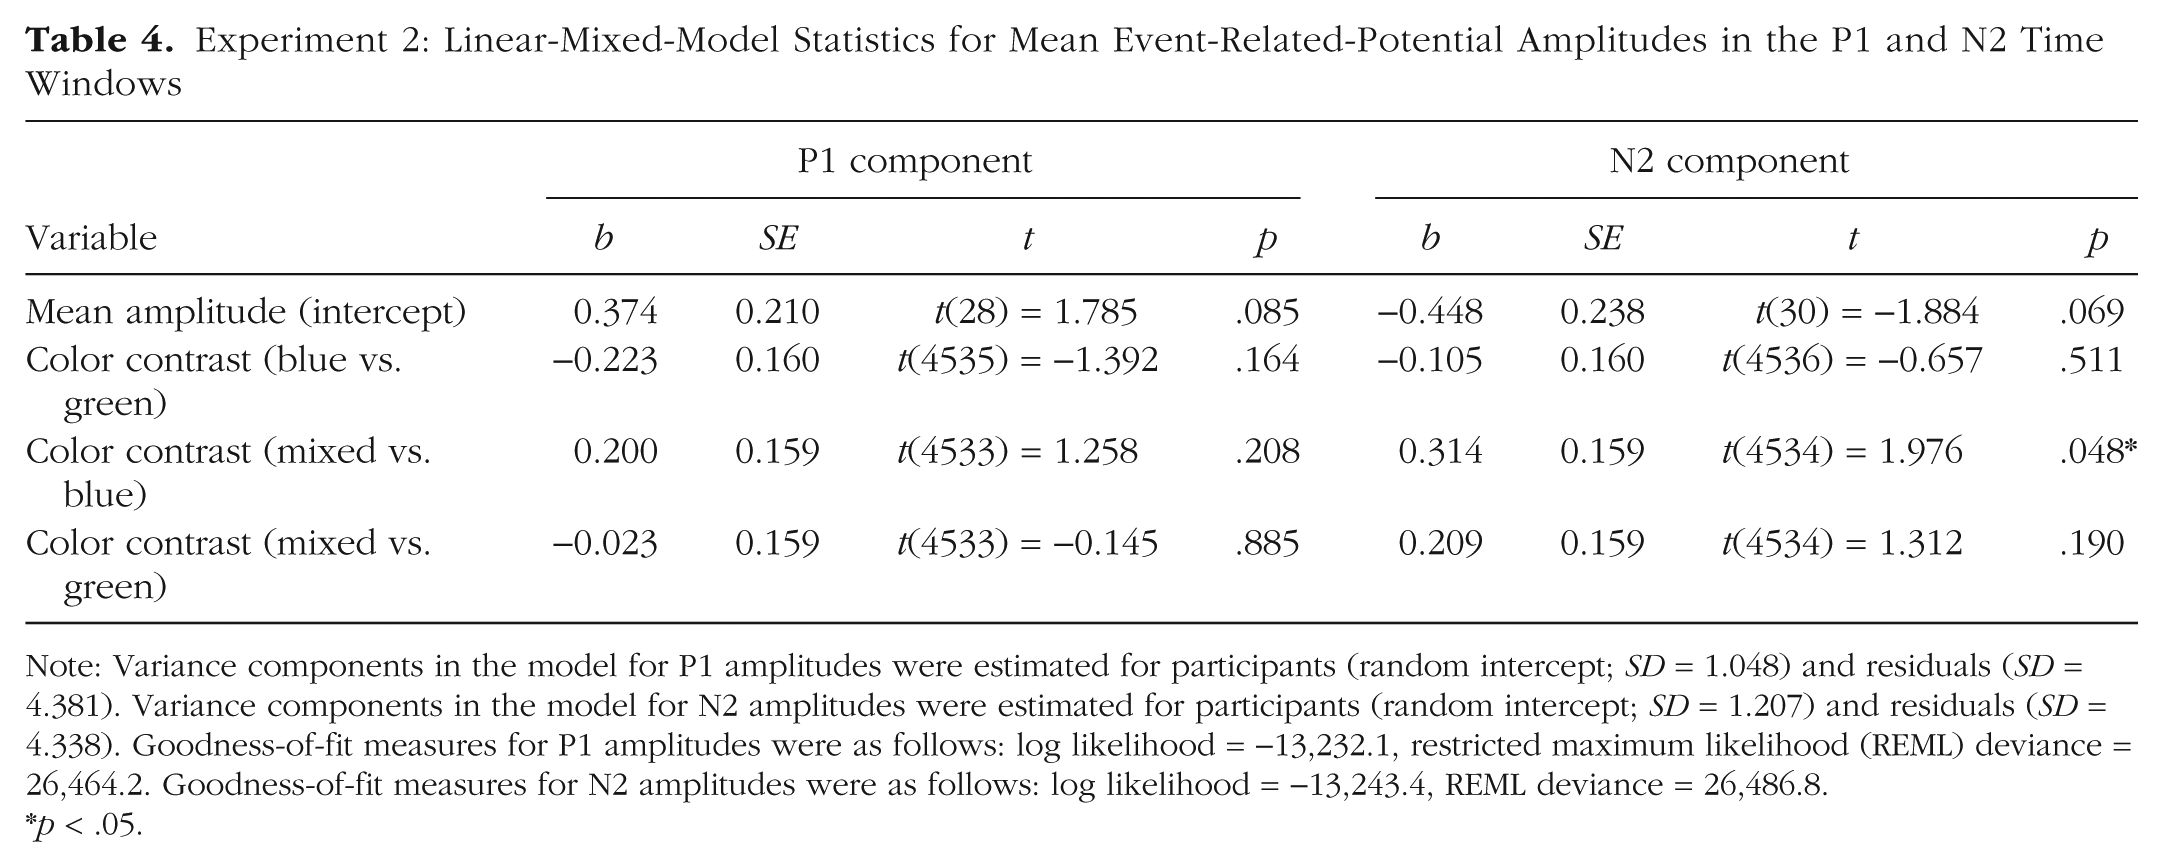
Note: Variance components in the model for P1 amplitudes were estimated for participants (random intercept; SD = 1.048) and residuals (SD = 4.381). Variance components in the model for N2 amplitudes were estimated for participants (random intercept; SD = 1.207) and residuals (SD = 4.338). Goodness-of-fit measures for P1 amplitudes were as follows: log likelihood = −13,232.1, restricted maximum likelihood (REML) deviance = 26,464.2. Goodness-of-fit measures for N2 amplitudes were as follows: log likelihood = −13,243.4, REML deviance = 26,486.8.
p < .05.
Next, we tested for effects of color contrast on the amplitude of the N2 in the time window between 220 ms and 300 ms (for detailed results of the LMM analysis, see Table 4). As depicted in Figure 7, N2 amplitude was lowest in the mixed condition. LMM analysis revealed a significant difference between the color contrasts mixed and blue, but no significant difference between mixed and green or blue and green.
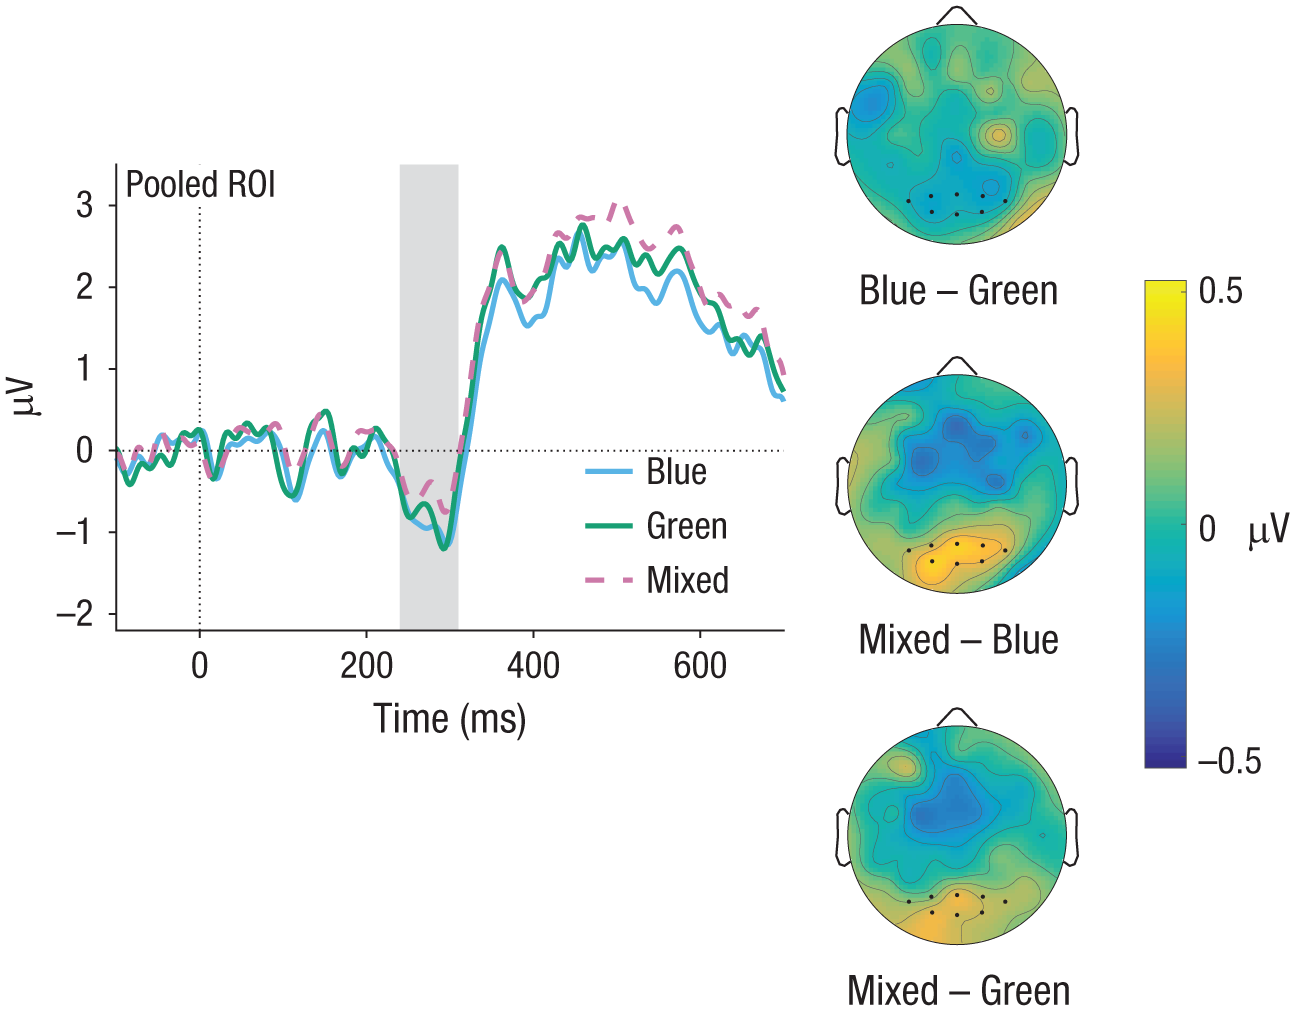
Experiment 2: event-related-potential (ERP) results in the N2 time window (gray-shaded area). ERP curves are shown for hits for the blue, green, and mixed color contrasts. The topographical difference maps show results for the contrasts of blue versus green, mixed versus blue, and mixed versus green. To make ERP components stand out more clearly, we subtracted the ERP of the Target 2–absent condition from each curve. Region-of-interest (ROI) electrodes are marked by dots.
Testing for associations between ERP components and behavior revealed main effects of P1 amplitude (b = 0.13, z = 3.93, p < .001) as well as N2 amplitude (b = −0.25, z = −7.82, p < .001), replicating the results of Experiment 1. There were, however, no interactions between color contrast and P1 amplitude or N2 amplitude. Removing the interactions from the formula did not decrease but increased model fit (ΔAIC = −4.5, ΔBIC = −53.3).
Tables S1 and S2 in the Supplemental Material available online summarize additional analyses of the ERP data and ERP–behavior associations containing experiment as a factor, yielding significant by-experiment interactions for all categorical-perception effects.
Discussion
Experiment 2 revealed no differences among the blue and the green conditions in behavior, the P1 component, the N2 component, and the association between P1 and behavior—all of which had been observed in Experiment 1. German speakers did show the expected behavioral advantage in the mixed condition that served as a manipulation check, suggesting that language-independent salience of color contrast had a similar effect in all participants. As in Experiment 1, P1 and N2 were associated with conscious perception of T2, but not differentially for the different color contrasts. Given these results, the categorical-perception effects in Experiment 1 cannot be attributed to stimulus confounds.
Experiment 3
To probe the robustness of the novel finding that native language promotes access to visual consciousness, we ran a preregistered behavioral replication study (osf.io/ke82p). We recruited native Russian speakers, who also make a basic-level linguistic distinction between light and dark shades of blue (goluboy vs. siniy; Winawer et al., 2007). We expected to replicate the pattern of hit rates observed in Greek speakers.
Method
Participants
An a priori power analysis based on the categorical-perception effect size observed in Greek speakers (b = 0.12) yielded an optimal sample size of 45 participants. To acquire 45 valid data sets according to the preregistered inclusion criteria, we tested 58 healthy participants with normal or corrected-to-normal vision and normal color vision. Participants were native Russian speakers who had been monolingual at least until the age of 5 years. They provided written informed consent prior to participation. The study was conducted according to the principles expressed in the Declaration of Helsinki and was approved by the local ethics committee. Participants received either course credit or monetary compensation of €8 per hour. Data from 9 participants were excluded on the basis of predefined task performance criteria (below 50% T1 performance or above 50% false alarms in target-absent trials in the Lag 3 condition). One participant was excluded because of insufficient T2 performance, detecting only one T2 overall. Data from another 2 participants were excluded on the basis of their individual color naming (sorting light and dark blue into the same category). The final sample consisted of 46 right-handed participants (38 female, 8 male; age: M = 24.59 years, SD = 5.67).
Procedure
Experiment 3 followed the same procedure as Experiments 1 and 2, except that all written forms and instructions were given in Russian, and no EEG data were collected.
Results
Color naming
All participants in the final sample placed light blue and dark blue stimuli into different categories. Naming of green colors was somewhat more varied than in Greek and German speakers in Experiments 1 and 2 (same category for light and dark green in 63.0% of participants, compared with 75.0% and 79.3%, respectively).
Behavioral results
General task performance was comparable with performance in Experiments 1 and 2, with a mean T1 accuracy of 86.0% (95% CI = [85.5, 86.5]) and a mean correct rejection rate of 89.8% (95% CI = [88.8, 90.8]). Only T2-present trials in which T1 was correctly identified were selected for further analysis. We tested for effects of lag and color contrast on hit rates. GLMM model estimates are summarized in Table 5. In line with the attentional-blink effect, hit rates were lower in the Lag 3 condition (63.3%, 95% CI = [62.3, 64.3]) than in the Lag 7 condition (80.2%, 95% CI = [78.2, 82.2]). Replicating the results from Experiments 1 and 2, the hit rate was highest in the mixed contrast condition. Crucially, confirming the predicted categorical-perception effect, results showed that Russian speakers performed better in the blue contrast condition compared with the green contrast condition (see Table 4).
Experiment 3: Generalized-Linear-Mixed-Model Statistics for Mean Hit Rates
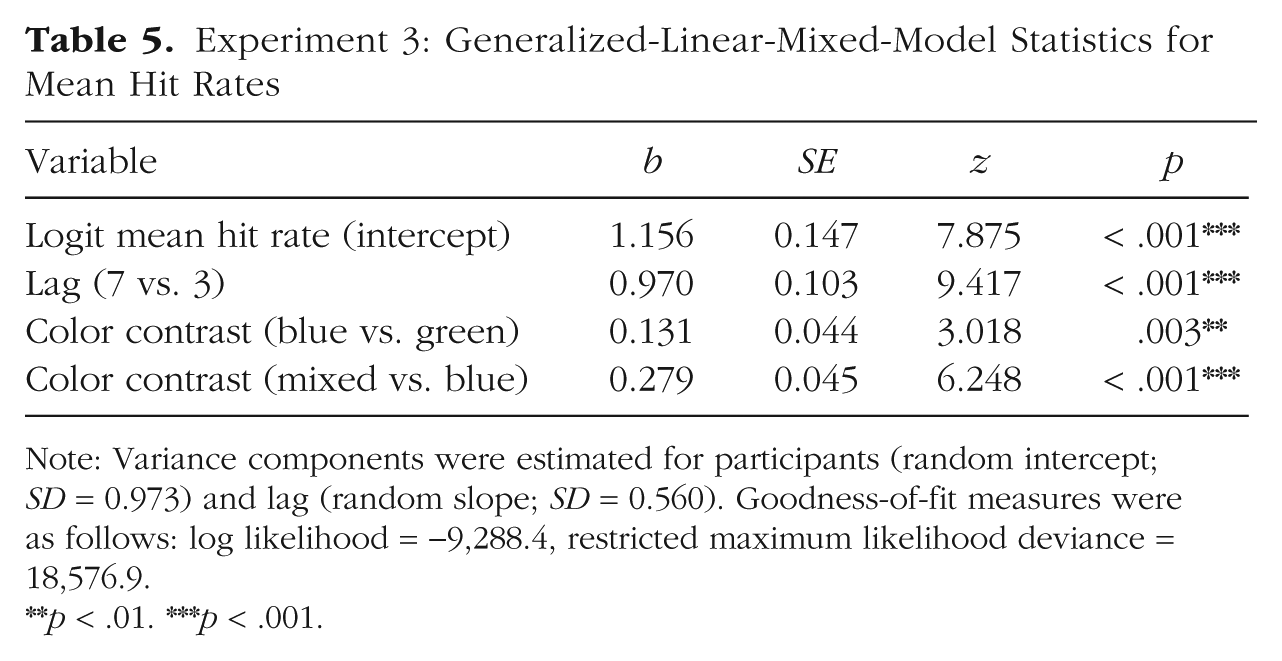
Note: Variance components were estimated for participants (random intercept; SD = 0.973) and lag (random slope; SD = 0.560). Goodness-of-fit measures were as follows: log likelihood = −9,288.4, restricted maximum likelihood deviance = 18,576.9.
p < .01. ***p < .001.
Hit rates per lag and color contrast are illustrated in Figure 8. There was no interaction of lag and color contrast, and excluding the interaction term did not decrease but increased model fit (ΔAIC = −3, ΔBIC = −19). As in Experiment 1, to confirm the presence of the categorical-perception effect specifically for Lag 3, we computed the binomial GLMM again with color contrast nested within lag. Confirming the predicted pattern, results showed that hit rates were higher in the blue contrast condition (62.5%) compared with the green contrast condition (59.6%, b = 0.138, z = 2.958, p = .003), and higher in the mixed contrast condition compared with the blue contrast condition (67.8%, b = 0.284, z = 5.951, p < .001). Thus, all predictions were confirmed.
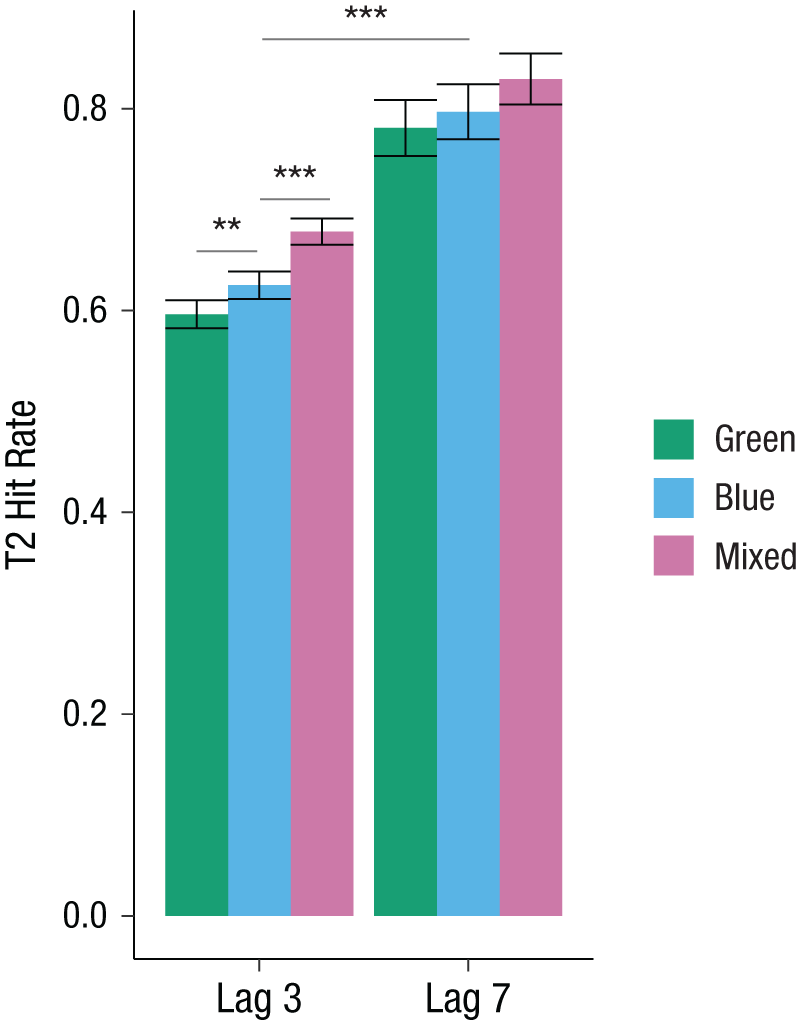
Experiment 3: attentional-blink task performance of native Russian speakers: hit rates for each lag and color contrast. The difference between Lags 3 and 7 is the attentional-blink effect. Error bars represent 95% confidence intervals. Asterisks indicate significant differences (**p < .01, ***p < .001).
To test cross-linguistic differences in the influence of color contrast on the attentional-blink effect, we analyzed hit rates across Experiments 1 to 3 with the factor language. To this end, Greek and Russian speakers, who distinguish categorically between shades of blue, were grouped together and tested against German speakers. The final GLMM included the factor lag only as a main effect because the model including the interaction term failed to converge. The mixed contrast benefited performance in both language groups, as confirmed by a main effect for the difference between the mixed and blue color contrasts. Completing the picture of the behavioral results, an interaction of Language × Color Contrast (blue vs. green) showed that the blue contrast benefited performance in the group of Greek and Russian speakers, but not German speakers. The GLMM estimates are summarized in Table 6.
Generalized-Linear-Mixed-Model Statistics for Hit Rates With the Factor Language
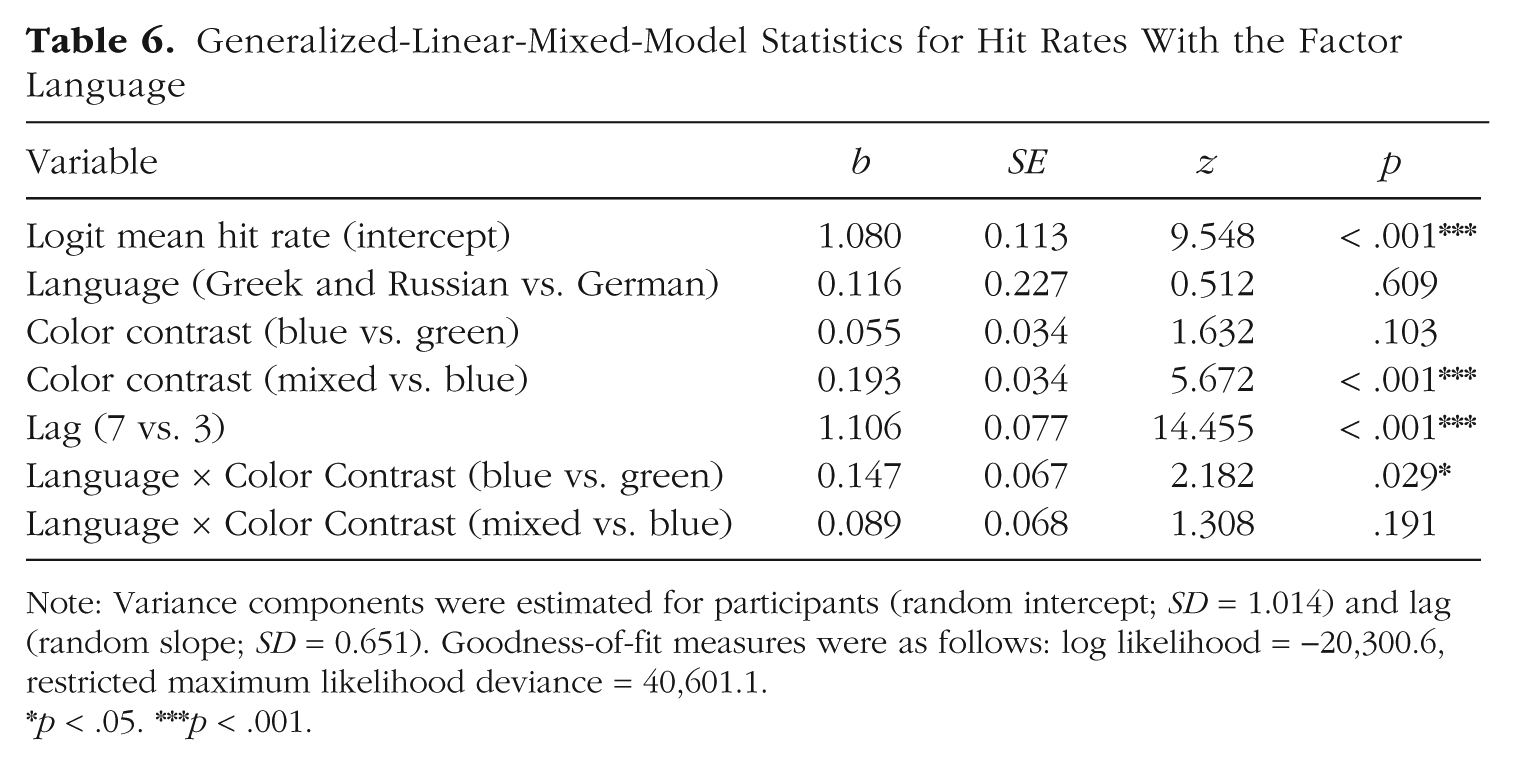
Note: Variance components were estimated for participants (random intercept; SD = 1.014) and lag (random slope; SD = 0.651). Goodness-of-fit measures were as follows: log likelihood = −20,300.6, restricted maximum likelihood deviance = 40,601.1.
p < .05. ***p < .001.
Table S3 in the Supplemental Material summarizes the results of an additional GLMM analysis of hit rates across Experiments 1 to 3, confirming that the size of the overall attentional-blink effect was comparable in all experiments.
Discussion
Experiment 3 replicated the findings of Experiment 1 with a different participant group, native Russian speakers. This speaks to the robustness of the behavioral consequence of categorical perception for visual consciousness. Having two different basic-level terms for shades of blue increases the chances of perceiving targets containing this contrast in the attentional-blink paradigm.
General Discussion
The present results show for the first time that color categorical perception can facilitate the access of a stimulus to conscious perception. This significantly extends previous reports that verbal cues (e.g., “pumpkin”) help bring initially suppressed visual stimuli (e.g., a pumpkin) into consciousness during continuous flash suppression (Lupyan & Ward, 2013). Here, no verbal cues were presented, demonstrating effects of implicitly coactivated linguistic categories. This rules out explicit verbal priming and, because color contrasts were task irrelevant, postperceptual decision biases.
With a reduction of the attentional-blink effect of about 3%, the behavioral categorical-perception effect was small but statistically robust and reproducible. Still, the advantage of the mixed condition over the green condition (containing increased bottom-up and top-down linguistic contrasts) was only around 5% to 8%, setting an upper limit for the purely linguistically induced effects. Furthermore, Greek and Russian speakers lived in Germany at the time of the experiment, and 25% of Greek and 37% of Russian speakers sorted the green stimuli into different categories, which may have weakened categorical perception (Athanasopoulos, Dering, Wiggett, Kuipers, & Thierry, 2010).
The idea that cognitive influences concern perception proper is controversial (Firestone & Scholl, 2016), which is why we measured neural signatures of perceptual processing. EEG and the well-described functional significance of visual ERP components such as the P1 provide tools for fine-grained temporal descriptions of different aspects of perception. Here, the effect in the P1 component clearly associates categorical perception with early stages of visual perception (Forder et al., 2017; Maier et al., 2014; Thierry et al., 2009). Our results therefore provide evidence for cognitive penetrability of perception (Lupyan, 2017) to factors such as categorization on the basis of the language one speaks.
Generalizability
The target population consisted of speakers who were monolingual at least until the age of 5 years. Effects might differ for early bilinguals. Our findings should be generalizable to other color contrasts and languages with differences in basic-level color terms (e.g., shades of green in Korean; Roberson, Pak, & Hanley, 2008). A direct replication should take time spent in the second-language environment and second-language proficiency into account during recruitment, include only participants actually making the color distinction of interest, and “activate” participants’ native language before the main task (see the Procedure sections). We have no reason to believe that the results depend on other characteristics of the participants, materials, or context.
Conclusion
We extended the literature on the relation between language and perception by describing a new phenomenon: Our native language—and the color categories we apply within it—can influence whether we consciously perceive a stimulus or not. A possible mechanism behind this effect is linguistic warping of perceptual space, which enables top-down modulations of the brain processes that lead to conscious perception. Language therefore seems to play an active role in perception and helps to optimize it in the long run.
Supplemental Material
MaierOpenPracticesDisclosure – Supplemental material for Native Language Promotes Access to Visual Consciousness
Supplemental material, MaierOpenPracticesDisclosure for Native Language Promotes Access to Visual Consciousness by Martin Maier and Rasha Abdel Rahman in Psychological Science
Supplemental Material
MaierSupplementalMaterial – Supplemental material for Native Language Promotes Access to Visual Consciousness
Supplemental material, MaierSupplementalMaterial for Native Language Promotes Access to Visual Consciousness by Martin Maier and Rasha Abdel Rahman in Psychological Science
Footnotes
Acknowledgements
We thank C. Braun, A. Enge, K. Stark, and P. Weller for supporting data collection, Z. Kalogeropoulou and V. Chirkov for advice on Greek and Russian task instructions, and G. Kiecker for technical support.
Action Editor
Ralph Adolphs served as action editor for this article.
Author Contributions
Both authors developed the study design, discussed the results, and wrote the manuscript. M. Maier rendered the stimuli and analyzed and collected the data. Both authors approved the final manuscript for submission.
Declaration of Conflicting Interests
The author(s) declared that there were no conflicts of interest with respect to the authorship or the publication of this article.
Funding
This work was supported by German Research Foundation Grant No. AB 277-6 (to R. Abdel Rahman). M. Maier was supported by the State of Berlin with an Elsa Neumann Scholarship and the Berlin School of Mind and Brain.
Open Practices
All data have been made publicly available via the Open Science Framework and can be accessed at osf.io/sqp6z. Materials for this study have not been made publicly available. The design and analysis plan for Experiment 3 were preregistered on the OSF at osf.io/ke82p. The complete Open Practices Disclosure for this article can be found at http://journals.sagepub.com/doi/suppl/10.1177/0956797618782181. This article has received the badges for Open Data and Preregistration. More information about the Open Practices badges can be found at ![]() .
.
References
Supplementary Material
Please find the following supplemental material available below.
For Open Access articles published under a Creative Commons License, all supplemental material carries the same license as the article it is associated with.
For non-Open Access articles published, all supplemental material carries a non-exclusive license, and permission requests for re-use of supplemental material or any part of supplemental material shall be sent directly to the copyright owner as specified in the copyright notice associated with the article.