






Abstract
How do people go about reading a room or taking the temperature of a crowd? When people catch a brief glimpse of an array of faces, they can focus their attention on only some of the faces. We propose that perceivers preferentially attend to faces exhibiting strong emotions and that this generates a crowd-emotion-amplification effect—estimating a crowd’s average emotional response as more extreme than it actually is. Study 1 (N = 50) documented the crowd-emotion-amplification effect. Study 2 (N = 50) replicated the effect even when we increased exposure time. Study 3 (N = 50) used eye tracking to show that attentional bias to emotional faces drives amplification. These findings have important implications for many domains in which individuals must make snap judgments regarding a crowd’s emotionality, from public speaking to controlling crowds.
Imagine yourself pitching an idea to a group of people. As you speak, you quickly scan the audience, your attention jumping from face to face. Are people smiling? Or do they look confused, bored, or even angry? People are often tasked with making split-second judgments about the emotions of a crowd, a skill that is critically important for navigating social interactions (Sanchez-Burks & Huy, 2009; Whitney et al., 2014). But how do people draw such rapid inferences from complex social landscapes?
One candidate mechanism is ensemble coding, the process by which perceivers quickly extract representative summaries of visual information (Alvarez, 2011; Whitney & Yamanashi Leib, 2018). Some evidence suggests that when perceivers compute the ensemble properties of a set of objects, they can include information from all objects in that set through distributed attention (Baek & Chong, 2020; Sun & Chong, 2020). Ensemble representations may instead be arrived at by sampling a subset of items and using them to extrapolate summary statistics about the entire set (Allik et al., 2013; Maule & Franklin, 2016; Sweeny et al., 2013). In this latter case, perceivers appear to preferentially sample the most salient objects in a set, which in turn biases the summary percept toward extreme or amplified values (Kanaya et al., 2018).
This selective summarization yields interesting predictions for the perception of crowd emotions. Because highly emotional faces are more salient than neutral faces (Pessoa et al., 2002), ensemble coding of crowd emotions could involve preferentially attending to highly emotional expressions and using them to draw biased inferences about the entire crowd. If perceivers manifest an attentional bias toward more emotional faces, their estimation of a crowd’s overall emotion could therefore be greater than it actually is. We evaluated these predictions in the present research.
Perceiving Emotional Faces
Facial expressions provide vital clues about people’s goals and intentions, information that is crucial for successful social interactions (van Kleef, 2009). But not all expressions are equally captivating. Evidence suggests that people preferentially attend to faces conveying strong emotions over faces with neutral expressions (Eimer & Holmes, 2007; Pessoa et al., 2002). Thus, when a person infers a crowd’s emotion, attentional bias toward more emotional faces should contribute to an amplification in the average emotion estimate.
Just as emotional intensity can affect attention to faces, so too can the valence of the expression (positive or negative). If amplification occurs in the estimation of crowds’ emotions, one question is whether such amplification is larger for negative or positive emotions. Some evidence suggests that people preferentially attend to negative stimuli compared with positive stimuli (Baumeister et al., 2001; Cacioppo et al., 1997; Öhman et al., 2001; Soroka et al., 2019). Preferential attention to negative stimuli should lead to greater amplification for a set of negative compared with positive faces. However, the literature is not united in this conclusion, and some research that has focused on attention to single faces suggests that positive emotional faces are more attention grabbing, which should mean that amplification would be greater for positive than for negative emotions (Becker et al., 2011; Kosonogov & Titova, 2018).
Although these possibilities have not been directly tested, one ensemble-coding experiment that examined accuracy in classification of either happy or angry crowds (compared with neutral crowds) found that people were more accurate in classifying positive emotions, suggesting larger amplification in negative emotions (Bucher & Voss, 2018). This study, however, focused on classification without assessing whether error was systematically biased toward amplification. On the basis of the available evidence, we hypothesized that crowd amplification would be stronger for negative than for positive emotions but anticipated that this effect may be small.
Ensemble Coding
When speaking in front of a crowd or entering a room, people generate rapid evaluations of others’ emotions (Whitney et al., 2014). Although the capacity for visual representation is finite in these situations (Alvarez, 2011; Whitney & Yamanashi Leib, 2018), ensemble coding compensates for this limitation by allowing perceivers to form compressed, summary representations of visual information (Whitney et al., 2014). How these summaries are computed, however, is still a matter of debate. Whereas some researchers argue that perceivers encode all items in a distributed manner (Baek & Chong, 2020), others argue that only a subset of objects is encoded (Allik et al., 2013; Maule & Franklin, 2016), and this subset was recently evaluated as equal to the square root of the number of items in a set (Whitney & Yamanashi Leib, 2018).
Statement of Relevance
How do people rapidly estimate crowds’ emotions? Are such estimations accurate or systematically biased? These questions are relevant to many situations in which people are asked to make snap social judgments about others’ emotions. This happens when people talk in front of an audience or pitch an idea to a team and need to estimate engagement and interest. It also happens when observers evaluate whether a demonstration has gone too far, whether these observers are bystanders or police officers who need to make a decision on whether to intervene. In a series of studies, we showed that biased attention toward emotional faces leads people to overestimate the average emotions of crowds. Learning more about the situations in which people amplify crowds’ emotions and the ways in which such amplification can be mitigated not only may explain important aspects of social behavior but also may open the door to future interventions.
Whether people encode all items in a set or only a subset, it is plausible that they preferentially attend to the most salient items in a set (Kanaya et al., 2018; Sweeny et al., 2013). If this is true, an estimation of the average could be more extreme than the true mean because it would reflect oversampling or overweighting of the more salient items in the set. Kanaya and colleagues (2018) recently explored this hypothesis, examining perceivers’ accuracy in estimating the mean size of a set of circles that varied in diameter. Participants reported that the average circle size was larger than it actually was, suggesting that perceivers overweighed the largest, most salient items within the set. Furthermore, this tendency increased as more items were added to the set. According to Kanaya et al., considering the fact that people sample the square root of the number of items from a set, increasing the set size provided more opportunities for a sampling bias. These experiments provided evidence of amplification in the estimation of multiple objects (for further support for this hypothesis, see Sweeny et al., 2012). However, unlike faces, larger circles necessarily occupy more space in the visual field and are therefore more likely to receive preferential representation in retinotopic visual areas (Schwarzkopf & Rees, 2013). It is thus unclear whether a similar effect of amplification would be evident with faces.
The Present Research
We conducted a series of experiments to test three preregistered hypotheses (Studies 1 and 2: https://osf.io/6rzw4, Study 3: https://osf.io/98k26). Our first hypothesis was that participants would show a crowd-emotion-amplification effect, estimating a crowd’s average emotion as more intense than it actually is. Our second hypothesis was that the amplification effect would be stronger as the number of faces within an array increased (following Kanaya et al., 2018). Our third hypothesis was that amplification would be more robust for negative emotions than for positive emotions. However, we were more equivocal about this third prediction in light of the contradictory findings in the existing literature, especially in the second preregistration when some evidence had already been collected.
We tested these hypotheses in three studies using a task in which participants evaluated mean emotions of crowds. Study 1 tested all three hypotheses. Study 2 replicated and extended Study 1 to test whether increased exposure time represents a boundary condition to the three effects observed in Study 1. Finally, in Study 3, we used eye tracking to examine the particular pattern of attentional bias that gives rise to the crowd-emotion-amplification effect.
Study 1: Establishing the Crowd-Emotion-Amplification Effect
The goal of Study 1 was to test the crowd-emotion-amplification hypothesis by asking participants to estimate the mean emotion of sets of faces (set range = 1–12 faces) that appeared on a screen for 1 s.
Method
Participants
To evaluate the appropriate sample size for the study, we used data from a recent study on group categorization that provided initial evidence for the occurrence of amplification (Goldenberg et al., 2020, Study 2). In that study, 30 participants saw 12 faces expressing neutral to angry facial expressions on a screen for 1 s (50 trials) and were asked to evaluate the crowd’s average emotion. Results pointed to a crowd-emotion-amplification effect. However, this study consistently presented participants with 12 faces and examined only one emotion (anger). In the present study, we varied both the number of faces (using arrays that contained between one and 12 faces) and the emotions expressed by these faces (angry, happy). On the basis of these modifications, we conducted a power analysis that suggested that a sample size of 50 participants completing 150 trials would provide power of 97% to support our first hypothesis (for a detailed description, see the Supplemental Material available online). Our final sample therefore consisted of 50 participants (23 men, 27 women; age: M = 19.52 years, SD = 1.69), each of whom completed 150 trials. Participants were recruited from the Stanford University student pool and received credit for their participation. All participants were included in the analysis.
Materials
In each trial, participants first saw an array containing one to 12 faces (Fig. 1). These faces expressed different intensities of emotion from either neutral-to-angry (anger condition) or neutral-to-happy (happiness condition) continua (Fig. 2a). The group-average intensity, the valence of the faces, and the set size were all chosen randomly on each trial. We did not mix the happy and angry faces in the same set for two reasons. First, doing so could undermine our ability to detect an amplification effect: If participants fixated on one extremely negative and one extremely positive face, then on average, their estimate about the crowd could appear to be relatively accurate despite the fact that they were biased by emotional intensity in their sampling of faces. Second, the most-happy and most-angry faces were not equal in intensity (see the Supplemental Material), thus making the average between the two different from zero.

Task used in Study 1. Participants saw an array of one to 12 faces expressing different degrees of either anger or happiness; the arrays appeared on the screen for 1 s (a). Participants were then asked to evaluate the average emotion expressed by these faces by adjusting the intensity of a single morphed face on a scale from 1 to 50 (b).
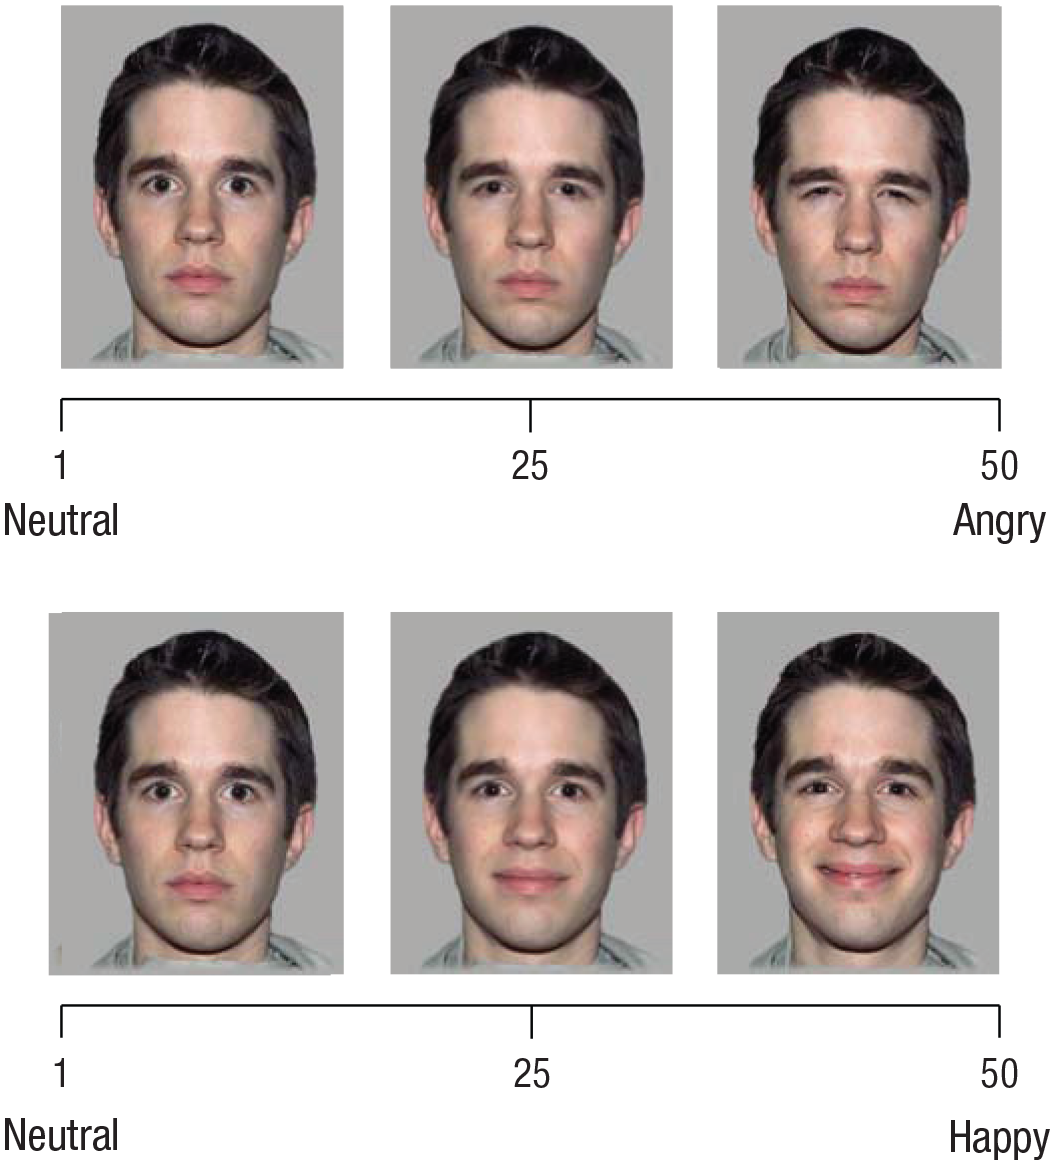
A sample of three faces from the neutral-to-angry scale (top) and from the neutral-to-happy scale (bottom) that were used in the studies. Values of 25 and 50 correspond to 50% and 100% intensities in our morph range, respectively.
For each continuum of face arrays, we used a set that was developed for a recent investigation of ensemble face perception (Elias et al., 2017). Fifty modifications of a face were concatenated, from neutral to extremely angry and from neutral to extremely happy, effectively creating a visual rendering of 50-point anger or happiness scales (Fig. 1). This was performed for four exemplar faces from the NimStim face set (Tottenham et al., 2009), creating eight different continua, four neutral to positive and four neutral to negative, each ranging from 1 to 50. We conducted a pretest to confirm that the evaluation of a single face was accurate, finding no amplification effect for a single-face evaluation (see the Supplemental Material).
On every trial, an array containing between one and 12 faces was presented to participants. Faces could appear in any of 12 fixed locations on the screen, chosen randomly. In each trial, each fixed location was randomly jittered 15 pixels in one direction (up, down, left, right) to make sure that participants were not tracking the exact locations of the faces. Critically, arrays depicted only one of the four identities (Fig. 1a) so that the estimation of average emotion would be as simple as possible and could be done using a scale with the same facial identity as the set. Furthermore, this ensured that any effect of crowd estimation could not be caused by participants attending to some identities in a crowd more than others.
The group’s mean emotional intensity was randomly set to be between 10 and 40 (on the basis of a 50-point scale of angry or happy faces, 1 being neutral and 50 being very angry or very happy). We limited the range of the group means in order to allow distributions of intensity that were as close to uniform as possible within the 50-point scale. The sets were engineered so that the standard deviation of a 12-face array was always 10, from which we randomly chose a subset of one to 12 faces. All of the faces were of White men. However, our results were not moderated by participants’ race or gender (see the Supplemental Material).
To prevent residual visual processing, we immediately followed each face in the array with a mask at the same location. Each mask was generated by dividing an emotional face from our face space into 70 rectangular pieces and then randomly shuffling the locations of these pieces. This approach ensured that the emotional faces and scrambled masks resembled each other in terms of low-level image characteristics. Each mask appeared for 250 ms.
After viewing the face array and the mask, participants were asked to evaluate the average emotion expressed in the array. So participants could make their evaluations, we presented a single face bearing a neutral expression on the screen after the array was masked (Fig. 2b). The identity of the scale face matched that of the previous array and was always anchored on a neutral expression: 1 on the scale from 1 to 50. This was done because previous research indicates that the initial location of the scale in ensemble-coding tasks led to an anchoring effect; specifically, estimations were closer on average to that initial location (e.g., Oriet & Brand, 2013). Our approach provided a conservative measure of amplification by starting each scale at neutral. Moving the mouse from left to right transformed the face from a neutral face to an angry or happy face (on a scale from 1 to 50; see Fig. 2). Participants had as much time as they needed to estimate each group’s mean intensity of emotion.
After completing the main task, participants filled out a short survey that included an abbreviated version of the Social Interaction Anxiety Scale (SIAS-6; Peters et al., 2012), the Need to Belong Scale (Leary et al., 2013), a personality scale (Gosling et al., 2003), and demographic questions including age, gender, race, and education level. These scales were administered for exploratory purposes (i.e., to examine potential moderators of the crowd-emotion-amplification effect), so the corresponding results are reported in the Supplemental Material.
Procedure
Ethics-committee approval was obtained prior to the collection of data. Participants were told that they would take part in a study designed to test whether people can identify the average emotional expressions of crowds. After receiving instructions and completing a practice run, participants performed a task adapted from a previous ensemble-coding task (Elias et al., 2017). The task included 150 trials. After viewing each face array for 1 s (following a 250-ms mask), participants were asked to estimate the mean emotion expressed by the faces in the set.
Results
We tested three hypotheses (for exploratory analyses, see the Supplemental Material). To measure amplification in estimation of the face sets, we conducted a mixed-model analysis of repeated measures, comparing the actual mean emotion expressed in each set with participants’ estimated mean emotion. As each participant was exposed to four face identities, we added two random intercepts: face identity and participant. Supporting the crowd-emotion-amplification hypothesis, results showed that the estimated mean crowd emotion was 2.87 points higher (scale from 1 to 50) than the actual mean crowd emotion, b = 2.87, 95% confidence interval (CI) = [2.53, 3.21], SE = 0.17, t(14533) = 16.8, p < .001, R2 = .05. 1
We used a single model to test whether an increase in the number of faces (Hypothesis 2) or the type of emotions expressed by the faces (Hypothesis 3) influenced the crowd-emotion-amplification effect. This allowed us not only to reduce the number of comparisons but also to test the interaction between the two variables. For our dependent variable, we created a difference score between participants’ estimation of the mean crowd emotion and the actual mean crowd emotion for each trial; positive numbers indicated amplification. We then conducted a mixed-model analysis for repeated measures, with number of faces, valence of the faces, and their interaction predicting the degree of the difference between estimated and actual mean emotions. As in our previous analysis, we included random intercepts of face identity and participant.
Results were in line with our second hypothesis: Number of faces significantly predicted an increase in amplification, b = 0.42, 95% CI = [0.21, 0.64], SE = 0.03, t(7233) = 3.86, p < .001, R2 = .08 (Fig. 3). 2 Supporting our third hypothesis, results showed that amplification was stronger for crowds expressing negative emotions than crowds expressing positive emotions, b = 0.24, 95% CI = [0.02, 0.45], SE = 0.11, t(7253) = 2.18, p = .02, R2 = .08. The interaction between number of faces and the valence expressed by the faces was not significant, b = 0.08, 95% CI = [−0.13, 0.30], SE = 0.11, t(7226) = 0.76, p = .44, R2 = .08.
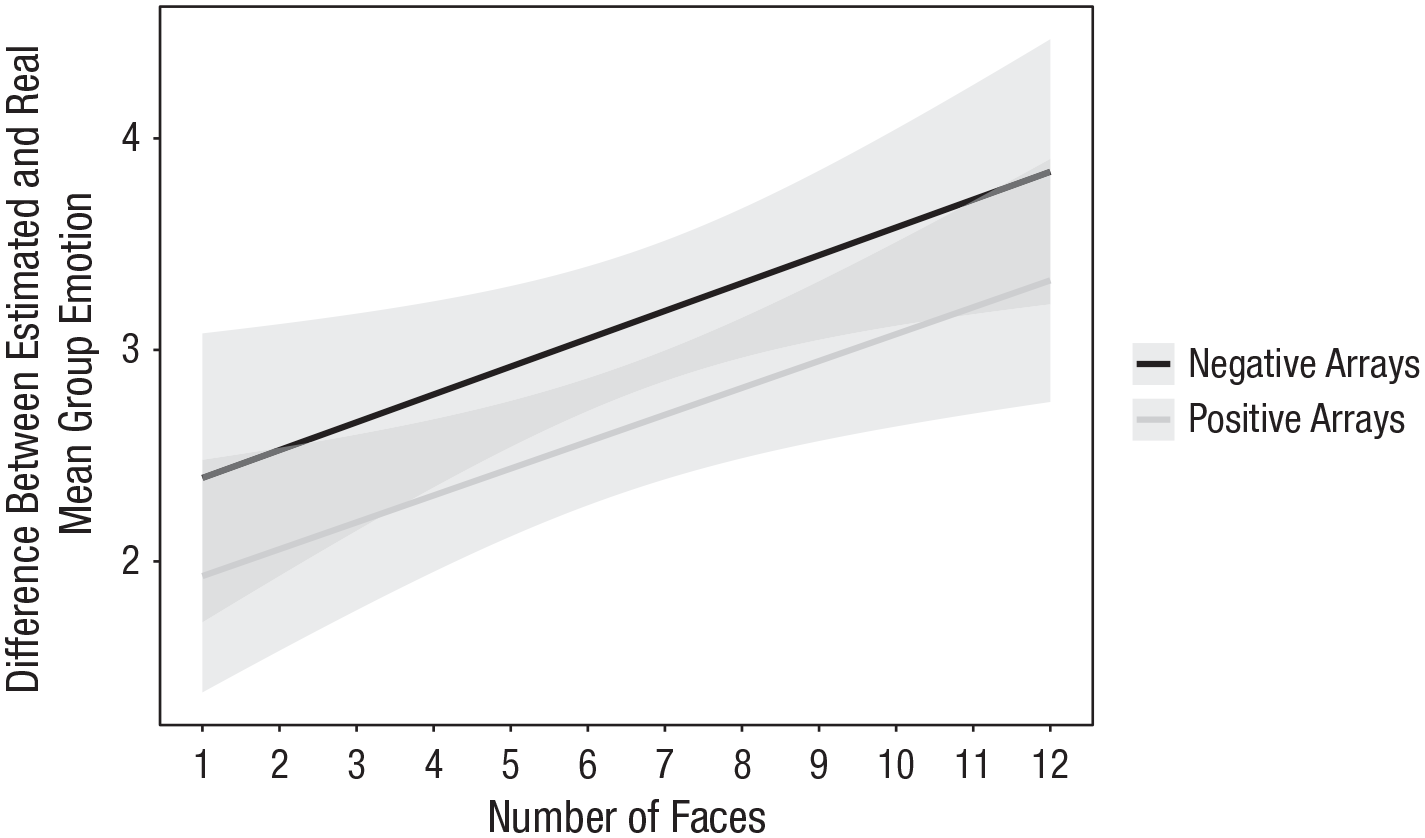
Difference between estimated and real mean emotions (estimated – real) for positive and negative face arrays as a function of number of faces in Study 1. Gray areas represent standard errors.
In sum, participants estimated that face sets were more emotional than they actually were, amplification increased with set size, and amplification was stronger for negative compared with positive emotions. We hasten to note, however, that this third effect was relatively weak, which is congruent with mixed results in the related literature. By what mechanism does our amplification effect arise? Is it driven by participants running out of time after making only one or two fixations so that the effect would be attenuated if participants had more time? One possibility is that increased exposure would allow participants to look at more faces in the set, thus affording them a larger sample from which to estimate the average, potentially minimizing or eliminating the amplification effect. However, a second possibility is that increased exposure would allow more time to fixate on more intense faces, which would instead increase the degree of amplification. We compared these predictions in Study 2 by varying exposure time.
Study 2: Modifying Exposure Time
The goal of Study 2 was to assess whether the crowd-emotion-amplification effect varied as a function of exposure time.
Method
Participants
We estimated that 50 participants completing 150 trials, as in Study 1, would provide more than 80% power to examine the crowd-emotion-amplification effect. Our final sample therefore included 50 participants (17 men, 33 women; age: M = 19.07 years, SD = 1.04). Participants were recruited using the Stanford University student pool and received credit for their participation in the task. No participants were removed from the analysis.
Measures
Measures were identical to those in Study 1.
Procedure
Ethics-committee approval was obtained prior to the collection of data. The procedure was identical to that of Study 1 with one difference: We manipulated the exposure to the face arrays to be 1.0 s, 1.4 s, or 1.8 s (50 trials per each exposure condition within participants).
Results
To test our first hypothesis and measure amplification in the estimation of the face sets, we conducted a mixed-model analysis of repeated measures, comparing the actual mean crowd emotion expressed in each set with the estimated mean crowd emotion, as we had done in Study 1 (collapsing across exposure conditions). Results indicated that the estimated mean crowd emotion was 2.39 points higher (on our scale from 1 to 50) than the actual mean crowd emotion, b = 2.39, 95% CI = [2.06, 2.71], SE = 0.16, t(15531) = 14.36, p < .001, R2 = .03, again supporting the crowd-emotion-amplification-effect hypothesis.
Having replicated the crowd-emotion-amplification effect, we set out to test Hypotheses 2 and 3 as well as the effect of time on amplification in one model. First, we reexamined whether a greater number of faces would lead to increased amplification. Second, we asked, once again, whether amplification would be stronger for negative versus positive emotions. Third, we considered whether amplification would be larger for longer exposure times. As in Study 1, we created a difference score between participants’ estimation of the mean crowd emotion and the actual crowd emotion for each trial; a positive number indicated an amplification in participants’ estimation of the mean. We then conducted an analysis similar to that of Study 1.
Supporting our second hypothesis (and replicating Study 1’s findings), results indicated that the number of faces significantly predicted the difference score, b = 0.28, 95% CI = [0.07, 0.48], SE = 0.10, t(7591) = 2.66, p = .01, R2 = .08. Supporting our third hypothesis (and replicating Study 1’s findings), results suggested that amplification was stronger for face sets expressing negative emotions than for face sets expressing positive emotions, b = 0.26, 95% CI = [0.05, 0.46], SE = 0.10, t(7594) = 2.47, p = .01, R2 = .08. As in Study 1, the interaction between valence and number of faces was nonsignificant, b = 0.07, 95% CI = [−0.13, 0.28], SE = 0.10, t(7595) = 0.72, p = .47, R2 = .08. Finally, looking at whether amplification was stronger or weaker depending on exposure time, we examined time as a continuous variable, showing that longer presentation times led to an overall increase in amplification, b = 0.84, 95% CI = [0.21, 1.48], SE = 0.10, t(7595) = 2.62, p = .01, R2 = .08.
To learn more about the effect of time on amplification, we examined a model in which exposure time was converted to a categorical variable. To maintain the principle of k − 1 comparisons, we decided to compare the 1.0-s condition with both the 1.4-s and 1.8-s conditions. To further understand whether the effect of time on amplification was moderated by the valence or by number of faces, we added an interaction term between exposure time and valence.
Looking first at the main effect of time, we observed that amplification was not significantly different between the 1.0-s and 1.4-s trials, b = 0.02, 95% CI = [−0.46, 0.53], SE = 0.25, t(7587) = 0.11, p = .91. However, amplification at the 1.8-s condition was significantly larger compared with the 1.0-s condition, b = 0.65, 95% CI = [0.15, 1.16], SE = 0.25, t(7586) = 2.54, p = .01. Increasing exposure time led to stronger amplification, at least for the 1.8-s condition.
Next, we examined our interaction between categorical exposure time and valence. The interaction between 1.0 s and 1.4 s and valence was nonsignificant, b = 0.20, 95% CI = [−0.30, 0.71], SE = 0.25, t(7592) = 0.80, p = .42, but the interaction between 1.0 s and 1.8 s and valence was significant, b = −0.53, 95% CI = [−0.02, −1.04], SE = 0.25, t(7593) = −2.06, p = .04. To understand the interaction better, we centered our model on different exposure times to test the difference between positive and negative faces for each duration (Fig. 4). Results suggest that both for the 1.0-s exposure, b = 0.38, 95% CI = [0.02, 0.74], SE = 0.18, t(7591) = 2.10, p = .03, and for the 1.4-s exposure, b = 0.59, 95% CI = [0.23, 0.94], SE = 0.18, t(7591) = 3.23, p = .001, the difference between positive and negative faces was significant. However, when participants were exposed to the face set for 1.8 s, there was no difference between the two valence conditions, b = −0.15, 95% CI = [−0.50, 0.21], SE = 0.18, t(7594) = −0.82, p = .41. These results suggest that any attentional differences associated with valence disappear when participants can observe the crowd for longer periods of time (but that the overall amplification effect persists).
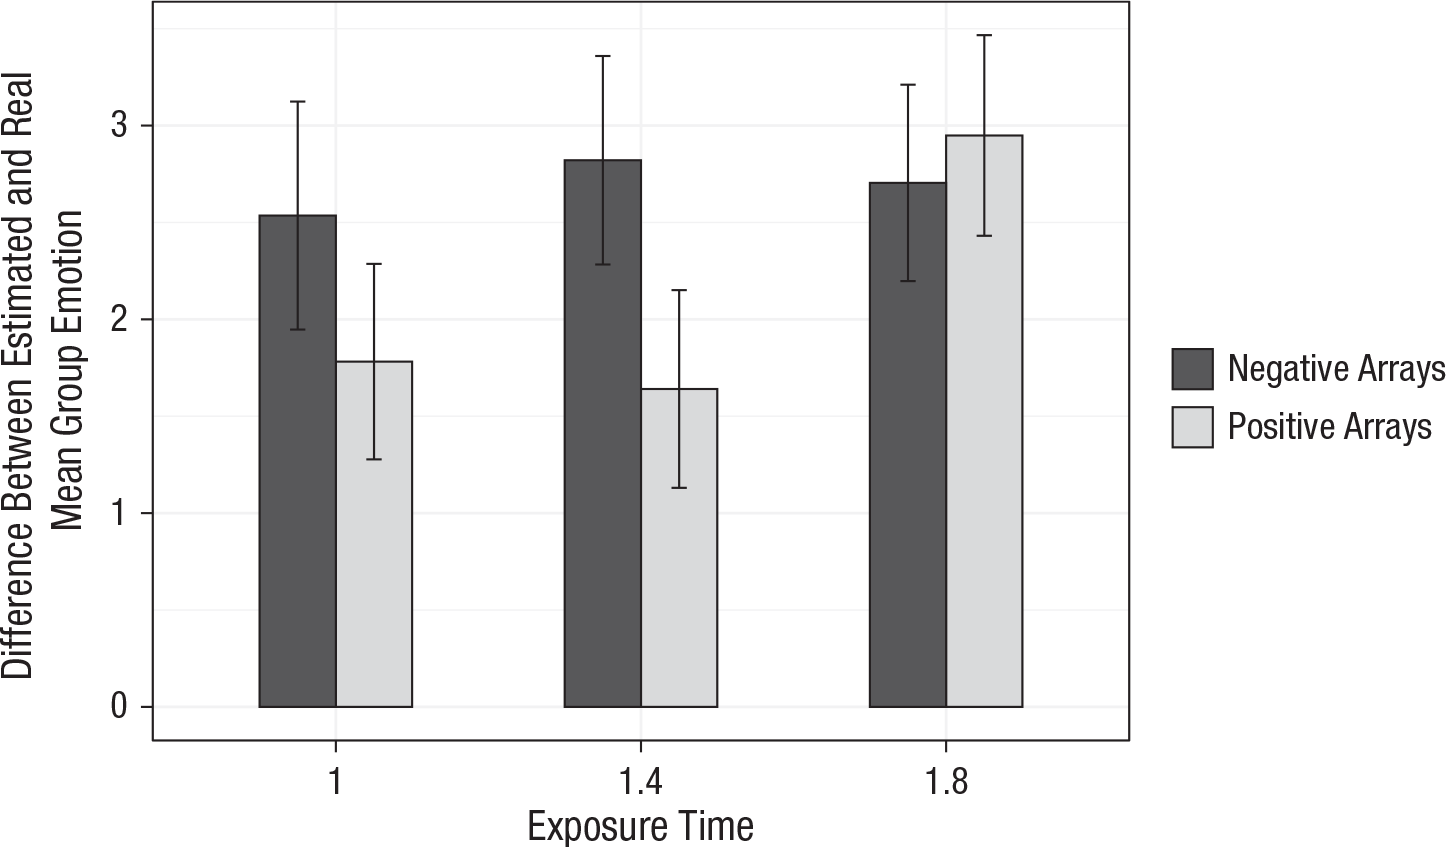
Difference between estimated and real mean emotions (estimated − real) for positive and negative face arrays for each of the three exposure times in Study 2. Error bars represent 95% confidence intervals.
Overall, Study 2 replicated all of the results of Study 1 and revealed that longer exposure to the face set—within the limit of 1.8 s—led to greater amplification (this was driven more by the positive faces). One interpretation of these findings is that longer exposure increased attentional bias: Participants spent more time looking at the more emotional faces. However, this interpretation can be supported only by a direct examination of fixation durations during the task, which we decided to examine via eye tracking in Study 3.
Study 3: Understanding the Mechanism for Amplification Using Eye Tracking
The goal of Study 3 was to explore the proposed attention-bias mechanism driving the crowd-emotion-amplification effect using eye tracking.
Method
Participants
As in Studies 1 and 2, we recruited 50 participants who completed 150 trials (11 men, 39 women; age: M = 22.26 years, SD = 3.55). Participants were recruited using the Harvard University paid subject pool and received $15 or course credit for participating in the study for 1 hr.
Measures
Our measures were identical to those in Studies 1 and 2 but also included the measures of eye movement and gaze described below.
Procedure
Ethics-committee approval was obtained prior to the collection of data. The task was the same as that of Study 1 with two differences. First, participants underwent eye tracking while completing this task. Second, each array featured 12 faces (instead of a variable number of faces). This was done to maximize our ability to track users’ attention when they were looking at a crowd. The 12 faces in each array were generated slightly differently from how they were created in Studies 1 and 2 to allow changes in the array variance; each face was randomly chosen from the scale from 1 to 50, forming a normal distribution of the mean array.
In addition to this study and to use the hour that participants spent in the lab, we asked them to complete an additional study that was designed for a different publication. This study was done after participants completed the 150 trials and took a short break.
Eye-tracking apparatus
Participant eye gaze was recorded using an EyeLink 1000 Plus eye tracker (SR Research, Kanata, Ontario, Canada) and Data Viewer software (Version 3.2; SR Research, 2018). This device measures events related to eye movement, including fixations (events in which participants’ gaze is held in one area) and saccades (events in which gaze shifts from one point of focus to another). The EyeLink 1000 Plus features a 500-Hz sampling rate and saccade resolution of 0.25°. Participants first completed calibration and validation procedures using a 9-point calibration test to ensure that their gaze was being tracked accurately. Saccade onset and offset were determined with the EyeLink saccade algorithm. This algorithm uses a velocity threshold of 30° per second, with a saccade acceleration threshold of 8,000° per second per second and a saccade motion threshold of 0.1°. Next, participants completed a 150-trial task, in which each trial included 12 faces in an array. Arrays were presented on a screen with a display width of 800 × 600 pixels. Each face within the array served as a fixation area, subtended an overall visual angle of 2.75° × 2°, and was separated from other faces by a minimum distance of 1.3° with a jitter of 0.4°. Dwell time was calculated as the time that participants spent looking at each part of this fixation area.
Results
To measure amplification, we conducted a mixed-model analysis of repeated measures, comparing the estimated mean crowd emotion and the actual mean crowd emotion expressed in each set (as in Studies 1 and 2). 3 Because each participant was exposed to four face identities, we added face identity and participants’ identity as random intercepts. Replicating Studies 1 and 2, results showed that estimated mean crowd emotion was 0.73 points higher (scale from 1 to 50) than the actual mean crowd emotion, b = 0.73, 95% CI = [0.47, 0.98], SE = 0.13, t(14945) = 5.65, p < .001, R2 = .07, supporting the crowd-emotion-amplification-effect hypothesis. It bears noting, however, that this amplification effect was smaller than the effects found in Studies 1 and 2. One potential reason for this difference may have been the use of an eye-tracking tool, which could have changed how participants sampled the face arrays. It is also important to note that the R2 of the model was actually higher in this study compared with both of the previous ones, suggesting that outcome variance was also smaller. Congruent with this idea, results showed that residual variance for the random effect was 63.05 in this model compared with 107.25 in Study 1 and 107.96 in Study 2.
Was amplification stronger for negative than for positive emotions (Hypothesis 3)? As in Studies 1 and 2, we used the difference score as an outcome variable and the valence of the face set as a predictor, using by-face-identity and by-participant random variables. Results indicated that there was no difference between positive and negative valence, b = −0.01, 95% CI = [−0.46, 0.42], SE = 0.22, t(7363) = −0.09, p = .93. These results were different from those of Studies 1 and 2, which showed a relatively weak but significant difference between negative and positive faces. It is possible that the relatively smaller difference between actual and estimated means made it harder to detect a difference between negative and positive valence given our sample size.
We next examined participants’ dwell time, or the amount of time participants spent looking at each of the faces in the set, to test whether attentional bias could account for the amplification effect. On average, participants looked at approximately three faces in each set (M = 3.05, SD = 0.93). Therefore, the dwell time on each face was distributed such that most faces were not looked at (dwell time of 0), whereas the time spent on the rest of the faces was normally distributed (Fig. 5). This type of data called for two separate analyses.
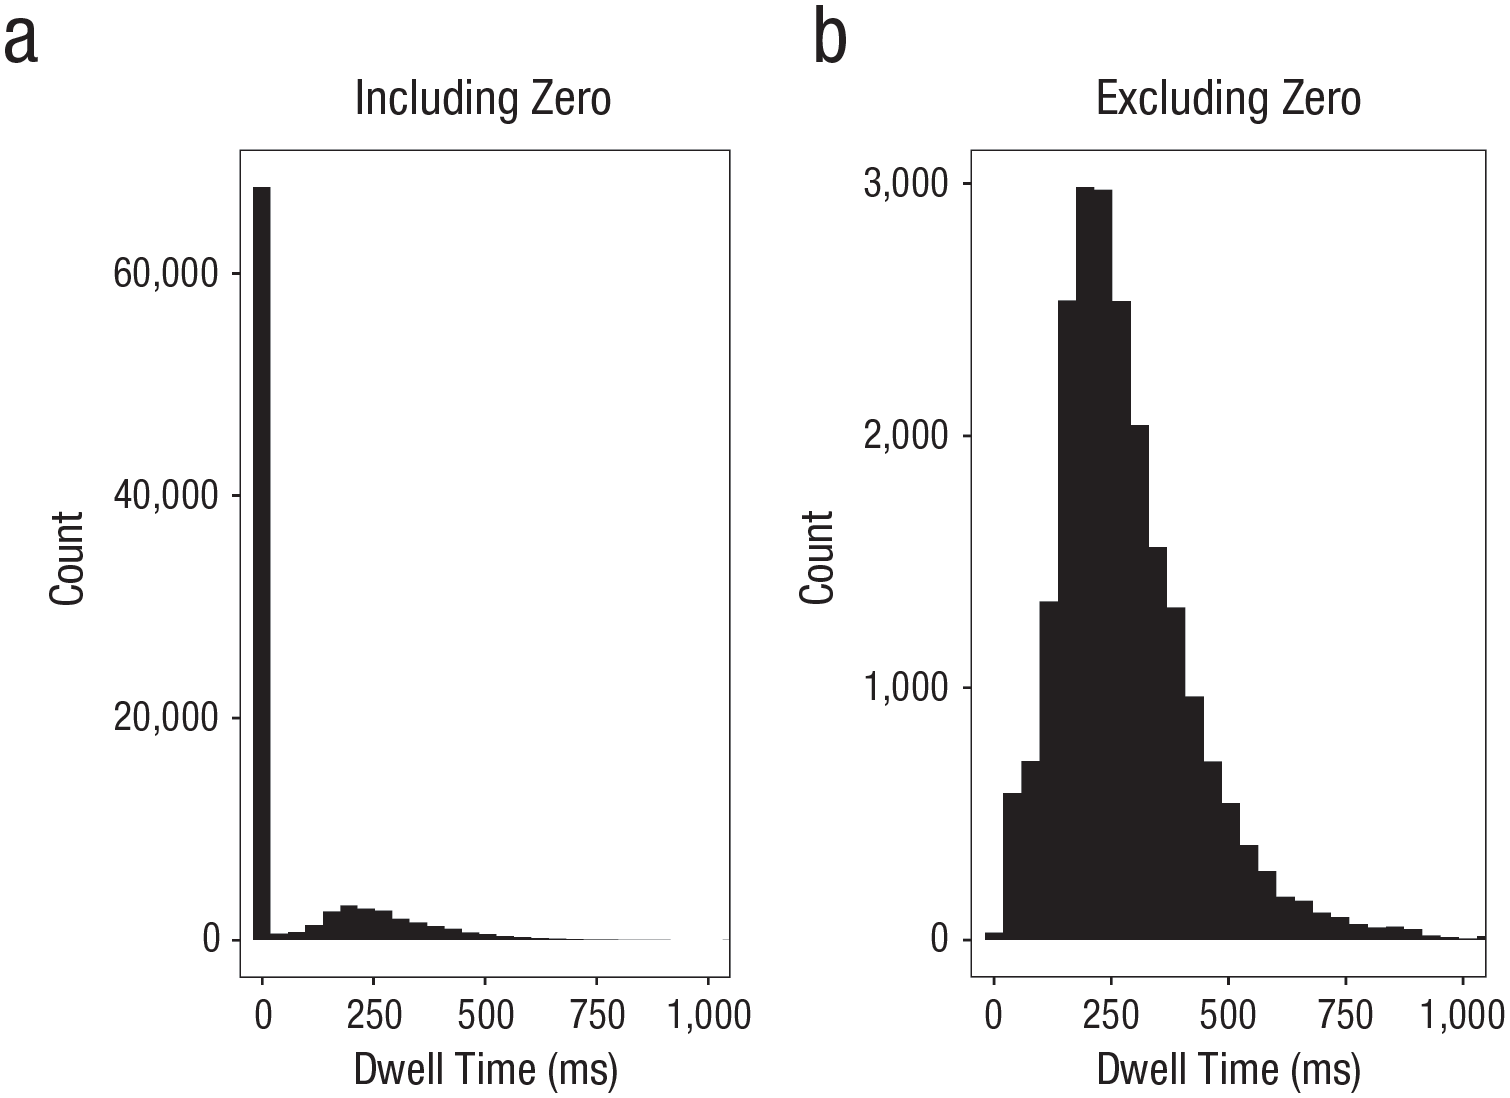
Dwell time in Study 3. Histograms are shown for (a) dwell time to all faces, including interest areas that were not looked at (dwell time = 0), and (b) dwell time only for interest areas that were looked at by participants.
First, we examined whether an expression’s emotionality made participants more likely to fixate on it (a binary outcome). This measure assessed attentional engagement: whether participants were initially drawn to faces expressing stronger (vs. weaker) emotion. Second, we examined whether dwelling on a more emotional face increased the degree of amplification that participants reported in their estimates of average emotions (a continuous measure). This measure assessed attentional disengagement: whether—when looking at a face—participants’ dwell time was longer if the face was more emotional, suggesting that they had a harder time detaching from these emotional faces.
To examine our binary measure, we converted the dwell-time variable into a binary outcome of either zero (participants did not look at this face at all) or one (participants looked at this face). We then conducted a generalized mixed-model analysis of repeated measures using the intensity of emotion expressed in each face as a predictor and our binary measure of dwell or not dwell as an outcome variable. Unlike all of our previous analyses, the analysis of dwell time necessarily included the time spent looking at each individual face (rather than on each array as a whole). Therefore, to make sure that comparisons between faces were similar across arrays with different average group emotions and standard deviation, we added the mean group emotion and standard deviation as covariates (although, notably, removing these covariates did not change the significance of the results). Finally, we added by-participant and by-face-identity random intercepts as in our previous analysis. Results suggested that the emotionality of a face did not affect the likelihood that participants would fixate on it, b = 0.00, 95% CI = [−0.01, 0.01], SE = 0.01, z = 0.31, p = .69, pointing to the fact that the intensity of emotions expressed by the faces did not influence whether or not these faces were looked at.
Next, we examined the continuous outcome, looking at whether dwell time was longer on more emotional faces than neutral faces. We focused our analysis on the faces that participants looked at in each trial. For these faces, we conducted a linear mixed-model repeated measures analysis predicting time spent on these faces as a function of their emotional intensity. Two covariates were added to the analysis: mean and standard deviation of group emotions, and two random variables (a by-participants random variable and by-face-identity random variable). Results suggested that face emotional intensity significantly predicted dwell time; participants spent more time looking at more emotional faces compared with less emotional faces, b = 0.18, 95% CI = [0.05, 0.31], SE = 0.06, t(22345) = 2.78, p < .001, R2 = .16.
Having established that dwell time was significantly longer for more emotional faces, we tested whether participants who spent more time looking at more emotional faces showed greater amplification. To examine this possibility, we created a coefficient for each participant of face emotional intensity predicting dwell time: Specifically, we ran a linear regression for each participant, looking at emotional intensity as a predictor for dwell time across trials (face emotional intensity predicting dwell time, looking only at faces that were observed by participants). We then took the regression coefficient for each participant and used it as an estimate of the tendency to dwell more on emotional faces; a positive coefficient indicated that a certain participant spent more time looking at emotional faces, and a negative coefficient indicated that a certain participant spent more time looking at neutral faces. We examined the interaction between a dummy-coded predictor for each value (i.e., whether the value was the participant-estimated or actual mean for that trial) with each individual’s dwell-amplification score predicting emotionality, b = 1.42, 95% CI = [1.04, 1.79], SE = 0.19, t(14798) = 7.49, p < .001, R2 = .18. In other words, the gap between the estimated and actual mean emotionality values was larger for participants who had higher dwell coefficients.
One question raised by these results is whether we can use the dwell-time data to predict participants’ estimations of the mean and whether this would be a better predictor of participants’ estimation than the objective average of the picture. To answer this question, we calculated the average of only the faces that participants looked at, weighted by the relative time that participants spent on each face in each trial (the weighted fixation-average model). This model was compared with the actual average of all faces in each array. To estimate which of the two best predicted participants’ evaluation of the average crowd emotion, we created a regression model that used both our weighted fixation-average model and the actual average of the face predicting participants’ estimation of the group mean emotion.
Results indicated that both the actual average, b = 0.17, 95% CI = [1.04, 1.79], SE = 0.02, t(7296) = 6.44, p < .001, R2 = .02, and the weighted fixation-average model, b = 0.47, 95% CI = [1.04, 1.79], SE = 0.01, t(7221) = 37.97, p < .001, R2 = .02, were significant predictors of participants’ estimated average. However, the coefficient of the weighted fixation-average coefficient was about 3 times higher than the coefficient of the actual average, suggesting that in our data, the weighted fixation average was a better predictor of the average group emotion. Correlating each of the models revealed that the weighted fixation model and participants’ estimations were moderately correlated, r(7296) = .45, 95% CI = [.43, .46], p < .001, whereas the correlation between the actual and estimated mean was lower, r(7296) = .26, 95% CI = [.24, .28], p < .001. We compared the two correlations by conducting a Pearson and Filon’s z test using the package cocor (Diedenhofen, 2016). Results indicated that indeed the correlation between the weighted fixation model and participants’ estimation was significantly better (z = 16.70, p < .001).
It is important to note, however, that although our weighted fixation-average model did fairly well in predicting participants’ estimation, the correlation between the two was .45, which suggests that a contribution from other faces in the periphery could account for some of the residuals. Indeed, participants’ estimation of the crowd emotion can be impacted by visual stimuli that appear in the periphery and are not fixated (Wolfe et al., 2015). One potential adjustment to the weighted fixation-average model would therefore be to include all faces in a crowd, including those in the periphery. However, further optimization is required to determine how to weight the fixated and nonfixated items in such a model, which is beyond the scope of the current investigation. More research should be done to understand the role of peripheral information in crowd-emotion amplification.
Overall, the results of Study 3 provided support for a potential mechanism for amplification. Participants spent more time attending to emotional faces compared with neutral faces, and participants who were especially attentive to emotional faces showed the greatest degree of amplification in estimating the average group emotions.
General Discussion
How do people rapidly estimate crowds’ emotions? Are such estimations accurate or systematically biased? These questions are relevant to many situations in which people must evaluate the emotions of others. Here, we found that participants tended to overestimate the intensity of a crowd’s average emotion. Furthermore, we observed that amplification grew as the number of faces within an array increased. Finally, results from Studies 1 and 2 (but not Study 3) showed that amplification was stronger for faces expressing negative emotion than for faces expressing positive emotion.
Mechanisms underlying the crowd-emotion-amplification effect
One potential mechanism underlying the crowd-emotion-amplification effect is attentional bias toward emotional faces, which leads to a corresponding bias in estimating the average emotion of the crowd. In Study 2, we tried to eliminate the possibility that such bias is an artifact of the 1-s exposure time that was used in Study 1. We found that extending the exposure time led to an increase in the amplification effects rather than a reduction.
The use of eye tracking in Study 3 allowed us to examine this mechanism more directly. Although participants did not appear to seek faces conveying stronger emotions (no differences in attention engagement), they did spend more time looking at highly emotional faces after they fixated on them (slower attention disengagement). Furthermore, results suggest that amplification increased as participants spent more time attending to emotional faces, providing support for the idea that this bias in attention disengagement contributes to the crowd-emotion-amplification effect. However, it remains unclear how increased attention is translated into amplification. It is possible that increased attention contributes to stronger or more accurate visual memory of specific faces, which in turn shapes estimation of the mean (Brady & Alvarez, 2011).
Limitations and future directions
These studies revealed a tendency for amplification that seems to be relevant to many aspects of social behavior. Nevertheless, these studies leave open several questions regarding how amplification is translated to perception and behavior outside the lab.
One limitation relates to the way the arrays were presented and rated. Participants viewed expression arrays that were all derived from the same face and were asked to evaluate them using a single face. In real life, when people estimate the emotions of a crowd, they analyze expressions of many different faces of various distributions of emotional intensity. Furthermore, it is not clear that participants were mentally representing the crowd using a single face (Kim & Chong, 2020), or at least that they would naturally, independently of our instruction to do so. Attempting to form perceptual summaries of sets of faces that vary in certain dimensions could reduce or increase tendencies for amplification. Other measures of crowd emotions that do not require translating a crowd into a single-face measure may thus produce estimates of the degree of amplification that differ from what we found here. Further work should be done to examine the amplification effect that we have demonstrated here in more naturalistic settings, such as when a person is giving a talk or observing large-scale gatherings, and using different measures. In addition, a test of how different emotional distributions affect amplification is also important. For example, recent work suggests that people tend to both discount (Haberman & Whitney, 2010) and overweight (Dannals & Miller, 2017) outliers, depending on their degree of extremity. Whether strong emotional outliers increase or decrease amplification remains unclear.
A second limitation of these studies is that participants were exposed solely to faces of White men. Although our findings suggested that the race and gender of the participants did not change amplification, the strength of the effect may be different when the gender and the race of the faces in a crowd are varied (see Sanchez-Burks & Huy, 2009). Research on emotion perception has shown that White perceivers are much more sensitive to faces of Black people, particularly those who express negative emotion (Ackerman et al., 2006; Hugenberg, 2005). It is therefore likely that amplification would be stronger for Black than for White targets, particularly when their faces convey negative emotions. Recent research that compared ensemble coding of Korean and American participants revealed differences between within-culture and between-culture accuracy (Im et al., 2017). Additionally, the literature on gender stereotypes of emotions indicates that people tend to assume that women are more emotional than men (Lafrance & Banaji, 1992; Plant et al., 2000), which may increase estimations of amplification. Further studies should therefore examine these candidate moderating factors.
A third limitation of this research is the incomplete assessment of characteristics of the perceiver that may influence amplification. People who are anxious in social contexts spend more time attending to emotional faces and, therefore, may be more likely to amplify crowd emotions than people who are not anxious (Bronfman et al., 2018; Mogg et al., 2004). In our set of studies, only Study 1 revealed a correlation between social anxiety and amplification, but this sample was also more anxious on average than those in Studies 2 and 3 (see the Supplemental Material). Further work is needed to examine this effect in a clinical population. If bias in attention drives amplification among individuals with social anxiety, training these individuals to focus their attention on less expressive members of the crowd may be useful in reducing their social anxiety (e.g., Bauer, 2009).
In conclusion, this project extends recent attempts to examine the role of ensemble coding in processes that are important to social functioning (Goldenberg et al., 2020; Lamer et al., 2018; Phillips et al., 2018). Learning more about how people rapidly evaluate complex social information not only may explain important aspects of social behavior but also may open the door to future interventions.
Supplemental Material
sj-docx-1-pss-10.1177_0956797620970561 – Supplemental material for The Crowd-Emotion-Amplification Effect
Supplemental material, sj-docx-1-pss-10.1177_0956797620970561 for The Crowd-Emotion-Amplification Effect by Amit Goldenberg, Erika Weisz, Timothy D. Sweeny, Mina Cikara and James J. Gross in Psychological Science
Footnotes
Acknowledgements
We thank Maria Reyes, Naila Ebeid, Vincent Rice, and Sara Zaher for their assistance with running these studies; Stephanie McMains for her assistance with developing the eye-tracking protocol; and Nathaniel Hunt for his help with coding the online version of the task.
Transparency
Action Editor: Kate Ratliff
Editor: Patricia J. Bauer
Author Contributions
A. Goldenberg and E. Weisz contributed equally to this study. All the authors developed the study concept and contributed to the study design. A. Goldenberg and E. Weisz conducted testing and data collection. A. Goldenberg and E. Weisz analyzed and interpreted the data under the supervision of J. J. Gross, T. D. Sweeny, and M. Cikara. A. Goldenberg and E. Weisz drafted the manuscript, and J. J. Gross, T. D. Sweeny, and M. Cikara provided critical revisions. All the authors approved the final manuscript for submission.

Notes
References
Supplementary Material
Please find the following supplemental material available below.
For Open Access articles published under a Creative Commons License, all supplemental material carries the same license as the article it is associated with.
For non-Open Access articles published, all supplemental material carries a non-exclusive license, and permission requests for re-use of supplemental material or any part of supplemental material shall be sent directly to the copyright owner as specified in the copyright notice associated with the article.
