
Abstract
Although researchers have debated whether a core deficit of nonsymbolic representation of magnitude underlies developmental dyscalculia (DD), research has mostly focused on numerosity processing. We probed the possibility of a general magnitude deficit in individuals with DD and asked whether sensitivity to size varied in contexts of depth ordering and size constancy. We measured full psychometric functions in size-discrimination tasks in 12 participants with DD and 13 control participants. Results showed that although people with DD exhibited veridical perceived magnitude, their sensitivity to size was clearly impaired. In contrast, when objects were embedded in depth cues allowing size-constancy computations, participants with DD demonstrated typical sensitivity to size. These results demonstrate a deficit in the perceptual resolutions of magnitude in DD. At the same time, the finding of an intact size constancy suggests that when magnitude perception is facilitated by implicit mandatory computations of size constancy, this deficit is no longer evident.
The learning of symbolic arithmetic and mathematics has historically been grounded in what is assumed to be an innate system, found in both infants and animals, dedicated to processing nonsymbolic number magnitudes (e.g., Dehaene, 2011). Although numerosity discrimination undergoes substantial refinement throughout childhood (Halberda et al., 2012; Schneider et al., 2017), infants discriminate numerosities long before language acquisition, as early as 3 hr after birth (Izard et al., 2009). Yet in approximately 1.3% to 10% of the population, a severe and persistent learning deficit called developmental dyscalculia (DD) affects the acquisition of knowledge of numbers and arithmetic, even in individuals with normal intelligence and an appropriate educational environment (for a review, see Devine et al., 2013). These numerical difficulties are troubling, as they take a toll on both physical and mental health and affect both educational and employment achievements (Zikmund-Fisher et al., 2014).
Most studies of the phenomenon have focused on the ability to process numerical magnitudes, and findings are inconclusive as to whether DD results from a general deficit in magnitude perception (e.g., Bugden & Ansari, 2016; Gliksman & Henik, 2018) or reflects a purely numerical perceptual deficit (e.g., Bulthé et al., 2019). In this study, we addressed the question by examining the psychophysics underlying size perception.
Developmental Dyscalculia and Magnitude Perception
Research suggests the existence of a numerical core system that can be characterized as a set of intuitions for quantities innately available to humans. This system is known as the approximate number system or numerosity processing system (Burr et al., 2018). Numerosity processing is commonly measured by performance on comparison tasks in which the participant is asked to identify the larger set among two arrays of dots. One major signature of these numerical-processing tasks is that comparisons are subject to a ratio (minimum:maximum) limit: Accuracy decreases and reaction time increases as the ratio between the two compared numbers approaches 1 (for a review of the ratio effect, see Cantlon et al., 2009). This ratio effect characterizing the numerical-processing core system has been found in infants (e.g., Izard et al., 2009; Libertus et al., 2018) and in animals (for a review, see Nieder, 2017).
Some research suggests that the numerical core system acts as a foundation for the symbolic number system, that is, learned symbolic arithmetic (e.g., Anobile et al., 2016; Malone et al., 2019) and higher mathematics (Amalric & Dehaene, 2016; Wang et al., 2017). Interestingly, although weaker symbolic numerical-processing capacities have often been found in children with DD (e.g., De Smedt & Gilmore, 2011), the results for nonsymbolic numerical-magnitude processing are mixed. In some studies, children diagnosed with DD show lower sensitivity, exhibited by higher thresholds (Anobile et al., 2018, 2019), but in others, the performance of those with DD is comparable with that of control participants (e.g., De Smedt & Gilmore, 2011). Accordingly, our understanding of the perceptual mechanism underlying discalculia is limited, which calls for further systematic investigation.
It has recently been suggested that a more fundamental generalized system mediating the perception of magnitudes, such as sizes, durations, or amounts, forms the basis for the evolution of the numerical-perceptual system and numerical abilities (e.g., Gebuis & Reynvoet, 2012; for a review, see Leibovich et al., 2017). This idea is supported by work showing that various dimensions are already perceptually tied together during early infancy (e.g., de Hevia et al., 2014; Lourenco & Longo, 2010) and is formalized in the theory of magnitude (Walsh, 2003), according to which the perceptions of time, space, number, size, speed, and other magnitudes share a common mechanism of processing and representation that continues to evolve throughout the life span to contribute to the development of computational abilities. Consistent with this theory, findings from several studies have suggested that the specific ability to perceive and evaluate physical size comprises the foundation of numerical abilities (Henik et al., 2012, 2017).
Statement of Relevance
Mathematics is important in the synthesis of evidence-based teaching practices, cognitive neuroscience, and psychology because it is a significant component of the knowledge required in our technological age, from following a recipe to developing computer programs. This makes numerical cognition and disabilities an important scientific field with potential application for solving problems in society. In recent years, research on numerical cognition has developed immensely, and major strides have been made in understanding the cognitive mechanisms involved in mathematical reasoning. Yet researchers are struggling to conceptualize numerical cognition, both its building blocks and its deficiencies. We unravel some of the core cognitive mechanisms underlying deficiencies in numerical cognition and provide evidence of reduced sensitivity to magnitude in adults with developmental dyscalculia. Our findings suggest that the deficit reaches deeper than hitherto suspected, modifying the very underpinnings of human numerical cognition.
Although a few studies have demonstrated an intact perception of continuous magnitudes in people with DD, others have found significant impairments (Glicksman & Henik, 2018; Skagerlund & Träff, 2014) or modulated neuronal processing as a mediator of continuous magnitude perception (McCaskey et al., 2017). These inconsistent findings might reflect differences in the experimental control of the parameters that are otherwise confounded with numerosity, such as density, area, or contour (e.g., Gebuis & Reynvoet, 2012). Furthermore, although the perception of size is given much less attention than numerical processing in the admittedly few studies on DD, many studies have demonstrated intact size perception (Anobile et al., 2018; Castaldi et al., 2018; De Visscher et al., 2018; McCaskey et al., 2017). How individuals with DD represent size is likely to depend on a unique set of magnitude properties, but none of these studies has performed high-resolution testing of the psychophysics underlying magnitude discrimination to tap the possible differences between adults with DD and typically developing (TD) adults.
In this study, we examined the perception of continuous magnitude by applying the method of constant stimuli in a two-alternative forced-choice (AFC) size-discrimination task. Participants compared a standard sphere with a consistent set of several different comparison spheres. Psychophysical functions were estimated on the basis of the probability that the comparison spheres were judged to be larger than the standard sphere. The full individual psychometric functions were analyzed to determine whether only sensitivity (i.e., perceptual resolutions) is modulated in DD or whether perceived magnitude is also affected. Importantly, the design allowed us to look for possible modulations in fundamental principles of magnitude perception. If a general magnitude-processing mechanism that may act as the foundation of numerical cognition (e.g., Gebuis & Reynvoet, 2012; Leibovich et al., 2017; Newcombe, 2014) is impaired in DD, these principles may be affected as well. Thus, we tested size constancy in DD, specifically investigating the extent to which size representations remain intact in an ecological environment in which a variety of contextual cues support the processes of perceptual constancy. It has been suggested that children with DD may compensate for numerical-processing deficits by relying on visual perceptual cues to perform numerical discriminations (e.g., Bugden & Ansari, 2016). Size constancy is normally acquired during infancy (Yonas et al., 1982), when monocular cues generate stable representations of objects’ size in an automatic manner, not as part of a task’s requirements (Gibson, 1979; Goldfarb & Tzelgov, 2005). Therefore, we tested size discrimination using a 2AFC task in ecological settings in which depth ordering of the objects was defined by monocular cues. Our goal was to see whether magnitude perception could be facilitated by implicit mandatory computations of size constancy.
Specifically, in this study, participants with DD and TD participants were asked to judge which of two simple simultaneously presented 2D objects was larger. We measured discrimination thresholds, Weber fractions, and the perceived magnitude of the 2D objects. The two objects were vertically arranged one above the other in three separate experimental conditions (see Fig. 1): (a) a background with no pictorial depth cues, (b) a background with linear depth perspective, and (c) a background with both linear depth perspective and environmentally acquired information (i.e., aerial-perspective cues). Four different standard sizes were used in the method of constant stimuli, and various comparative values above and below the four standard sizes were presented in a random order (see Fig. 2). The dependent measures, extracted using logistic psychometric functions, were (a) the point of subjective equality (PSE), where the comparison size is judged to be equal to the standard (indicative of the accuracy of the perceived magnitude); (b) the just-noticeable difference (JND), measuring the smallest detectable difference in size (indicative of the sensitivity or precision of discrimination); and (c) the Weber fraction, indicating the constant ratio of the JNDs to the standard sizes. According to Weber’s law, the ratio remains constant across different sizes (i.e., JNDs increase proportionally with object size). Weber fractions were also computed as JNDs divided by PSEs, thus normalizing the perceived difference to the perceived size of the objects (Hadad & Schwartz, 2019).
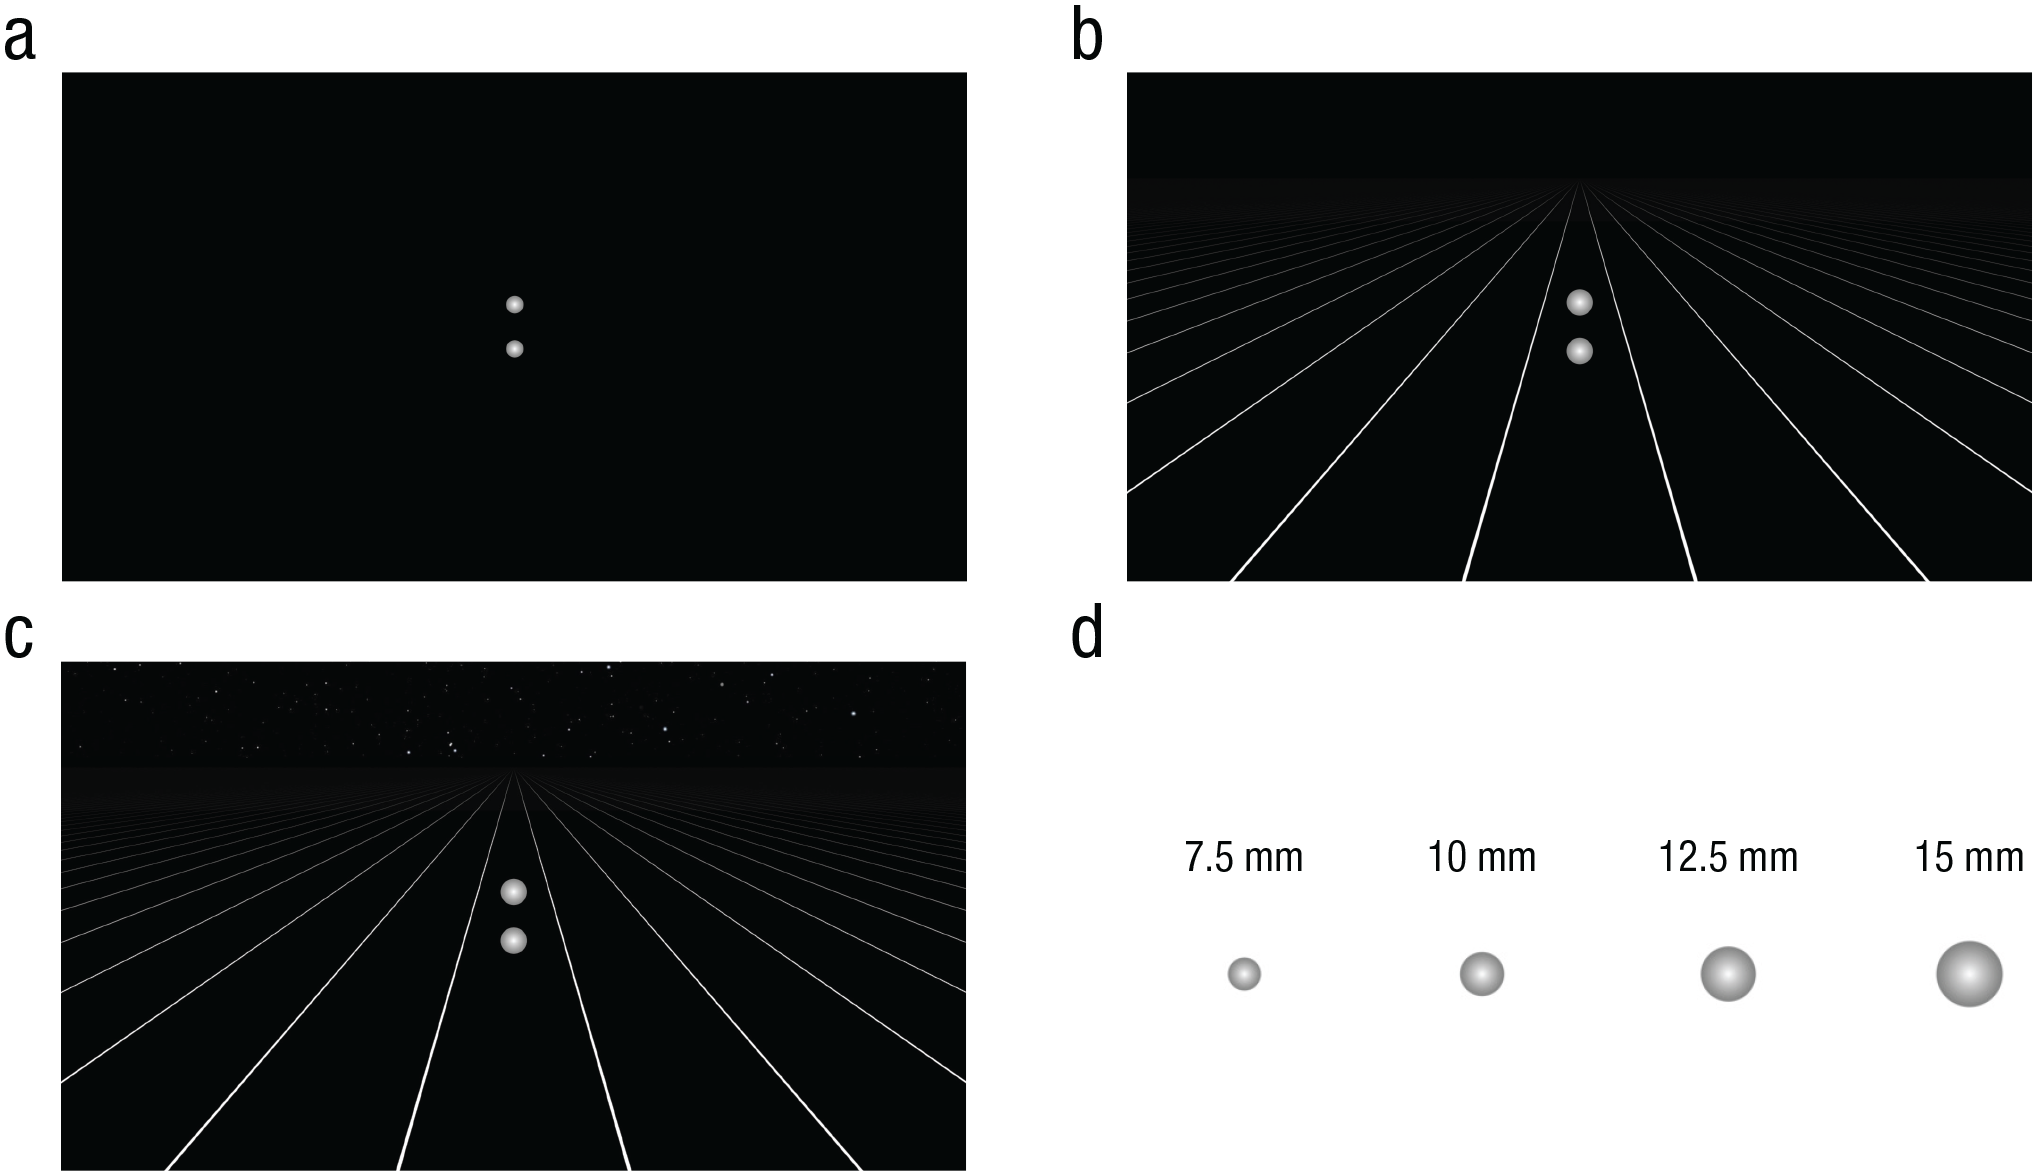
Examples of the displays used in the three experimental blocks. Participants were asked to indicate which of the two simultaneously presented spheres looked larger. The perception of the two objects’ relative distance was specified by pictorial depth cues. The spheres were presented in (a) a blank background (Experiment 1); (b) a background containing texture-gradient and linear-perspective pictorial cues (Experiment 2); and (c) an enriched scene with both linear-perspective and aerial-perspective pictorial cues (Experiment 3). The objects varied in standard diameter (d; 7.5 mm, 10 mm, 12.5 mm, and 15 mm) in the three experimental blocks. Each standard sphere was combined with seven comparison spheres that were bigger in diameter and seven comparison spheres that were smaller in diameter.
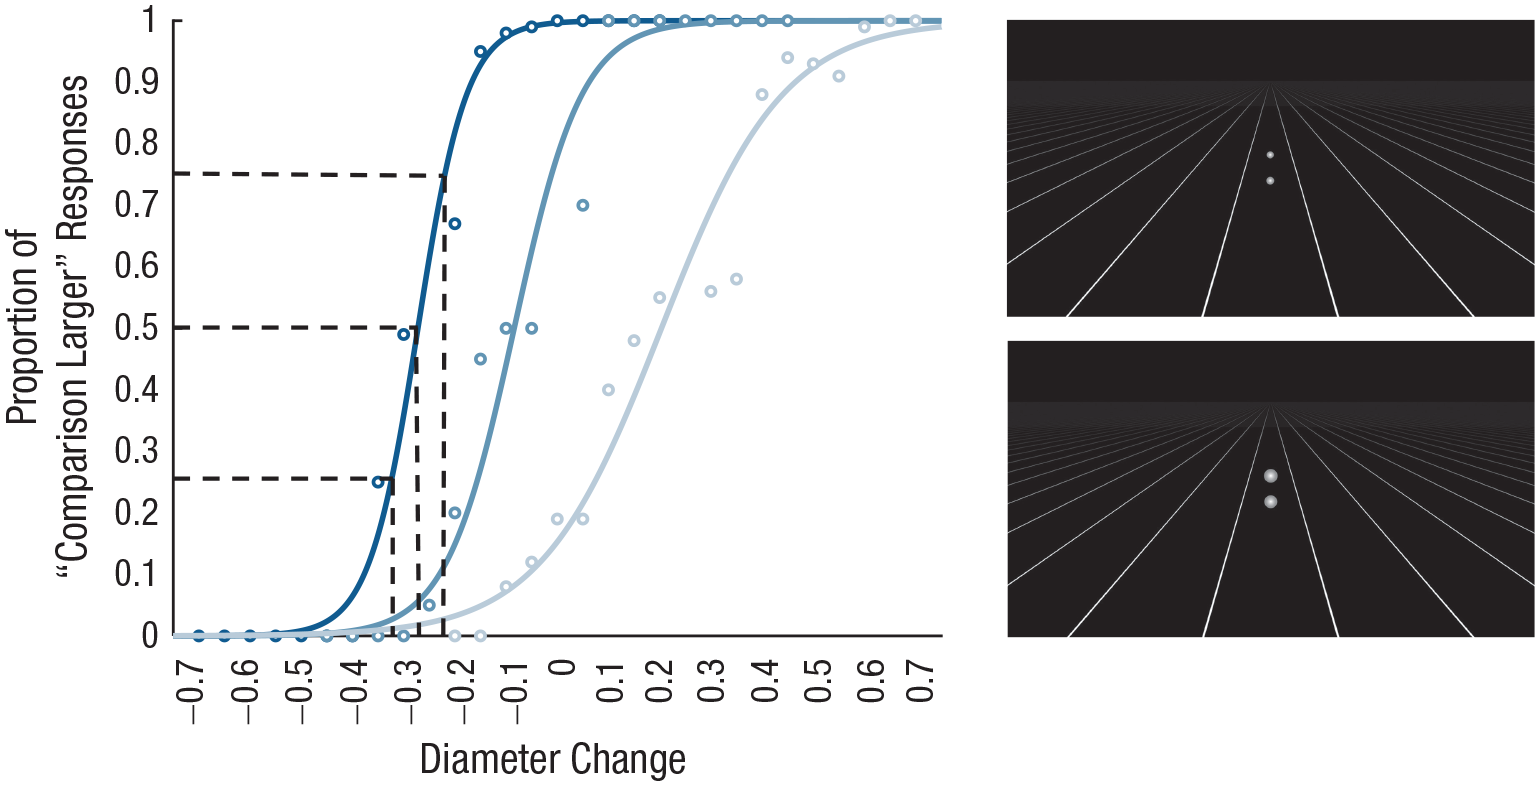
Illustration of the psychometric function (left) and examples of the compatibility conditions (right). The frequency with which each comparison stimulus was judged to be larger than the standard is plotted against the values of the comparison stimuli for each standard (circles illustrate individual data points). The dashed lines represent the diameter changes corresponding to 25%, 50% (point of subjective equality [PSE]), and 75% “comparison larger” responses. Changes in the slope of the psychometric function indicate changes in just-noticeable differences (sensitivity is higher for the steeper slope of the darker blue function). Shifts of the function along the x-axis indicate changes in the perceived magnitude (PSEs). In the incompatible-with-perception condition (top right), the upper sphere was physically smaller, and in the compatible-with-perception condition (bottom right), the upper sphere was physically larger.
Combining these measures provided a robust and comprehensive test of size perception. First, we examined differences in perceptual sensitivity between DD participants and TD controls by comparing discrimination thresholds (i.e., JNDs); smaller JNDs indicated lower noise and thus higher precision of discrimination. Second, we looked for differences in the perceived magnitude, comparing PSEs between the groups. Smaller differences between the PSE and the actual size would indicate smaller constant error (i.e., bias) and thus higher accuracy of the perceived magnitude. Testing these two complementary yet independent measures allowed a comprehensive test of the potential modulations in magnitude perception in the participants with DD: A pattern of results revealing comparable PSEs but elevated JNDs would indicate veridical perception of size but reduced sensitivity (poor perceptual resolutions). Third, we examined modulations in two fundamental principles of magnitude perception: Weber’s law, under which JNDs increase proportionally with the standard size, and size constancy, whereby perceptual representations of size remain stable across different perceived distances. Modulations in these two basic principles would indicate qualitative differences in the mechanism of magnitude perception. Fourth and finally, we examined the extent to which perceptual resolutions of size discrimination were facilitated by size-constancy computations by both groups, arguing that if size constancy is intact in participants with DD, overall lower JNDs would be observed in settings where depth-ordering cues allowed size constancy to facilitate size discrimination.
Method
Participants
Twelve university students with DD (12 women; mean age = 27.92 years, range = 23–35) and 13 TD university students (12 women; mean age = 25.77 years, range = 19–33) took part in the study. All had normal or corrected-to-normal vision. We conducted a power analysis to verify that our tests would be sensitive enough to detect group differences. Power analysis was done using the R package pwr2 (Version 1.0; Lu et al., 2017). We found that with the current setup, a sample size of 18 participants would allow us to detect between-subjects interactions with an effect size of 0.4 (Cohen’s d).
Participants were recruited through advertisements and were paid about $14 (U.S.) per hour. The experimental procedure and protocol were approved by the University of Haifa Research Ethics Committee (No. 100/18; for characteristics of the DD and TD samples, see Table 1).
Characteristics of the Typically Developing (TD) Sample and the Sample With Developmental Dyscalculia (DD)
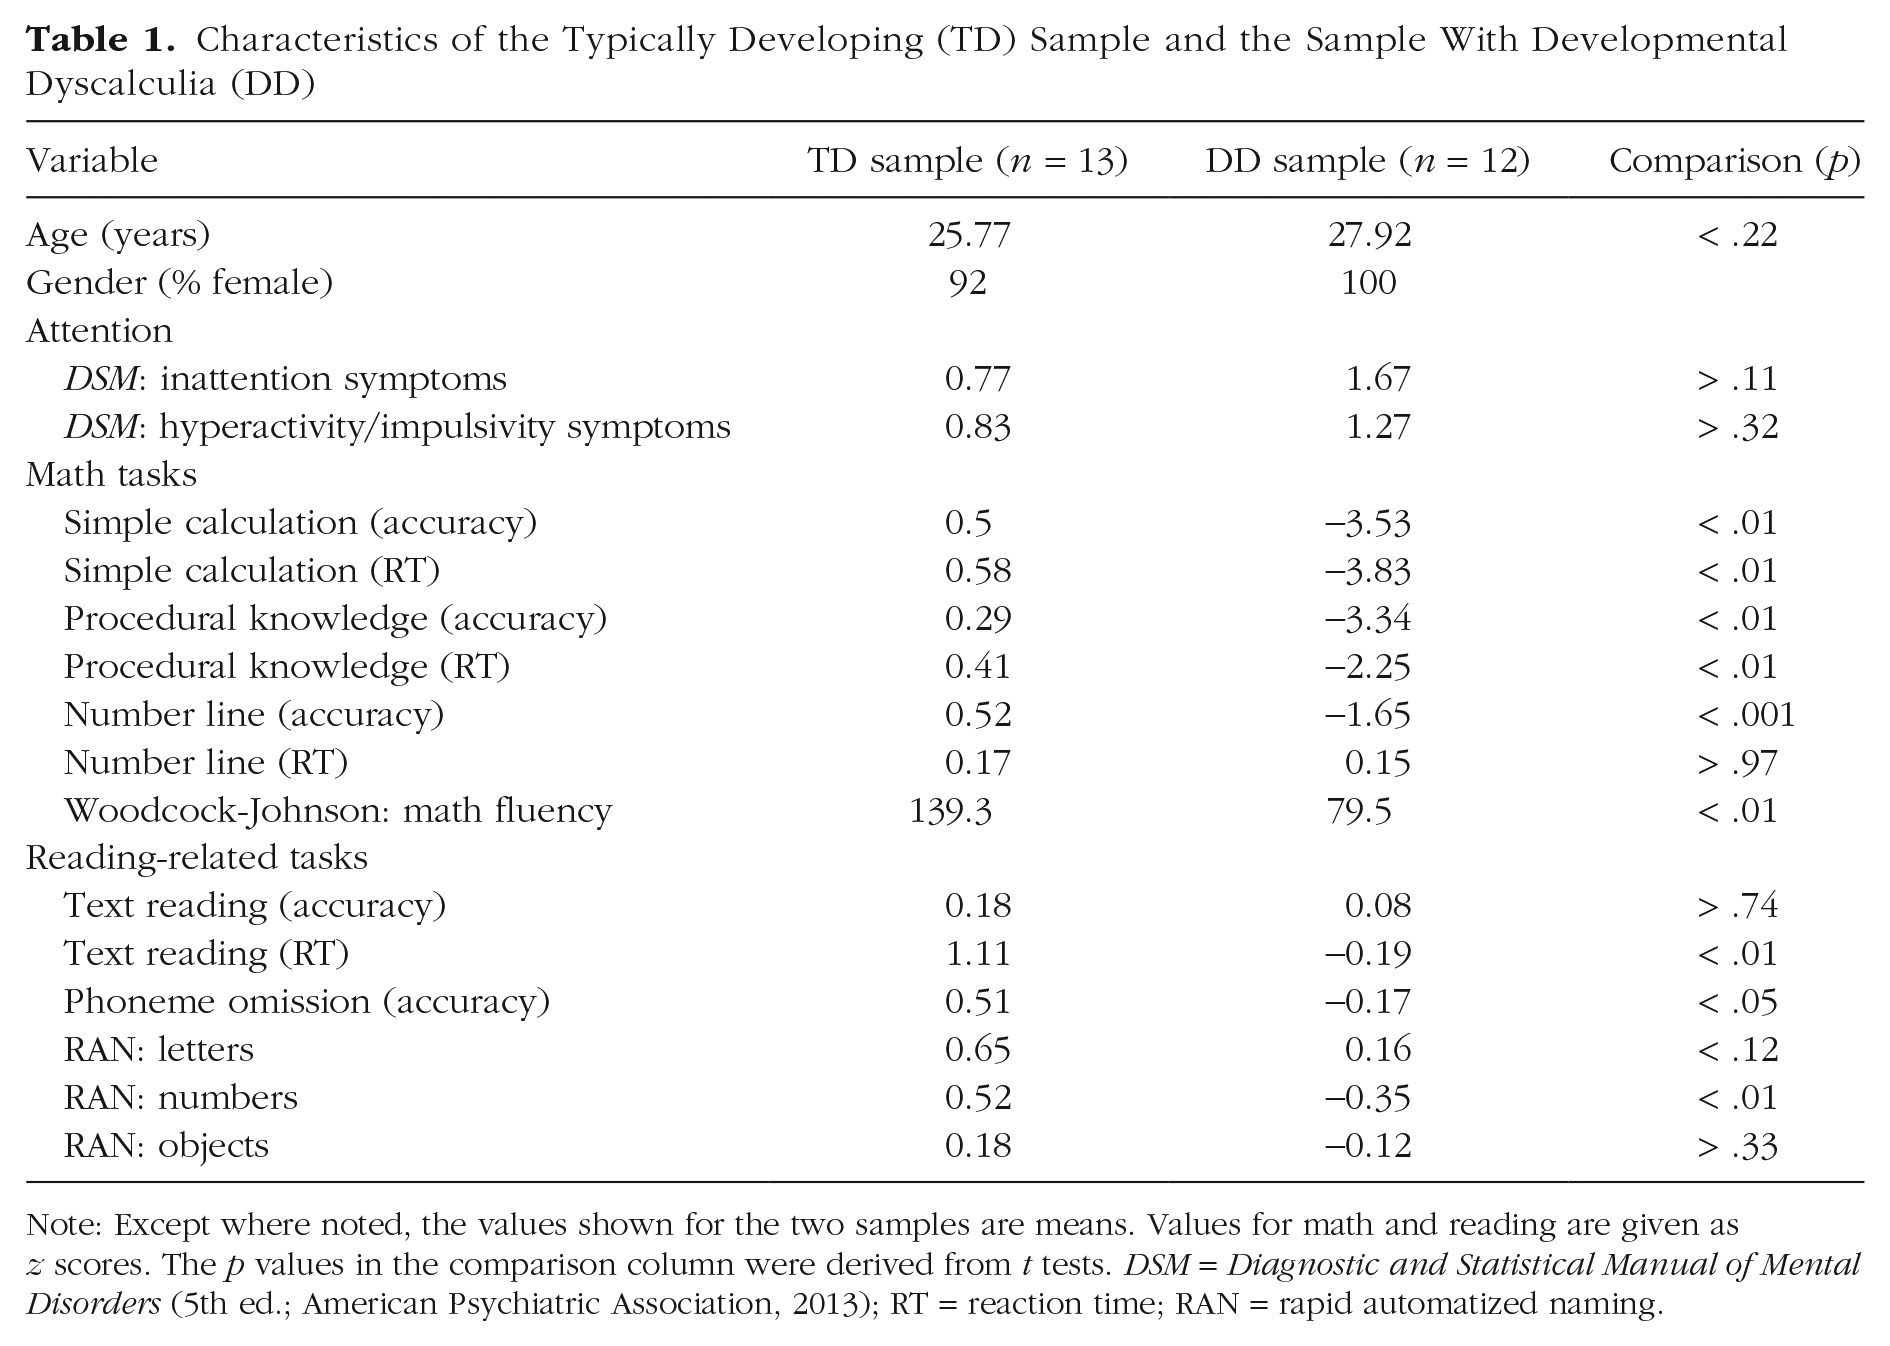
Note: Except where noted, the values shown for the two samples are means. Values for math and reading are given as z scores. The p values in the comparison column were derived from t tests. DSM = Diagnostic and Statistical Manual of Mental Disorders (5th ed.; American Psychiatric Association, 2013); RT = reaction time; RAN = rapid automatized naming.
Participants were classified as TD or dyscalculic using the Israeli Learning Function Diagnosis System (MATAL in Hebrew). The computerized tests and questionnaires in MATAL are normalized and are used to diagnose learning disabilities in students at high schools and higher-education institutes. All participants performed math tasks and reading and reading-related tasks. The math tasks consisted of simple calculation, procedural knowledge, and number-line positioning, and the reading and reading-related tasks consisted of text reading, phoneme omission, and rapid automatized naming (RAN) of letters, numbers, and objects (for technical reasons, one TD participant did not complete the phoneme-omission task). All participants also answered a questionnaire based on criteria from the Diagnostic and Statistical Manual of Mental Disorders (DSM; 5th ed.; American Psychiatric Association, 2013) to determine their attention abilities. Finally, to provide an additional estimation of their simple calculation abilities, we asked them to complete the Woodcock-Johnson Tests of Achievement III (Woodcock et al., 2001; see Table 1).
Anticipating that the MATAL scores of some participants might not be consistent across the current assessments and participants’ past assessments, especially for participants who were initially assessed at a very young age, we invited 25 participants to participate in the study. In fact, most of the 12 participants with DD were diagnosed with dyscalculia in childhood. We eventually obtained a balanced sample of 25 participants: 12 with DD and 13 TD.
Inclusion criteria for the DD group
Participants were classified as having DD if they (a) scored less than 1.8 standard deviations below the mean on either reaction time or accuracy measures on at least two out of three math tasks in MATAL, (b) scored better than 1 standard deviation below the mean in all reading-related tasks, (c) indicated fewer than five symptoms of inattention and fewer than five symptoms of hyperactivity/impulsivity on the DSM questionnaire, and (d) reported having ongoing difficulties performing simple calculations in their past (preferably since elementary school).
Inclusion criteria for the TD group
Participants were classified as TD if they (a) indicated fewer than five symptoms of inattention and fewer than five symptoms of hyperactivity/impulsivity on the DSM questionnaire, (b) scored better than 1 standard deviation below the mean on all the math tasks, (c) scored better than 1 deviation below the mean on all reading-related tasks, and (d) reported not having difficulties (or past difficulties) in simple calculations or math. We conducted independent-samples t tests on the task results (for mean task results and p values of independent-samples t tests, see Table 1).
Stimuli
Participants performed a 2AFC size-discrimination task, indicating which of two simultaneously presented spheres looked larger. The two objects’ relative distance was specified by pictorial depth cues. The two spheres were presented in three experimental blocks (see Fig. 1): (a) a blank background with no depth cues (Experiment 1); (b) a background containing texture-gradient and linear-perspective pictorial cues (Experiment 2); and (c) a background containing an enriched scene with linear-perspective and aerial-perspective pictorial cues (Experiment 3). Light and shadowed areas with varying amounts of luminance were introduced into the stimuli to provide a spherical, three-dimensional effect. Stimuli were generated using MATLAB software (The MathWorks, Natick, MA) and presented using a 24-in. monitor with resolution of 1,920 × 1,080 pixels. In a procedure using the method of constant stimuli, four standards of sphere diameters were presented (7.5 mm, 10 mm, 12.5 mm, and 15 mm). Each standard sphere was combined with 14 different comparisons of diameter sizes varying in steps of 0.1 mm (±0.1mm, ±0.2mm, ±0.3mm, ±0.4mm, ±0.5mm, ±0.6mm, ±0.7mm; see Fig. 1).
Each of these combinations of the standard and the comparison was presented 12 times. In half the trials, the larger sphere was positioned above the smaller sphere (the compatible-with-perception condition), and in the other half, it was positioned below the smaller sphere (the incompatible-with-perception condition; see Fig. 2).
When the larger sphere was positioned above the smaller sphere, the physical difference between the spheres was compatible with the process of size constancy; that is, the upper sphere was physically larger but was perceived as distant in space and was thus perceptually enlarged. This compatibility was relevant for the two experimental blocks of depth cues but not for the blocks with no depth cues (blank background). Incompatibility with perception was thus used as a control condition for all three experimental blocks. The vertical distances between the two spheres were 2.5 cm, 2.75 cm, and 3 cm, determined randomly throughout the experiment.
Procedure
Participants sat in a quiet, darkened room and viewed the displays from a distance of 60 cm. Each of the three experimental blocks was carried out in a different session (with at least 24 hr between sessions). Each session began with a practice block and included six breaks (breaks ended when participants pressed a relevant key). Each trial began with a fixation point appearing for 500 ms, followed by an interstimulus interval of 250 ms. The two spheres (chosen randomly) were presented for 150 ms, and participants were asked to decide which of the two spheres was larger. They were asked to respond as quickly and accurately as possible by pressing one of two designated keys (“W” for the upper object, “X” for the lower object). After participants had responded, the next trial began. Each experimental block lasted for about 1 hr. The overall experiment lasted about 3.5 hr, including the screening tests.
Data analysis
The frequency with which each comparison stimulus was judged to be larger than the standard was plotted against the values of the comparison stimuli for each standard. For each participant, the resulting psychometric data were fitted by a sigmoid function for each standard size (see Fig. 2). Three dependent measures were extracted: (a) the PSE, where size was judged to be equal to the standard (i.e., the point of 50% “comparison larger” responses); (b) the JND, indicating the smallest detectable difference in size; and (c) the Weber fraction. The JNDs were calculated by identifying the stimulus values corresponding to 25% and 75% of comparisons chosen as larger than the standard and then halving the difference; the Weber fractions were computed as the JND divided by the PSE, so that the perceived difference was normalized to the perceived size of the spheres (Hadad & Schwartz, 2019). PSEs, JNDs, and Weber fractions were computed for each participant. In the first experimental block, we performed mixed-design analyses of variance (ANOVAs) on PSEs, JNDs, and Weber fractions for both compatible and incompatible trials. In the second and third experimental blocks, we performed mixed-design ANOVAs on PSEs, JNDs, and Weber fractions separately for the compatible and incompatible trials, because size constancy was expected to enhance size discrimination only for the former. The experimental blocks (blank background, linear-perspective cues, aerial-perspective cues) and the standard size (7.5 mm, 10 mm, 12.5 mm, 15 mm) were the within-subjects factors, and group (TD, DD) was the between-subjects factor.
Results
Experiment 1: size discrimination
Using group as a between-subjects factor and size and compatibility condition (compatible with perception or incompatible with perception) as within-subjects factors, we performed a mixed-design ANOVA on the PSEs to examine effects on the perceived size and on the JNDs and Weber fractions to examine effects on perceptual sensitivity (for descriptive data on the measures, see Table S1 in the Supplemental Material available online).
Perceived size
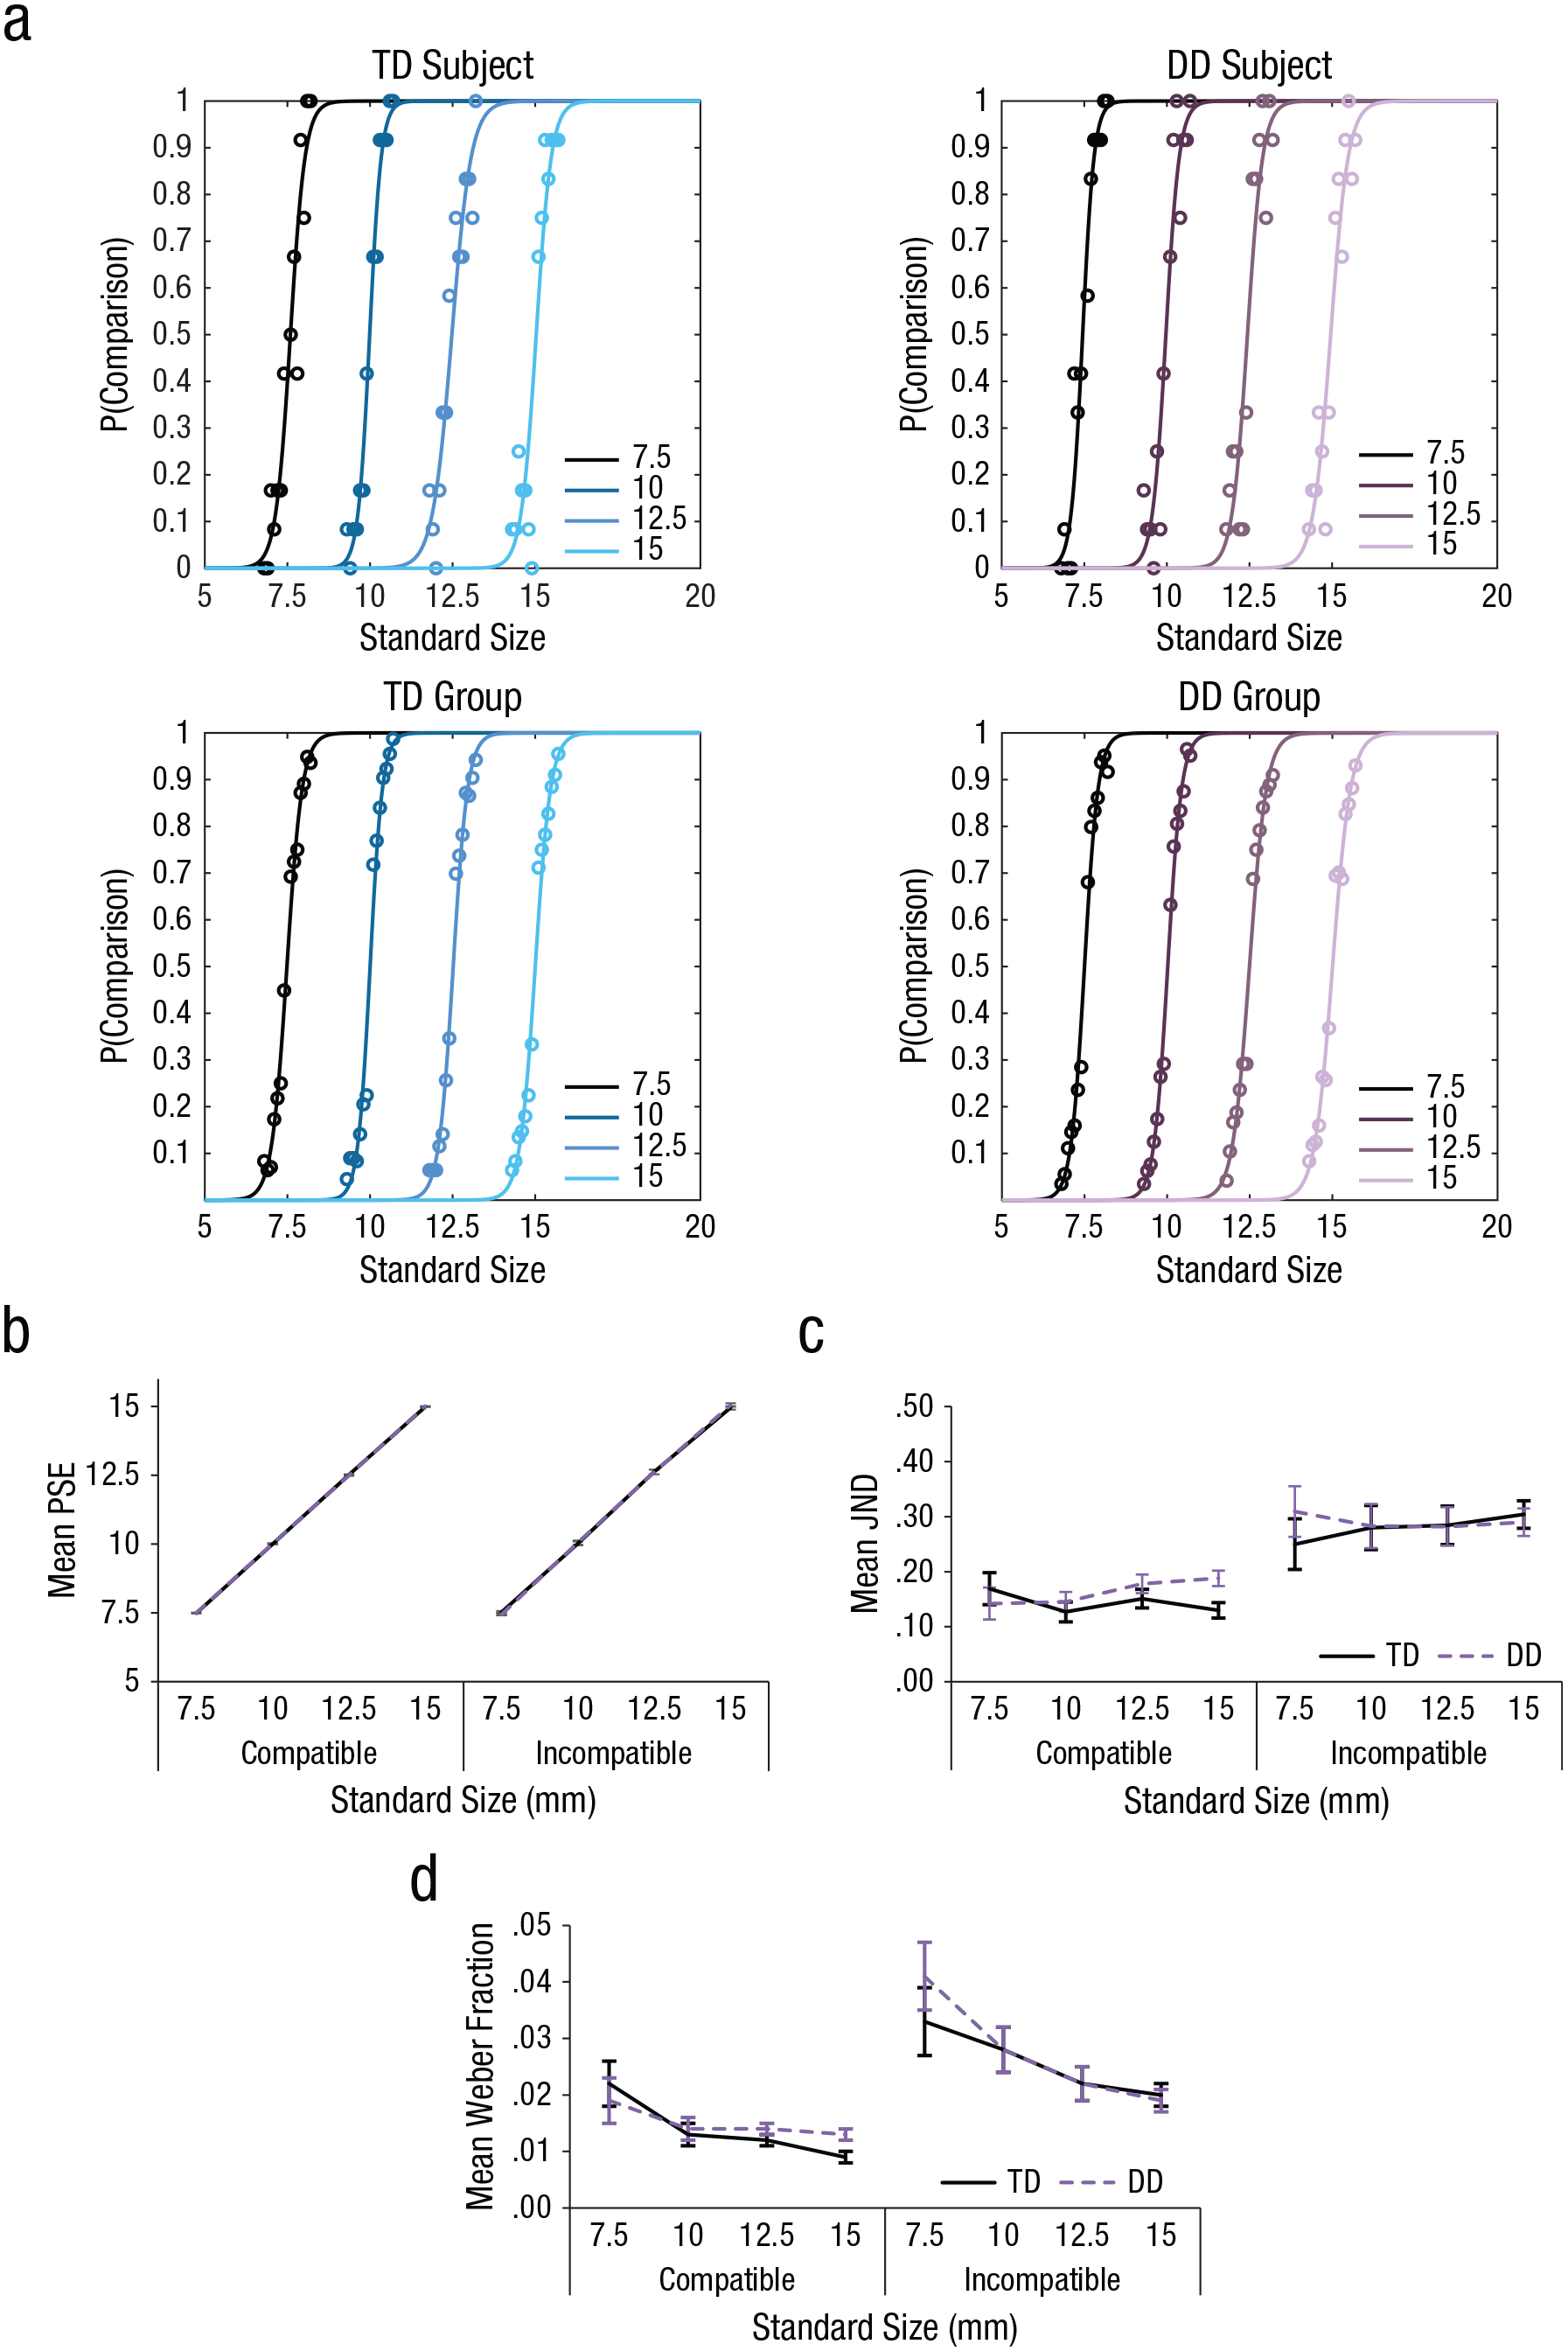
The analysis of the PSEs revealed the expected effect of size, F(3, 69) = 4,509.13, p < .0001, η p 2 = .995, indicating a veridical size perception of the spheres (see Fig. 3). Importantly, neither group, F(1, 23) = 1.03, p > .32, η p 2 = .043, nor the interaction of size and group, F(3, 69) = 1.72, p > .17, η p 2 = .07, had a significant effect, indicating that the veridical perception of the spheres’ size was similar for both groups of participants.
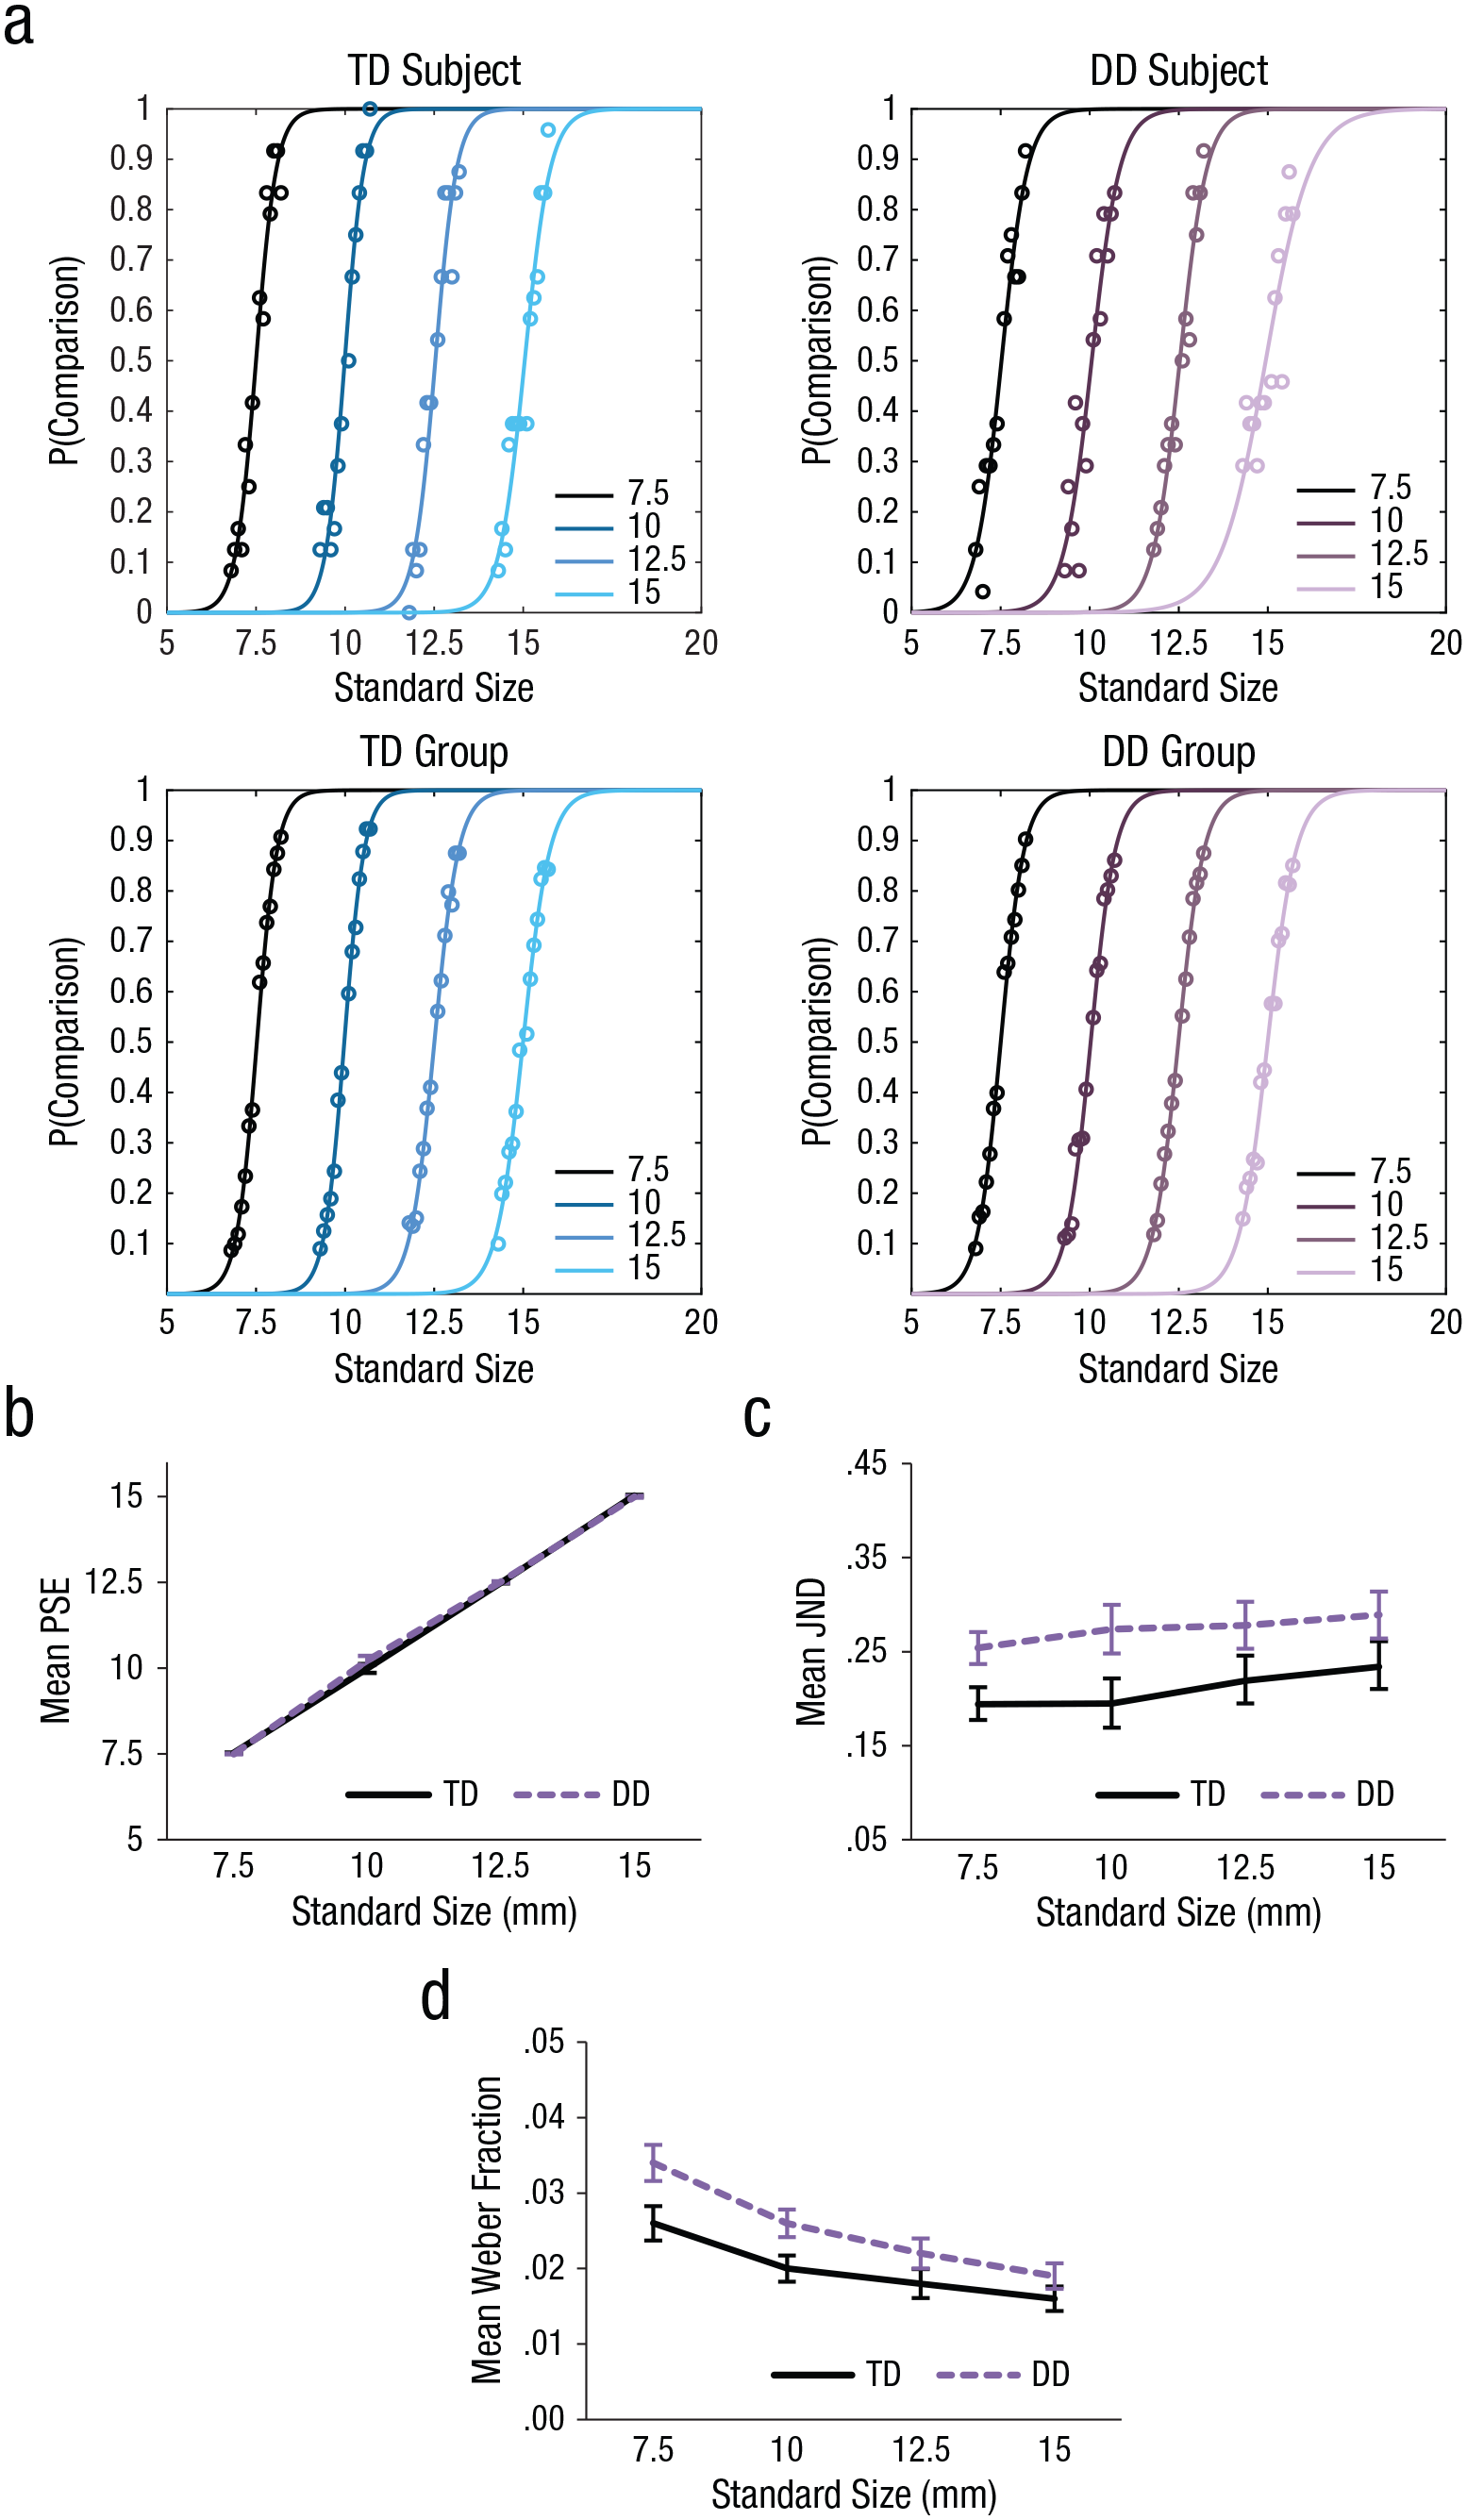
Results for Experiment 1. Psychometric functions (a), plotting the proportion of trials in which participants reported the comparison sphere as larger, are shown as a function of size of the comparisons (collapsed across compatible-with-perception and incompatible-with-perception trials). Data for a representative typically developing (TD) participant and a representative individual diagnosed with developmental dyscalculia (DD) are shown in the top row, and all data pooled separately for the TD and DD groups are shown in the bottom row. Circles show data aggregated across participants and are shown for illustration purposes only. For each group, the mean (b) point of subjective equality (PSE), (c) just-noticeable difference (JND), and (d) Weber fraction (normalized to the perceived size) is shown as a function of standard size. Error bars show standard errors. In (b), standard errors cannot be seen because of their low values (see Table S1 in the Supplemental Material).
Discrimination thresholds
In contrast, the ANOVA for the JNDs revealed reduced sensitivity in size discrimination in the DD group (see Fig. 3); the JNDs and Weber fractions were significantly higher for this group, F(1, 23) = 7.16, p < .014, η p 2 = .237, and F(1, 23) = 8.46, p < .008, η p 2 = .269, respectively. For both variables, this effect of group did not vary for the different sizes, Fs < 1, η p 2 < .035, or for the compatible and incompatible trials, Fs < 1, η p 2 < .019, demonstrating the overall lower sensitivity of the participants with DD to subtle differences in size.
Weber’s law
Although thresholds were higher overall in the DD than the TD group, perception in each group adhered to Weber’s law: Weber fractions remained constant across the different sizes of 10, 12.5, and 15 mm—F(3, 36) = 2.19, p > .11, η p 2 = .06, and F(3, 33) = 1.41, p > .25, η p 2 = .05, for the TD and DD groups, respectively—and no interaction of size with group was found, F < 1, η p 2 = .035. However, Weber fractions decreased with size when the smallest size (7.5 mm) was included, F(3, 69) = 23.91, p < .001, η p 2 = .51, presumably because the sphere was extremely small for detecting the subtle differences. As can be seen in Figure 3d, this pattern was observed for both groups.
Overall, the results indicate that perceptual resolutions of size were lower in the DD group. Yet they demonstrated that participants had a veridical perception of the spheres’ size and scaled their thresholds to the size presented, demonstrating adherence to Weber’s law.
Experiment 2: size discrimination of spheres within a linear-perspective scene
When the two spheres were embedded within a background containing texture-gradient and linear-perspective pictorial cues, the DD group’s size discrimination did not differ from their TD counterparts’. Using group as a between-subjects factor and size and compatibility condition (compatible with perception or incompatible with perception) as within-subjects factors, we performed a mixed-design ANOVA on the PSEs to examine effects on the perceived size and on the JNDs and Weber fractions to examine effects on perceptual sensitivity (for descriptive data on the measures, see Table S2 in the Supplemental Material).
Perceived size
The analysis of the PSEs revealed the expected effect of size, F(3, 69) = 14,019.44, p < .001, η p 2 = .998, once again demonstrating that participants had a veridical perception of the spheres (see Fig. 4). Importantly, neither group nor the interaction of size and group had significant effects, Fs < 1 (η p 2 = .011 for group, η p 2 = .022 for Size × Group), indicating that the veridical perception of the spheres’ size was similar for the two groups.
Results for Experiment 2. Psychometric functions (a), plotting the proportion of trials in which participants reported the comparison sphere as larger, are shown as a function of size of the comparisons (collapsed across compatible-with-perception and incompatible-with-perception trials). Data for a representative typically developing (TD) participant and a representative individual diagnosed with developmental dyscalculia (DD) are shown in the top row, and all data pooled separately for the TD and DD groups are shown in the bottom row. Circles show data aggregated across participants and are shown for illustration purposes only. For each group, the mean (b) point of subjective equality (PSE), (c) just-noticeable difference (JND), and (d) Weber fraction (normalized to the perceived size) is shown as a function of standard size. Error bars show standard errors. In (b), standard errors cannot be seen because of their low values (see Table S2 in the Supplemental Material).
Discrimination thresholds
At the same time, in clear contrast to the findings in Experiment 1 (blank background experiment), the ANOVA we performed on the JNDs and Weber fractions did not show any significant differences in size discrimination between the DD and TD groups (Fs < 1, η p 2 = .041 for JNDs, η p 2 = .032 for Weber fractions; see Fig. 4). Interestingly, both JNDs and Weber fractions were significantly smaller in the compatible condition—JNDs: F(1, 23) = 29.52, p < .001, η p 2 = .562; Weber fractions: F(1, 23) = 22.88, p < .001, η p 2 = .499—indicating higher sensitivity in the compatible trials than the incompatible trials. Importantly, the higher sensitivity in the compatible trials, in which the physical difference between the spheres matched the process of size constancy, was observed for both the TD group—JNDs: F(1, 12) = 19.18, p < .001, η p 2 = .615; Weber fractions: F(1, 12) = 13.67, p < .003, η p 2 = .533—and the DD group—JNDs: F(1, 11) = 11.48, p < .007, η p 2 = .511; Weber fractions: F(1, 11) = 9.74, p < .01, η p 2 = .47. There was no interaction between group and compatibility, either for JNDs or for Weber fractions, so performance did not differ as a function of compatibility between groups (Fs < 1, η p 2 = .001 for both JND and Weber fractions; see Fig. 4).
Experiment 3: linear-perspective and aerial-perspective cues
The pattern of results we found in Experiment 2 was replicated in Experiment 3: Once again the size discrimination of the participants with DD did not differ from that of TD participants. Using group as a between-subjects factor and size and compatibility condition (compatible with perception or incompatible with perception) as within-subjects factors, we carried out a mixed-design ANOVA on the JNDs, Weber fractions, and PSEs (for descriptive data on the measures, see Table S3 in the Supplemental Material).
Perceived size
The analysis of the PSEs revealed the expected effect of size, F(3, 69) = 6,221.51, p < .001, η p 2 = .996, again demonstrating a veridical perception of the spheres (see Fig. 5). Importantly, neither group, F < 1, η p 2 = .034, nor the interaction of size and group, F(3, 69) = 1.78, p > .15, η p 2 = .072, had a significant effect, indicating that veridical perception of the spheres’ size was similar for the two groups.

Results for Experiment 3. Psychometric functions (a), plotting the proportion of trials in which participants reported the comparison sphere as larger, are shown as a function of size of the comparisons (collapsed across compatible-with-perception and incompatible-with-perception trials). Data for a representative typically developing (TD) participant and a representative individual diagnosed with developmental dyscalculia (DD) are shown in the top row, and all data pooled separately for the TD and DD groups are shown in the bottom row. Circles show data aggregated across participants and are shown for illustration purposes only. For each group, the mean (b) point of subjective equality (PSE), (c) just-noticeable difference (JND), and (d) Weber fraction (normalized to the perceived size) is shown as a function of standard size. Error bars show standard errors. In (b), standard errors cannot be seen because of their low values (see Table S3 in the Supplemental Material).
Discrimination thresholds
The ANOVA on the JNDs and Weber fractions did not show any significant differences in size discrimination between the DD and TD groups (JNDs: F < 1, η p 2 = .035; Weber fractions: F = 1.64, p > .21, η p 2 = .067; see Fig. 5). As in Experiment 2, both JNDs and Weber fractions were significantly smaller in the compatible condition—JNDs: F(1, 23) = 27.25, p < .001, η p 2 = .542; Weber fractions: F(1, 23) = 19.92, p < .001, η p 2 = .464—indicating higher sensitivity for compatible than incompatible trials. Importantly, the higher sensitivity in the compatible trials, in which the physical difference between the spheres matched the process of size constancy, was observed for both the TD group—JNDs: F(1, 12) = 21.44, p < .001, η p 2 = .641; Weber fractions: F(1, 12) = 16.78, p < .001, η p 2 = .583—and the DD group—JNDs: F(1, 11) = 9.19, p < .011, η p 2 = .455; Weber fractions: F(1, 11) = 7.13, p < .022, η p 2 = .393. Finally, there was no interaction between group and compatibility, either for JNDs or for Weber fractions, so performance did not differ as a function of compatibility between groups (Fs < 1, η p 2 < .005 for both JND and Weber fractions; see Fig. 5).
To directly demonstrate this pattern of results, we performed a mixed-design ANOVA on the JNDs and Weber fractions for the compatible trials, with experiment (blank background, linear-perspective background, aerial-perspective background) as a within-subjects factor and group as a between-subjects factor. The analysis revealed a significant interaction between experiment and group on the JNDs, F(2, 46) = 3.35, p < .044, η p 2 = .127, and Weber fractions, F(2, 46) = 3.32, p < .045, η p 2 = .126. To interpret this interaction, we examined the difference among the experiments, separately for the TD group and the DD group. In the TD group, there was only a marginally significant effect of experiment on Weber fractions, F(2, 24) = 3.04, p > .067, η p 2 = .202, and a significant effect on JNDs, F(2, 24) = 4.15, p < .028, η p 2 = .257. However, pairwise comparisons revealed no significant differences (for all comparisons, p > .10). In the DD group, in contrast, results showed a significant effect of experiment for both JNDs, F(2, 22) = 10.00, p < .001, η p 2 = .476, and Weber fractions, F(2, 22) = 10.56, p < .006, η p 2 = .490. Pairwise comparisons revealed significant differences between Experiment 1 and each of the other experiments in both JNDs and Weber fractions (JNDs: p < .023 for Experiment 1 vs. 2 and p < .027 for Experiment 1 vs. 3; Weber fractions: p < .018 for Experiment 1 vs. 2 and p < .023 for Experiment 1 vs. 3). Importantly, the analysis of the PSEs revealed no effect of experiment, F < 1, η p 2 = .019, and no interaction between experiment and group, F(2, 46) = 1.50, p > .23, η p 2 = .061. Overall, these comparisons demonstrated the weaker sensitivity of participants with DD to differences in objects’ size and no bias or reduced accuracy of the perceived size. Sensitivity to size was intact, however, when depth cues were added.
Discussion
Using robust and sensitive psychophysical measures, we have provided evidence of reduced sensitivity to subtle differences in size in adults with DD. At the same time, this study demonstrates their accurate veridical perception: PSEs were comparable with those of TD individuals, and their magnitude perception adhered to fundamental principles typically governing perception. Specifically, the results suggest that both Weber’s law and the principles of perceptual constancy, by which size representations remain stable despite variations in perceived distances, hold in the magnitude perception of individuals with DD. Testing the perceived magnitude and the adherence of perception to these principles of constancy, in addition to sensitivity measures, allowed us to attribute the observed differences in size discrimination between our TD and DD groups to weaker sensitivity in detecting subtle differences of magnitude, rather than to biases in the perceived magnitude. These results suggest that a core deficit in the mental representation of nonsymbolic magnitude may underlie DD.
Our results are consistent with those of previous studies demonstrating impaired magnitude processing on analog magnitude dimensions (but not numerical quantity; Skagerlund & Träff, 2014). Children with DD have shown reduced sensitivity in temporal processing and inferior spatial visualization (as measured by paper folding and mental rotation). Similarly, adults with DD have demonstrated impairment in the processing of conceptual size (i.e., the internal representation of the physical size of an object—for example, we can judge that an elephant is larger than a cat without seeing the actual animals; Glicksman & Henik, 2018). Our results support the idea that a core deficit in magnitude perception (Walsh, 2003), one that is generalized beyond the number domain, may underlie the deficits in numerical-processing abilities in individuals with DD (Henik et al., 2012, 2017).
The differences in sensitivity to subtle differences of size between participants in the TD and DD groups were quantitative, specifically manifested in higher thresholds among participants with DD. At the same time, this group’s JNDs increased monotonically with the increasing sizes of the spheres, indicating the adherence of their perception to Weber’s law. Anobile et al. (2018) also demonstrated adherence to Weber’s law and intact size (and numerosity) adaptation in individuals with DD, and Anobile et al. (2019) showed that people with DD adhere to this psychophysical rule in optimal encoding of numerosity. The weaker size-discrimination abilities, marked by larger Weber fractions, indicate less precise internal representations of magnitude. This is consistent with recent evidence demonstrating associations between individual differences in sensitivity to symbolic and nonsymbolic representations of number and variability in mathematical achievements (e.g., Sokolowski & Ansari, 2016). When combined with our findings, these earlier results support our suggestion that deficient magnitude representations are related to lower arithmetic abilities in individuals with DD.
Experiment 1 demonstrated deficits in magnitude perception in participants with DD, whereas the two other experiments demonstrated typical size discrimination in visual scenes where pictorial depth cues allowed size constancy to affect the perceptual representations of the spheres’ size. The results of the size discrimination of objects embedded in linear-perspective scenes suggest an intact mechanism of size constancy in individuals with DD. When the display contained pictorial depth cues specifying the relative distance of the two objects, the thresholds of both groups were significantly reduced. Participants in the DD group, like those in the TD group, demonstrated remarkably lower thresholds when the target was in the upper position in the display, and its enlarged perceived size (because it was perceived as far away) was compatible with its larger physical size (the upper sphere was physically larger). In the incompatible-with-perception trials, the thresholds were much higher for both groups. Size constancy facilitated size discrimination for both and eliminated the deficit in size discrimination observed for the DD group in Experiment 1. Experiments 1 and 2 employed the same task of size discrimination; the only difference was that in Experiment 2, the spheres were embedded in a background containing depth cues. Thus, the deficit seen for the DD group in Experiment 1 can be attributed to the inability to detect subtle differences in size. Experiment 3 replicated these findings using an enriched scene with both linear-perspective and aerial-perspective cues.
DD has been shown to be a heterogenic disorder (e.g., Rubinsten & Henik, 2009); von Aster and Shalev (2007) suggested a four-step model of intact development, ranging from core numerical abilities to more complicated and acquired arithmetic. Deficits in each of the steps leads to a distinct trait of DD. A deficit in the first stage, for example, leads to damage to a core system of magnitude. Rubinsten and Henik (2009) suggested several types of mathematical-learning disabilities. According to their model, pure DD (i.e., DD with no other general deficit, such as dyslexia) is a result of a deficit in the intraparietal sulcus and appears as deficient size processing. In addition, the right intraparietal sulcus is activated by nonnumerical sizes related to a magnitude system involved in the processing of both countable and continuous sizes (for a review, see Sokolowski & Ansari, 2016). Our findings correspond with the description of pure DD. Moreover, against arguments that the source of DD is a deficit in a domain-specific mechanism of the number sense (Butterworth, 2011), we claim DD originates in a deficit in a general mechanism, that is, a deficit in magnitude sense. Furthermore, our findings demonstrate the ability of individuals with DD to compensate for these weak resolutions of the magnitude sense by using implicit computations (of size constancy, in our case). This may account for the intact performance people with DD sometimes exhibit in numerical-processing tasks (e.g., Bugden & Ansari, 2016).
If this basic size perception is related to arithmetic abilities, it might be helpful to assess deficits appearing in infancy to allow early identification and interventions in math difficulties. Our results also suggest that interventions should involve settings in which the implicit automatic process of magnitude perception mediates arithmetic computations and compensates for numerical-processing deficits in children with DD (Bugden & Ansari, 2016).
Supplemental Material
sj-docx-1-pss-10.1177_0956797621995204 – Supplemental material for Nonsymbolic-Magnitude Deficit in Adults With Developmental Dyscalculia: Evidence of Impaired Size Discrimination but Intact Size Constancy
Supplemental material, sj-docx-1-pss-10.1177_0956797621995204 for Nonsymbolic-Magnitude Deficit in Adults With Developmental Dyscalculia: Evidence of Impaired Size Discrimination but Intact Size Constancy by Nirit Fooks, Bat-Sheva Hadad and Orly Rubinsten in Psychological Science
Footnotes
Transparency
Action Editor: Barbara Knowlton
Editor: Patricia J. Bauer
Author Contributions
All authors contributed to the study design. Testing and data collection were performed by N. Fooks. N. Fooks analyzed and interpreted the data under the supervision of B.-S. Hadad and O. Rubinsten. N. Fooks drafted the manuscript. All authors provided critical revisions and approved the final manuscript for submission.
References
Supplementary Material
Please find the following supplemental material available below.
For Open Access articles published under a Creative Commons License, all supplemental material carries the same license as the article it is associated with.
For non-Open Access articles published, all supplemental material carries a non-exclusive license, and permission requests for re-use of supplemental material or any part of supplemental material shall be sent directly to the copyright owner as specified in the copyright notice associated with the article.