
Abstract
Why do children’s memories often differ from adults’ after the same experience? Whereas prior work has focused on children’s immature memory mechanisms to answer this question, here we focus on the costs of attentional lapses for learning. We track sustained attention and memory formation across time in 7- to 10-year-old children and adults (n = 120) to show that sustained attention causally shapes the fate of children’s individual memories. Moreover, children’s attention lapsed twice as frequently as adults’, and attention fluctuated with memory formation more closely in children than adults. In addition, although attentional lapses impaired memory for expected events in both children and adults, they impaired memory for unexpected events in children only. Our work reveals that sustained attention is an important cognitive factor that controls access to children’s long-term memory stores. Our work also raises the possibility that developmental differences in cognitive performance stem from developmental shifts in the ability to sustain attention.
Keywords
One of the most enduring questions in psychological science is why we remember what we do. This question is even more complex when applied to children, who tend to remember less than adults (Canada et al., 2019; Cycowicz et al., 2001; Daugherty et al., 2017; Ngo et al., 2018, 2019; Ofen et al., 2007; Sprondel et al., 2011). But most past work on memory development glosses over an interesting feature of children’s memories: Although children are generally less likely to form memories than adults, many of their individual memories are just as rich and complex (Ngo et al., 2019). The question of why children form high-quality memories only in select moments has not been fully addressed because most work averages children’s rich and well-formed memories with their many forgotten ones. Here, we ask why children form high-quality memories only in select moments by exploring the role of a separate aspect of cognition: sustained attention (Decker & Duncan, 2020; Honey et al., 2017). In adults, attention fluctuates across time between focus and inattention to shape online task performance (deBettencourt et al., 2018, 2019; Decker et al., 2023; Esterman et al., 2013; Fortenbaugh et al., 2018) and memory in each moment (Adam & deBettencourt, 2019; deBettencourt et al., 2018, 2019; Decker et al., 2020). Yet, at present, we know little about how children’s attention fluctuates in terms of the length and frequency of attentional lapses and even less about how these fluctuations govern memory formation from moment to moment. Here we address these gaps by characterizing the temporal profile of attentional fluctuations and their respective influence on memory across development.
The idea that children can form high-quality memories—but do so less often than adults—was nicely illustrated in a study examining children’s memories for multielement events involving a person, object, and scene (Ngo et al., 2019). This study found that if 6-year-olds remembered one association between the elements of the event, they were equally as likely as adults to remember all of the associations. Children, however, remembered fewer events than adults altogether. Thus, although children’s memories can be equally as complex as adults’, children are less likely to form memories overall. This dissociation between children’s sometimes very high-quality memories and their tendency to form fewer of them is difficult to explain by immature memory processes alone. Based on work in adults (deBettencourt et al., 2018, 2019; Decker & Duncan, 2020; Decker et al., 2020), fluctuations in attention may explain this dissociation—switching memory “on” or “off” in each moment.
The hypothesis that fluctuations in sustained attention explain children’s memory formation in each moment is supported by a rich body of work linking attention to memory across individuals. For example, poorer selective attention correlates with worse memory in childhood (Blumberg et al., 2005; Plebanek & Sloutsky, 2019), as does poor sustained attention in developmental disorders (Riccio et al., 2007). However, although this body of work suggests that sustained attention and memory develop in parallel, it remains unclear whether fluctuations in attention causally impact children’s memory on a moment-to-moment basis.
Further complicating our ability to predict how attentional fluctuations shape children’s memory is the fact that little is known about how children’s attention fluctuates in the first place. Although children display high error rates and response-time variability on sustained attention tasks (Fortenbaugh et al., 2015), average performance tells us little about how the temporal character of sustained attention differs across development. One longitudinal study using a fast Fourier transform reported that fast (high-frequency) fluctuations in response time during a monotonous task decrease from 6 to 11 years of age, suggesting more frequent lapses in younger than older children (Lewis et al., 2017). However, this study did not compare children to adults, verify that these fluctuations covaried with task accuracy, or causally link them to the likelihood of forming memories.
Statement of Relevance
Why do children form exceptional memories only in select moments? Most prior work has pointed to children’s immature memory abilities as an answer, but here we explore the role of children’s frequent attentional lapses. We report the discovery that moment-to-moment fluctuations in attention between good and poor states causally influence whether children form memories in each moment and predict memory formation more in children than adults. Moreover, we find that children’s attention lapsed in time twice as often as adults’, and these lapses hurt memory more in children. Our work suggests that sustained attention acts like a gatekeeper, controlling what “gets in” to children’s long-term memory—and the gate to memory remains shut more often in children. These novel findings raise the possibility that differences in sustained attention may explain broad differences in cognitive performance and that to boost children’s learning we must first help them to effectively sustain attention.
To fill these gaps, we leveraged a validated approach to measure attentional fluctuations across time and related them to the fate of children’s individual memories. The study included young adults (mean age = 18.8 years, range = 17–29 years; n = 60) and 7- to 10-year-old children (mean age = 8.53 years; n = 60), who typically perform as well as adults on memory tasks such as ours with low strategic attentional demands (Billingsley et al., 2002; A. L. Brown & Scott, 1971; Ghetti & Angelini, 2008; Nelson, 1971). Participants first completed a sustained attention task in which they categorized trial-unique images of animals and objects as living or nonliving (Fig. 1a). Critically, 90% of images depicted an object (frequent trials), and the remaining 10% depicted an animal (infrequent trials); thus, achieving high categorization accuracy required participants to press the same button repeatedly and rarely switch to an infrequent response. This repetitive response structure elicits fluctuations in attention (deBettencourt et al., 2018; Esterman et al., 2013, 2014; Fortenbaugh et al., 2015). After the categorization task, participants completed a surprise recognition memory test (Fig. 1b) to probe memory for each image shown during categorization. We then related attentional fluctuations during categorization to later memory to examine how attention and memory processes covary across time across development.
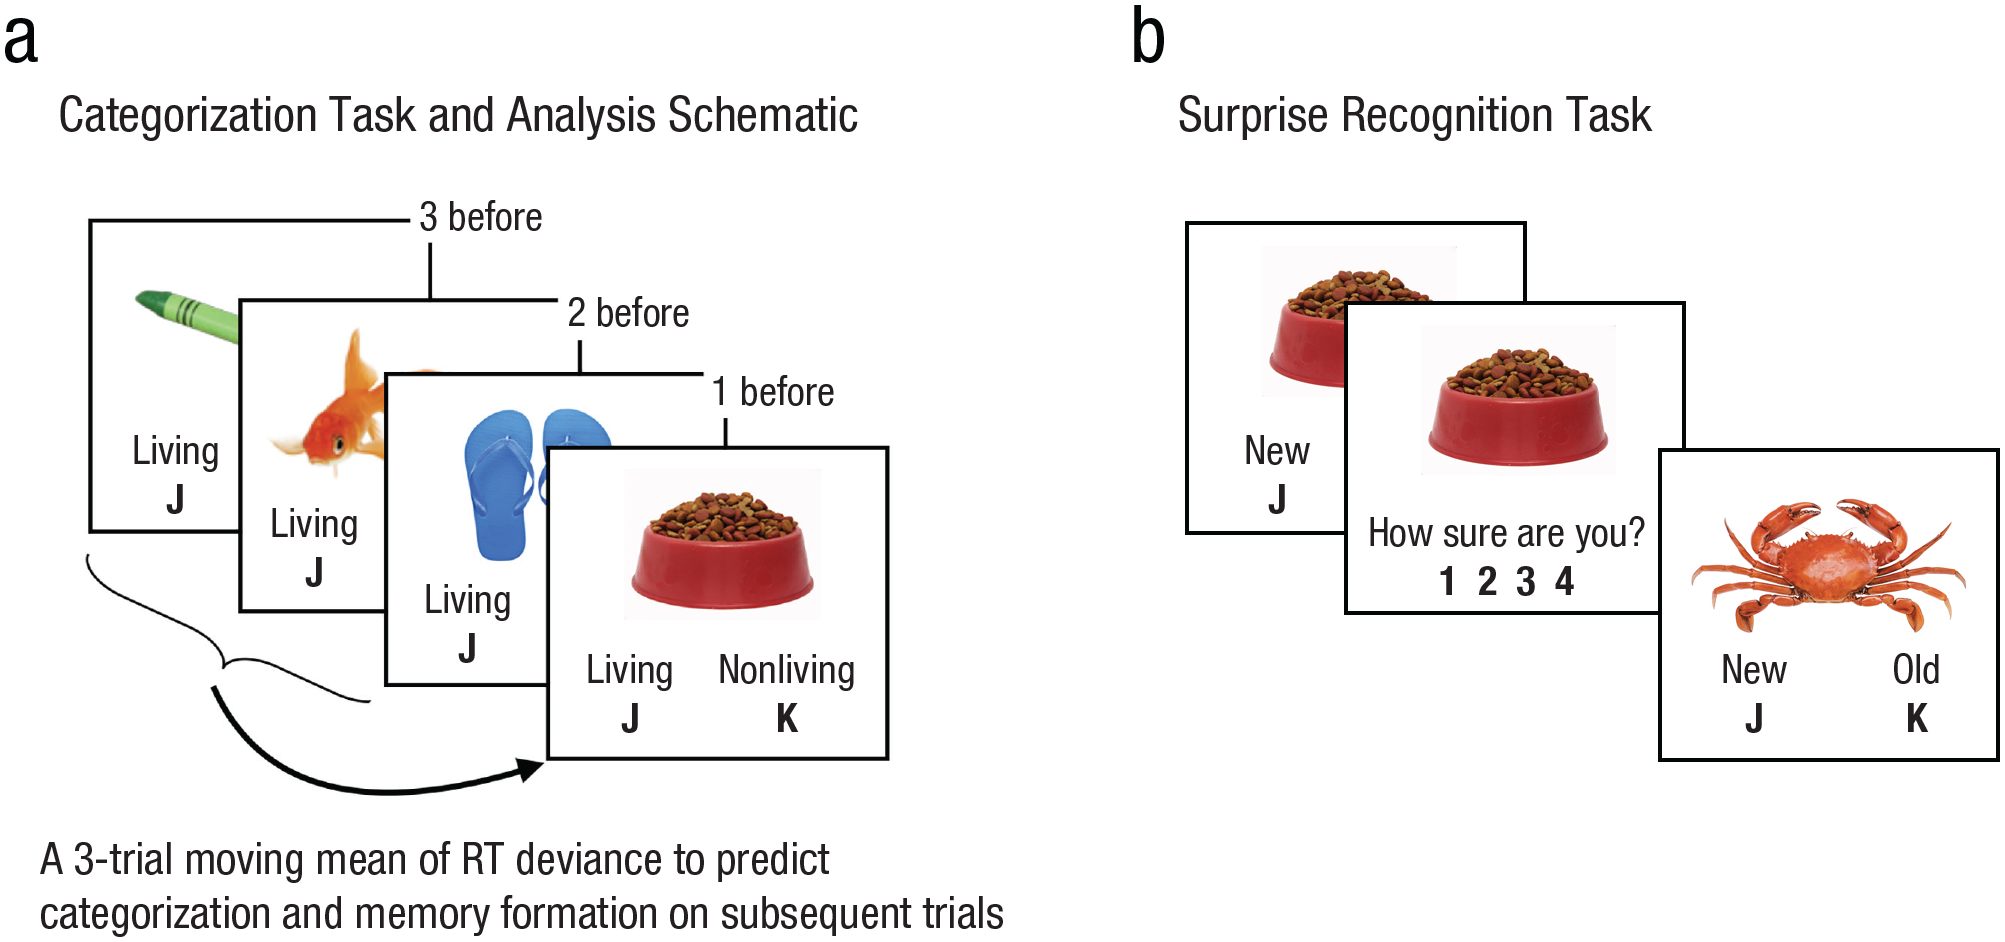
Task and analysis schematic. During the categorization task (a), participants viewed 332 images while categorizing each as “living” (approximately 10%; infrequent trials) or “nonliving” (approximately 90%; frequent trials). A three-trial moving average of response time was used to index attentional fluctuations, which were then related to how well participants categorized and formed memories about the subsequently presented image. Immediately after the categorization task, participants completed a surprise-recognition memory task (b) that tested memory for each image shown during categorization. Participants indicated whether each image was “old” (from the categorization task) or “new” and then indicated their confidence on a 4-point scale.
To preview, children’s attention lapsed twice as frequently as adults, and more time spent lapsing correlated with worse memory performance across children. Within children and adults, attention fluctuated to causally predict memory formation in each moment, such that momentary lapses covaried with a lower likelihood of forming memories. Importantly, these fluctuations covaried with memory more closely in children than adults. Moreover, attentional fluctuations had broader consequences on memory in children: Although poor attention impaired memory for expected (frequent) events in both children and adults, it impaired memory for unexpected (infrequent) events in children only. These findings suggest that attentional lapses are more pervasive and detrimental to learning in childhood.
Open Practice Statement
Data and analysis code have been uploaded to github at https://github.com/alexandradecker/lapses-and-memory-. Stimuli and PsychoPy scripts are available on the OSF at https://osf.io/259m4. Statistical tests for children (https://Sofio/259m4) and adults (https://osf.io/7tvb4) were preregistered separately on the OSF.
Methods
Participants
Sixty-four children and 64 adults participated. Adults were recruited through the University of Toronto Department of Psychology subject pool and received course credit for participating. Children were recruited via outreach activities in and around the Toronto area and received a gift card or toy valued at $10 for participating. Following preregistered exclusion criteria, data from eight participants were excluded because of psychiatric illness (n = 2 children, n = 3 adults) and memory performance (d′) that fell > 2.5 standard deviations below the mean (n = 2 children, n = 1 adult), leaving 60 children (mean age = 8.53 years, range = 7–10 years; 30 females) and 60 adults (mean age = 18.8 years, range = 17–29 years; 42 females) in the final sample. A power analysis on pilot data (n = 20 adults, n = 15 children) indicated that a target sample of 60 participants per age group would provide at least 80% power to detect the observed medium within-subject effects (d = 0.53). Participants had normal or corrected-to-normal vision and reported no history of head trauma or neurological or psychiatric illness. Experimental procedures were approved by the local ethics committee, and participants or parents provided written informed consent/assent.
Stimuli
Stimuli were 69 colored images of unique animals and 375 colored images of unique inanimate objects (Fig. 1). Twenty images were used in a practice phase (five images of animals), and 424 were used in the experimental session (64 animals). Stimuli were presented on a white background on a 13-in. MacBook using PsychoPy software (Peirce, 2007).
Procedure
Participants completed a sustained-attention task in which they categorized trial-unique images as “living” or “nonliving” (Fig. 1a). They then performed a surprise old/new recognition test that assessed memory for all the images presented during the sustained-attention task as well as a set of new images (Fig. 1b). Image assignment to the “old” condition (images presented in the sustained-attention and recognition task) and to the “new” condition (images presented only in the recognition task) was counterbalanced such that each image was similarly likely to appear as old or new across participants.
Sustained-attention task
Participants viewed 332 unique images that appeared one at a time for 1.5 s in the center of a white computer screen (Fig. 1a). Three hundred were of inanimate objects (approximately 90%; “frequent” category), and 32 were of animals (approximately 10%; “infrequent” category). Participants were asked to categorize each as “living” (by pressing “k”) or “nonliving” (by pressing “j”) within the 1.5-s time frame that each image was displayed. Images were presented in a fully random order across participants. There was no intertrial interval. Response mappings were presented below each image throughout the task. Participants completed a practice block of 20 trials before completing the primary task.
Surprise-recognition test
Participants viewed all the images shown in the sustained-attention task (n = 332) randomly intermixed with a set of new images (32 living, 60 nonliving; Fig. 1b). After each memory decision, participants rated their confidence on a four-point scale (1 = just guessing, 2 = not quite sure, 3 = pretty sure, 4 = 100% sure). Participants had unlimited time to make decisions.
Metric of individual differences in sustained attention across participants
We calculated an individual-differences metric of attention—lapse rates—that reflected the proportion of trials participants spent in a poor attentional state. To calculate lapse rates, we adapted an existing approach that labels each trial “in the zone” or “out of the zone,” and then we calculated the proportion of trials each participant spent out of the zone. This approach, adapted from Esterman and colleagues (2013), was ideal for our purposes because it allowed us to simultaneously capture individual differences in attention (i.e., the percentage of trials spent out of the zone) while also estimating attentional state on each trial, which was used to examine developmental differences in the frequency and average length of attentional lapses. We used this lapse-rate measure as opposed to other existing metrics of attention, such as the coefficient of variation or the standard deviation of response time (RT; Fortenbaugh et al., 2015, 2017; Lewis et al., 2017) because these latter metrics provide only a single aggregate measure of attentional performance per participant and do not identify attentional state on each trial. Thus, these latter metrics do not allow us to calculate the average length and frequency of lapses across participants.
To calculate individual differences in attentional performance, we determined whether each trial reflected an attentional lapse before computing lapse rates and the length and frequency of lapses. We first linearly interpolated RT data for missed and infrequent trial responses by averaging across the four surrounding trials (two before, two after; Esterman et al., 2013) to ensure that infrequent trials, which elicited especially slow responses, were not inappropriately labeled out of the zone. Following Esterman et al. (2013), we then calculated the mean absolute deviance of single-trial RT data (how much each RT deviated from that subjects mean) and smoothed these values using a gaussian kernel, encompassing the four surrounding trials at its half maximum (for depictions of raw and smoothed RT deviance in a representative adult and child, see Figs. 2a–2d). Independent pilot data indicated that gaussian smoothing captured gradual shifts in attention across time, likely by reducing the idiosyncratic effects of specific trials on RT. We then assigned in-the-zone and out-of-the-zone labels to trials on the basis of a particular RT threshold. The threshold was determined by calculating the median of the smoothed variance time course (one value per participant) and then computing the mean of these values. We assigned out-of-the-zone labels to epochs of trials marked by RT deviance higher than the threshold and in-the-zone labels to epochs of trials marked by RT deviance below the threshold. This group threshold was applied to children and adults, allowing us to directly compare age groups using the same criteria.
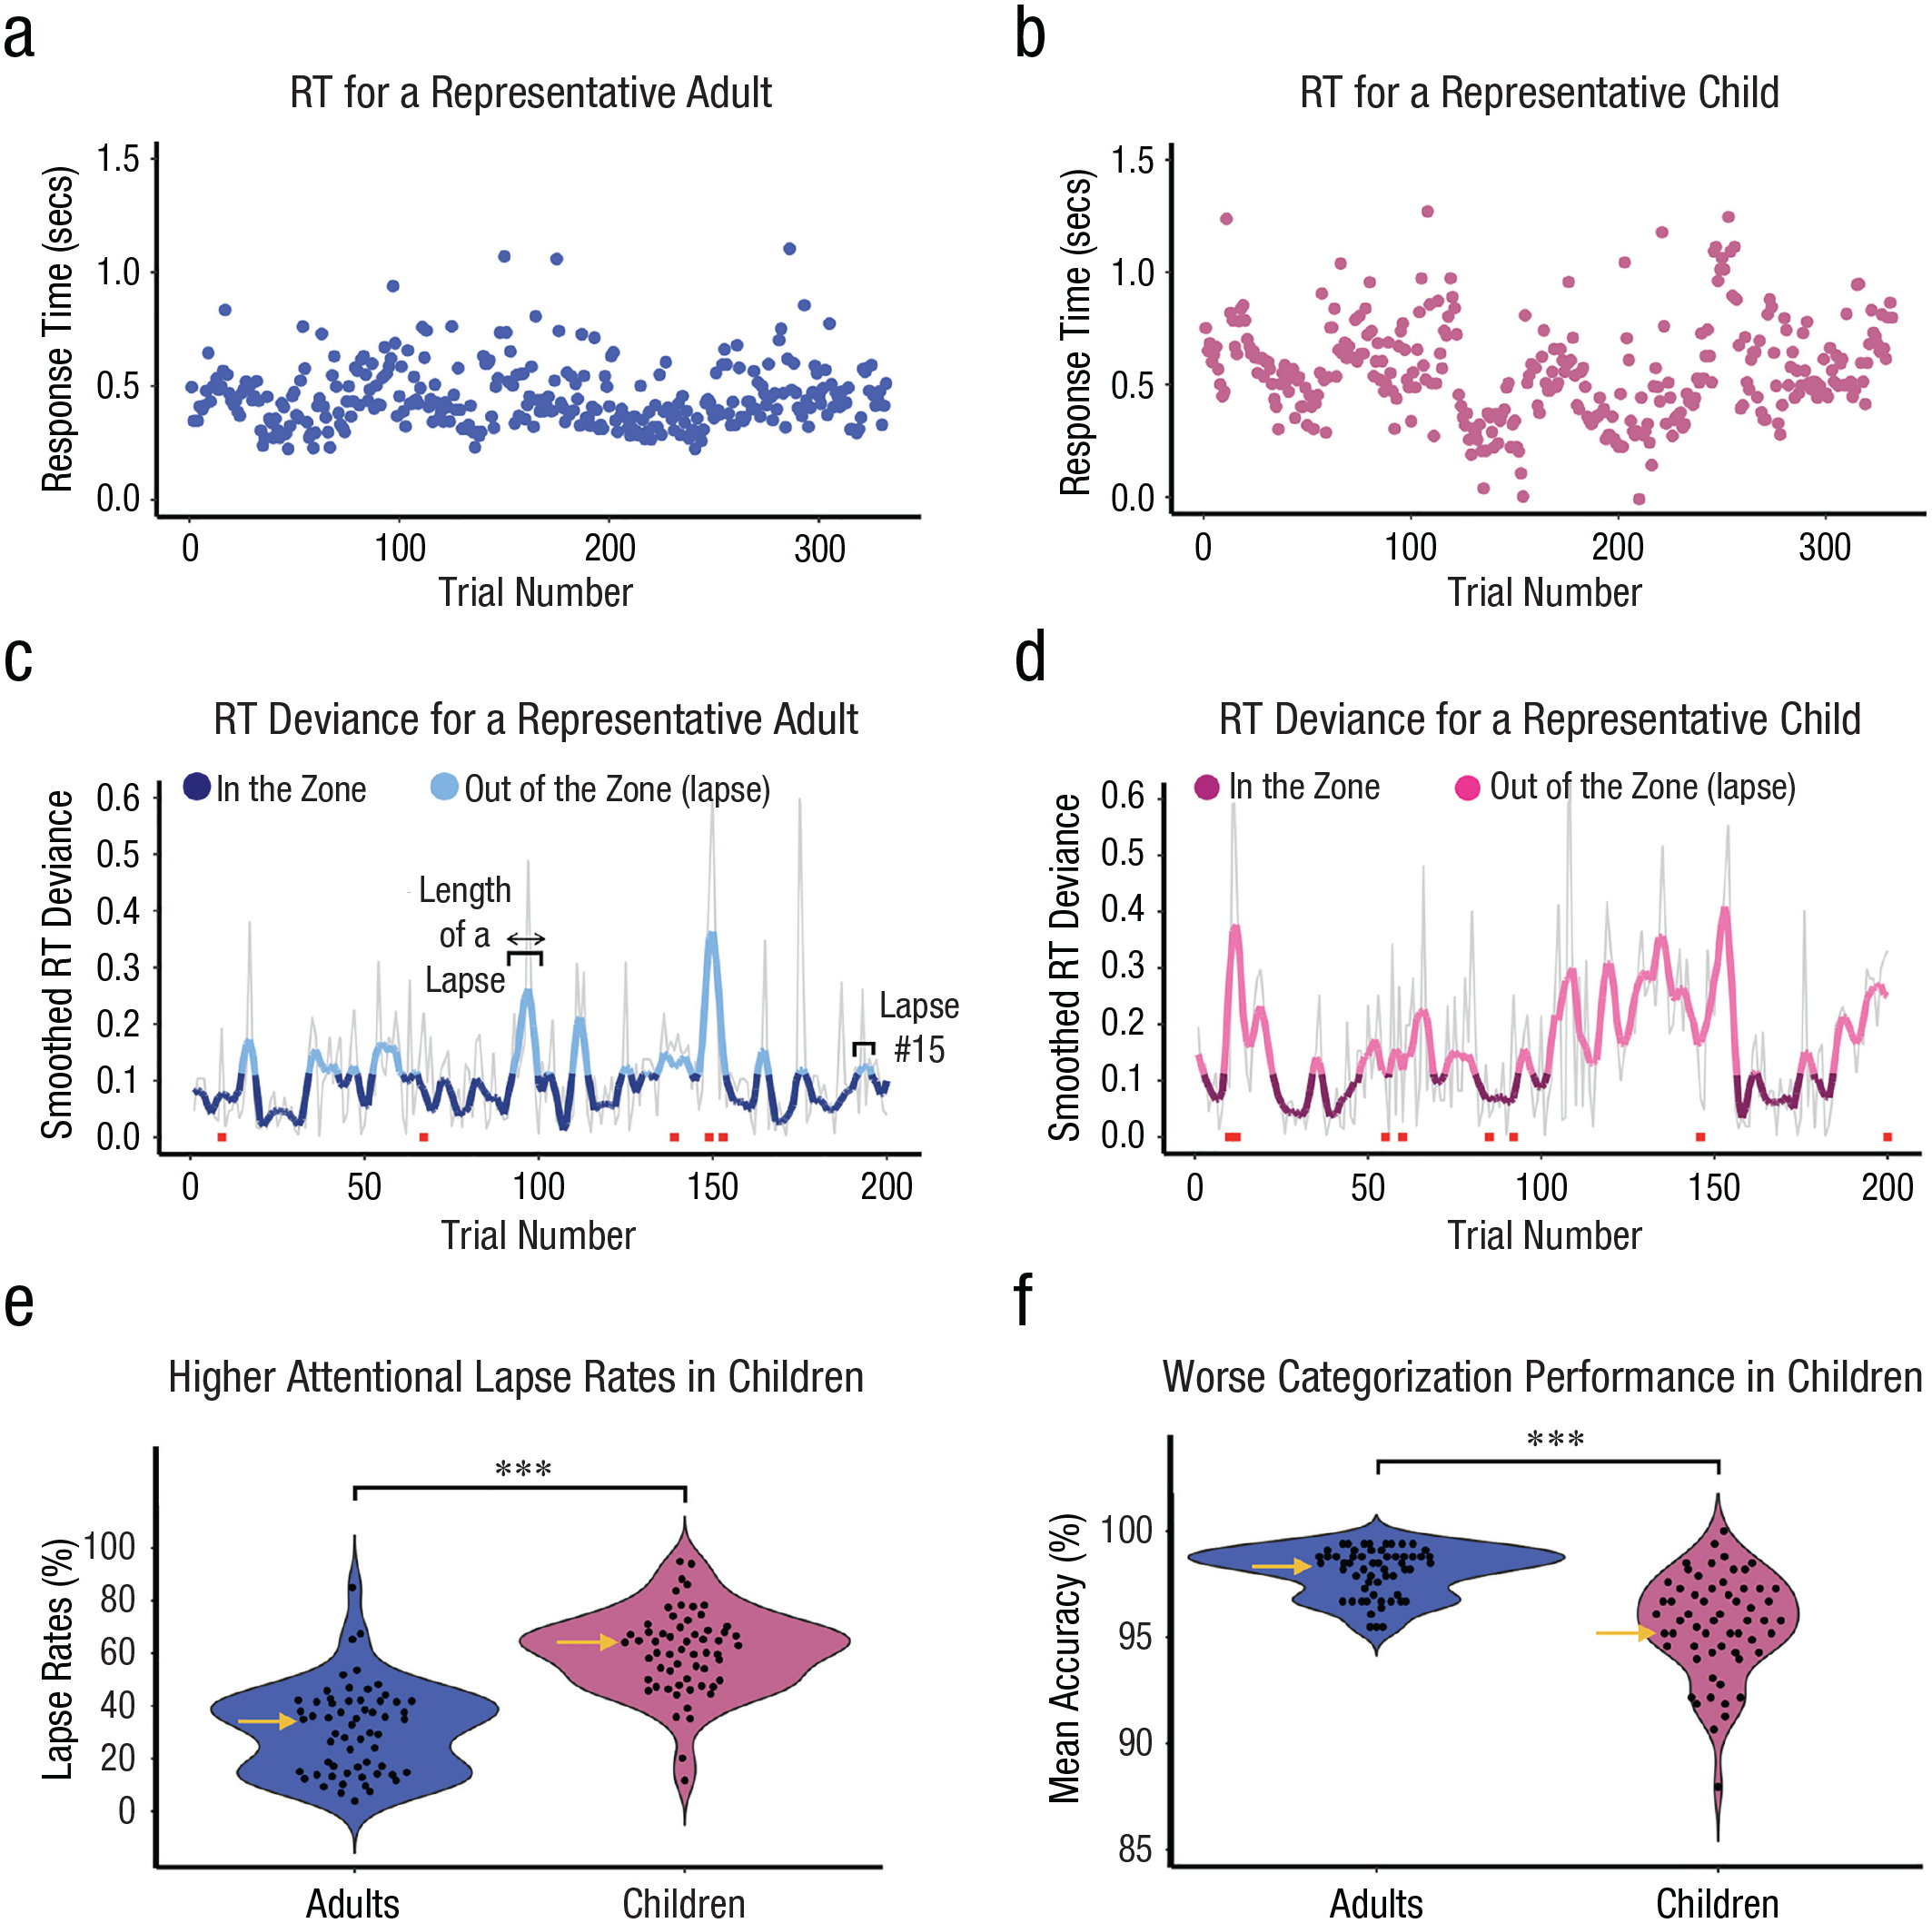
Response-time (RT) fluctuations, attentional lapse rates, and categorization accuracy in children and adults. RT across trials is plotted for a representative adult (a, blue) and child (b, pink). Smoothed mean absolute RT deviance (c and d) is depicted by the thick colored lines for the same participants in (a) and (b), with more saturated colors representing “in the zone” and lighter tones representing “out of the zone.” Gray lines depict nonsmoothed mean absolute RT deviance. Red squares indicate categorization errors. Children had (e) higher lapse rates than adults (i.e., the proportion of time spent out-of-the-zone) and (f) worse categorization performance (ps < 0.001). Black dots mark individual participant means, and the shape of the violin represents the distribution. Yellow arrows mark the child and adult whose data are plotted in (a)–(d) and who have the median attentional lapse rate for their age group.
After determining the attentional states on each trial, we calculated three separate individual-difference metrics of sustained attention: an attentional lapse rate operationalized as the proportion of trials spent out of the zone, the number of attentional lapses operationalized as the number of independent streaks of consecutive out-of-the-zone trials, and the median length of attentional lapses. We confirmed via two linear regressions (separately for children and adults) that higher attentional lapse rates covaried with lower categorization accuracy across participants—all participants: b = −0.07, SE = 0.007, t(114) = −9.89, p < .001, r = −.68; children: b = −0.09, SE = 0.02, t(57) = −5.36, p < .001, r = .58; adults: b = −0.03, SE = 0.009, t(56) = −3.39, p = .001, r = .41 (see Fig. 3a). Furthermore, lapse rates correlated with the coefficient of variation, a validated measure of sustained attention in both age groups (the standard deviation of RT divided by the mean RT for each participant; Fortenbaugh et al., 2015)—all participants: b = 0.13, SE = 0.02, t(114) = 6.74, p < .001, r = .53; children: b = 0.24, SE = 0.04, t(56) = 6.27, p < .001, r = .64; adults: b = 0.19, SE = 0.03, t(56) = 5.88, p < .001; r = .62 (see Fig. S1A in the Supplemental Material available online). Lapse rates also correlated with the standard deviation of RT in both age groups—all participants: b = 0.20, SE = 0.006, t(114) = 34.61, p < .001, r = .96; children: b = 0.24, SE = 0.01, t(56) = 16.57, p < .001, r = .91; adults: b = 0.17, SE = 0.009, t(56) = 17.97, p < .001, r = .92 (see Fig. S1B). The convergent validity between the lapse-rate metric and these measures showcases how lapse rates robustly capture individual differences in sustained attention.
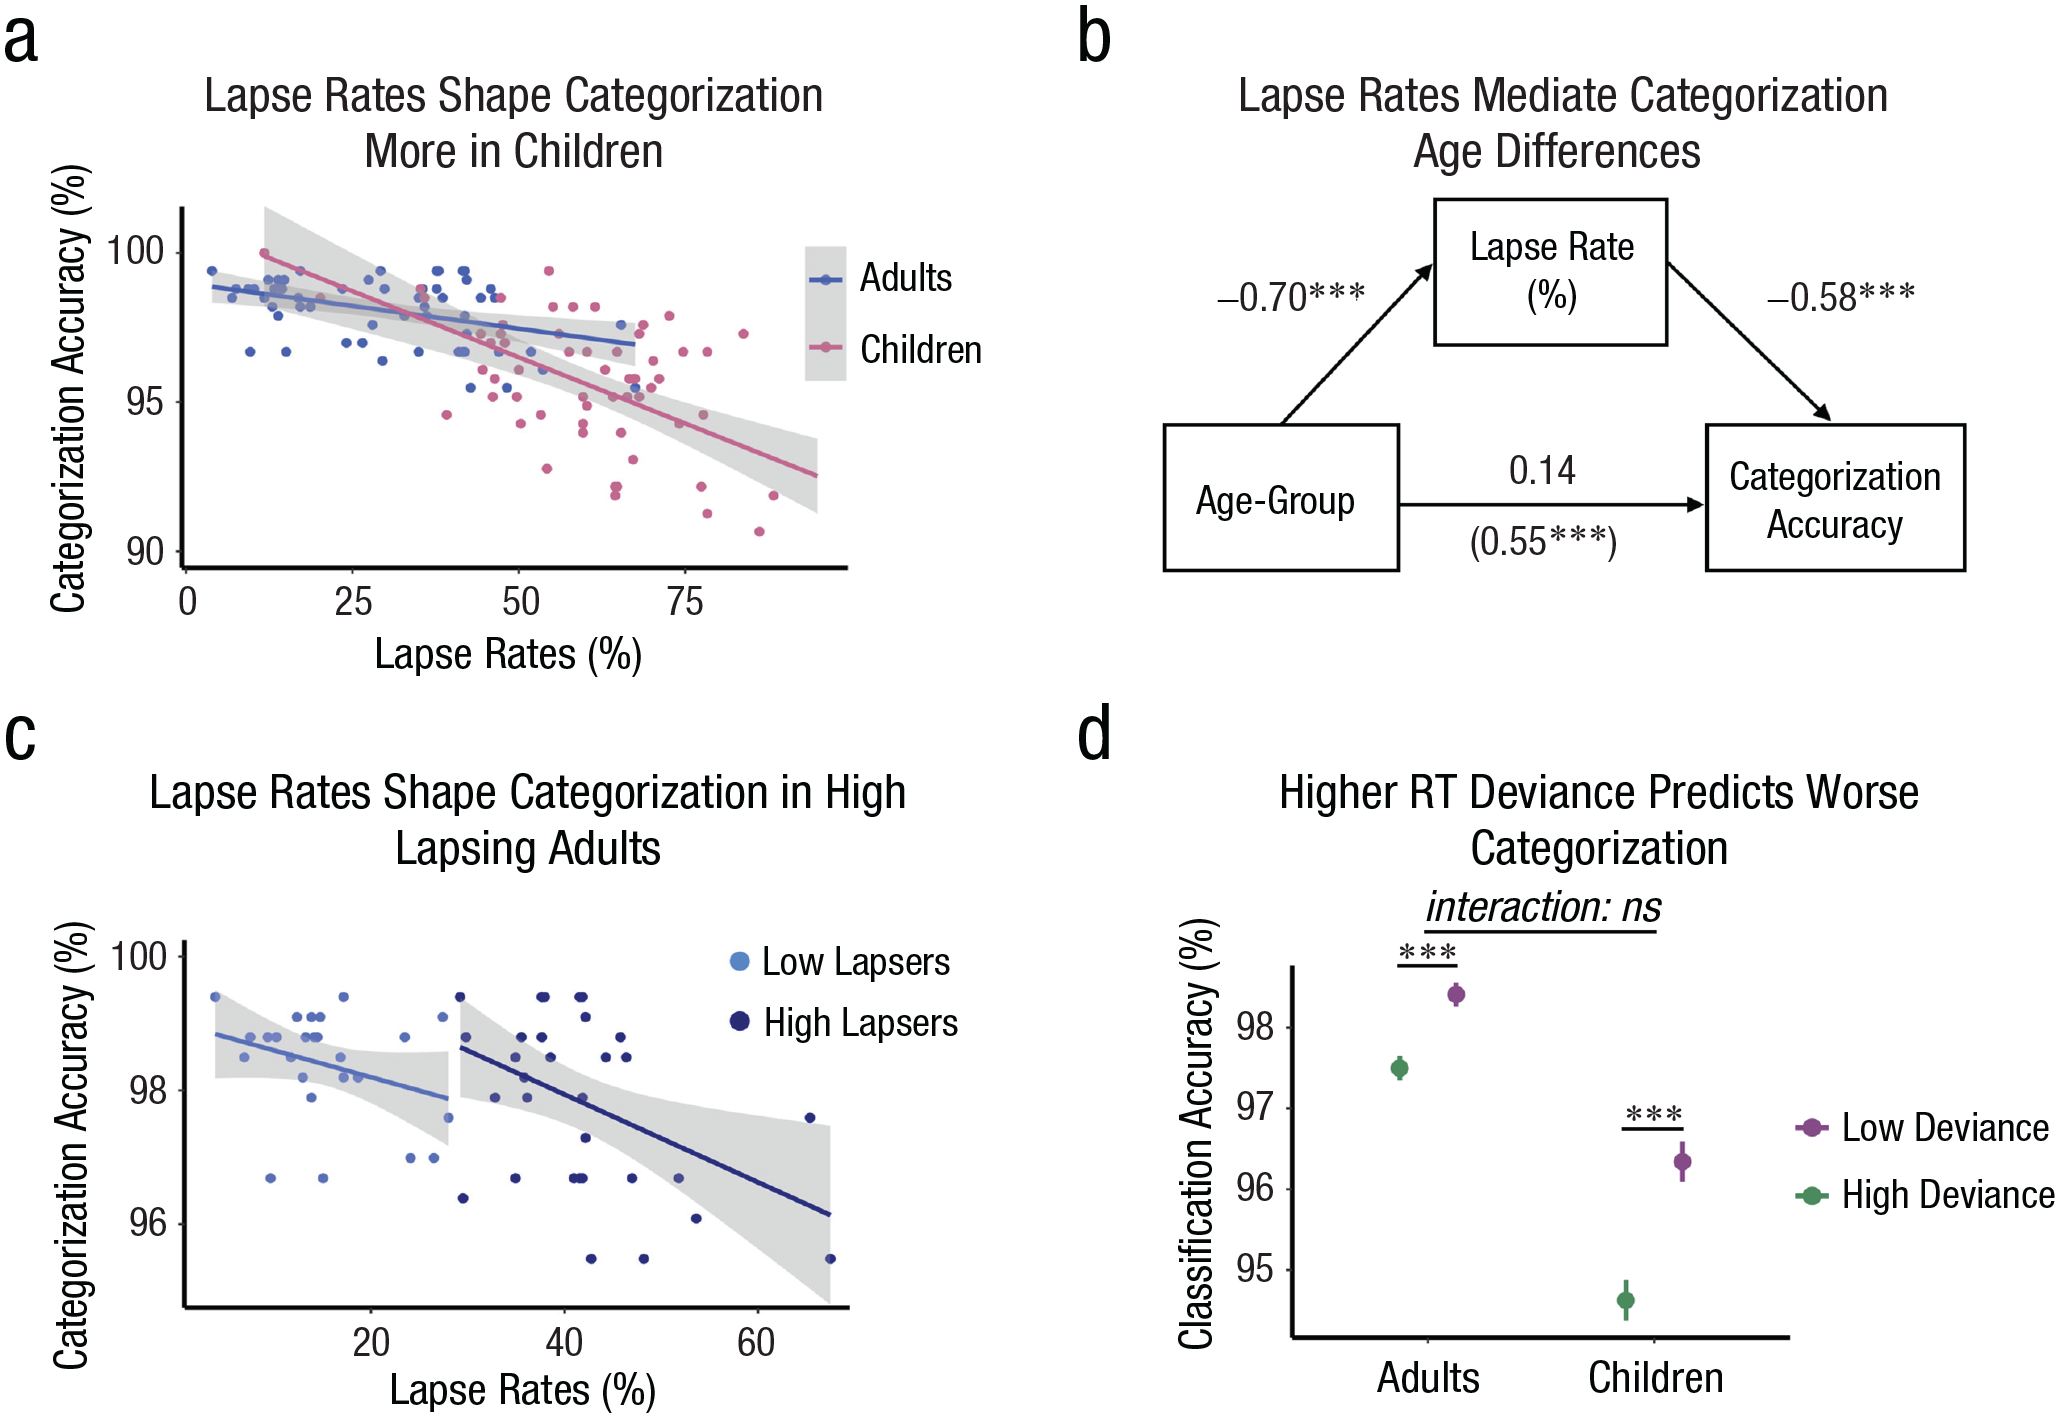
Relationships between attention and categorization accuracy in children and adults. Individual differences in lapse rates correlated with categorization accuracy in both age groups (a), such that higher lapse rates predicted worse categorization (ps < 0.001). The relationship was stronger in children (Age × Attentional Lapse Rate: p = 0.025). Shaded gray reflects 95% confidence intervals and dots represent individual participant data. Attentional lapse rates fully mediate age-group differences in categorization accuracy (b). Standardized coefficients are reported for ease of interpretation. The values in parentheses represent the relationship between age and categorization before accounting for lapse rates (total effect), whereas the values without parentheses reflect the influence of age on categorization after accounting for lapse rates (direct effect). Higher lapse rates correlate with worse categorization accuracy among adults who lapsed most but not least often—high lapsers: p = 0.01; low lapsers: p = 0.11 (c). Fluctuations in sustained attention within participants covary with categorization accuracy similarly in children and adults, such that higher RT deviance led to a higher error likelihood (ps < 0.001; d). For ease of visualization, values of the moving mean deviance time course were assigned to high- and low-deviance labels using a median split within subjects. Stars correspond to the significance levels from models reported in the text. Means and standard error bars are plotted.
Metric of attentional-state fluctuations within participants
We operationalized attentional state on each trial as the moving average of the mean absolute RT deviance across the three preceding trials (N-3, N-2, N-1; for an analysis schematic, see Fig. 1a). Prior work shows that RT deviance, whether fast or slow, reflects poorer attention; whereas fast RTs reflect reduced monitoring for response-inhibition requirements (Allan Cheyne et al., 2009), very slow RTs reflect poorer processing of ongoing stimuli, leading to more time required for responding (Weissman et al., 2006). We confirmed via two linear mixed-effects model regressions that the smoothed RT-deviance measure predicted trial-by-trial accuracy in children and adults such that higher deviance led to more errors on subsequent trials—children: b = −2.57, SE = 0.44, z = −5.88, p < .001; adults: b = −4.39, SE = 0.63, z = −7.02, p < .001 (Figs. 3d and S7), confirming that this measure tracks fluctuations in sustained attention over time.
Indexing memory performance
We used d′ = z(hit rate) – z(false-alarm rate) to measure individual differences in memory performance on the surprise-recognition test. Low-confidence hits and false alarms were excluded from the measure (confidence ratings of 1 or 2) to remove guesses. If a participant had a hit rate of 1 or false-alarm rate of 0, we adjusted the calculation (adjusted hit rate: N/N + 1; adjusted false-alarm rate: 1/N + 1), where N is the total number of trials included in the calculation. In addition to calculating d′ across all trials, we calculated each participant’s d′ separately for images from the frequent and infrequent category.
To index fluctuations in memory formation across time, we used memory hits across trials. For within-participant analyses, memory hits were operationalized as high-confidence old responses to an old image (confidence ratings of 3 or 4), and misses were considered new responses to an old image.
Data transformations
Age group, accuracy, trial type, and memory hits were effect-coded or dummy-coded (children = −0.5, adults = 0.5; correct = 1, error = 0; infrequent = −0.5, frequent = 0.5; hit = 1, miss = 0). Attentional lapse rates were mean-centered before fitting models. Linear drift in RT resulting from time-dependent effects (e.g., practice and fatigue) was removed by extracting residuals from a model predicting RT from the trial number for each participant. Residuals were used in place of raw RT in analyses.
Statistical analysis
Statistical analyses were performed in the R programming environment (Version 3.6.3; R Core Team, 2013). Three participants were excluded from between-subject analyses because of low categorization accuracy (n = 1 adult, n = 1 child) and high attentional-lapse rates (n = 1 adult) that fell > 2.5 standard deviations from the sample mean. Although we did not preregister excluding participants for particularly low categorization scores or low lapse rates, we excluded these three participants to avoid biasing our results, although their exclusion did not change our results. These participants were retained for within-subject analyses examining how attentional fluctuations shape concurrent categorization and memory performance.
To test within-subject predictions, we used general linear mixed-effects or logistic-regression models (glmer and lmer function in the lme4 packages; Bates et al., 2015), and the lmerTest package was used to obtain p values using Satterthwaite’s degrees of freedom. These models included random slopes nested within participants for within-subject repeated-measures variables that were included as fixed effects. Random intercepts were also modeled for each participant, and the full covariance in the random-effects structure was modeled. In the case that a model did not converge on a parameter estimation (V. A. Brown, 2021) we used the “bobyqa” optimizer that balances processing time and getting a valid convergence, increased the number of iterations, and forced the correlations among random effects to be zero to reduce the computational complexity.
Examining developmental differences in attention and memory performance
We fit three t tests to assess whether children and adults differed in the rate, duration, or frequency of attentional lapses (for additional permutation analyses focusing on age-group differences in lapse frequency and duration, see Analysis S1 in the Supplemental Material) and two linear mixed-effects regression models to explore whether mean categorization or memory performance (d′) differed by age group (Tables S1 and S12 in the Supplemental Material). In these models, trial type and age group were included as covariates and interaction terms. In the case of significant Age × Trial Type interactions, we used linear models to uncover age-group differences separately for each trial type (Tables S2, S3, S13, and S14).
Relating individual differences in lapse rates to categorization accuracy and memory performance
We fit two linear mixed-effects regression models to probe whether lapse rates influenced categorization or memory performance (d′) more strongly in children than adults and whether the influence of lapses differed by trial type. Therefore, attentional lapse rate, age group, and trial type were included as covariates and interaction terms to assess the presence of two- and three-way interactions. Linear regressions were used to unpack simple slopes from significant interactions. In the case that trial type did not moderate the effect of lapse rates, trial type was removed from the models, and we fit regressions that collapsed across trial types (Tables S4–S8 and S16–S18). To confirm that the relationship between attention and memory performance generalized across other validated metrics of sustained attention, we refit the models above relating attention to memory performance using alternative metrics of attention—in particular, the coefficient of variation and the standard deviation of RT. The results from these models are reported in Analysis S2 and reveal patterns that are largely consistent with those reported here.
We also fit three mediation models to test whether sustained attention mediated age differences in categorization. One model included all trials (collapsed across trial type), and the two other models investigated age differences on frequent and infrequent trials separately. The direct and indirect effects of age group on categorization performance were modeled using linear regressions. In these models, we fit 5,000 bootstrap iterations to provide stable estimates of the direct, indirect, and total effects. We report 95% confidence intervals and intervals that did not include zero were considered statistically significant.
Relating fluctuations in sustained attention to trial-by-trial shifts in categorization accuracy and memory formation
We tested whether fluctuations in RT deviance covaried with categorization accuracy or memory hits more strongly in children than adults (for an analysis schematic, see Fig. 1a). Categorization accuracy and memory hits served as dependent variables in separate models, and preceding RT deviance, trial type, age group, and their interaction were modeled as predictors (Tables S11 and S21).
Results
In reporting our results, we first characterize developmental differences in the temporal dynamics of sustained attention—namely, the total time participants spent lapsing (i.e., the attentional lapse rate; Figs. 2a–2d) and the length and frequency of attentional lapses. We then describe how individual differences in sustained attention, as well as fluctuations in sustained attention across time, shape categorization accuracy and memory formation. In describing both relationships, we first focus on relationships with categorization performance followed by relationships with memory formation.
Children’s attention lapsed twice as frequently as adults’
Children had higher lapse rates than adults, and their lapses were longer and more frequent—age differences in lapse rates: t(115) = 10.65, p < .001, r = .70; lapse length: t(78) = 7.05, p < .001, r = .62; lapse frequency: t(101) = 4.10, p < .001, r = .38 (Figs. 2e and S2A and S2B). Permutation testing revealed that children’s more frequent lapses were not a by-product of their greater time spent lapsing overall (i.e., higher lapse rates). However, children’s longer lapses were not independent of their higher lapse rates (see Analysis S1 and Figs. S3A and S3B). Thus, what look like longer lapses in childhood could simply reflect the higher probability of children being out of the zone in the first place. Immature sustained attention may therefore be best characterized by more frequent lapses rather than a tendency to get stuck in them.
Children’s higher lapse rates underlie their lower categorization performance
Children had worse categorization accuracy than adults, b = 0.06, SE = 0.01, t(118) = 5.22, p < .001 (Fig. 2f and Table S1). This was particularly true for the attentionally demanding infrequent trials—Age × Trial Type: b = −0.09, SE = 0.02, t(118) = −4.07, p < .001; age difference on frequent trials: b = 0.02, SE = 0.002, t(115) = 7.28, p < .001, r = .56; age difference on infrequent trials: b = 0.10, SE = 0.02, t(115) = 4.69, p < .001, r = .40 (Figs. S4A and S4B and Tables S2 and S3M).
In general, individual differences in lapse rates correlated with categorization accuracy across the sample, such that higher lapse rates were associated with worse categorization, b = −0.12, SE = 0.03, t(113) = −3.49, p < .001. However, lapse rates and categorization accuracy were more correlated in children than adults—Age × Attentional Lapse Rate: b = 0.16, SE = 0.07, t(113) = 2.27, p = .025 (Fig. 3a and Table S4). This age-group difference was marginally larger when considering accuracy on infrequent trials—Age × Attentional Lapse Rate × Trial Type: b = −0.25, SE = 0.13, t(113) = −1.86, p = .063. Indeed, higher lapse rates were linked to lower categorization accuracy on infrequent trials in children only—frequent trials in children: b = −0.06, SE = 0.01, t(57) = −5.56, p < .001, r = .59; frequent trials in adults: b = −0.03, SE = 0.004, t(56) = −6.54, p < .001, r = .66; infrequent trials in children: b = −0.34, SE = 0.11, t(57) = −3.09, p = .003, r = .38; infrequent trials in adults: b = −0.06, SE = 0.08, t(56) = −0.73, p = .470, r = .10; Figs. S6A and S6B and Tables S5–S8). This may have been because infrequent trials captured adults’ attention, rescuing performance. Notably, children’s higher lapse rates also mediated age differences in categorization accuracy (Fig. 3b and Analysis S3), highlighting that these lapses explain developmental difference in categorization performance.
To explore whether individual differences in lapse rates influenced categorization accuracy more in children simply because they lapsed more frequently than adults, we tested whether higher lapse rates impaired accuracy in adults who lapsed a lot (i.e., who were most like children) versus adults who lapsed less. Using an unbiased approach to partitioning adults into a high- and low-lapse group with k-means clustering (Analysis S6), we found that high lapse rates correlated with low accuracy only in adults who lapsed most often—high-lapse group: b = −0.07, SE = 0.02, t(30) = −2.72, p = .011, r = .44; low-lapse group: b = −0.04, SE = 0.02, t(24) = −1.64, p = .114, r = .32 (Fig. 3c and Tables S9 and S10). This exploratory result raises the possibility that individual differences in attention are not inherently more correlated with categorization accuracy across children, but the relationship may be more pronounced in groups with the highest lapse rates.
Within-participant fluctuations in attention shape categorization accuracy similarly in children and adults
In general, within-subject attentional fluctuations covaried with categorization accuracy across time: RT deviance was higher before errors than correct responses (b = −2.95, SE = 0.40, z = −7.42, p < .001; for an analysis schematic, see Fig. 1a). This relationship was stronger when considering frequent compared with infrequent trials (RT Deviance × Trial Type: b = −2.17, SE = 0.71, z = −3.04, p = .002; frequent trials: b = −3.98, SE = 0.49, z = −8.20, p < .001; infrequent trials: b = −1.88, SE = 0.58, z = −3.22, p = .001), possibly because infrequent trials interrupted endogenous attentional fluctuations. Fluctuations in attention within participants also shaped categorization accuracy to a similar extent in children and adults (Age × RT Deviance: b = −1.10, SE = 0.79, z = −1.39, p = .165; Age × RT Deviance × Trial Type: b = −2.15, SE = 1.41, z = −1.52, p = .128; Figs. 3d and S7 and Table S11). Thus, attentional fluctuations across time had similar detrimental consequences on categorization accuracy across development.
Equivalent memory performance in children and adults
Memory performance (d′) did not reliably differ in children and adults, similar to prior studies using a surprise-recognition memory test in this age range, b = 0.11, SE = 0.08, t(115) = 1.28, p = .202 (Fig. S8A and Table S12; Billingsley et al., 2002; A. L. Brown & Scott, 1971; Ghetti & Angelini, 2008; Ngo et al., 2018). Moreover, similar to prior work (deBettencourt et al., 2018), memory was better for the infrequent compared with frequent category, b = −0.38, SE = 0.05, t(115) = −7.05, p < .001 (Fig. S8 and Table S12). Adults experienced a stronger boost in memory for the infrequent category of images than children—Age × Trial Type: b = −0.22, SE = 0.11, t(115) = −2.03, p = .044; trial type differences in adults: b = −0.48, SE = 0.09, t(114) = −5.46, p < .001, r = .46; trial type differences in children: b = −0.27, SE = 0.11, t(116) = −2.49, p = .014, r = .23 (Figs. S8B and S8C and Tables S12–S14). For a a breakdown of memory d′ by attentional state, see Table S16. Notably, the overall lack of age difference in memory was ideal for allowing us to probe the influence of sustained attention on memory formation in the context of equivalent memory across age groups.
High lapse rates impair memory across children and adults who lapse often
Individual differences in lapse rates correlated with memory performance to a similar extent on frequent and infrequent trials. We therefore collapsed across trial type in our models— Attentional Lapse Rate × Trial Type: b = −0.36, SE = 0.35, t(113) = −1.03, p = .306; Attentional Lapse Rate × Trial Type × Age Group: b = 0.80, SE = 0.70, t(113) = 1.14, p = .256 (Table S15). We found that, across the sample, higher lapse rates marginally correlated with lower memory performance, b = −0.49, SE = 0.29, t(113) = −1.72, p = .087, r = .16 (Fig. 4A and Table S1). This relationship was similar across age groups—Age Group × Attentional Lapse Rate: b = 0.76, SE = 0.57, t(113) = 1.33, p = .186, r = .12 (Table S16). However, higher lapse rates were only related to worse memory in children and adults with the highest lapse rates—children: b = −0.87, SE = 0.38, t(57) = −2.32, p = .024, r = .29; all adults: b = −0.11, SE = 0.43, t(56) = −0.26, p = .796, r = .03; high-lapse group of adults: b = −1.98, SE = 0.92, t(30) = −2.15, p = .040, r = .37 (Figs. 4a and 4b). This relationship was not observed among adults who lapsed the least, b = −0.42, SE = 1.67, t(24) = −0.25, p = .801, r = .05 (Figs. S9 and S10, Analysis S6, and Tables S17–S20). For mean memory d′ listed by age group and zone state, see Table S21. These findings suggest that individual differences in lapse rates covary with memory among those with the poorest ability to sustain attention—in our study children and adults with high lapse rates.
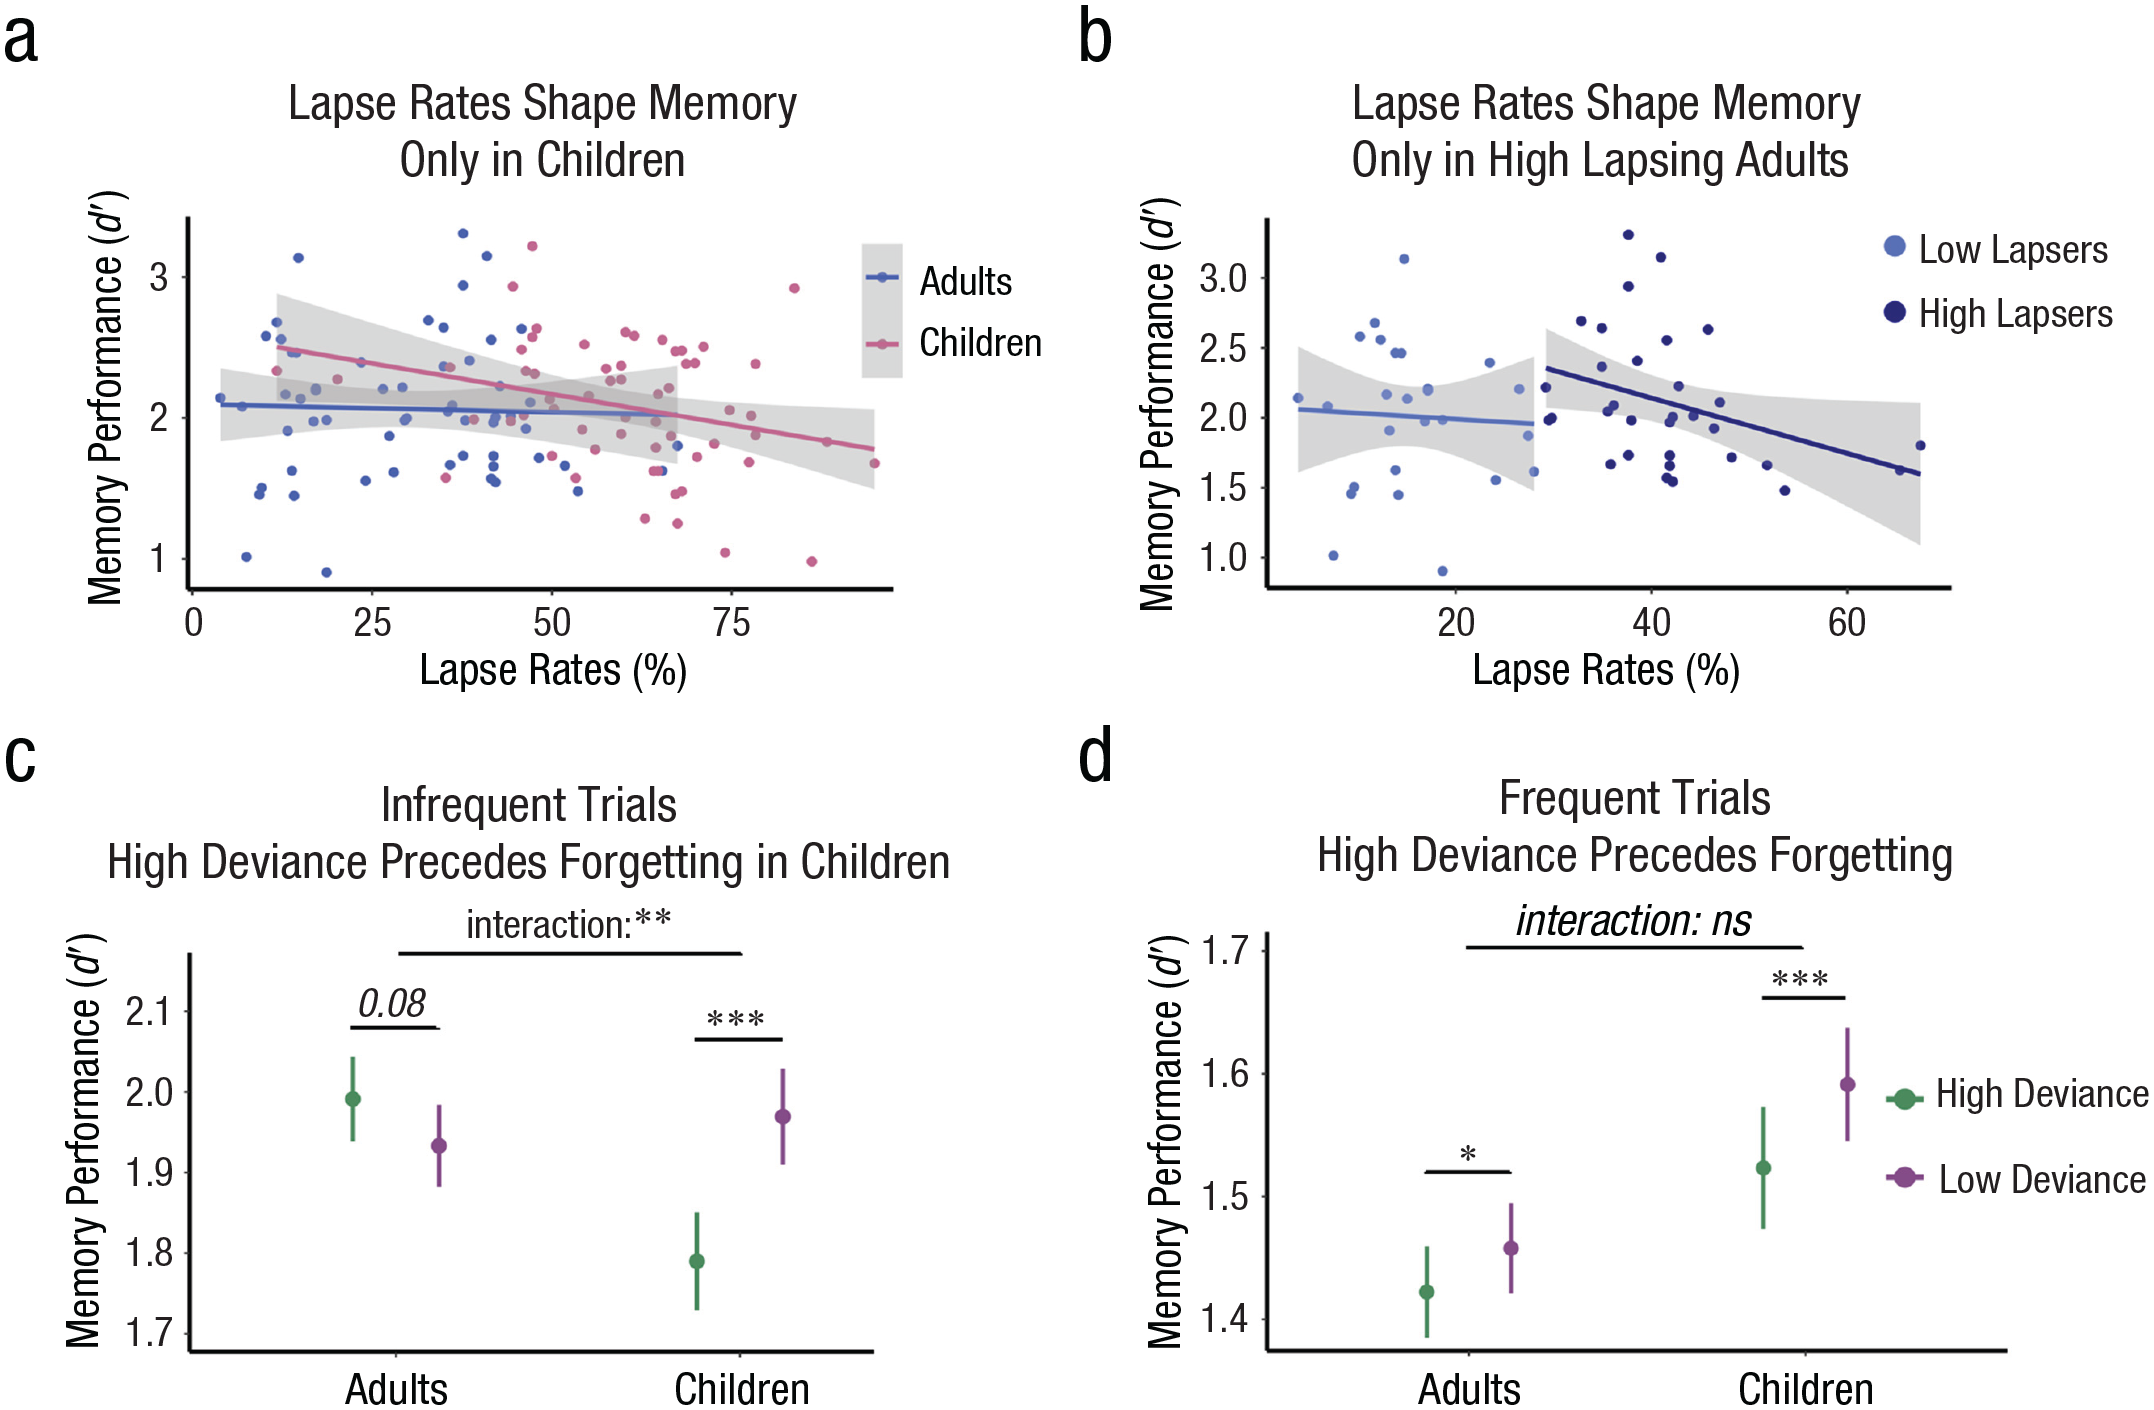
Relationships between sustained attention and memory formation in children and adults. High lapse rates correlated with lower memory performance across children (p = 0.024) but not adults (p = 0.79; a). High lapse rates correlated with lower memory performance only among the high-lapse subgroup of adults—high-lapse group: p = 0.04; low-lapse group: p = 0.80 (b). Gray shading in (a) and (b) reflect 95% confidence intervals, and dots reflect individual participant data. Within-subject attentional fluctuations covaried with memory formation on infrequent trials in children only, such that momentary lapses in time reduced memory formation (p < 0.001); in contrast, they were numerically linked to marginally better memory in adults (p = 0.08; c). Within-subject fluctuations in sustained attention shaped memory formation on frequent trials to a similar extent in children and adults (d). For ease of visualization, values of the moving mean deviance time course were assigned to high- and low-deviance labels using a median split within subjects. Stars reflect significance levels from the models reported in the text. Means and standard error bars are plotted.
Fluctuations in sustained attention shape memory formation across time more in children than adults
We next turned to our critical question about how within-subject attentional fluctuations across time shaped memory formation in children from moment to moment. Across the sample, fluctuations in sustained attention covaried with memory formation across time, mirroring results for categorization accuracy: RT deviance was higher before images that were later forgotten than remembered (b = −0.70, SE = 0.28, z = −2.47, p = .013; Table S22). Interestingly, these fluctuations in attention covaried with memory formation more closely in children than adults (RT Deviance × Age: b = 1.78, SE = 0.56, z = 3.19, p = .001; Table S22). This closer intrinsic relationship between fluctuating attentional states and memory formation in children was most prominent on infrequent trials (RT Deviance × Age × Trial Type: b = −3.27, SE = 1.11, z = −2.93, p = .003). Indeed, whereas momentary attentional lapses reduced the likelihood of memory formation on frequent trials in both age groups similarly (Attention × Age: b = 0.15, SE = 0.33, z = 0.44, p = .661; children: b = −0.80, SE = 0.20, z = −4.00, p < .001; adults: b = −0.64, SE = 0.29, z = −2.17, p = .030; Fig. 4D), they reduced the likelihood of memory formation on infrequent trials in children only (RT Deviance × Age on infrequent trials: b = 3.44, SE = 1.14, z = 3.01, p = .003; attention-memory relationship on infrequent trials in children: b = −2.53, SE = 0.68, z = −3.71, p < .001). In contrast, periods of poorer attention were numerically linked to better memory in adults, although this effect did not reach statistical significance (b = 2.05, SE = 1.16, z = 1.76, p = .079; Fig. 4c and Table S22). Control analyses reported in the Supplemental Material demonstrate that these relationships were not a result of parallel declines in attention and memory performance across the task (Analysis S7). Thus, although momentary attentional fluctuations had similar consequences for categorization performance across development, they had a more pervasive influence on memory formation in children. That is, in children, fluctuations in attention even shaped the fate of memories for unexpected events that were resilient to the influence of attentional lapses in adults.
Discussion
We showed that limits on children’s ability to form memories reflect not only immature memory mechanisms but also momentary attentional lapses. Seven- to 10-year-old children’s attention lapsed twice as frequently as adults’, which mediated age-group differences in categorization accuracy. Lapse rates also correlated with worse memory in children and adults who lapsed the most. Furthermore, within-subject fluctuations in attention covaried with memory formation more closely in children than adults, causally implicating attentional fluctuations in children’s memory formation. However, although attentional lapses impaired memory for expected (frequent) events in both groups, they impaired memory only for unexpected (infrequent) events in children. Children’s memories therefore appear less resilient to attentional lapses.
Memory performance did not differ between groups. These findings align with research showing that children’s memory approximates adults’ by roughly age 8, at least when memories are formed unintentionally (Ofen, 2012; Shing et al., 2008, 2010). In some cases, children can even have better memory than adults on surprise-recognition tasks (Fisher & Sloutsky, 2005; Sloutsky & Fisher, 2004). The absence of an age difference was ideal for comparing attention’s influence without accounting for developmental differences in memory. Moreover, our task was ideal for our purposes: It was straightforward for children and led to attentional lapses, and the recognition memory test minimized demands on strategic attention (Shing et al., 2008, 2010), decreasing barriers to retrieving well-formed memories.
The similar memory performance across groups may seem surprising given attention lapsed more frequently in children. One explanation is that children form memories quite well, possibly better than adults, during optimal attentional states. If so, children’s impressive memory abilities while focused could offset the negative effects of higher lapse rates, leading to comparable memory between groups. Supplementary analyses (Table S21) indeed showed that children formed memories numerically better than adults while focused, with the group difference statistically trending when considering high- and low-confidence memories. Children’s poor attention may therefore mask their true memory potential. But why might children form memories so well while in the zone? Perhaps children’s impressive memory abilities reflected heightened motivation arising from the novelty of participating in an experiment (Duan et al., 2020). Relatedly, the categorization task may have been optimally challenging for children but too easy for adults—leading to greater processing demands in children, which enhances memory formation (Sungkhasettee et al., 2011).
Turning to important developmental differences in attention, we showed that attention fluctuated less often in adults than children. This finding extends research showing a reduction in attentional fluctuations from early to late childhood (Lewis et al., 2017). Interestingly, however, children’s lapses did not last longer than adults. Thus, children reengaged as readily as adults.
But our primary question was neither about developmental differences in attention nor memory on their own; it was about how fluctuations in attention shape the fate of children’s individual memories. After establishing a clear and causal relationship linking attention to memory across time, pressing questions arise about whether attentional fluctuations similarly influence other more attentionally demanding memories. For example, intentional memory formation for items or associations, or even retrieving information from a cue, require greater strategic control and are precisely the types of memories that are late to develop (Shing et al., 2008, 2010). Future work could therefore test whether our results generalize when greater demands are placed on strategic attention, such as when memories are formed intentionally. If attentional lapses also explain memory for complex and attentionally demanding forms of memory, then young children may be far more capable of forming memories than we think—at least in a good attentional state.
We also observed that attention fluctuations covaried with memory more closely in children than adults. Moreover, although lapses impaired memory for expected events in both groups, they impaired memory for unexpected events (infrequent trials) only in children. Perhaps adults rapidly reoriented to infrequent trials on noticing the need for response inhibition—even during a lapse—which would have rescued memory. In contrast, children may have reoriented more slowly to infrequent trials during a lapse. This hypothesis is partly supported by our data showing that children’s memory and categorization accuracy was particularly worse than adults’ on infrequent trials, suggesting that children struggled more to orient to these trials.
Still, we note that lapses can impair adults’ memory for infrequent events in past research (deBettencourt et al., 2018). We offer two explanations for our divergent findings. First, we included a longer stimulus duration (1.5 vs. 1 s in prior work), which may have left adults with more time to reengage on noticing an infrequent trial, reducing the preceding poor attentional state’s influence. Second, we used images of animals as the infrequent category (rather than scenes). If animals are particularly salient to adults, this could have heightened memory regardless of attentional state. Future work could manipulate the stimulus duration and image categories to adjudicate these possibilities.
An important strength of our study was its focus on how attention covaried with memory across and within individuals—and these relationships sometimes differed. Attentional fluctuations covaried with memory within adults, but time spent lapsing did not correlate with memory across adults. Splitting adults into groups of more versus less frequent lapsers reconciled this discrepancy. High lapse rates impaired memory only among adults whose attention lapsed the most. Thus, a few lapses may not harm memory in those who lapse infrequently.
In summary, we showed that moment-to-moment attentional fluctuations powerfully govern the fate of children’s memories, tuning memory formation up or down in each moment. Memory failures in childhood do not simply stem from immature memory mechanisms—the focus of prior work—but also immature sustained attention. More broadly, our work suggests that sustained attention acts like a “gatekeeper,” controlling what enters long-term and even working memory stores (deBettencourt et al., 2019). And what “gets through the gate” might differ in children—not only because of their frequent attention lapses but also because of the more detrimental consequences of these lapses. Our findings raise the possibility that broad developmental differences in cognitive performance stem from the same factor—the ability (or lack thereof) to sustain attention.
Supplemental Material
sj-docx-1-pss-10.1177_09567976231206767 – Supplemental material for Fluctuations in Sustained Attention Explain Moment-to-Moment Shifts in Children’s Memory Formation
Supplemental material, sj-docx-1-pss-10.1177_09567976231206767 for Fluctuations in Sustained Attention Explain Moment-to-Moment Shifts in Children’s Memory Formation by Alexandra L. Decker, Katherine Duncan and Amy S. Finn in Psychological Science
Footnotes
Acknowledgements
We thank Carissa deMarinis, Inayat Singh, and Sabrina Szkolmowski for help with data collection.
Transparency
Action Editor: Vladimir Sloutsky
Editor: Patrica J. Bauer
Author Contribution(s)
A. L. Decker, K. Duncan, and A. S. Finn developed the study concept and contributed to the study design. A. L. Decker performed testing and collected the data. A. L. Decker analyzed the data under the supervision of K. Duncan and A. S. Finn. A. L. Decker drafted the manuscript, and the remaining authors provided critical revisions. All of the authors approved the final version of the manuscript for submission.
References
Supplementary Material
Please find the following supplemental material available below.
For Open Access articles published under a Creative Commons License, all supplemental material carries the same license as the article it is associated with.
For non-Open Access articles published, all supplemental material carries a non-exclusive license, and permission requests for re-use of supplemental material or any part of supplemental material shall be sent directly to the copyright owner as specified in the copyright notice associated with the article.