
Abstract
The neural mechanisms underpinning the dynamic switching of a listener’s attention between speakers are not well understood. Here we addressed this issue in a natural conversation involving 21 triadic adult groups. Results showed that when the listener’s attention dynamically switched between speakers, neural synchronization with the to-be-attended speaker was significantly enhanced, whereas that with the to-be-ignored speaker was significantly suppressed. Along with attention switching, semantic distances between sentences significantly increased in the to-be-ignored speech. Moreover, neural synchronization negatively correlated with the increase in semantic distance but not with acoustic change of the to-be-ignored speech. However, no difference in neural synchronization was found between the listener and the two speakers during the phase of sustained attention. These findings support the attenuation model of attention, indicating that both speech signals are processed beyond the basic physical level. Additionally, shifting attention imposes a cognitive burden, as demonstrated by the opposite fluctuations of interpersonal neural synchronization.
Keywords
Introduction
It is a great challenge for a listener to dynamically switch between different speakers and concentrate on the relevant one in a multispeaker conversation. Because of humans’ limited perceptual and cognitive capacity (Kawashima & Sato, 2015), selective attention has to actively prioritize the processing of relevant speech, resulting in enhanced neural entrainment of the attended speech and suppressed entrainment of the ignored speech (Ding & Simon, 2012; Mesgarani & Chang, 2012; O’Sullivan et al., 2015; Zion Golumbic et al., 2013). During in-person conversations, the selective attention can lead to selectively enhanced and suppressed interpersonal neural synchronization (INS) between the listener and the target and the ignored speaker (Dai et al., 2018). However, to effectively respond to unpredictable environmental changes, particularly impending signals, people cannot entirely avoid processing the irrelevant information, which means that our attention system should remain dividable and switchable (Berti & Schröger, 2003). In scenarios where multiple voices are present, for example, the auditory cortex represents both the target and ignored speech (Brodbeck et al., 2020; Ding & Simon, 2012; Fiedler et al., 2019; Zion Golumbic et al., 2013), and even linguistic information from ignored speech is partly processed (Dai et al., 2017, 2022; Har-shai Yahav & Zion Golumbic, 2021; Vachon et al., 2020). There appears to be a dynamic attention system that allows for flexible allocation of resources to solve this kind of cocktail-party problem. Crucially, selective attention with a predetermined target and with a free dynamic switch between targets may involve overlapping but different neurocognitive mechanisms, according to their distinct roles in information processing (Dosenbach et al., 2007; Frey et al., 2015; Petersen & Posner, 2012; Veríssimo et al., 2022). Extensive research has been conducted on the neurocognitive mechanisms of selective auditory processing in a no-switch situation. However, the neurocognitive mechanisms in a switch situation remain unknown.
There are two traditional hypotheses of attention that are relevant to the limited cognitive resources required to cope with the challenge of attention switching. One hypothesis suggests that the unattended speech is highly inhibited at an early stage and is not processed beyond the analysis of basic physical properties because of the robust selective attention given to the attended speech (Broadbent, 1958). Therefore, attention switching—by reactivating the inhibitory unattended speech—incurs a cognitive cost. Previous studies have demonstrated that attention switching leads to performance declines, such as longer reaction times or higher error rates, compared to the no-switch situation (Eben et al., 2020; Lin & Carlile, 2015; Uhrig et al., 2022). On the basis of this hypothesis, we predicted significantly higher INS during an in-person multispeaker conversation (i.e., an enhancement) between the listener and the attended speaker (L-A) than that (i.e., a suppression) between the listener and the unattended speaker (L-U) when there was no attention switching, because the unattended speech was not cognitively processed. However, the change of the acoustic features in one of the multiple speeches might drive the listener’s attention to switch, and the reactivated processing of the high-level linguistic information in the to-be-attended speech would result in an enhancement of INS between the listener and the to-be-attended speaker (i.e., the INS would significantly increase after switching compared to before). Meanwhile, to escape processing the high-level linguistic information in the to-be-ignored speech, the listener would suppress INS with the to-be-ignored speaker after switching (i.e., the INS would significantly decrease after switching compared to before).
Statement of Relevance
Natural conversations among a group of individuals can transmit prior experience between one another and create new knowledge. This process underlies classroom teaching and distinguishes human beings from other nonhuman animals. Most importantly, selective attention with a predetermined target and with free dynamic switching between targets may involve overlapping but different neurocognitive mechanisms. However, extensive research has been conducted on the neurocognitive mechanisms of selective auditory processing in a no-switch situation, whereas the neurocognitive mechanisms in a switch situation remain unknown. Here, we present neural and cognitive data that reveal the dynamic flowing process of human attention among different speakers. The results indicate that attention systems allow people to process multiple signals simultaneously, which facilitates efficient and rapid attention switching. These findings are expected to advance research and practice in several fields, including cognitive neuroscience and educational neuroscience.
Numerous research findings have shown that people identify irrelevant signals. A developed hypothesis proposed by Treisman (1964) suggested that attention attenuates irrelevant messages rather than blocking them completely. Therefore, the unattended speech can be processed beyond the basic physical level, and shifting attention between speech signals can be more efficient and smoother. As mentioned above, the comprehension of attended speech can be adversely affected by unattended speech that contains phonologically, semantically, or syntactically related content (Dai et al., 2017, 2022; Har-shai Yahav & Zion Golumbic, 2021; Vachon et al., 2020). Besides, attention can quickly switch between different sound features on demand (Da Costa et al., 2013), indicating that attention switching requires only minimal cognitive effort. According to this hypothesis, we did not expect a huge difference in INS between L-A and L-U when attention was not switched, because in such a challenging situation, the high-level linguistic information of both speeches might have been processed to some extent, but not completely. However, a change in high-level linguistic information, such as semantics, in one of the multiple speeches could lead to a shift in attention. The attention switching would further lead to a suppression of INS between the listener and the to-be-ignored speaker and an enhancement of INS between the listener and the to-be-attended speaker after a switch.
This study aimed to address these questions in a natural conversation involving multiple speakers. The listeners were informed that they could freely choose which speaker to listen to and switch between them (or not switch) at any point during the conversation. The entire experimental procedure was recorded on video for later coding of the speeches’ acoustic and semantic features. These features were then used to determine whether the listener’s attention switch was driven by the basic physical factor or the high-level linguistic factor. To fulfill the requirement for a high-validity technique, we employed functional near-infrared spectroscopy (fNIRS) hyperscanning to calculate INS to index the brain-response pattern. Our results supported the second hypothesis, demonstrating that the change in semantics from the to-be-ignored speech caused listeners to switch their attention and resulted in a significant suppression and enhancement of INS between the listener and speakers after the switch.
Open Practices Statement
The study reported in this article was not preregistered. The data have not been archived on a permanent third-party platform because of the restrictions of our institutional review board. Interested parties may request the data from the corresponding author. All analyses were performed using MATLAB R2020b with standard functions and toolboxes. All codes used are available upon request.
Method
Participants
A power analysis was conducted using G*Power for a linear mixed effect in this study. The analysis revealed that 21 pairs (i.e., listener–attended speaker pairs and listener–unattended speaker pairs) were required to achieve a power of .80 with a partial eta-squared (η p 2) of .25 and an alpha (α) of .05 for examining the attention-switching effect. Thus, 63 healthy adults were recruited. All participants self-reported as being right-handed and having normal hearing. They did not have any language, neurological, or psychiatric disorders. The participants were randomly assigned into 21 groups with three members of the same gender (11 women’s groups, mean age = 23 ± 2 years), generating 21 listener–attended speaker pairs and 21 listener–unattended speaker pairs. All group members were total strangers to each other.
Written informed consent was obtained from all participants. The study protocol was approved by the Institutional Review Board of the State Key Laboratory of Cognitive Neuroscience and Learning, Beijing Normal University.
Tasks and procedures
For each group, a 5-min resting-state session served as a baseline. During this session, the participants were requested to keep still with their eyes closed, relax their minds, and remain as motionless as possible. The task session immediately followed the resting-state session.
Participants performed a natural conversation task (Fig. 1a). For each group, one participant was randomly assigned as the listener (mean age = 22 ± 3 years), whereas the other two were assigned as speakers (left speaker, mean age = 23 ± 2 years; right speaker, mean age = 23 ± 2 years). There were no significant age differences among the three participants, F(2, 62) = 1.639, p = .203, η p 2 = .052. During the conversation (Fig. 1a), the three participants sat in a circle. The left and right speakers were positioned at −30° and +30° respectively, relative to the listener.
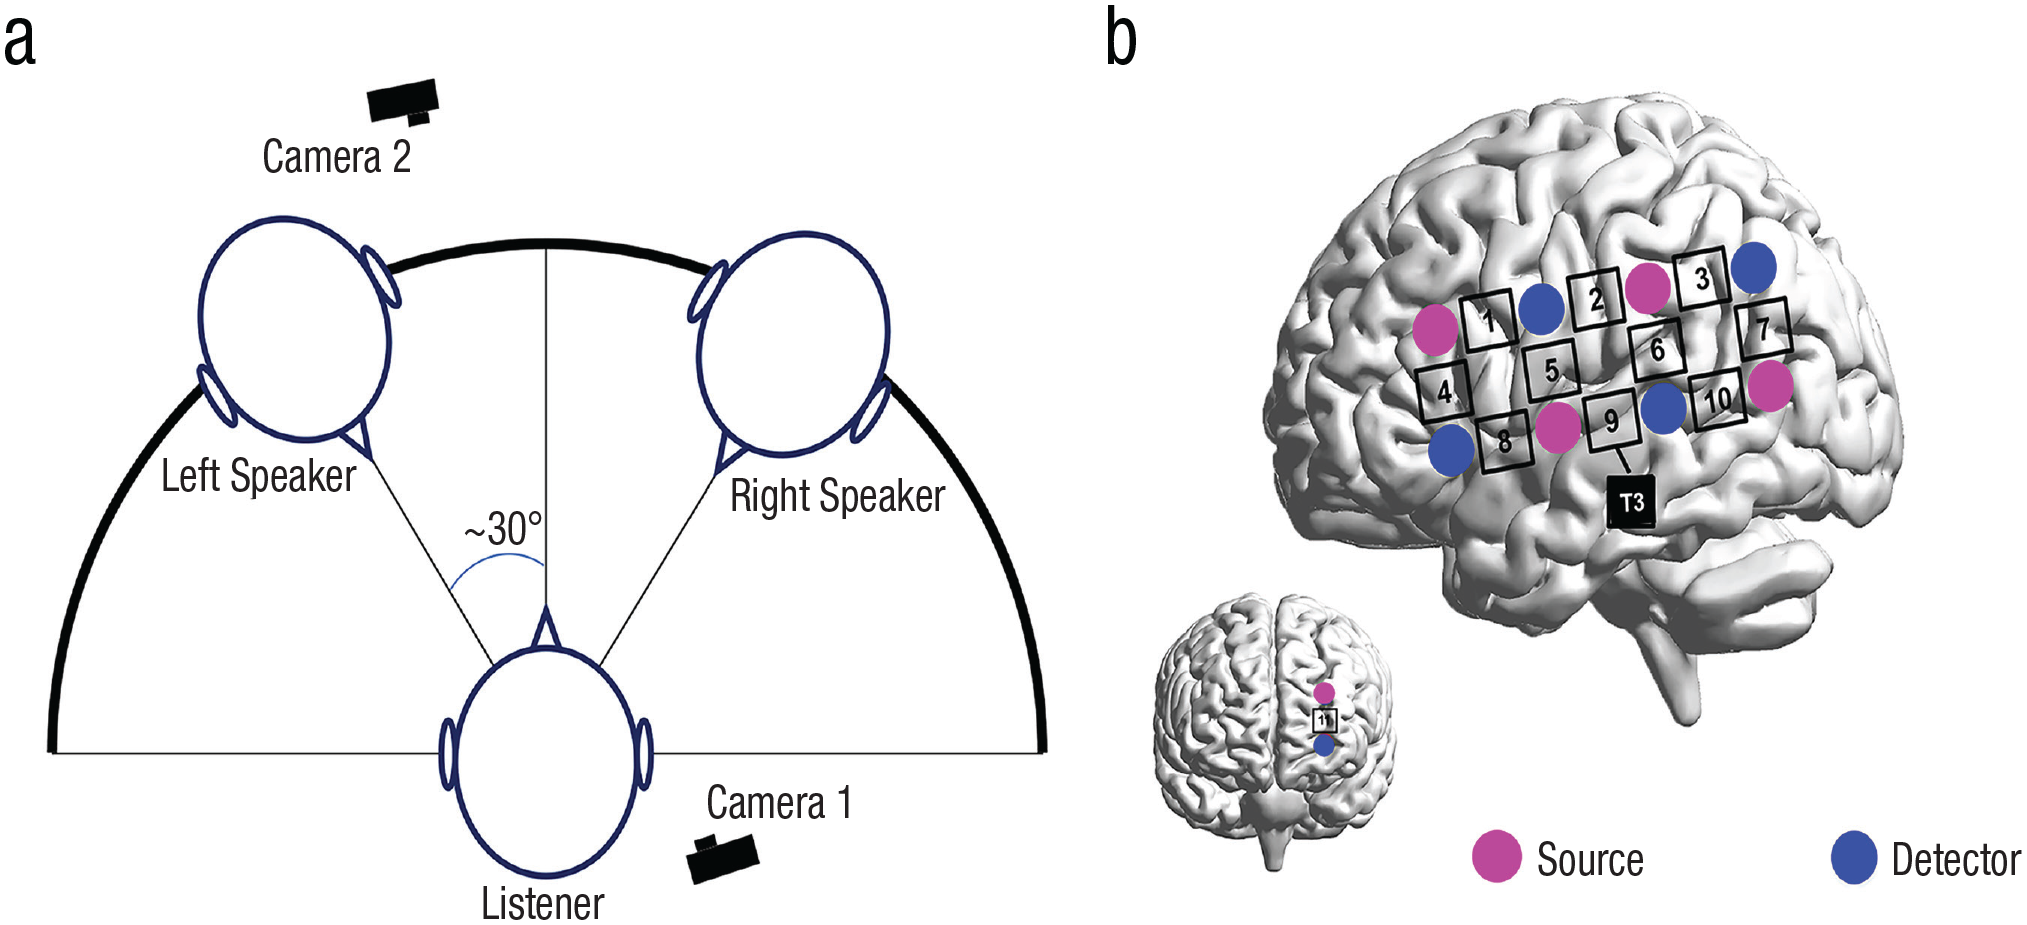
The setup of the experiment. For each group, three participants sat together (a). As viewed by the listener, the left and right speakers were located at −30°and +30°, respectively. Two cameras were used, with one placed to the right of the left speaker and the other placed to the right of the listener. The optode probe set (b) was placed on the left frontal, temporal, and parietal cortices. Measurement channel CH9 was placed just at T3 in accordance with the international 10-20 electrode system. The brain images were automatically generated using BrainNet Viewer, a freely available tool on the NeuroImaging Tools and Resources Collaboratory (Xia et al., 2013).
During the task, the two speakers talked to the listener simultaneously about the same topic but with different content (i.e., they decided by themselves what to say about the topic; the listener chose which speaker to focus on. The listener was free to switch attention between speakers and respond to the selected speaker verbally or nonverbally (e.g., with facial expression or gestures). Each task lasted 5 min. Two additional 30-s resting-state periods were included, one at the beginning and one at the end of the conversation, to ensure that the imaging instrument reached a steady state. The procedures were recorded on video.
Topic selection
Twelve candidate topics related to basic human life—such as describing one’s hometown or college experience—were selected by the experimenter. Then an independent sample of 20 participants (11 males; mean age = 22 years, SD = 3 years) were recruited to assess the topics regarding their difficulty, familiarity, abstractness, frequency of occurrence in daily life, and relatability in daily life (using a 5-point scale ranging from 1, low, to 5, high; difficulty and abstractness were reverse-coded). The intraclass correlation coefficient (ICC) was satisfactory to high (ranging from .747 to .894) for all aspects of all topics. The overall internal consistency across the five aspects was also high (Cronbach’s α = .956). Consequently, the ratings of these five aspects were averaged, and six topics with the highest score were selected for use in this study—that is, the topics with the lowest level of difficulty and abstractness but the highest levels of familiarity, frequency of occurrence, and relatability in daily life.
During the task, one of the six topics and relevant background materials were randomly provided to the two speakers. To clarify, although the attended and unattended speakers discussed the same topic, they used different contents and sentences.
Assessment of speech processing
Following the task, the listeners were asked to evaluate the conversation on a 5-point scale regarding its perception and comprehension levels (1 = low, 5 = high). This assessment was conducted separately for each speaker to ensure reliable results and to avoid confusion. The perception assessment included six items requesting the listener to rate the appropriateness of the speaker’s speech rate, the fluency level of the speech, the clarity of the speech sound, the loudness of the speech sound, the naturalness of the speech intonation, and the appropriateness of wording. The interitem reliability (based on ICC) was high (left speaker: .811; right speaker: .709). The comprehension assessment included two items asking the listener to assess how well the speaker stayed on topic and how well he or she interacted during the conversation. The interitem reliability (based on ICC) also reached a high level (left speaker: .895; right speaker: .930). The scores of items for each assessment were averaged to obtain an overall score for speech perception and comprehension, respectively.
fNIRS data acquisition
During the experiment, the participants sat in a quiet room while an ETG-4000 optical topography system (Hitachi Medical Company, Tokyo, Japan) collected imaging data from the three participants in each group simultaneously. Three sets of the same customized optode probes were used, with each set containing two groups of probes. The first group of probes was placed on the left hemisphere so as to cover the left inferior frontal, temporal, and parietal cortices (Fig. 1b). The probes consisted of 10 measurement channels (CHs; four emitters and four detectors, 30 mm optode separation). CH9 was placed just at T3 in accordance with the international 10–20 system (Fig. 1b). The second group of probes (one emitter and one detector, one measurement channel) was placed on the left dorsal prefrontal cortex. All probe sets were examined and adjusted to ensure consistency of the positions among the participants within and across the groups. Only the left hemisphere was covered because of the lateralization of the selective attention-related neural response to natural speech streams, as reported in previous research (Power et al., 2012; Yoncheva et al., 2014).
The absorption of near-infrared light at two wavelengths (695 and 830 nm) was measured with a sampling rate of 10 Hz. The changes in the oxyhemoglobin (HbO) and deoxyhemoglobin (HbR) concentrations were recorded in each CH on the basis of the modified Beer-Lambert law. Previous studies have shown that HbO is a sensitive indicator of changes in regional cerebral blood flow and has a high signal-to-noise ratio (Hoshi, 2007). Thus, this study focused only on the HbO concentrations.
Behavioral data analysis
Determination of attended speakers
During the task, the attended speaker was freely chosen by the listener. To determine the attended speaker at each time point, we recruited two independent coders to make judgments from video recordings. To obtain reliable results, we asked them to independently code all videos. Time points at which the listener attended to each speaker were marked. The criteria for attention were (a) the direction of the listener’s face; (b) the direction of fixation; and (c) the target of verbal and nonverbal responses. Intercoder reliability (based on ICC) for switch (vs. no switch) was computed at the time-point level for each participant group. The ICC ranged from .833 to 1, suggesting high consistency between the two coders. Each phase of attention to a specific speaker was defined as an attentional state, whereas the time points of attention switching were defined as the boundaries between two states.
Behavioral statistical tests
To ensure the comparability of speaking behaviors between the two target speakers as well as the processing of the two speech streams in the listener, a t test was conducted on the overall lengths of the phases when the listener attended to the two speakers. In addition, a t test was conducted on scores of speech perception and comprehension as well as frequency of responses (i.e., the length of the attentional phase was divided by the number of responses for each speaker).
The speaking processes associated with attention switching
To investigate the relationship between attentional states and speech processes, we analyzed the acoustic and semantic features of the speech produced by both speakers. First, it was expected that changes of acoustic features, such as intensity, pitch, or formants (F1–F4) in one speaker’s speech, would cause the listener to switch attention. The acoustic features were calculated immediately 2 s before and after the switch of attentional states (Praat v. 6.3.16; Boersma & Weenink, 2023; see Fig. 3a). Then, a linear mixed-effect model was applied on these acoustic features, with attention switching (i.e., across states vs. within states) as the fixed variable and the identity of participant groups as the random variable. The results were corrected for multiple comparisons using the false discovery rate (FDR) method (p < .05). As a general approach to the multiple-comparison problem, an FDR threshold (p < .05) can be determined from the observed p-value distribution and hence is adaptive to the amount of signal in the data (Genovese et al., 2002). The observed p value before FDR correction was reported.
Next, we assumed that the increase in semantic distance across attentional states would be associated with attention switching (Fig. 3a). To test this possibility, we had the speeches produced by both speakers transcribed into text. Then, the Robustly Optimized Bidirectional Encoder Representations from Transformers (BERT) Pretraining Approach with Whole Word Masking (WWM-RoBERTa) model (Devlin et al., 2019) was employed to vectorize the text of each sentence (Y. Cui et al., 2021). The [CLS] token was entered into the following analysis, which is a standard method for generating sentence representation (Choi et al., 2021). Next, Euclidean distance was calculated between the sentence before and after the switch and used to index the semantic distance across attentional states. Euclidean distance was also calculated between two randomly adjacent sentences within a state before the switch of attention and used to index the semantic distance within states. Finally, the linear mixed-effect analysis was conducted on the Euclidean distance, with the factors of attention switching (across states vs. within states) and switch direction (to-be-ignored speakers vs. to-be-attended speakers) as fixed variables. The event number of switching within each speaker and the identity of participant groups were set as random variables.
fNIRS analysis
Preprocessing
The fNIRS data collected during the resting-state and task sessions were analyzed. During preprocessing, data in the initial and ending periods (30-s resting-state period plus 10-s tasks, respectively) were removed, leaving 240 s of data for each session. Then the time points of the data containing suspected artifacts were identified through a running-window procedure. Specifically, for a given data point N, mean and standard deviation were calculated based on its neighbors N − 2, N − 1, N + 1, and N + 2. If N > M ± 3 × SD, it was identified as being confounded by artifacts. In such cases, N was replaced with the mean.
Calculation of INS
The preprocessed data were entered into the wavelet transform coherence (WTC) procedure to assess the cross-correlation between two fNIRS time series generated by pairs of participants as a function of frequency and time. The wcoherence function from the MATLAB package was used (Grinsted et al., 2004). Briefly, three HbO time series were obtained simultaneously for each CH from the three participants of each group. WTC was applied to each pair of the time series to generate 2D coherence maps. Because there were 11 CHs for each participant, an 11 × 11 matrix was generated for each pair of participant groups. In addition, previous studies have indicated that the INS between the listener and the speaker usually involves a time lag (Dai et al., 2018; Stephens et al., 2010). To incorporate this lag effect, we calculated the coherence value by shifting the time course of the listener forward or backward relative to that of the speaker from 1 to 10 s (step = 1 s), as well as when there was no time lag (i.e., the two time courses were temporally aligned).
We found, relying on previous evidence, that INS that is sensitive to selective auditory processing occurs in a frequency band of 0.1 to 0.4 Hz (Dai et al., 2018). Thus, this frequency band was selected in the current study. This frequency band excludes physiological noises, such as those associated with cardiac pulsation (about 0.8–2.5 Hz) and high-frequency head movements. Finally, the coherence value was time-averaged and converted into Fisher’s z value.
According to previous studies (X. Cui et al., 2012; Jiang et al., 2012), the coherence value is expected to be higher during social interactions compared to the resting state. Therefore, the averaged coherence value in the resting-state session was subtracted from that of the task sessions, and the difference was used as an index of INS for each pair of participants.
Validation of attentional states coded by human participants
Because attentional states in the listener are hidden, and it is difficult to directly and precisely observe these states through verbal or nonverbal behaviors, a machine-learning technique called hidden Markov modeling (HMM) was employed to validate the judgment of human participants on the target speaker at each time point (Baldassano et al., 2017). According to this approach, the listener’s attention experiences a sequence of states, and the corresponding neural bases can be obtained by examining the spatial pattern across fNIRS channels. Thus, the purpose of this approach is to infer the sequence of the listener’s attentional states on the basis of the fNIRS data. In this study, this approach was conducted using the BrainIAK software (Kumar et al., 2021). Because different numbers of states were expected between different participant groups, this approach was applied to each participant group, and the statistical significance was determined using a permutation approach. Specifically, time courses of INS from all combinations of CHs (11 × 11 = 121 in total) were fitted to the HMM models (Baldassano et al., 2017). The HMM analysis was repeated with a varying number of states—that is, the value of k from 2 to 20 that covered the total range of state numbers in our study. For each time of HMM analysis, we calculated the correlations of INS between time points of both within and across state boundaries. The number of states with the best within- versus across-state correlations was chosen as the optimal number of states. This was determined by calculating the difference between the correlation of each k versus that of all other ks. Statistical significance was determined at the p < .05 level (Song et al., 2021) using a permutation test by randomly shuffling the positions of the state boundaries by 1,000 times; p value was obtained according to the equation p = (1 + number of null values ≥ empirical values) / (1 + number of permutations) (p < .05; Song et al., 2021). The results showed that the k coded by human participants survived this test (see Fig. S1 in the Supplemental Material available online). Thus, the k value coded by human participants was used in the following analysis.
To test whether the boundaries predicted by the model were significantly better than chance level, correlations of INS between time points was calculated both within and across state boundaries and compared between within and across boundaries. The statistical significance of the difference between within versus across boundaries was also determined by the permutation test (p < .05 level; Song et al., 2021). Additionally, the consistency between the predicted boundaries and those coded by human participants was also examined. A permutation test was conducted by randomly shuffling the positions of the state boundaries by 1,000 times and comparing the boundaries of each time with those coded by human participants. Again, statistical significance was determined at the p < .05 level (Song et al., 2021).
Group-level statistics
Neural representations of different speeches
To test whether INS selectively represents different speeches at a specific moment during the conversation, Fisher’s linear discriminate analysis (FLDA) was conducted across the time for each listener–speaker pair of a participant group at each time lag. Specifically, based on the attentional states identified above, each time point was classified as either one in which the participant attended to the speaker (attended) or one in which the participant attended to the other speaker (unattended). This category was used as the class label. INS across the time course at all CH combinations was used as a classification feature. A leave-one-out cross-validation approach was employed. Next, a nonparametric test was conducted on the prediction accuracy against the chance level (50%; 1,000 bootstrap). Finally, the prediction accuracy was averaged across groups, and a quadratic curve-fitting procedure was applied to identify the time lag that had the highest level of prediction accuracy.
Selective enhancement and suppression of INS during different phases of the conversation
To further test whether the neural representations of the competing speeches were associated with enhancement and suppression of INS, the time course of the conversation was divided into two parts—a part with attention switching, and a part with sustained attention. For the first part, INS around the time point of attention switching (i.e., boundaries of attentional states) was extracted and averaged (from 5 s before the switch to 10 s after the switch). For the second part, INS was averaged by excluding the data from the first part.
Next, to test whether INS dynamically switched between enhancement and suppression when the listener’s attention switched between different speakers, a curve estimation was conducted on the time courses of INS in both the attended-speaker (LA) pairs and unattended-speaker pairs (LU). In addition, the two INS time courses were statistically compared using a running window procedure (size = 5 s, paired two-sample t test, FDR-corrected at the p < .05 level). The observed p value before FDR correction was reported. Additionally, to test whether INS was also enhanced or suppressed during sustained attention, INS during this phase was tested using a one-sample test against the chance level. Moreover, a paired two-sample t test was conducted to examine whether INS significantly differed between the LA and LU pairs with FDR correction (p < .05). These analyses were conducted on all CH combinations.
The cognitive processing associated with the INS pattern
To test which cognitive process was associated with the change of INS, the INS pattern during the phase of sustained attention or attention switching was correlated with acoustic features or semantic distances of the speaker’s speech. To this end, a difference was calculated between the semantic distance across states and within states in each speaker and used to index the increase of semantic distance. The increase of semantic distance was then correlated to the coefficient of curve estimation while scores of speech comprehension in the listener were controlled. The results were corrected for multiple comparison using the FDR method (p < .05). Additionally, a Pearson correlation was also conducted between the coefficient of curve estimation and scores of speech comprehension and perception (FDR-corrected at the p < .05 level).
Results
Identification of attentional states
First, to determine the attended speaker at each time point, two independent coders were recruited to make judgments from video recordings. The average number of attention switches between speakers was 5 (Fig. 2a). No significant differences were found between the two target speakers regarding the overall lengths of time the listener attended to them, t(20) = 0.750, p = .462, Cohen’s d = 0.335, 95% confidence interval (CI) = [−0.200, 0.094] (Fig. 2b), scores of speech perception, t(20) = 1.334, p = .197, Cohen’s d = 0.597, 95% CI = [−3.297, 0.725], and comprehension, t(20) = 1.673, p = .110, Cohen’s d = 0.748, 95% CI = [−1.498, 0.164], as well as frequency of responses, t(20) = 0.875, p = .392, Cohen’s d = 0.391, 95% CI = [−4.028, 1.647]. Further, there were no significant correlations between speech perception and comprehension scores and attentional time for each speaker—left speaker: speech perception, r(19) = .250, p = .274; speech comprehension: r(19) = .357, p = .112; right speaker: speech perception, r(19) = .291, p = .201; speech comprehension: r(19) = .016, p = .944—nor were there significant correlations between the two speakers in scores of speech perception and comprehension—perception: r(19) = .055, p = .811; comprehension: r(19) = .202, p = .380. Taken together, these results suggest that the listener can understand the two speeches equally well, and speech perception and comprehension levels do not influence which speech was attended.
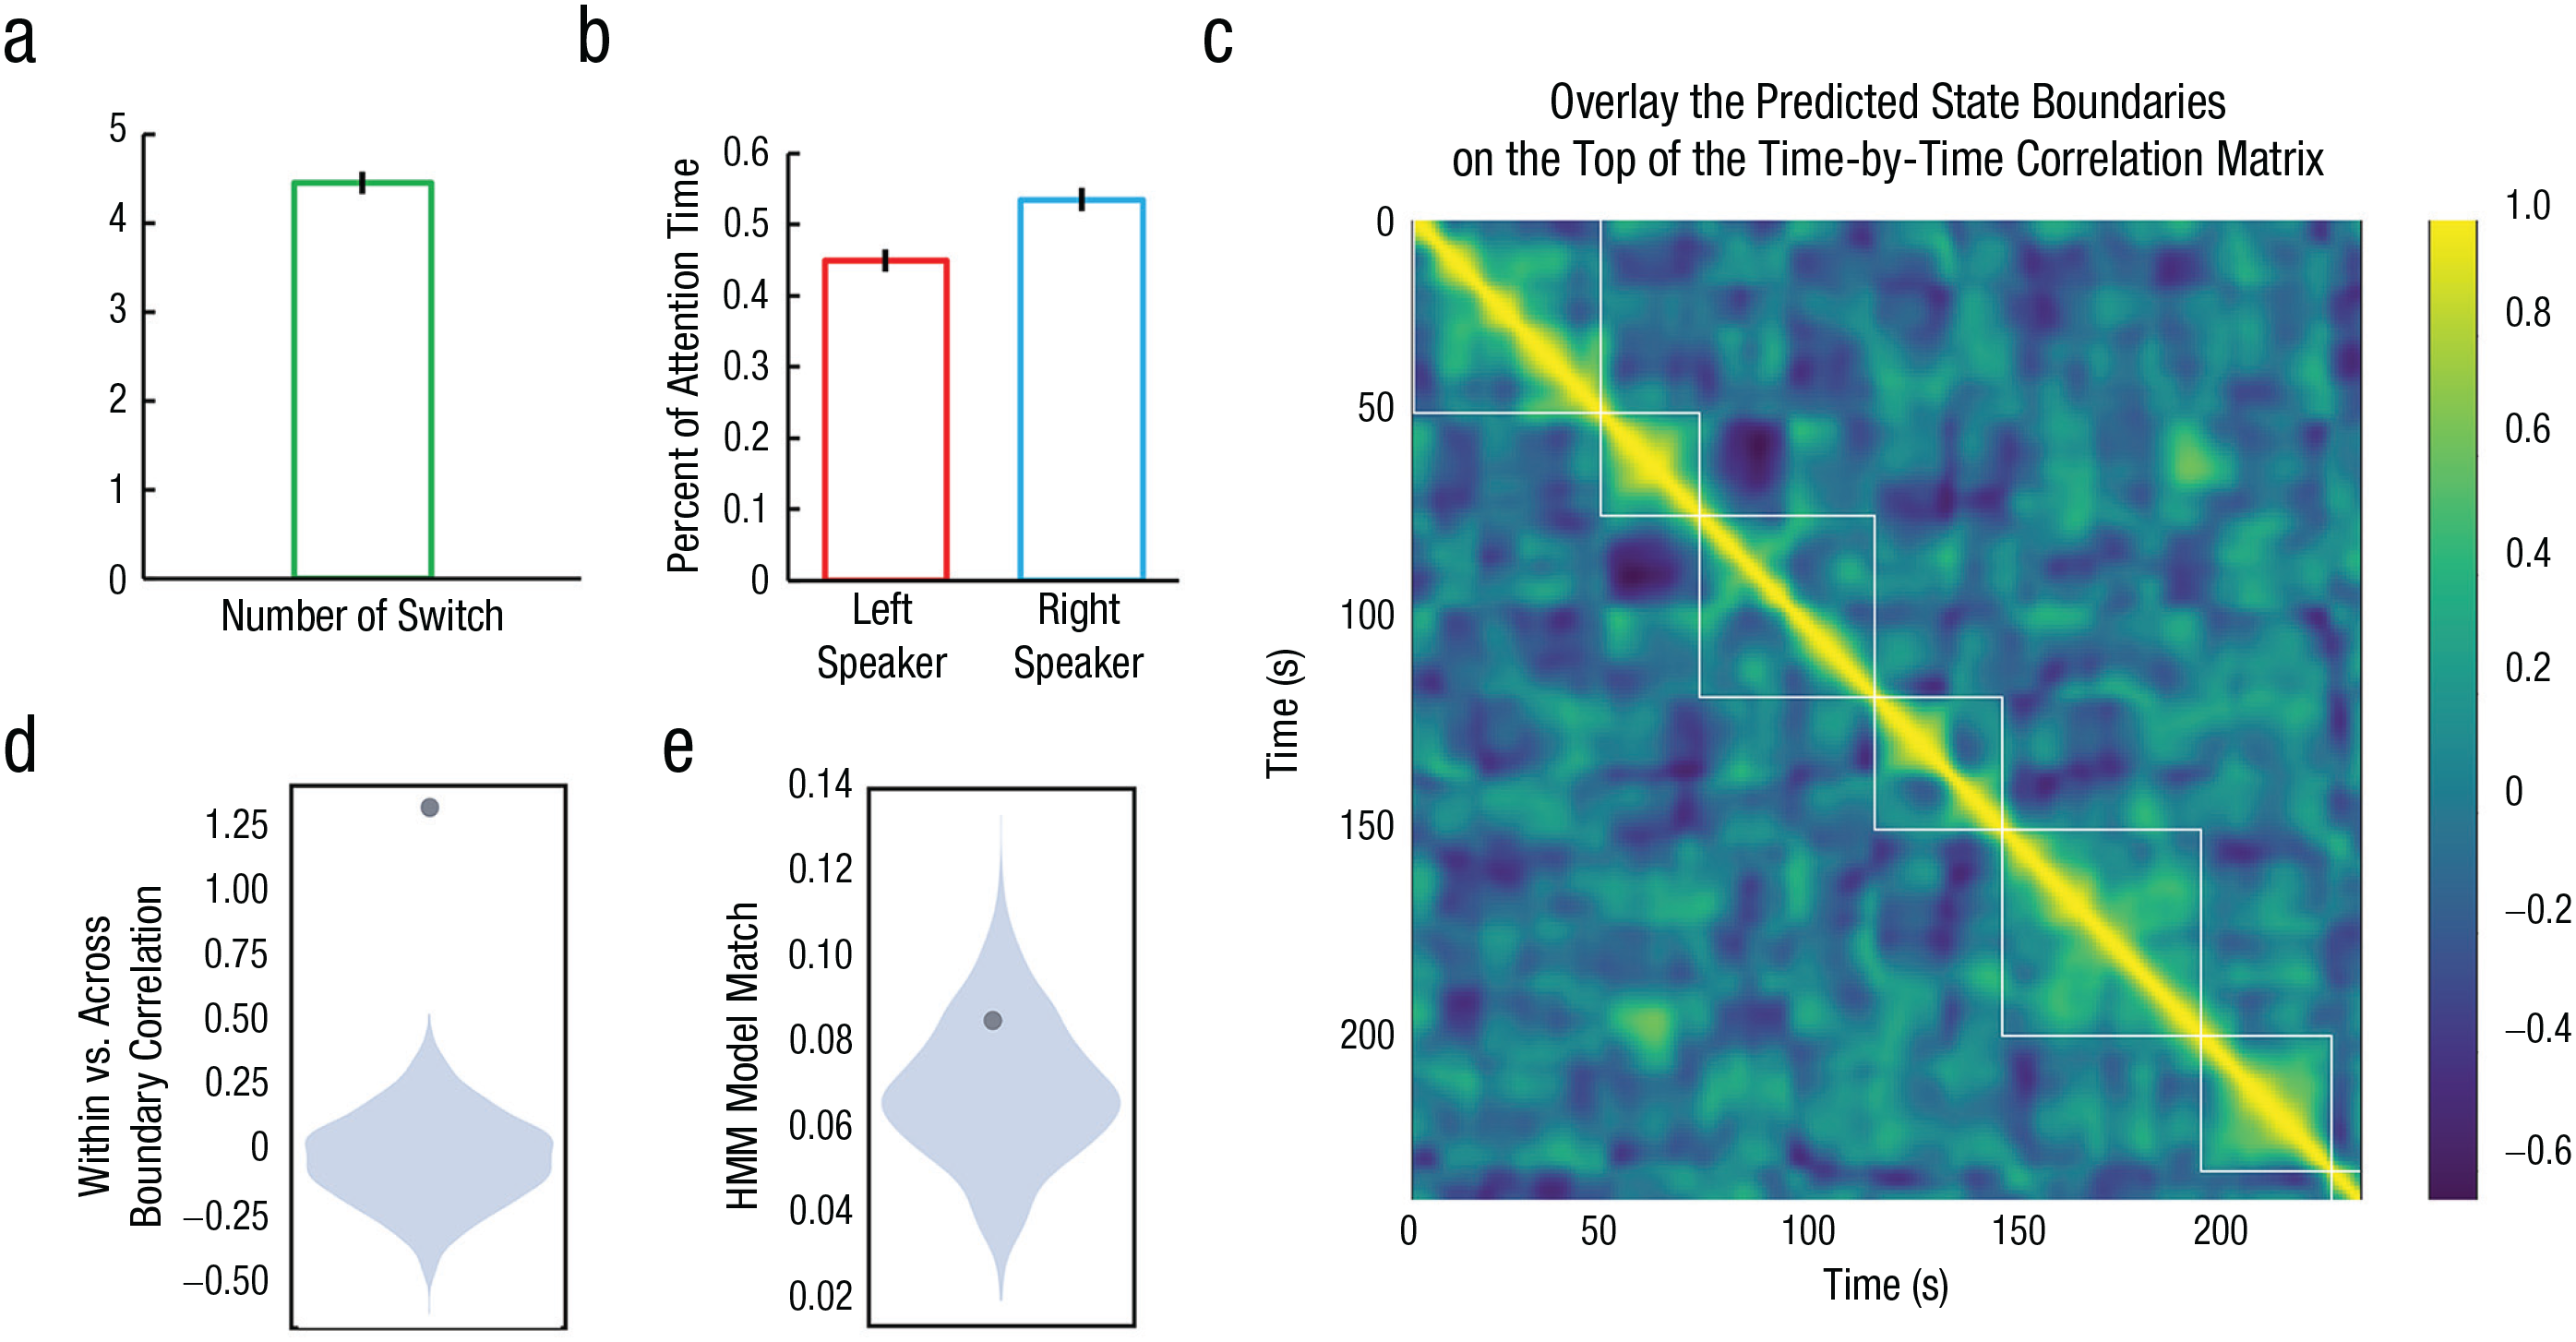
Attentional switch between speakers. The average number of attention switches across all speakers in all participant groups is shown in (a); the percentage of time when the listener attended to a specific speaker is shown in (b). Error bars indicate standard errors. In (c) is illustrated an example of the hidden Markov modeling (HMM) results (Participant #13). The interpersonal neural synchronization was correlated between each pair of the two nearby time points (e.g., t vs. t + 1) across all channel combinations (121 in total). It was assumed that the INS correlation should be high within states but low across states (a hot color indicates high correlation, and a cold color indicates low correlation). The cluster of correlation should be consistent with the HMM-coded state boundary (the rectangle highlighted by the white line). The difference of INS correlations between, within, and across boundaries of attentional states is shown in (d); the consistency between the boundaries coded by human participants and that predicted by the HMM model is shown in (e). The dark dots indicate the true values.
Second, to infer the sequence of the listener’s hidden attentional states on the basis of the fNIRS data and validate the human-coded state boundaries, the HMM method was employed. The HMM analysis was conducted by referring to a previous study (Baldassano et al., 2017) to search the optimal number of states (i.e., k) in each listener-speaker pair. The results showed that the k values coded by humans survived this test.
The formal HMM analysis was conducted using human annotations, and the statistical significance was determined using a permutation test by randomly shuffling the positions of the state boundaries and comparing the boundaries of each time with that coded by human participants. The results showed that the INS correlation between time points was significantly higher within boundaries than between boundaries (permutation test, 1,000 times, p < .001; see Figs. 2c and 2d). Additionally, there were no significant differences between the positions of boundaries predicted by the HMM model and that coded by human participants (permutation test, 1,000 times, p = .170; see Fig. 2e).
High-level linguistic information drives attention switching
Previous studies have suggested that both the linguistic information and basic acoustic features are possibly relevant to the listener’s attention switching (Bögels & Torreira, 2021). Here, to answer which aspects of speech information drove the switch of the listener’s attention, we first examined the acoustic features of the speech produced by both speakers, including intensity, pitch, and formants (F1–F4). However, no significant differences were observed between before and after the switch of attentional states on any of the acoustic features—intensity: t(49.552) = 0.337, p = .737, Cohen’s d = 0.096, 95% CI = [−1.107, 1.427]; pitch: t(58.488) = 1.343, p = .184, Cohen’s d = 0.351, 95% CI = [−2.847, 14.467]; F1: t(64.52) = −2.545, p = .013, Cohen’s d = 0.634, 95% CI = [−39.020, −4.707]; F2: t(90) = 0.338, p = .736, Cohen’s d = 0.071, 95% CI = [−42.784, 60.326]; F3: t(44.998) = −1.02, p = .313, Cohen’s d = 0.304, 95% CI = [−62.607, 20.506]; F4: t(55.062) = −1.606, p = .114, Cohen’s d = 0.433, 95% CI = [−70.428, 7.757] (FDR correction at p < .05 level; see Fig. 3b).
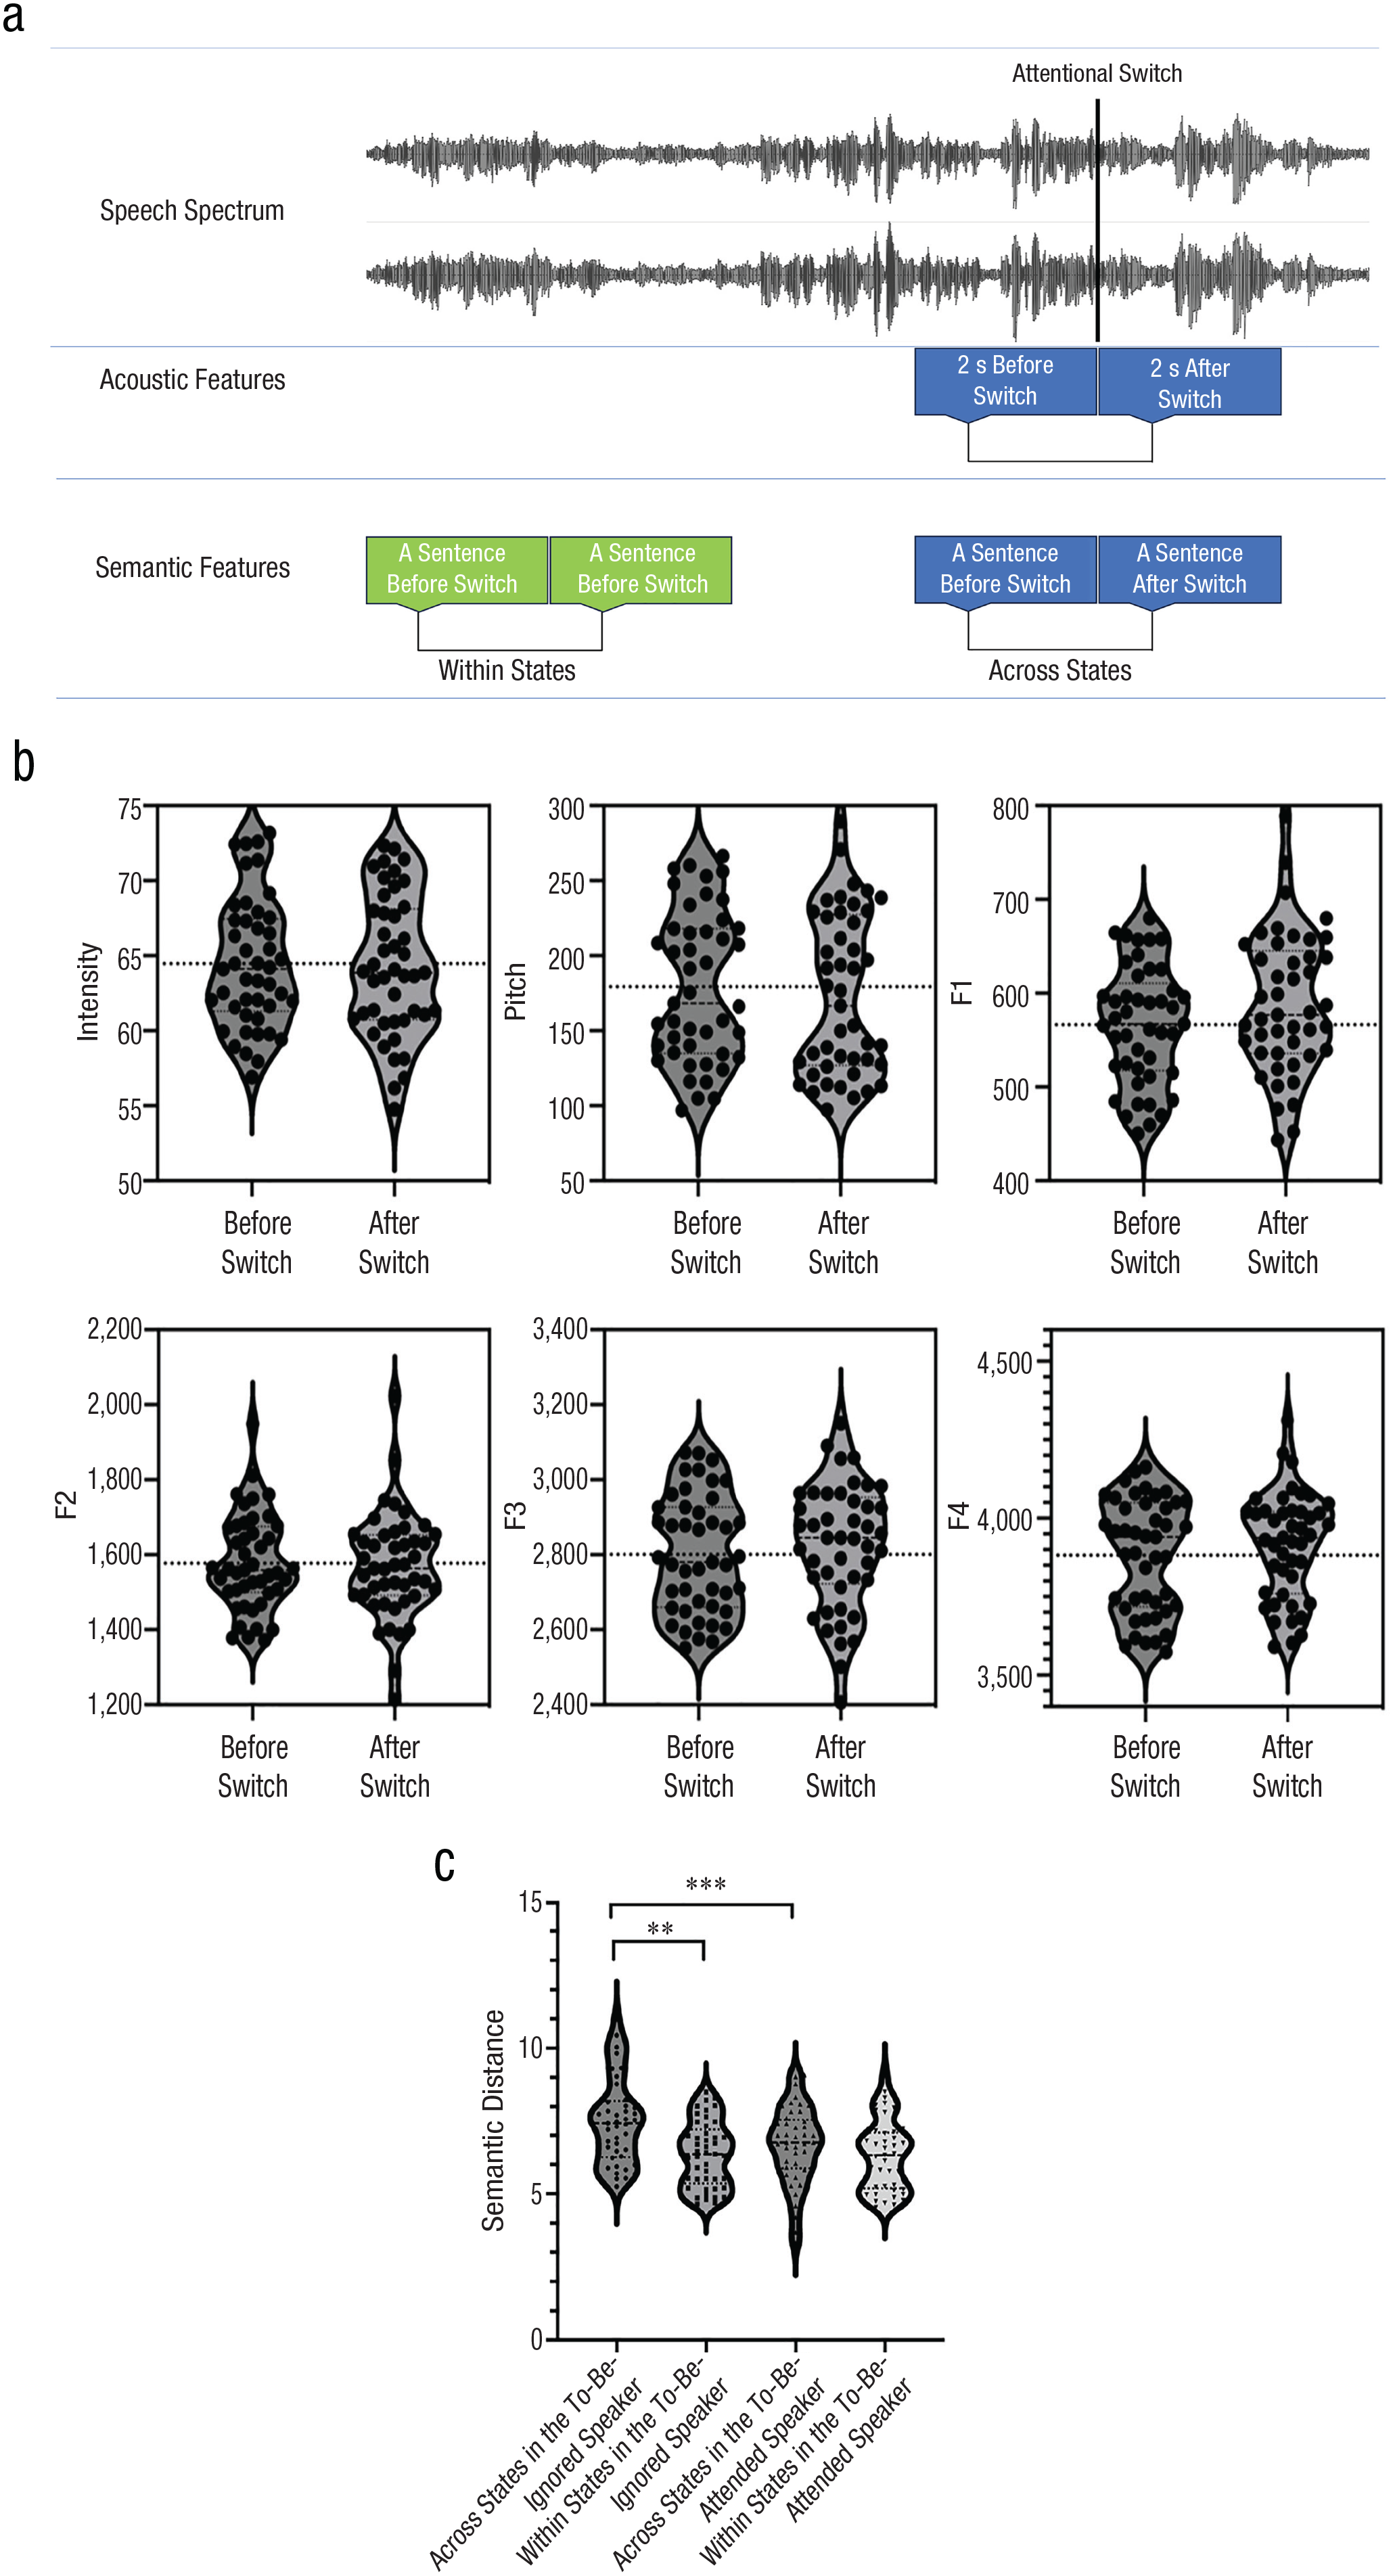
The speaking processes associated with attentional switch. The analytic procedure is shown in (a); no significant effect was found on acoustic features (b), including intensity, pitch, and formants (F1–F4). A significant effect was found on semantic distances (c). **p < .005. ***p < .001.
Then, we tested whether the change of high-level semantic information across attentional states was associated with attention switching, using the linear mixed-effect method. We chose semantic distance to reckon the fluency of the two speech signals. The results showed a significant main effect of attention switching, F(1, 176) = 5.582, p = .019, η p 2 = .114, with significantly larger semantic distance before switching than after switching. A significant main effect of switch direction was also found, F(1, 176) = 15.043, p < .001, η p 2 = .326, with larger semantic distance in the to-be-ignored speaker than in the to-be-attended speaker. More importantly, a significant interaction between attention switching and switch direction was found, F(1, 176) = 4.094, p = .045, η p 2 = .072. Further pairwise comparisons showed that when attention switched, the semantic distance was significantly increased in the to-be-ignored speaker than in the to-be-attended speaker, mean difference = 1.143, SE = .274, p < .001, 95% CI = [0.603, 1.684], but no significant difference was found when no attention switching occurred, mean difference = 0.359, SE = .274, p = .191, 95% CI = [−0.181, 0.900] (Fig. 3c). Additionally, significantly larger semantic distance was found across states than within states in the to-be-ignored speaker, mean difference = 0.850, SE = .274, p = .002, 95% CI = [0.309, 1.391], but not in the to-be-attended speaker, mean difference = 0.066, SE = .274, p = .811, 95% CI = [−.475, .606] (Fig. 3c). Taken together, these results suggest that only the increase in semantic distance of the to-be-ignored speech is associated with the switch of attentional states in the listener. Therefore, the consistency of semantic content in the target speech is crucial for maintaining the listener’s attention, regardless of the content of competing speech.
Besides, as the high-validity setup of our experiment allowed the two speakers to sit nearby and speak simultaneously to the listener, there was potential interference between them, which might further affect the listener’s attention. To exclude these possibilities, we also calculated the semantic distance between the speeches of the two speakers across time. The true distance was compared with a null distribution of the semantic distance generated through 1,000 times random permutation of the time course of the sentences. The results did not show that any true semantic distances were different from the null distribution (ps > .05; Fig. 4) at any time points of any groups. Moreover, we also investigated the semantic distance between the speeches of the two speakers before and after the switch—that is, the distance between the vectorized sentence of the left speaker and that of the right speaker immediately before and after the switch of the listener’s attention. However, no significant difference was found, t(58) = 0.172, p = .864, Cohen’s d = 0.053, 95% CI = [−0.668, 0.794], nor were there significant correlations between the averaged semantic distance between speakers and the attention switching in the listener, r(19) = −.204, p = .374.

Semantic distance. No significant semantic similarity was found (i.e., 1-distance) between the two speakers across time. The blue color indicates the true values, and the gray color indicates the null distribution.
Neural representations of different speeches
Before investigating the enhancement or suppression of INS during different phases, we wanted to test whether INS selectively represented different speeches at a specific moment during the conversation. To this end, we conducted FLDA across time within each participant group at each time lag. The prediction accuracy across time lags significantly fitted a quadratic curve, R2(2, 18) = .415, p = .008, and peaked when the listener’s brain activity was ahead of that of the speaker by 2 s (LA pairs: 68.15%, SD = 7.36%; LU pairs: 67.21%, SD = 7.27%; see Fig. 5a). This may index that the listener actively predicts the speech production of the speaker during the natural conversation. A nonparametric test showed that the prediction accuracy was significantly higher than the chance level (50%; 1,000 bootstrap) for both the LA pairs, mean difference = 18.148 (SE = 1.586), p = .001, 95% CI = [14.800, 21.497], and the LU pairs (mean difference = 17.210 (SE = 1.629), p = .001, 95% CI = [13.986, 20.489]—that is, both the attended and unattended speakers were correctly classified.
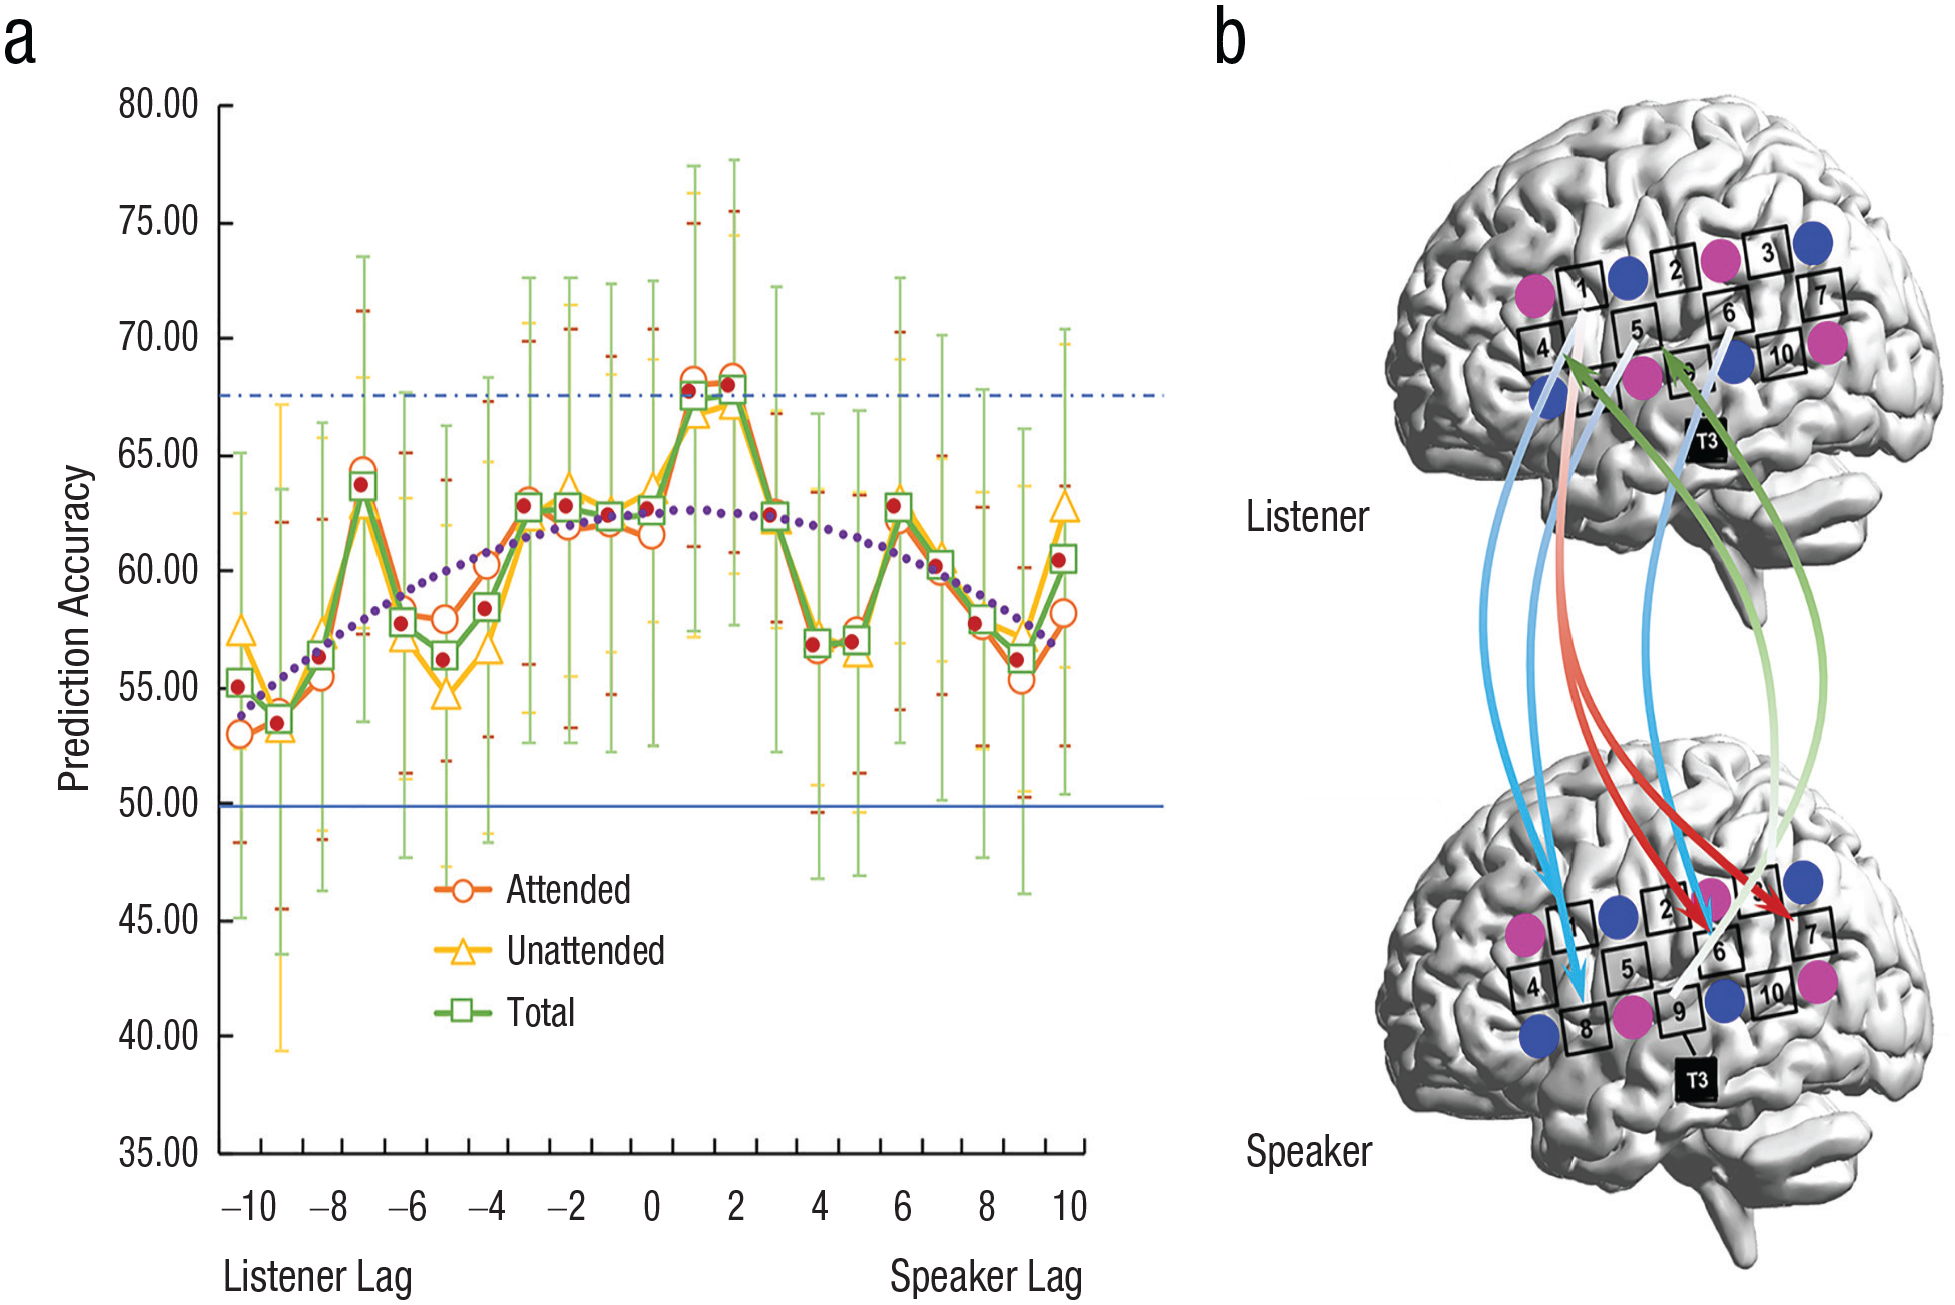
Classification results. The prediction accuracy of the attended and unattended speakers and the total accuracy based on the interpersonal neural synchronization (INS) are shown in (a). The dashed purple line shows the trend of the estimated curve. The solid blue line indicates the 50% chance level, whereas the dashed blue line indicates the peak of the prediction accuracy across time lags. INS that significantly contributed to the prediction is shown in (b). Blue arrows indicate INS between the same measurement channels (CHs) of the listener and the speaker, and red and green arrows indicate INS between different CHs of the listener and the speaker. The arrows indicate the direction of time lag.
Three clusters of CH combinations made significant contributions to the prediction, Wilks’s lambda = .547, χ2(7) = 37.696, p < .001 (see Fig. 5b). The first cluster of CH combinations showed INS between the same brain regions of the listener and the speaker, which roughly covered the left superior temporal cortex (STC; CH6) and inferior frontal cortex (IFC; CH1 and 5) of the listener and the same regions (CH6, 1, and 8) of the speaker (STC-STC: CH6-6; IFC-IFC: CH1-1, CH5-8). The second cluster of CH combinations showed cross-region INS between the left IFC of the listener and the STC of the speaker (IFC-STC: CH1-6, CH1-7). The final cluster of CH combinations also showed cross-region INS but in a reverse pattern, that is, between the STC (CH9) and the temporoparietal junction (TPJ; CH3) of the listener and the left IFC (CH4 and 5) of the speaker (STC/TPJ-IFC: CH9-5, CH3-4).
Selective enhancement and suppression of INS during attention switching
To test whether INS was dynamically enhanced or suppressed when the listener’s attention switched between different speakers, the time courses of INS during different phases were investigated. First, we analyzed INS around the time of attention switching. The curve estimation showed that at the IFC-IFC and STC-STC, INS was significantly suppressed when the target speaker was ignored (quadratic), R2(2, 10) = .982, p < .001, but was significantly enhanced when the ignored speaker came into the listener’s attention (quadratic), R2(2, 10) = .989, p < .001. A similar pattern was found in the cross-brain region INS. That is, in the IFC-STC and STC/TPJ-IFC, INS was significantly suppressed when the target speaker was ignored (quadratic), IFC-STC: R2(2, 10) = .893, p < .001, STC/TPJ-IFC: R2(2, 10) = .965, p < .001, but was significantly enhanced when the ignored speaker came into the listener’s attention (quadratic), IFC-STC: R2(2, 10) = .879, p < .001, STC/TPJ-IFC: R2(2, 10) = .973, p < .001 (Figs. 6a, 6b, and 6c).
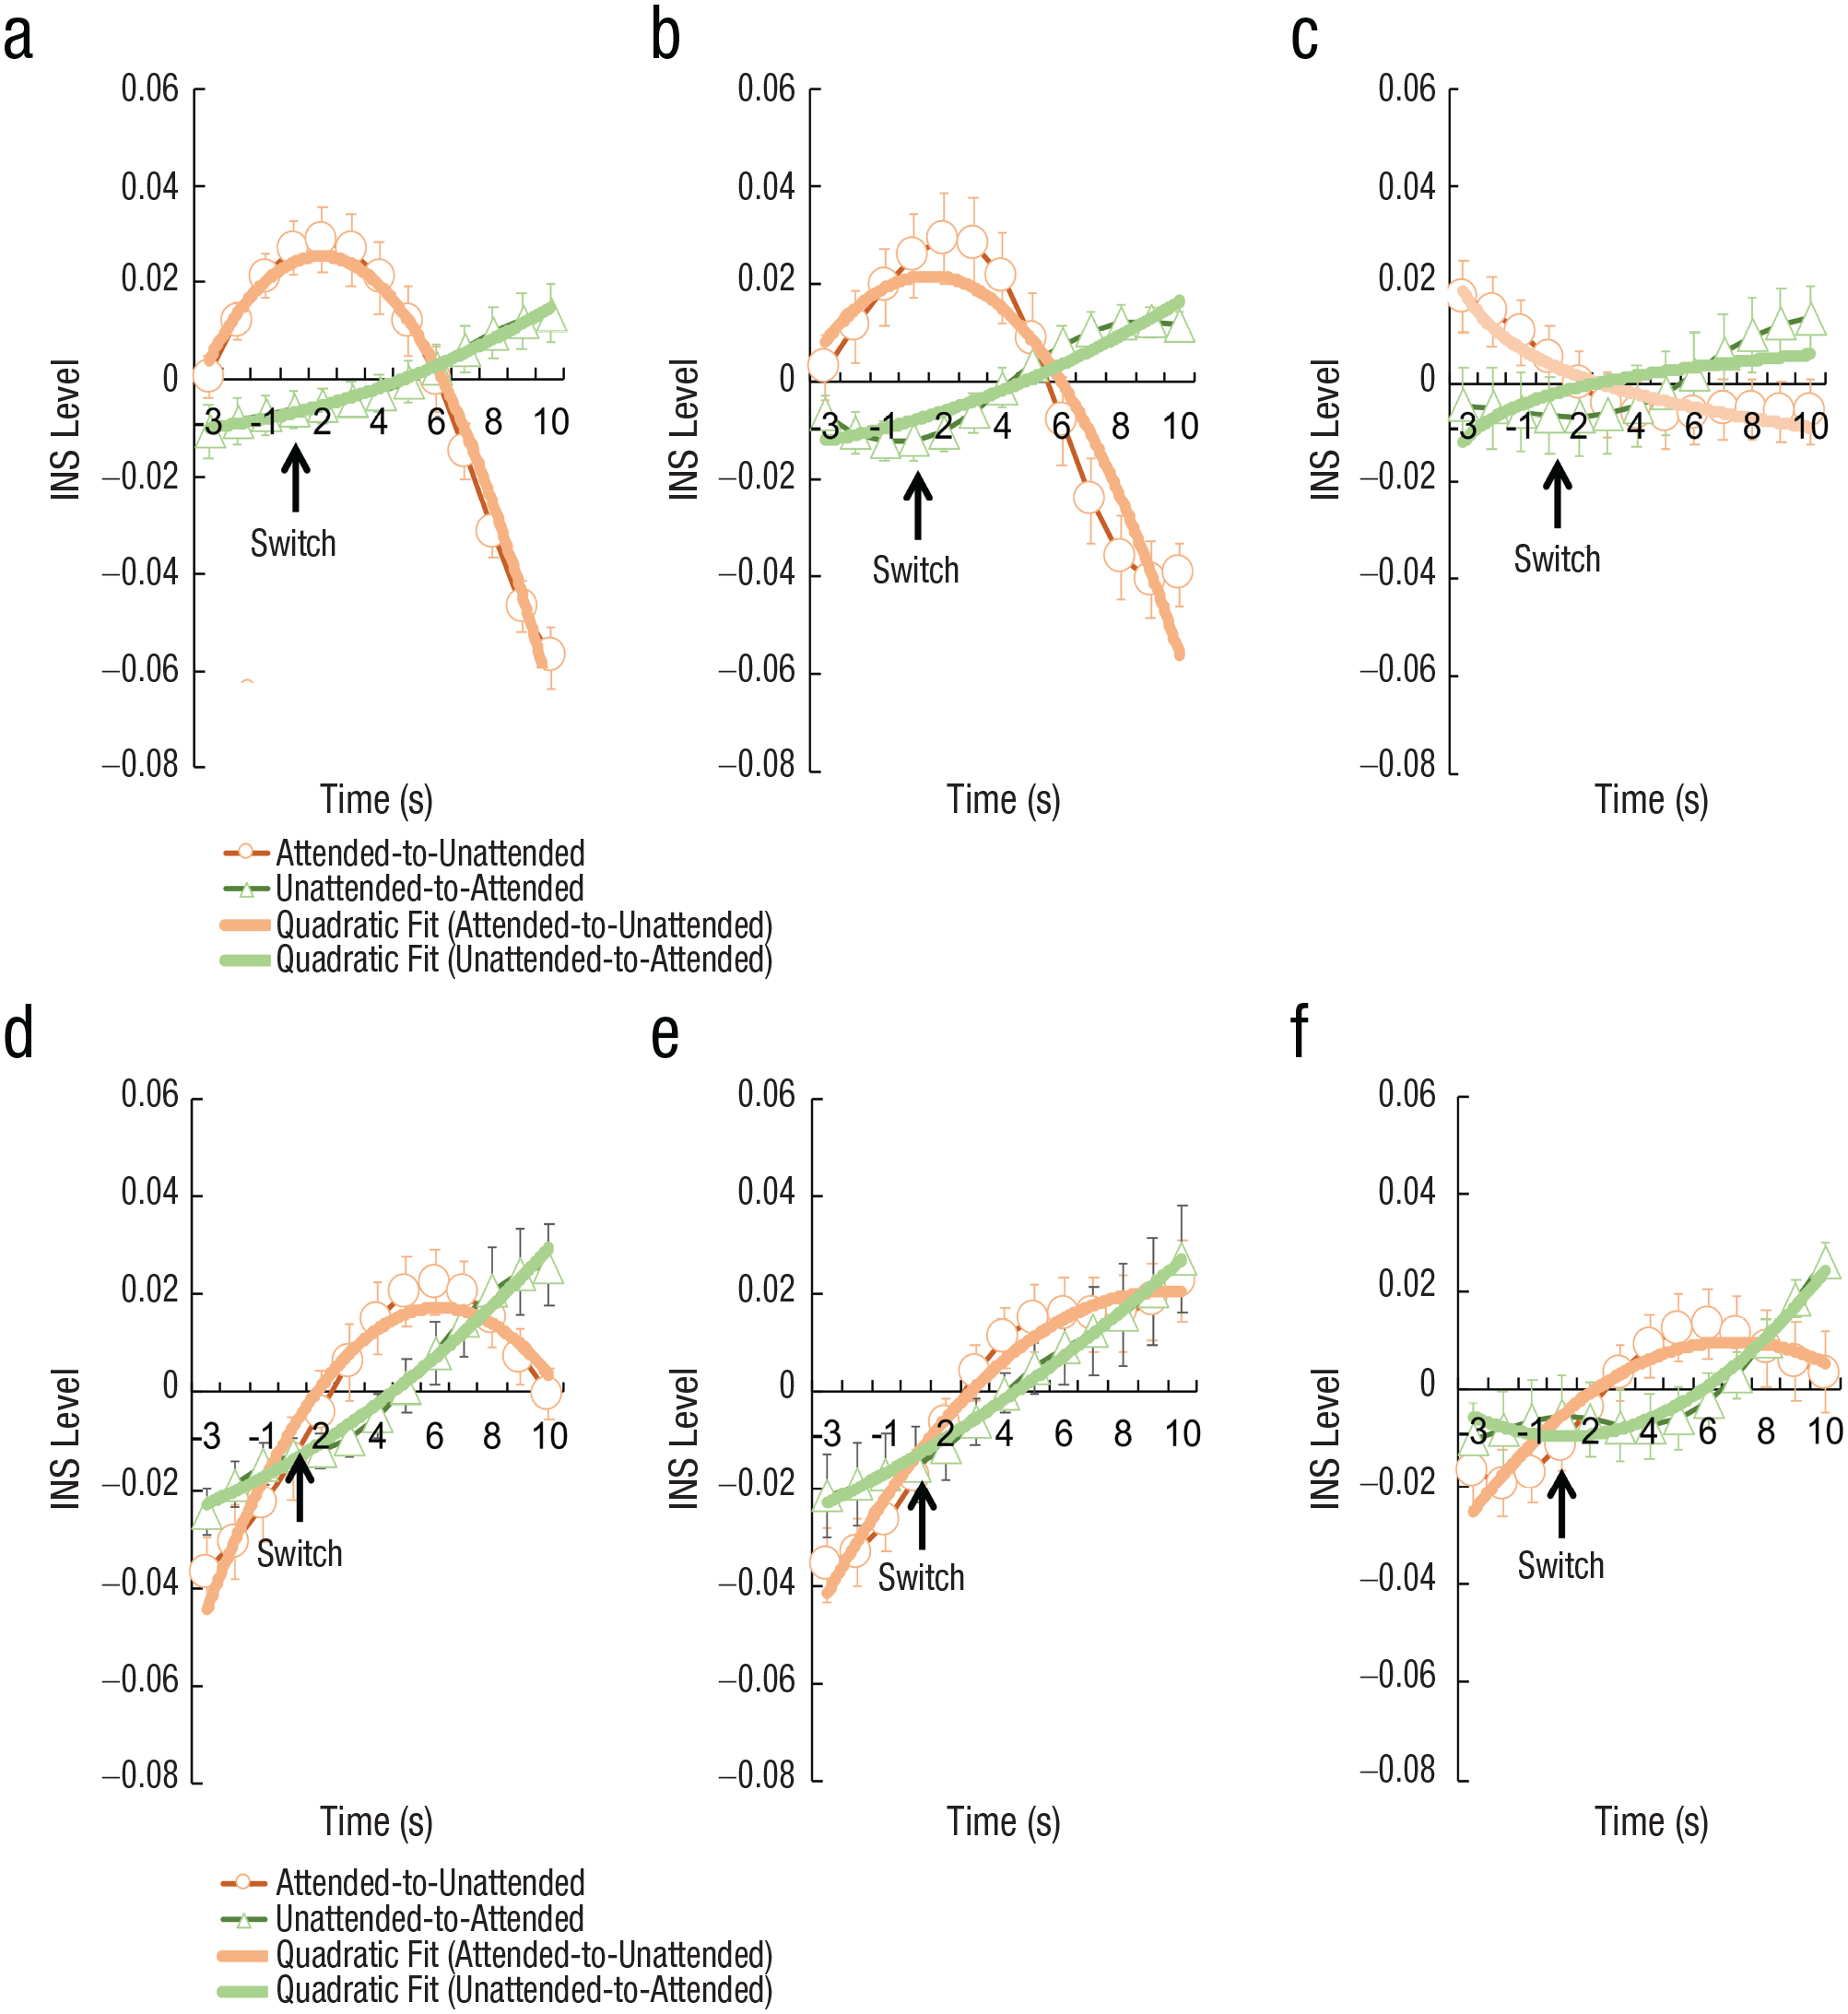
The interpersonal neural synchronization (INS) patterns between the listener and speakers during the phase of attention switching at the IFC-IFC and STC-STC (a), IFC-STC(b), and STC/TPJ-IFC(c). The INS patterns between the two speakers are presented in (d), (e), and (f). The time point of attention switching is indicated by the black arrow. The thin curves indicate the INS level across time, whereas the thick curves indicate the fitted results. IFC = inferior frontal cortex; STC = superior temporal cortex; TPJ = temporoparietal junction.
Additionally, to validate the above results and exclude the potential interference between the two speakers, we also examined the INS pattern between speakers. The curve estimation showed that at all three clusters, INS between speakers increased when the listener’s attention switched from one speaker to the other, no matter whether the target speaker was ignored or the ignored speaker came to be attended (ps < .05; Figs. 6d, 6e, and 6f), suggesting that the listener’s attention switching as a common external stimulus triggered an increase of INS between the two speakers.
Next, to validate the enhancement and suppression effect, the two INS time courses were statistically compared using a running window procedure (size = 5 s, paired two-samples t test, FDR correction for multiple comparisons across running windows, p < .05). The results showed that at the IFC-IFC and STC-STC, the INS difference between the LA and LU pairs was significant before the switch, t(4) = 16.098, p < .001, Cohen’s d = 16.098, 95% CI = [0.025, 0.035], but marginally significant after the switch, t(4) = 3.156, p = .034, Cohen’s d = 3.156, 95% CI = [−0.073, −0.005] (Fig. 6a). In the IFC-STC, INS was significantly higher in the LA pairs than in the LU pairs both before the switch of the listener’s attention, t(4) = 11.198, p < .001, Cohen’s d = 11.198, 95% CI = [0.025, 0.041], and after the switch, t(4) = 5.736, p = .005, Cohen’s d = 5.736, 95% CI = [−0.060, −0.021] (Fig. 6b). Marginally significant differences were found between the LA and LU pairs in the STC/TPJ-IFC before the switch after FDR correction, t(4) = 2.187, p = .094, Cohen’s d = 2.187, 95% CI = [−0.002, 0.016], or after the switch after FDR correction, t(4) = 7.079, p = .002, Cohen’s d = 7.709, 95% CI = [−0.020, −0.009] (Fig. 6c). No other significant results were found at any of the other CH combinations (ps > .05). The same analysis was performed on the INS between the two speakers, but no significant results were found either before or after the listener’s attention switched (ps > .05, FDR correction; Figs. 6d–f).
Finally, to further test the inhibition versus attenuation hypotheses, we also analyzed INS between the listener and the speakers and between the two speakers during the phase of sustained attention. The curve estimation results did not show any significant enhancement or suppression in any CH clusters, including IFC-STC, STC/TPJ-IFC, STC-STC, and IFC-IFC, nor were there any significant results for any other CH combinations (ps > .05). Also, paired two-sample t tests did not reveal any significant differences between the LA and LU pairs or between the LA/LU and AU pairs in INS (ps > .05).
Speech processing associated with INS
To test which speaking process was associated with INS, the INS pattern during the phase of sustained attention or attention switching was correlated with the acoustic or semantic features of the speaker’s speech. The results showed a significantly negative correlation between the increase of speech distance and the suppression of INS in the IFC-IFC and STC-STC when a speaker who had been attended to started to be ignored (rp = −.475, p = .046), which supported the second hypothesis.
We then investigated the relationship between the pattern of INS and the quality of comprehension and perception. The results showed that the quality of comprehension on the speaker’s speech was significantly negatively correlated with the INS pattern in the IFC-IFC and STC-STC when a speaker changed from being attended to being ignored (rp = −.616, p = .011), which provided further support for the second hypothesis.
No other significant correlations were found in other brain regions (ps > .05; Fig. 7). Moreover, no significant correlations were found for INS during the phase of sustained attention (ps > .05), either.
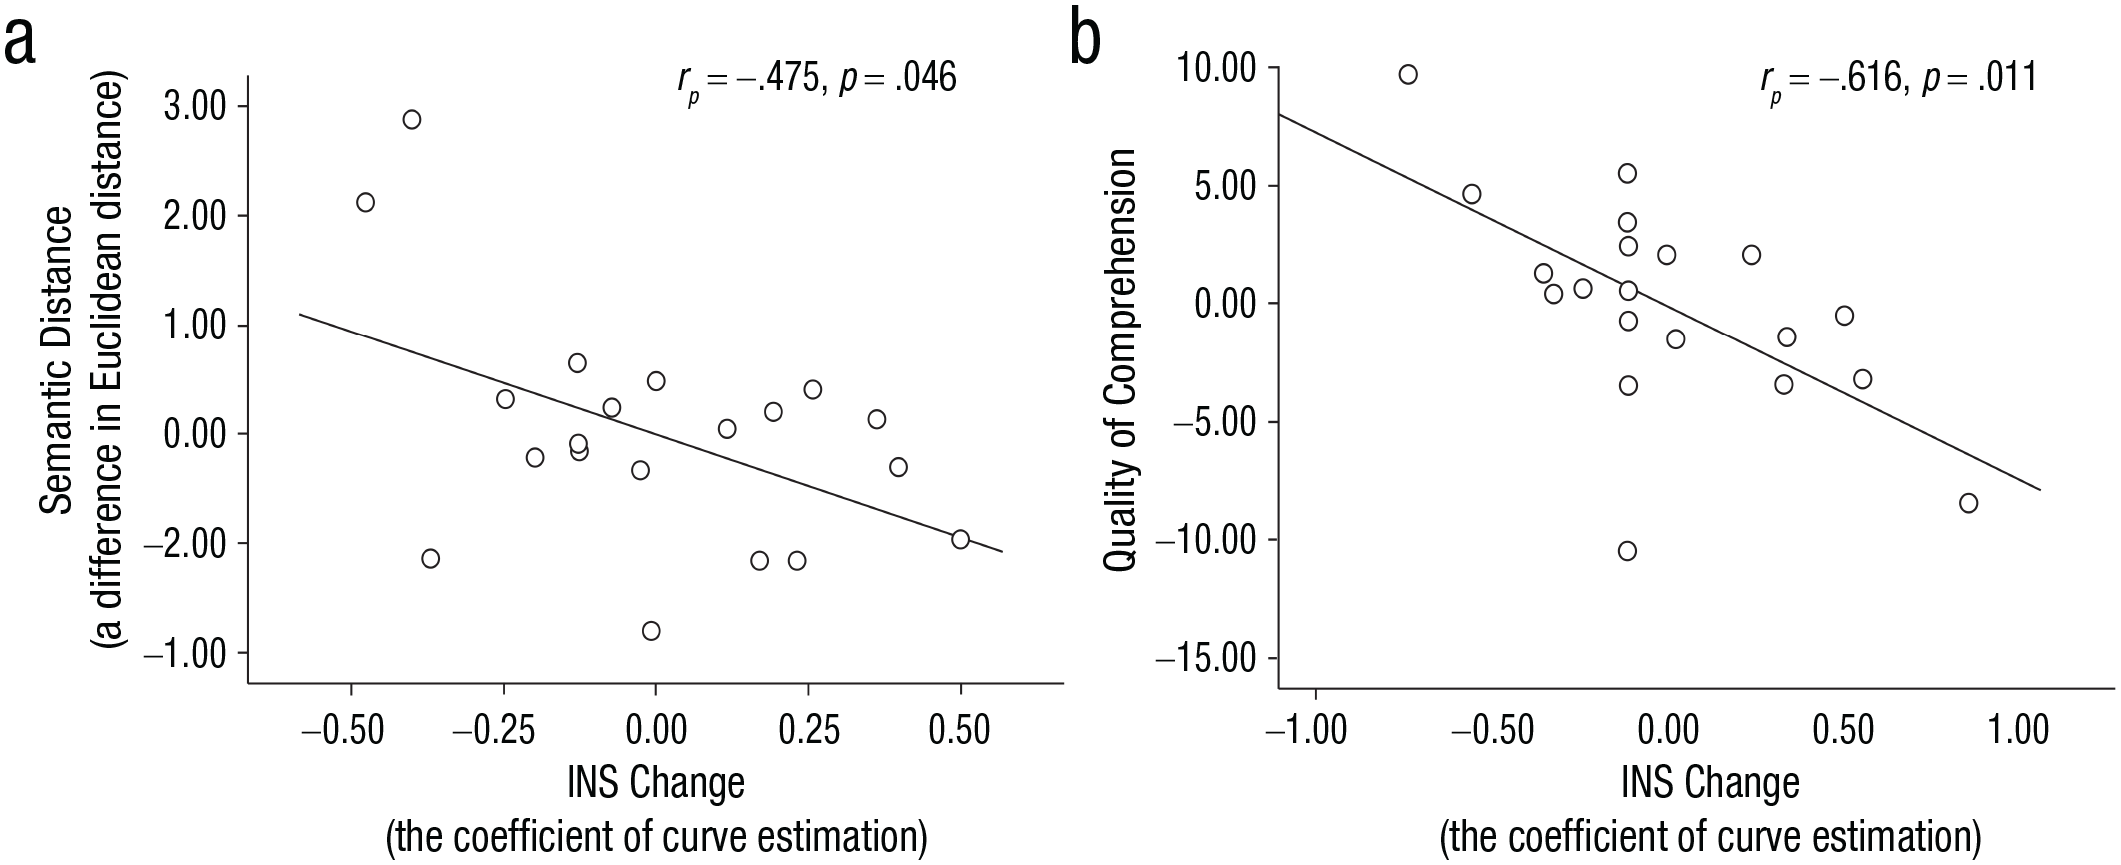
Correlations between the interpersonal neural synchronization (INS) pattern and behavioral data. Significant correlation (a) was found between the averaged coefficients of curve estimation at the IFC-IFC and STC-STC and the difference between semantic distance across states and that within states in the first speaker who lost attention from the listener. A significant correlation was also found (b) between the INS pattern and the quality of speech comprehension. IFC = inferior frontal cortex; STC = superior temporal cortex.
Discussion
This study investigated the neural processes involved in dynamically switching selective attention during a natural conversation with multiple speakers. Two theories regarding the attention system were considered, distinguished primarily by the stage at which one of the two signals was rejected for further analysis (Broadbent, 1958; Treisman, 1964). We showed that, during the phase of sustained attention, there was no selective enhancement of INS between the listener and the attended speaker, compared to that between the listener and the unattended speaker. In contrast, INS was significantly suppressed when the listener shifted attention away from the current attended speaker, but was significantly enhanced when the ignored speaker became the target. Additionally, the changing of INS in the IFC and STC were driven by the change in semantic consistency rather than acoustic features of the to-be-ignored speech. These results support the attenuation hypothesis, which suggests that both speech signals are processed at higher linguistic levels when attention is sustained. However, attention switching incurs a cognitive cost, as indicated by the overall decreased INS and the relative changes in the INS of the listener and the two speakers in the opposite direction.
The current paradigm enables a detailed examination of the free-flowing attention systems, especially during attention switching. We found that both speakers could be successfully classified on the basis of INS throughout the entire conversation process, including the phases of sustained attention. This result confirms that both attended and ignored speech are processed by the listener, which is in line with previous studies (Brodbeck et al., 2020; Dai et al., 2017, 2022; Ding & Simon, 2012; Fiedler et al., 2019; Har-shai Yahav & Zion Golumbic, 2021; Horton et al., 2013; Keshavarzi et al., 2021; Vachon et al., 2020; Zion Golumbic et al., 2013) and Treisman’s attention theory (Treisman, 1964). However, contrary to our previous study (Dai et al., 2018), we failed to find any relative enhancement or suppression of INS for the two speakers. This result is unexpected, yet understandable. Listeners may employ different listening strategies for cocktail-party tasks with or without attention switching (Makov et al., 2023). In the current study the listeners were told to freely choose one of the two speakers to listen to and to either switch between them, or not, at any points during the task, according to their own preference. This ensured that both speakers were equally likely to be chosen as the target speaker. As a result, the listeners may need to keep their attention systems more dividable (to achieve flexible switching), and the discrepancy in INS is weakened (i.e., corresponding respectively to the target speech and the ignored speech).
When the listener shifted attention, we observed intertwined fluctuations of INS at the switching time point; that is, INS between the listener and the to-be-ignored speaker was significantly suppressed, whereas INS between the listener and the to-be-attended speaker was significantly enhanced. Current oscillatory models of speech processing suggest that different neural oscillations decode distinct levels of speech information and that fast oscillations (gamma) are hierarchically phase-locked to slow oscillations (alpha, theta, or both; Ding & Simon, 2014; Giraud & Poeppel, 2012; Zoefel & Kösem, 2024). In other words, low-frequency oscillations impose periods of inhibition and excitation on high-frequency neural dynamics. This nested phase-amplitude coupling provides a mechanism for prioritizing and ordering the input on the basis of relevance (Jensen et al., 2012; Kösem & van Wassenhove, 2017). In multispeaker settings, entrained neural oscillations simultaneously enhance the processing of target speech by aligning with the high-excitability phase and suppress the processing of distractors by aligning with the low-excitability phase (Kösem & van Wassenhove, 2017). Crucially, recent studies have shown neural entrainment to both target and distracting speech, but in an antiphase relation (Horton et al., 2013; Keshavarzi et al., 2021). Therefore, the observed neural fluctuations across the attention switching possibly reflect the phase reset of the neural oscillations, in order to process the to-be-attended speech in an excited phase. Once the switching is successfully achieved, the cortical responses to the two speeches return to the way that they were.
We found that it was the high-level semantic information rather than the basic acoustic features of the speech that drove the switch of the listener’s attention. Previous studies have shown that turn-taking time point is cued by both lexicosyntactic and intonational information from the previous conversational context (Bögels & Torreira, 2021), suggesting that both linguistic information and basic acoustic features are possibly relevant to the listener’s attention switching. Our study confirmed that, compared to the acoustic features, the change in the semantic consistency in the speaker’s speech is a more effective driver for the dynamic switching of the listener’s attention in such a natural multispeaker conversation. It remains unknown, however, whether the semantic information plays a crucial role only in attention switching or in all selective-attention systems. Most interestingly, we found that it was the decrease in semantic consistency, rather than the increase, that was responsible for the listener’s attention switching, and the dynamic change in INS of the IFC-IFC and STC-STC around attention switching negatively correlated with the decrease in semantic consistency, but not with that of acoustic features in the to-be-ignored speaker. This finding suggests that the consistency of high-level linguistic information is important to maintain the listener’s attention. This is consistent with the classic finding that the transitional probabilities of words are one of the main factors in determining selection and switching between two signals (Treisman, 1964).
According to the widely accepted view today, the brain is not merely a stimulus-sampling machine but actively constructs and processes the information it receives. Thus, it is crucial to set an ecological design when investigating highly self-controlled systems like attention. This study shows that self-regulating attention switching may require cognitive effort to reactivate the inhibitory-speech signal, and people may employ different listening strategies to cope with dynamic conversations. However, the paradigm we used here has some shortcomings. For example, the two speakers were seated closely and spoke simultaneously throughout the experiment. This could potentially result in mutual interference between the speakers, affecting the quality of their speech expression and brain activity. Although we tested the relationship between speakers regarding their perception and comprehension quality—semantic distance as well as INS—and did not find any significant effects, this issue should be well addressed in future studies. In addition, we were unable to objectively evaluate the listener’s attention state and comprehension levels with this paradigm, except through self-reporting. Thus, direct comparison of the comprehension levels before and after attention switching was not possible in the current study. Furthermore, these results clearly show us that investigating selective attention and attention switching is complicated because of the lack of direct access to the listener’s internal state of attention (Kaufman & Zion Golumbic, 2023; Makov et al., 2023). Nevertheless, a naturalistic design like this can be complementary to the traditional strictly controlled design, and together they can provide a more comprehensive understanding of how the brain functions, specifically in terms of how attention dynamically switches in a cocktail-party scenario.
In summary, this study reinforces the notion that conversational tracking is an active task that demands cognitive resources, particularly when there is a shift of selective attention in multispeaker settings. The attention systems exhibit dynamic biases toward one speaker over another, resulting in an enhanced representation of one speech stream and a reduced representation of the other. To effectively capture the audience’s attention during a presentation, the speaker must stay on topic and avoid straying too far from the main message.
Supplemental Material
sj-tif-1-pss-10.1177_09567976241243367 – Supplemental material for How the Listener’s Attention Dynamically Switches Between Different Speakers During a Natural Conversation
Supplemental material, sj-tif-1-pss-10.1177_09567976241243367 for How the Listener’s Attention Dynamically Switches Between Different Speakers During a Natural Conversation by Bohan Dai, Yu Zhai, Yuhang Long and Chunming Lu in Psychological Science
Footnotes
Transparency
Action Editor: M. Natasha Rajah
Editor: Patricia J. Bauer
Author Contributions
The first two authors contributed equally to this work.
References
Supplementary Material
Please find the following supplemental material available below.
For Open Access articles published under a Creative Commons License, all supplemental material carries the same license as the article it is associated with.
For non-Open Access articles published, all supplemental material carries a non-exclusive license, and permission requests for re-use of supplemental material or any part of supplemental material shall be sent directly to the copyright owner as specified in the copyright notice associated with the article.