






Abstract
Researchers have long debated whether self-esteem is associated with aggression. In this preregistered research, we tested the effects of self-esteem on aggression by using statistical models that control for unmeasured time-invariant confounders. Data came from a multi-wave longitudinal study of 674 Mexican-origin families, including multi-informant assessments of children, mothers, and fathers at 1- or 2-year intervals. There was no evidence of systematic self-esteem effects on aggression, and the results held when we controlled for narcissism and when the influence of shared-method variance could be ruled out. Also, there was little evidence for effects in the reverse direction, that is, from engaging in aggression on self-esteem. One limitation was that in most cases it was not possible to test whether the self-esteem effects were curvilinear because of the nonconvergence of these models. Overall, the findings do not support either low or high self-esteem as a risk factor for aggression.
Introduction
Over the past decades, there has been considerable debate about whether, and in what way, self-esteem is associated with aggression (Baumeister et al., 1996; Donnellan et al., 2005; Ostrowsky, 2010; Zeigler-Hill et al., 2016). Researchers have long argued that low self-esteem is a risk factor that predisposes individuals to show more aggression compared with individuals with high self-esteem (Rosenberg et al., 1989). For example, after experiencing failure, individuals with low self-esteem might avoid feelings of inferiority by assigning blame to others, causing aggressive behavior toward others (Tracy & Robins, 2003). Also, individuals with low self-esteem may use bullying and aggression to improve their status and social power (Ostrowsky, 2010).
In the long run, chronically low self-esteem may lower a person’s ties to society, leading to a heightened risk of aggression and hostility (Donnellan et al., 2005). In contrast, other researchers have suggested that high, not low, self-esteem is linked to aggression, because high self-esteem is often inflated and consequently more easily threatened by negative feedback (Baumeister et al., 1996). This so-called “dark side of high self-esteem” (Baumeister et al., 1996, p. 5) elicited much attention to the topic (Boden et al., 2007; Bushman & Baumeister, 1998, 2002; Donnellan et al., 2005; Trzesniewski et al., 2006; Webster, 2006, 2007; Webster & Kirkpatrick, 2006).
Given conflicting claims about whether low or high self-esteem is associated with aggression, researchers have conducted meta-analyses of cross-sectional studies, which suggest that self-esteem and aggression are negatively correlated (r = −.16, Lei et al., 2020; r = −.21, Teng et al., 2015). Thus, meta-analytic evidence indicates that low, not high, self-esteem is associated with aggression, with a small to medium effect size (Funder & Ozer, 2019). However, cross-sectional data typically do not provide information about the direction of effects and are, consequently, only a first step toward understanding the link between constructs. Thus, it is important to consider longitudinal findings.
Longitudinal studies suggest that low self-esteem prospectively predicts aggressive behavior and violence (Donnellan et al., 2005, Study 2; McCarthy & Hoge, 1984; Trzesniewski et al., 2006; but see Boden et al., 2007). In these studies, effects were tested across time intervals ranging from 1 year (McCarthy & Hoge, 1984) to 2 years (Donnellan et al., 2005) to more than a decade (Trzesniewski et al., 2006). However, there are several important caveats. First, as in all nonexperimental studies, unmeasured third variables may confound the longitudinal effects. Therefore, it would help to use statistical models that provide some control of confounders. Specifically, the random-intercept cross-lagged panel model (RI-CLPM; Hamaker et al., 2015) and the dynamic panel model (DPM; Allison et al., 2017) control for unmeasured confounders that are stable across the observed study period. The RI-CLPM and DPM significantly increase the validity of causal conclusions by closing several backdoor paths that could otherwise confound the effects (Murayama & Gfrörer, 2025). However, nearly all prior longitudinal studies of self-esteem and aggression used the traditional cross-lagged panel model, which does not provide control for stable confounding influences. The present study used both the RI-CLPM and DPM.
Second, most prior longitudinal research on self-esteem and aggression used self-report measures of both constructs, raising concerns about the confounding influence of shared-method variance (Podsakoff et al., 2012). Controlling for self-report biases is particularly important when assessing highly evaluative constructs such as aggression. To address this issue, we used data from the California Families Project (CFP), which includes self-reports and informant reports of aggression, allowing us to test whether the effects hold for both assessment methods. If we find that low self-esteem leads to informant-reported aggression, the effect cannot be caused by shared-method variance.
Third, prior longitudinal research tested only for linear effects of self-esteem on aggression. However, based on the “dark side of high self-esteem” hypothesis, it is possible that very high, as well as low, levels of self-esteem lead to aggression. In other words, self-esteem might have a curvilinear effect on aggression, with the lowest levels of aggression observed for individuals in the middle of the distribution. Given that prior longitudinal research did not test for curvilinear effects (a cross-sectional study did not find a U-shaped effect; Webster, 2007), it is unknown whether the prospective effect of self-esteem on aggression is linear or curvilinear.
Fourth, it is important to determine whether the effect of self-esteem on aggression is altered when narcissism is controlled for. Self-esteem and narcissism are conceptually related but distinct constructs, which correlate around .30 to .40 (Ackerman et al., 2011; Hyatt et al., 2018; Orth et al., 2016). Although both involve positive self-evaluations, self-esteem is theoretically based on authentic feelings of self-worth, whereas narcissism is rooted in grandiose, inflated self-perceptions (Lawson & Robins, 2021; Orth et al., 2016; Paulhus et al., 2004). Given that narcissism is positively associated with aggression (Hyatt et al., 2018), any observed effects of high self-esteem on aggression could be caused by narcissistic self-aggrandizement, which may contaminate measures of self-esteem, rather than by genuine self-regard, which is theoretically the core of healthy self-esteem. In other words, the dark side of high self-esteem might be a misnomer, and concerns about high self-esteem should actually be concerns about narcissism. By comparing the self-esteem effects with and without controlling for narcissism, we can test whether the presumed dark side of high self-esteem reflects a measurement confound with narcissism. Moreover, if low rather than high self-esteem leads to aggression, then narcissism could mask (when not controlled) the low self-esteem effect, corresponding to a statistical suppressor situation (Paulhus et al., 2004). In fact, when narcissism has been controlled in cross-sectional studies (Donnellan et al., 2005; Paulhus et al., 2004), low self-esteem has even stronger associations with aggression. The present study will test this suppression effect longitudinally by comparing the low self-esteem effects with and without controlling for narcissism.
In summary, to increase the validity of our conclusions, we (a) employed statistical models that control for unmeasured time-invariant confounders; (b) used self-reports and informant reports of aggression to test whether any self-esteem effects hold when the influence of shared-method variance can be ruled out; (c) tested for curvilinear self-esteem effects; (d) examined the unique effects of self-esteem when controlling for narcissism; and (e) used data from a sample of Mexican-origin individuals, a population that is understudied in psychological research.
We addressed the following research questions:
What is the effect of self-esteem on aggression? We predicted that low self-esteem prospectively predicts aggression.
Is the self-esteem effect on aggression confounded by shared-method variance? We predicted that the self-esteem effect holds using informant reports of aggression.
Is the self-esteem effect on aggression curvilinear? We predicted that high self-esteem does not become maladaptive at very high levels.
Is the self-esteem effect on aggression confounded by narcissism? We predicted that the effect holds, or becomes even larger, when we control for narcissism. Also, we predicted that narcissism is associated with higher levels of aggression, and this effect holds, or becomes larger, when we control for self-esteem. Thus, we expect the analyses to confirm that high self-esteem is adaptive and narcissism is maladaptive.
Exploratory question: Does perpetrating aggression prospectively predict lower self-esteem in the perpetrator? Evidence that aggression leads to lower self-esteem would be important for understanding the development of self-esteem in children, adolescents, and adults.
Exploratory question: Are the associations between self-esteem and aggression moderated by gender?
Research Transparency Statement
General disclosures
Study disclosures
Method
Participants and procedures
The CFP is an ongoing longitudinal study of 674 Mexican-origin families, conducted at the University of California, Davis (https://www.californiafamiliesproject.org). At the time of preregistration, the CFP included 13 waves. The first 10 assessments were conducted annually, and subsequent assessments were conducted approximately every 2 years. At Wave 1, the target child from each family was in 5th grade (mean age = 10.9 years, SD = 0.50; 50% female). Measures of self-esteem and aggression are available for the target children, mothers, and fathers. Thus, we examined the link between the constructs for the target children (e.g., does child self-esteem prospectively predict child aggression), and for mothers and fathers (e.g., does maternal self-esteem prospectively predict maternal aggression; does paternal self-esteem prospectively predict paternal aggression). For children and mothers, the sample size is 674 (i.e., number of families). For fathers, the sample size is 437 because many families were single-parent households or because the father chose not to participate in the study.
Measures
Selection of measures
Measures of self-esteem, aggression, and narcissism are available only at specific waves in the CFP and the available measures differ for children, mothers, and fathers. Tables 1 to 3 provide information about the four sets of measures used to address our research questions, including the number of items on each scale and the number of waves of data available. All analyses were conducted using these sets of measures and assessments. We selected measures for which there were at least three waves of data, the minimum required to estimate the RI-CLPM and DPM. In addition, assessments were required to be equally spaced across time so we could use equality constraints on the prospective effects over time.
Measures (Set 1): Self-Esteem and Aggression in Children
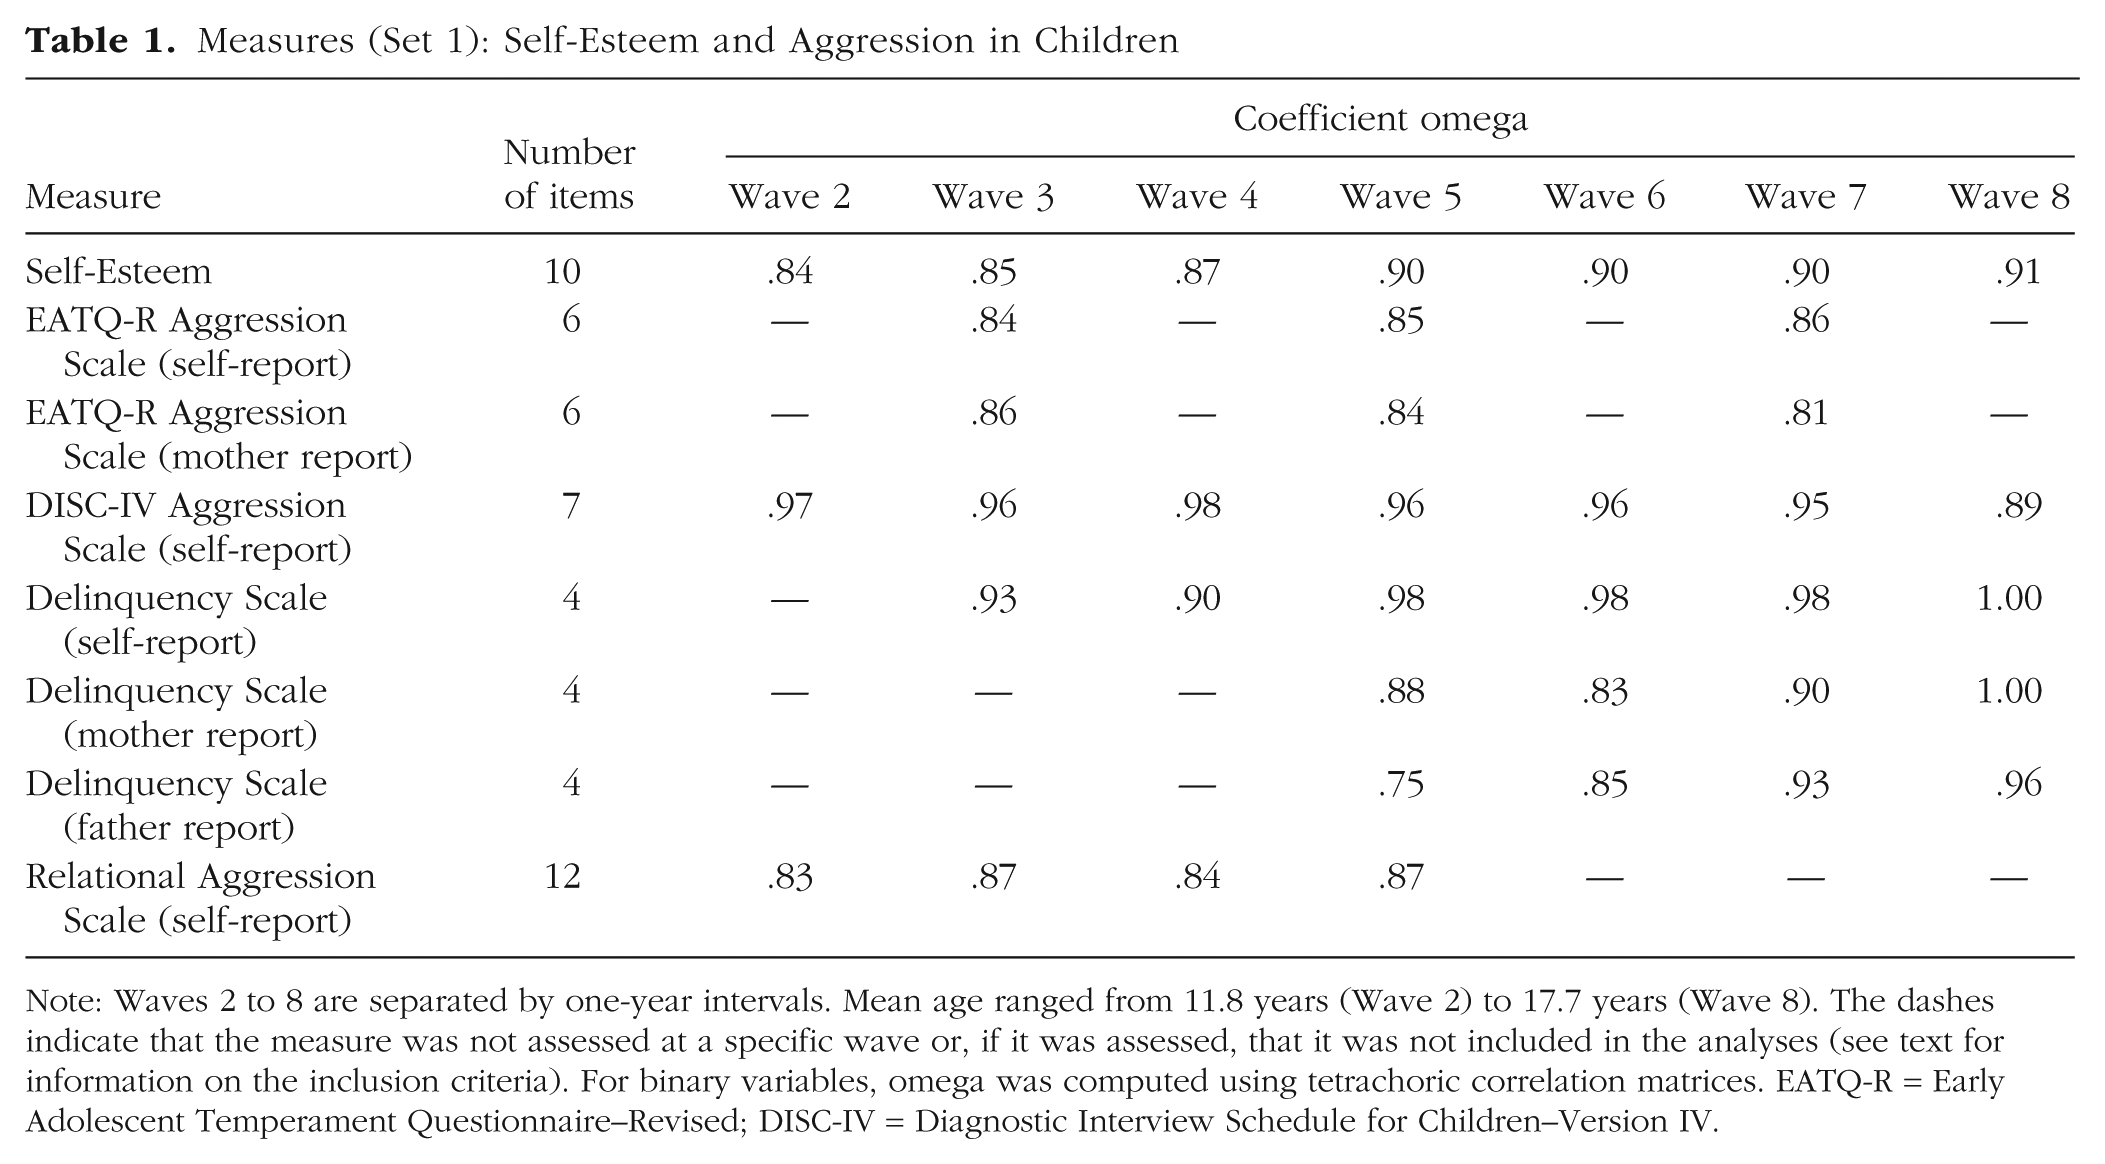
Note: Waves 2 to 8 are separated by one-year intervals. Mean age ranged from 11.8 years (Wave 2) to 17.7 years (Wave 8). The dashes indicate that the measure was not assessed at a specific wave or, if it was assessed, that it was not included in the analyses (see text for information on the inclusion criteria). For binary variables, omega was computed using tetrachoric correlation matrices. EATQ-R = Early Adolescent Temperament Questionnaire–Revised; DISC-IV = Diagnostic Interview Schedule for Children–Version IV.
Measures (Set 2): Self-Esteem and Aggression in Children, Controlling for Narcissism
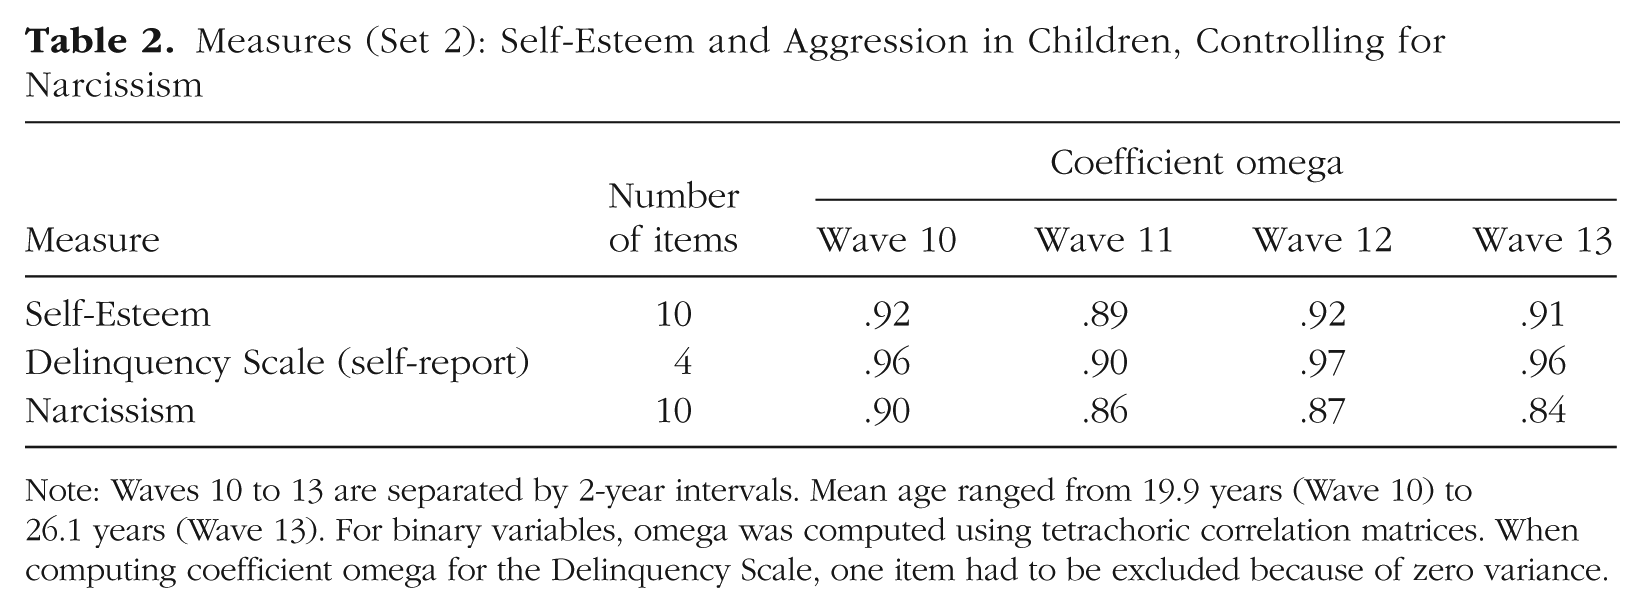
Note: Waves 10 to 13 are separated by 2-year intervals. Mean age ranged from 19.9 years (Wave 10) to 26.1 years (Wave 13). For binary variables, omega was computed using tetrachoric correlation matrices. When computing coefficient omega for the Delinquency Scale, one item had to be excluded because of zero variance.
Measures (Sets 3 and 4): Self-Esteem and Aggression in Mothers and Fathers
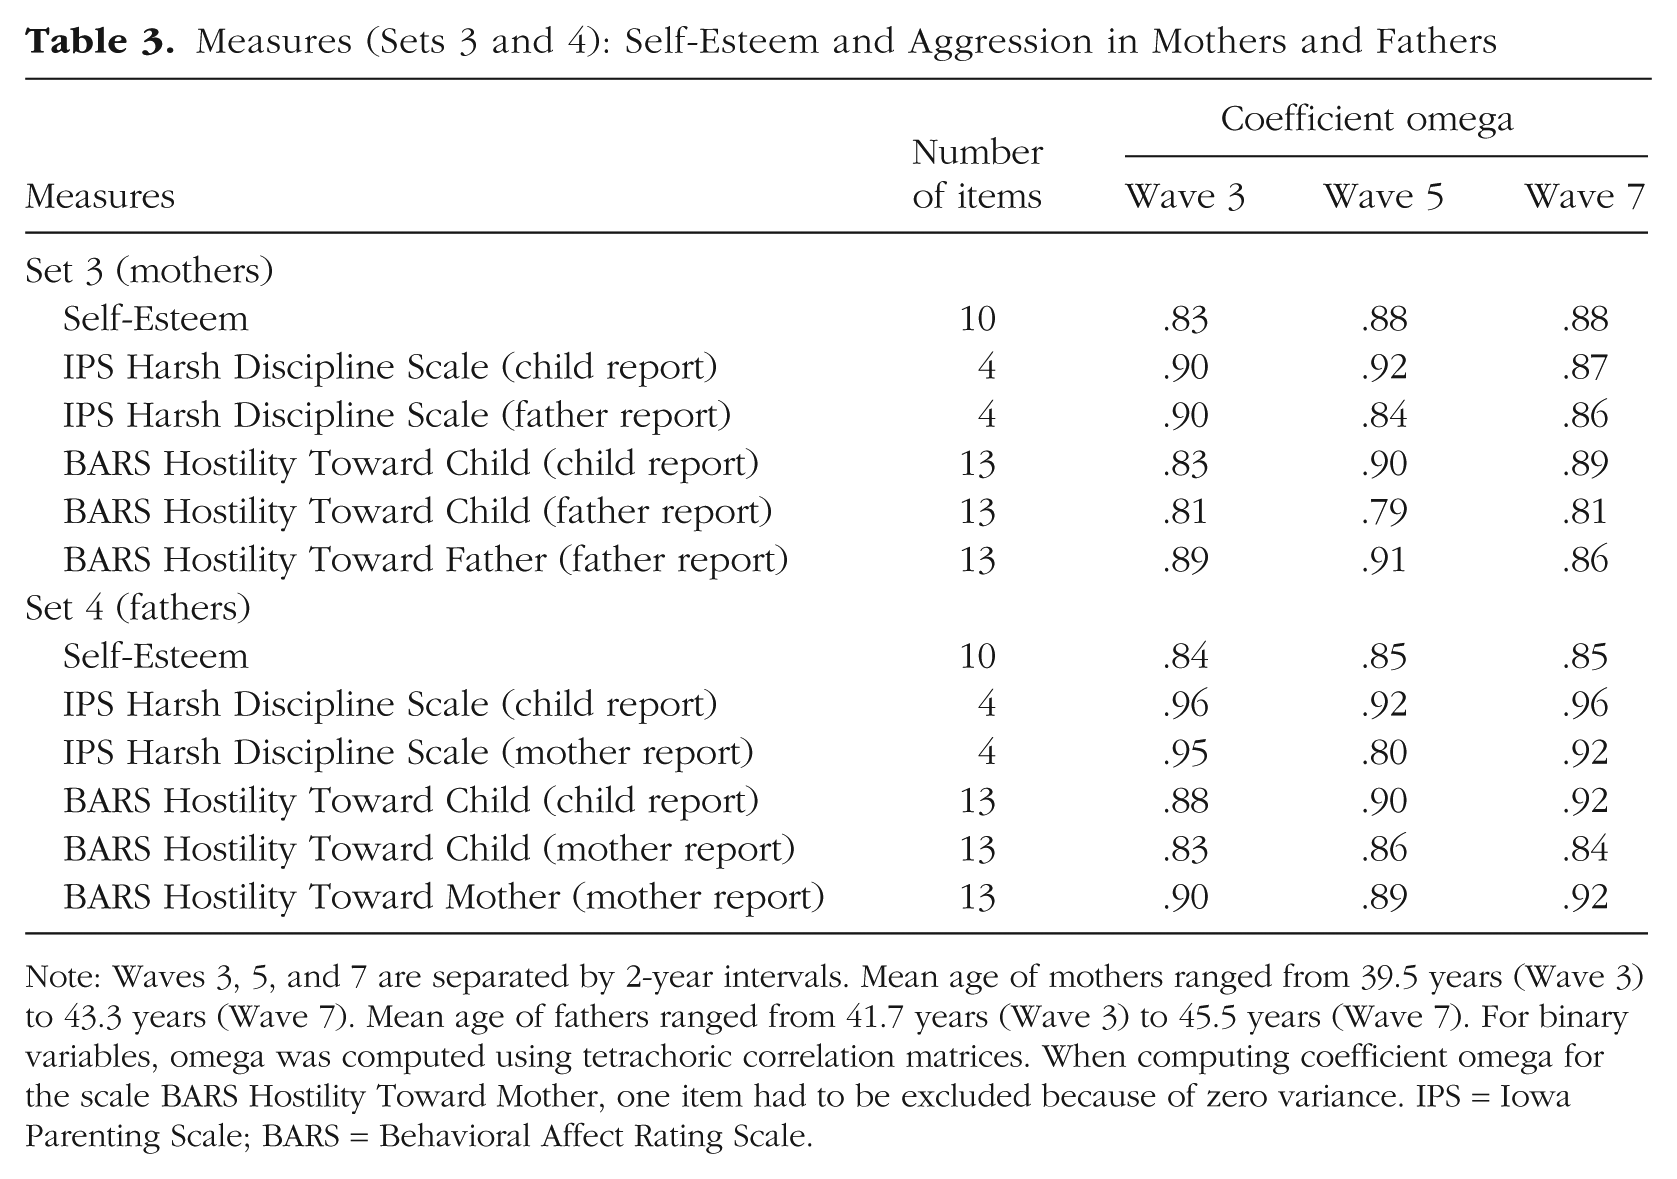
Note: Waves 3, 5, and 7 are separated by 2-year intervals. Mean age of mothers ranged from 39.5 years (Wave 3) to 43.3 years (Wave 7). Mean age of fathers ranged from 41.7 years (Wave 3) to 45.5 years (Wave 7). For binary variables, omega was computed using tetrachoric correlation matrices. When computing coefficient omega for the scale BARS Hostility Toward Mother, one item had to be excluded because of zero variance. IPS = Iowa Parenting Scale; BARS = Behavioral Affect Rating Scale.
The first set of measures focused on self-esteem and aggression in the target children (Table 1). For some measures, a relatively large number of assessments were available, which increases the precision of the model estimates. The second set of measures also focused on the target children but covered the waves when narcissism was assessed, along with self-esteem and aggression (Table 2). Although Set 2, like Set 1, included the self-report version of the Delinquency Scale, they were examined in separate models because the assessments in Set 2 occurred at 2-year intervals (vs. 1-year intervals in Set 1). The third and fourth sets of measures focused on self-esteem and aggression in mothers and fathers (Table 3). Tables 1 to 3 also show reliability estimates of the measures used, as indicated by coefficient omega.
At Waves 2 to 8, the target children were approximately age 12 to 18 years, and at Waves 10 to 13, approximately age 20 to 26 years (note that Waves 10 to 13 are separated by approximately 2-year intervals). Thus, the analyses with the child data provide information about self-esteem and aggression in adolescence (first set of measures) and early adulthood (second set of measures). Nevertheless, for reasons of clarity, when describing the measures, we use the term “children” to clearly distinguish between the family roles of child versus parent (mothers and fathers).
Self-esteem
All participants (child, mother, father) completed the 10-item Rosenberg Self-Esteem Scale (RSE; Rosenberg, 1965). The RSE is the most frequently used and well-validated measure of self-esteem (Donnellan et al., 2015).
Aggression in children
The CFP includes several measures of aggression. First is the 6-item Aggression Scale from the Early Adolescent Temperament Questionnaire–Revised (EATQ-R; Ellis & Rothbart, 2001). This scale assesses aggressive and hostile actions, including physical violence, direct and indirect verbal aggression, and hostile reactivity. The CFP includes reports by children (i.e., self-reports) and mothers (i.e., informant reports). A second measure of aggression is the Diagnostic Interview Schedule for Children (DISC-IV; the Conduct Disorder symptoms). The DISC-IV is a structured diagnostic interview developed by the National Institute of Mental Health (Shaffer et al., 2000). For the analyses, we used the symptom count of the 7-item aggression subscale across the past year (i.e., the child bullies/threatens, initiates physical fights, used a weapon, was physically cruel to people, was physically cruel to animals, stole something with confrontation of victim, forced someone into sexual activity). The third measure is the Delinquency Scale from the National Longitudinal Study of Adolescent Health (for a study with the CFP data, see Wetzel et al., 2021). The scale assesses the frequency of behaviors in the past 12 months. The present research uses a 4-item subscale consisting of the aggression items included in the scale (i.e., the child hurt someone badly enough to need bandages or care from a doctor, got into a serious physical fight, used or threatened to use a weapon to get something from someone, took part in a fight where a group of friends was against another group). The CFP includes reports by children (i.e., self-reports), mothers (i.e., informant reports), and fathers (i.e., informant reports). Last is the 12-item Relational Aggression Scale (Aizpitarte et al., 2019). The scale assesses nonphysical behaviors that are intended to inflict social harm on victims. The CFP includes reports by children (i.e., self-reports).
Aggression in parents
The following measures of aggression were available. First is the 4-item Harsh Discipline Scale from the Iowa Parenting Scale (IPS; developed for the Iowa Youth and Families Project, Conger et al., 2011). The scale assesses verbal and physical aggression toward the child. The CFP includes reports by children (i.e., informant reports) and spouses (i.e., informant reports). Also included was the 13-item Hostility Scale from the Behavioral Affect Rating Scale (BARS; developed for the Iowa Youth and Families Project, Conger et al., 2011), with regard to the parent’s hostility toward the child. The scale assesses verbal and physical aggression. The CFP includes reports by children (i.e., informant reports) and spouses (i.e., informant reports). Third was the 13-item Hostility Scale from the BARS, with regard to the parents’ hostility toward each other (i.e., the mother’s hostility toward the father, and vice versa). The CFP includes reports by spouses (i.e., informant reports).
Narcissism
For children, the CFP includes the Narcissistic Personality Questionnaire for Children–Revised (NPQC-R; Ang & Raine, 2009), a self-report measure developed for children and adolescents. The scale assesses two forms of narcissistic grandiosity (i.e., superiority and exploitativeness), thereby capturing aspects of agentic and antagonistic narcissism as conceptualized in the three-factor model of narcissism (Back & Morf, 2018; Crowe et al., 2019). The full NPQC-R includes 12 items, but two items were dropped from the CFP after Wave 10; the present research uses the remaining 10 items. For mothers and fathers, no measure of narcissism was available at the waves at which measures of aggression were available. Thus, analyses with narcissism could only be conducted for the children.
Statistical analyses
The analyses of structural equation models were conducted using Mplus (Version 8.11; L. K. Muthén & Muthén, 2017). To deal with missing data, we used full-information estimation, which produces less biased and more reliable results compared with conventional methods of dealing with missing data, such as listwise deletion (Schafer & Graham, 2002). Fit was assessed by the comparative fit index (CFI) and the root-mean-square error of approximation (RMSEA). Hu and Bentler (1999) suggest that good fit is indicated by values greater than or equal to .95 for CFI, and less than or equal to .06 for RMSEA. Comparisons of nested models were made with RMSEAD, which is the RMSEA associated with the difference test to compare models (Savalei et al., 2024). RMSEAD can be interpreted similarly to the RMSEA of a single model. Thus, if RMSEAD is small, then this indicates that the additional constraints included in the more parsimonious model (i.e., the model with more degrees of freedom) lead only to a small difference in fit and that the more parsimonious model should be selected. Given that little experience with RMSEAD is available in the field as yet, we used the more relaxed cutoff value of RMSEAD = .08 suggested by Savalei et al. (2024). We used an alpha level of .05 for all tests of statistical significance, with the following exception: For the tests of curvilinear effects, we adjusted the alpha level with the Bonferroni method (given the large number of tests, and given that we hypothesized that the curvilinear effects are zero).
To assess the reliability of the measures, we used coefficient omega computed with the psych package (Revelle, 2025) using R (R Core Team, 2024). Whenever possible, we used multiple indicators to measure the constructs as latent variables, which allowed us to control for measurement error and systematic bias included in the measures. For these measures, we used item parcels as indicators, with the balancing technique (Little et al., 2013). In models with multiple indicators, the residuals of identical indicators were correlated across waves, to control for additional bias due to indicator-specific variance. In preliminary analyses, we tested for metric measurement invariance across waves (Schmitt & Kuljanin, 2008). Tests of prospective effects between constructs are valid only if the assumption of metric measurement invariance is justified (Schmitt & Kuljanin, 2008). Partial measurement invariance (i.e., for a subset of the indicators) is considered sufficient to ensure valid analyses.
In the main analyses, each measure of aggression was examined in separate models. For models with latent variables measured by multiple indicators, we used maximum likelihood estimation. Three measures, which capture particularly severe forms of aggression (e.g., weapon use and physical fights), could not be examined as latent variables using multiple indicators but needed to be examined as binary variables (for further information, see the description of deviations from the preregistration in Table S1 in the Supplemental Material). For these measures, we used Bayes estimation and the model specifications described by B. Muthén et al. (2024). A limitation of the framework provided by B. Muthén et al. (2024) is that it is currently available only for the RI-CLPM but not the DPM. Another limitation is that curvilinear effects cannot be tested (see Table S1). Nevertheless, to appropriately account for the binary nature of the variables, we decided to use Muthén et al.’s framework.
Another deviation was that we could not model latent variables that combined self- and informant reports of aggression because of low convergence across reports. Specifically, the average interrater correlation was .25 across measures (see Table S2 in the Supplemental Material). However, self- and informant reports of aggression—and related constructs, such as externalizing problems—often correlate at about .25 to .30 (De Los Reyes et al., 2015; Henry & The Metropolitan Area Child Study Research Group, 2006). Thus, the interrater agreement observed here is similar to values reported in the literature. Moreover, although modest, it still provides at least some evidence of convergent validity across raters. Reliability estimates and tests of the measurement models were generally satisfactory, supporting the psychometric quality of the measures. In addition, because many measures relied on informant reports, it was still possible to control for shared-method variance in many of the present analyses (e.g., when using self-reported self-esteem and informant-reported aggression). Nevertheless, future research would benefit from multi-informant assessments of aggression with stronger convergent validity.
For measures that were examined as latent variables, we estimated both the DPM and the RI-CLPM. Figures 1 and 2 show generic illustrations of the models. In the DPM, the wave-specific construct factors are controlled for stable between-person variance by including time-invariant latent factors (denoted as η). The autoregressive and cross-lagged effects are modeled between the wave-specific constructs. In contrast, in the RI-CLPM the wave-specific construct factors are residualized by partialing the stable between-person variance via random intercepts. The autoregressive and cross-lagged effects are then modeled between the residualized wave-specific factors. The RI-CLPM is based on more restrictive assumptions (about stationarity and equilibrium) than the DPM, as reflected in the treatment of the first measurement occasion. When these assumptions do not hold—which may be the case, for example, when studying youth samples—the RI-CLPM may lead to biased estimates of the effects, in contrast to the DPM (Andersen, 2022). However, when the assumptions are justified, the RI-CLPM provides more precise estimates, because of greater parsimony. Therefore, we tested both the DPM and RI-CLPM and used RMSEAD to evaluate which model provided better fit to the data and should be interpreted. For measures that were examined as binary variables, we estimated only the RI-CLPM.
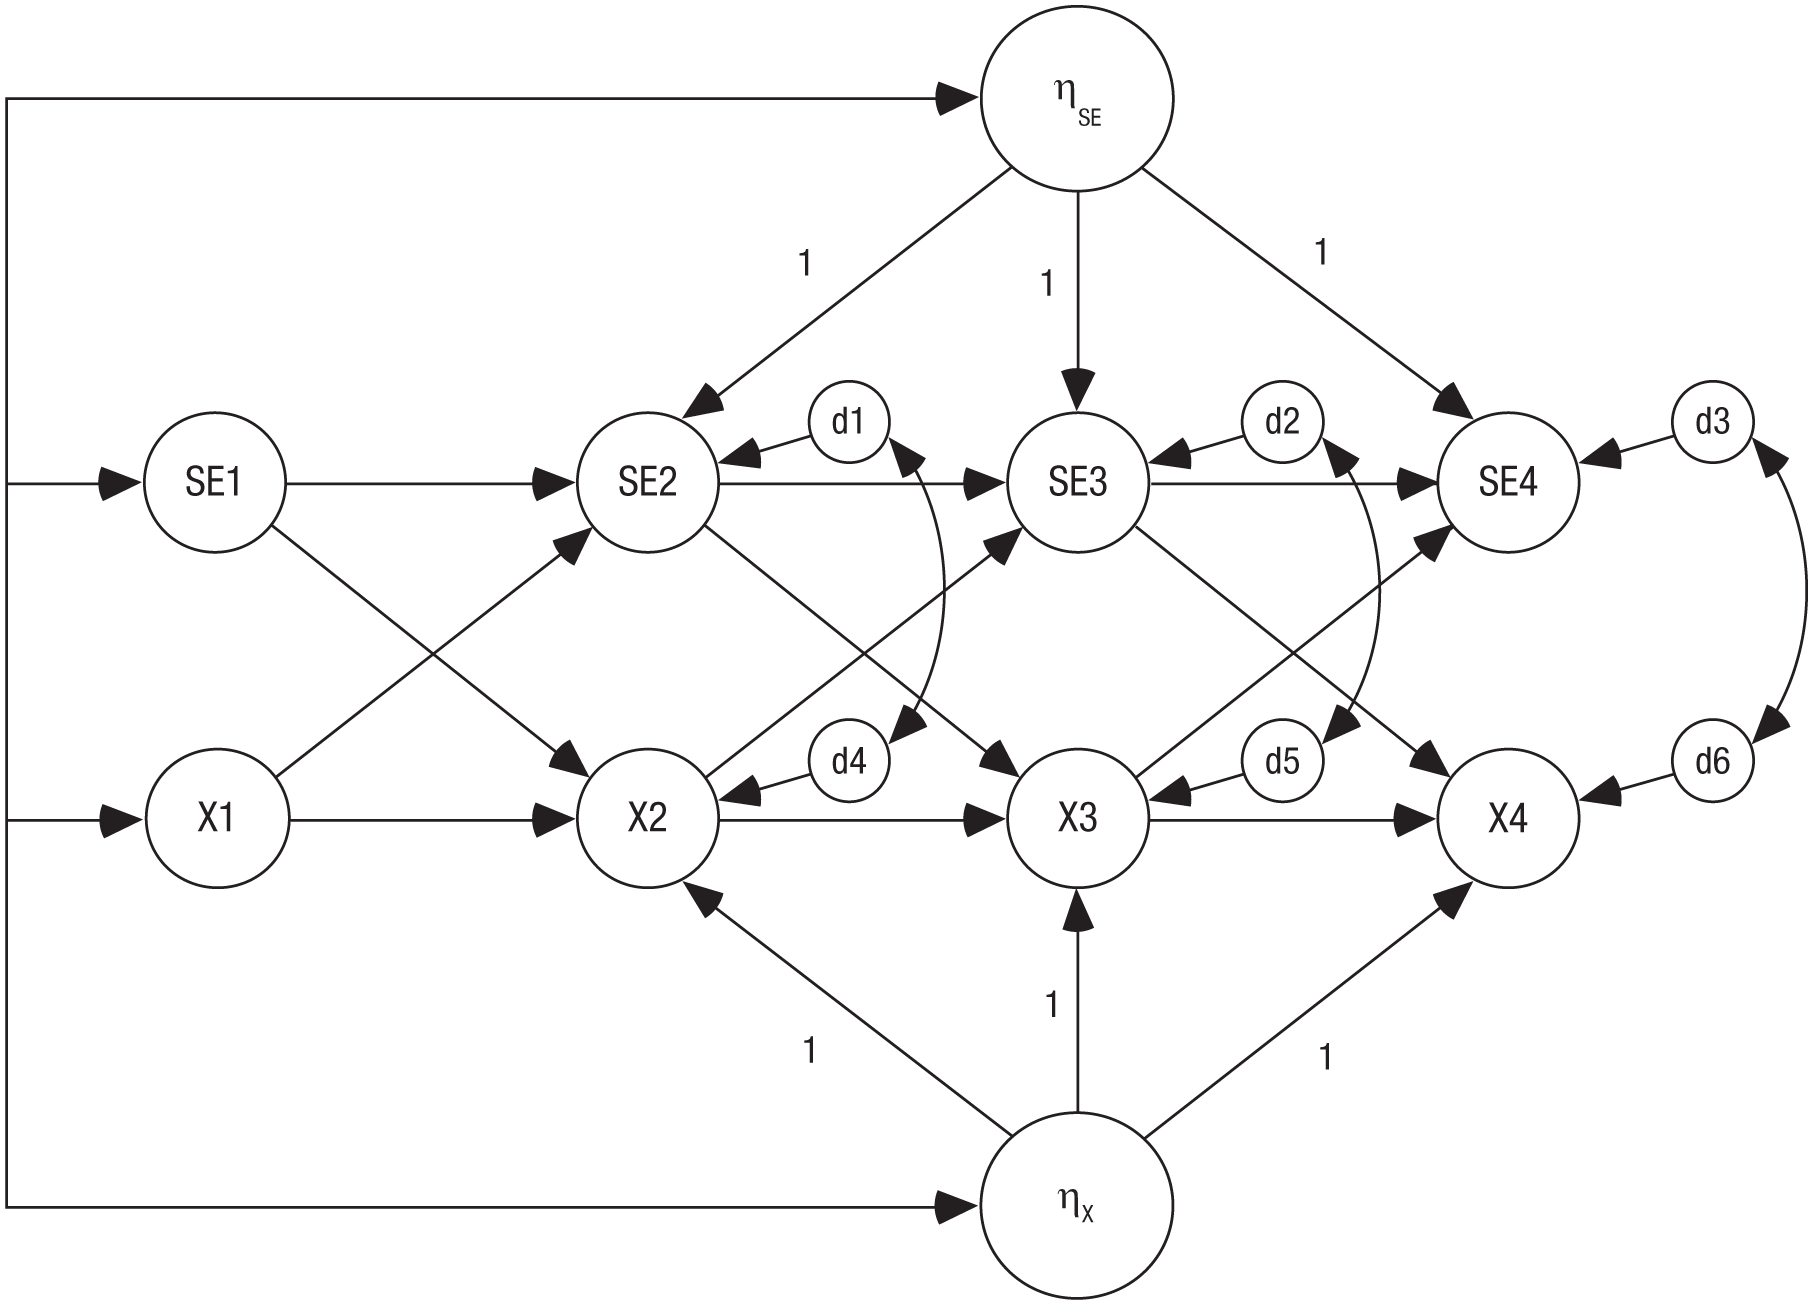
Dynamic panel model (DPM). The figure illustrates the DPM used to examine the relation between self-esteem (SE) and aggression (X), in the case of four assessments. The wave-specific construct factors are denoted as SE1, SE2 (etc.), and X1, X2, (etc.). The time-invariant latent factors are denoted as ηSE and ηX, and the unexplained variances (i.e., disturbances) as d1 to d6. In the DPM, the autoregressive and cross-lagged paths are modeled between the wave-specific constructs. Only latent constructs are shown (i.e., observed variables are omitted).
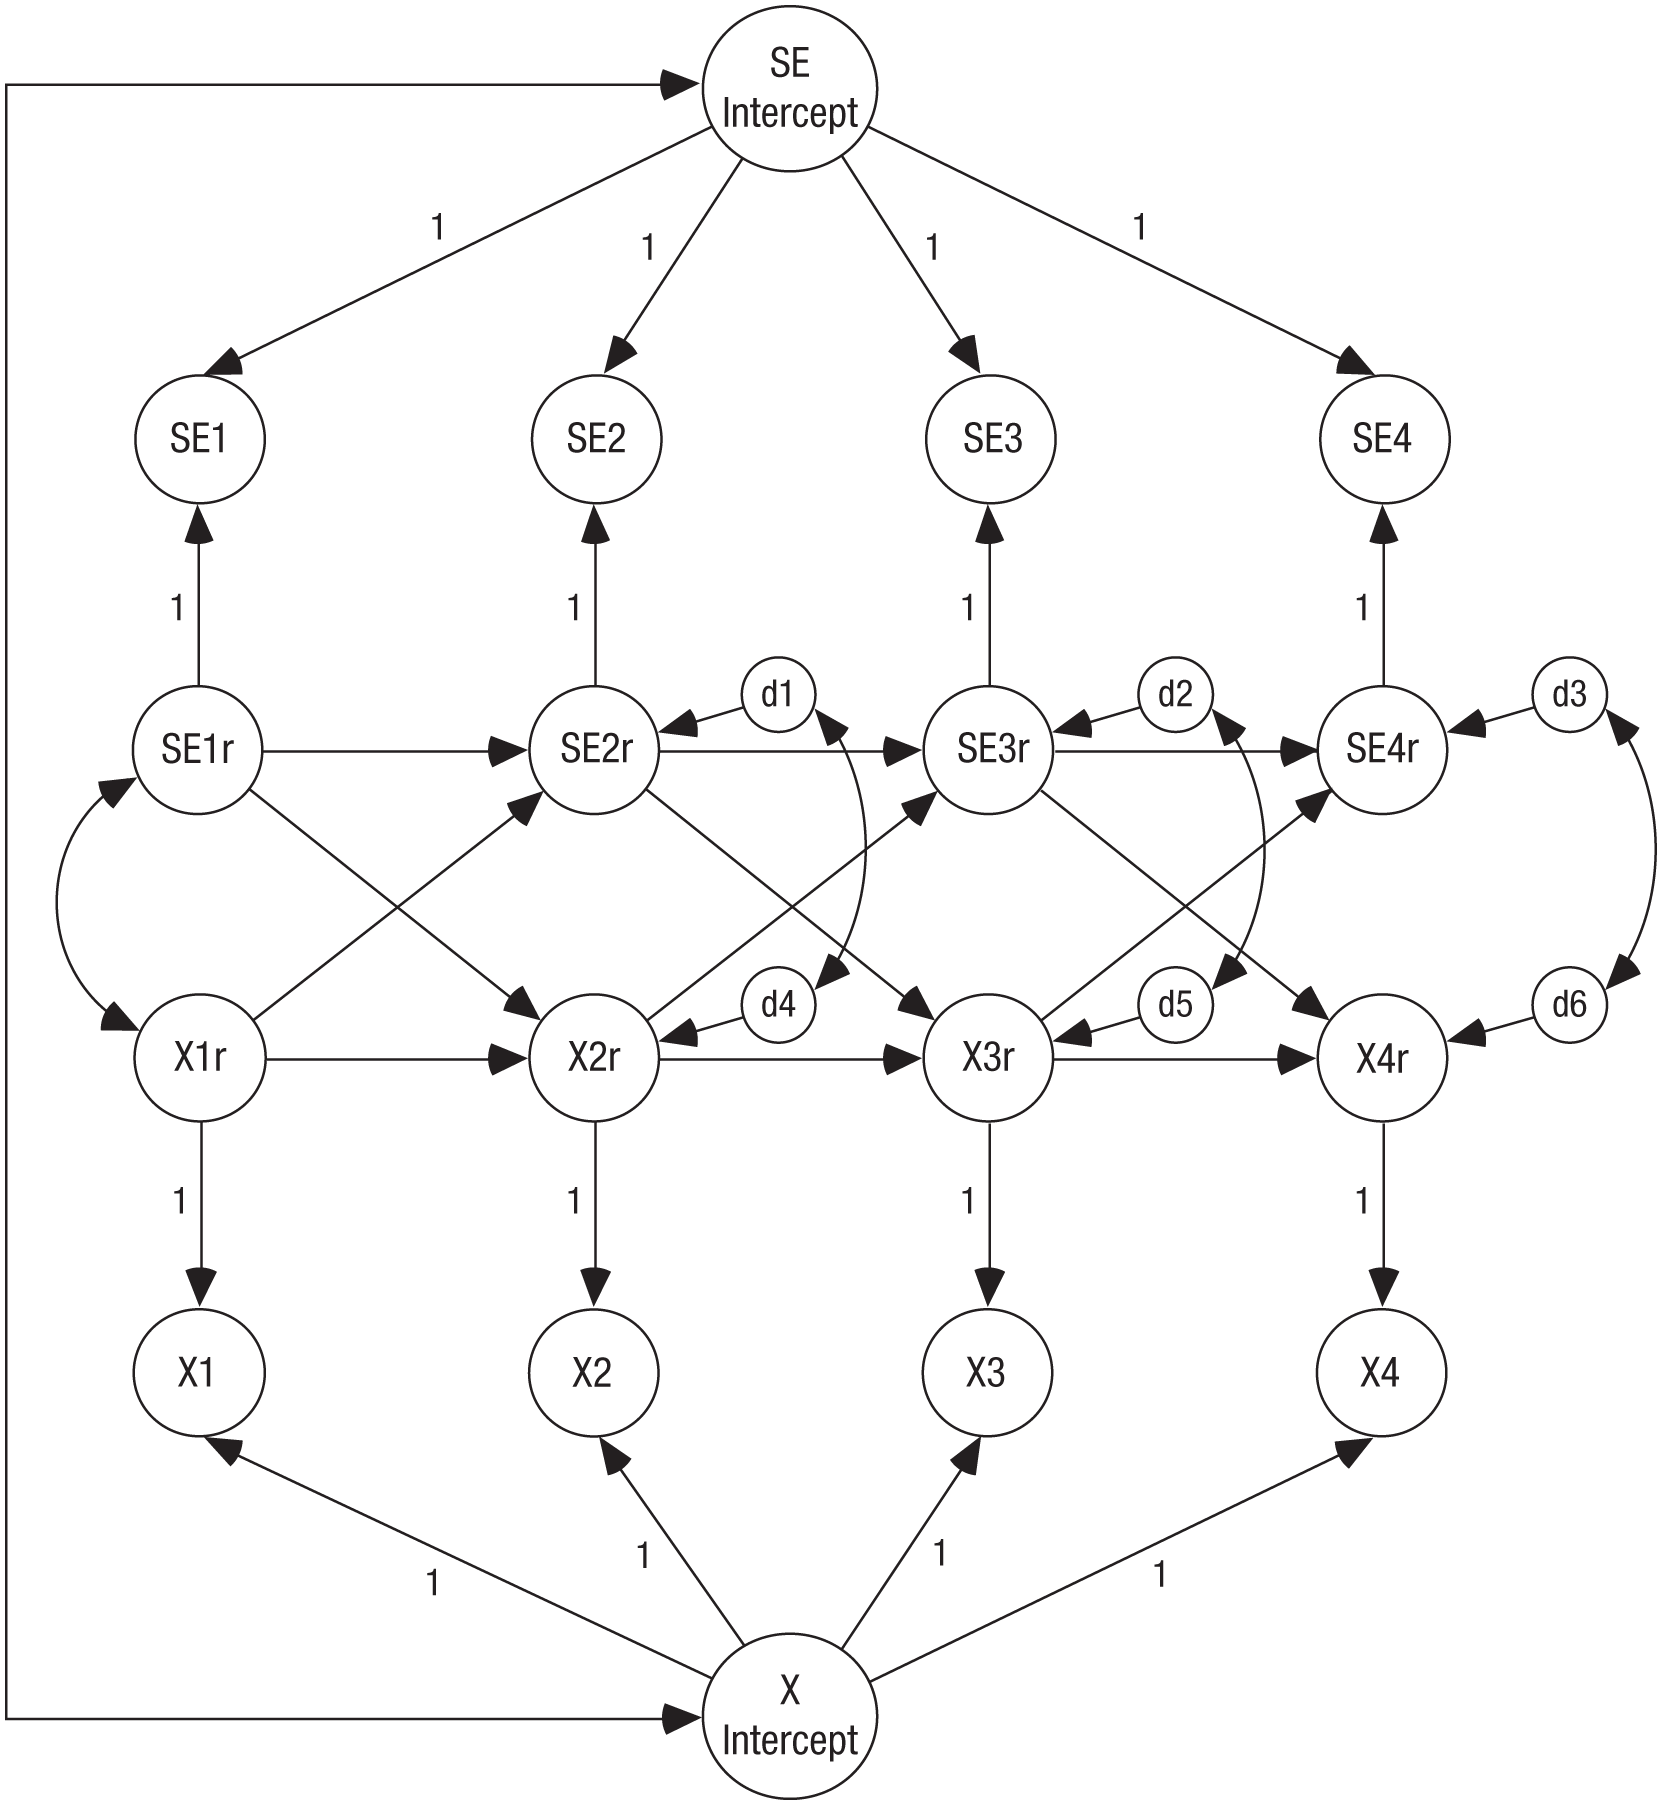
Random-intercept cross-lagged panel model (RI-CLPM). The figure illustrates the RI-CLPM used to examine the relation between self-esteem (SE) and aggression (X), in the case of four assessments. The wave-specific construct factors are denoted as SE1, SE2 (etc.), and X1, X2, (etc.). Unexplained variances (i.e., disturbances) are denoted as d1 to d6. In the RI-CLPM, the autoregressive and cross-lagged paths are modeled between the residualized scores of the constructs (denoted as SE1r, SE2r, etc.). Only latent constructs are shown (i.e., observed variables are omitted).
Autoregressive and cross-lagged effects were constrained to be equal across time to increase the precision of estimates. We tested for curvilinear self-esteem effects by computing additional models in which the quadratic self-esteem effect was included over and above the linear effect (using the XWITH command in Mplus). The model that controlled for the effect of narcissism included three constructs measured over time (i.e., self-esteem, narcissism, and aggression). We tested whether the effects between self-esteem and aggression were moderated by gender by comparing multi-group models with, versus without, equality constraints across gender. For the parents, tests of gender differences in the effects were conducted by combining the data from mothers and fathers into a long-format data file, accounting for the nonindependence of data from mothers and fathers from the same family using the Cluster option in Mplus.
Results
Testing for measurement invariance
For most measures, full metric invariance held (note that measurement invariance could not be tested for measures that were examined as binary variables; see Table S1). More precisely, RMSEAD indicated that the metric-invariance constraints led only to a small difference in fit compared with configural invariance; this supports metric invariance (see Table S3). Consequently, full metric-invariance constraints were used in the analyses with these measures. For all other measures, partial metric invariance held. Thus, even if the RMSEAD values of the full metric invariance models exceeded .08, partial invariance was supported by RMSEAD when relaxing the invariance constraints for one of the items (for these measures, Table S3 in the Supplemental Material shows the fit of the models with partial invariance). Consequently, partial invariance constraints were used in the analyses with these measures, which is sufficient to ensure valid analyses. The overall fit of the measurement models was good, as indicated by CFI and RMSEA (Table S3).
Main analyses
Our first research question was whether there is a self-esteem effect on aggression. For aggression measures that could be examined as latent variables using multiple indicators, we examined both the DPM and RI-CLPM. The fit of the models was good (see Table S4). However, the DPM did not converge properly for four measures, and the RI-CLPM for one measure; in all cases, the convergence problems occurred because the latent-variable covariance matrix was not positive definite, which indicated negative variances of latent variables or correlations greater than 1 between latent variables. For measures for which both models converged, model comparison generally suggested that the RI-CLPM should be preferred, as indicated by RMSEAD values below .08. Thus, convergence patterns and information on model fit generally favored the RI-CLPM over the DPM.
Table 4 shows the key estimates from the models selected (i.e., favored by RMSEAD; for estimates from all models, see Table S5). Only two of the cross-lagged effects were significant. Specifically, when aggression was measured with the Relational Aggression Scale, children’s self-esteem showed a cross-lagged effect of −.13, 95% confidence interval (CI) = [−.243, −.024], on their aggression, consistent with the hypotheses. Moreover, fathers’ self-esteem had a significant effect on their aggression in one of the models, although with a positive sign. For aggression measures that were examined as binary variables, only the RI-CLPM could be examined, but not the DPM (see Table S1). All models converged properly. There were no significant self-esteem effects on aggression (Table 5). Still, it may be worth noting that two of the self-esteem effects were close to significance. In Set 1, self-esteem predicted aggression with −.09, 95% CI = [−.182, .005], DISC-IV Aggression Scale, and −.08, 95% CI = [−.173, .007], Delinquency Scale self-report, with p = .060 for both measures. Note that when using Bayes estimation, Mplus reports p values only for one-tailed tests, which were .030 for both measures; given that we used two-tailed tests in this research, we adjusted the p values accordingly. In sum, the present analyses showed little evidence of systematic self-esteem effects on aggression.
Cross-Lagged and Autoregressive Effects of Self-Esteem (SE) and Aggression (X), for Measures Examined as Latent Variables
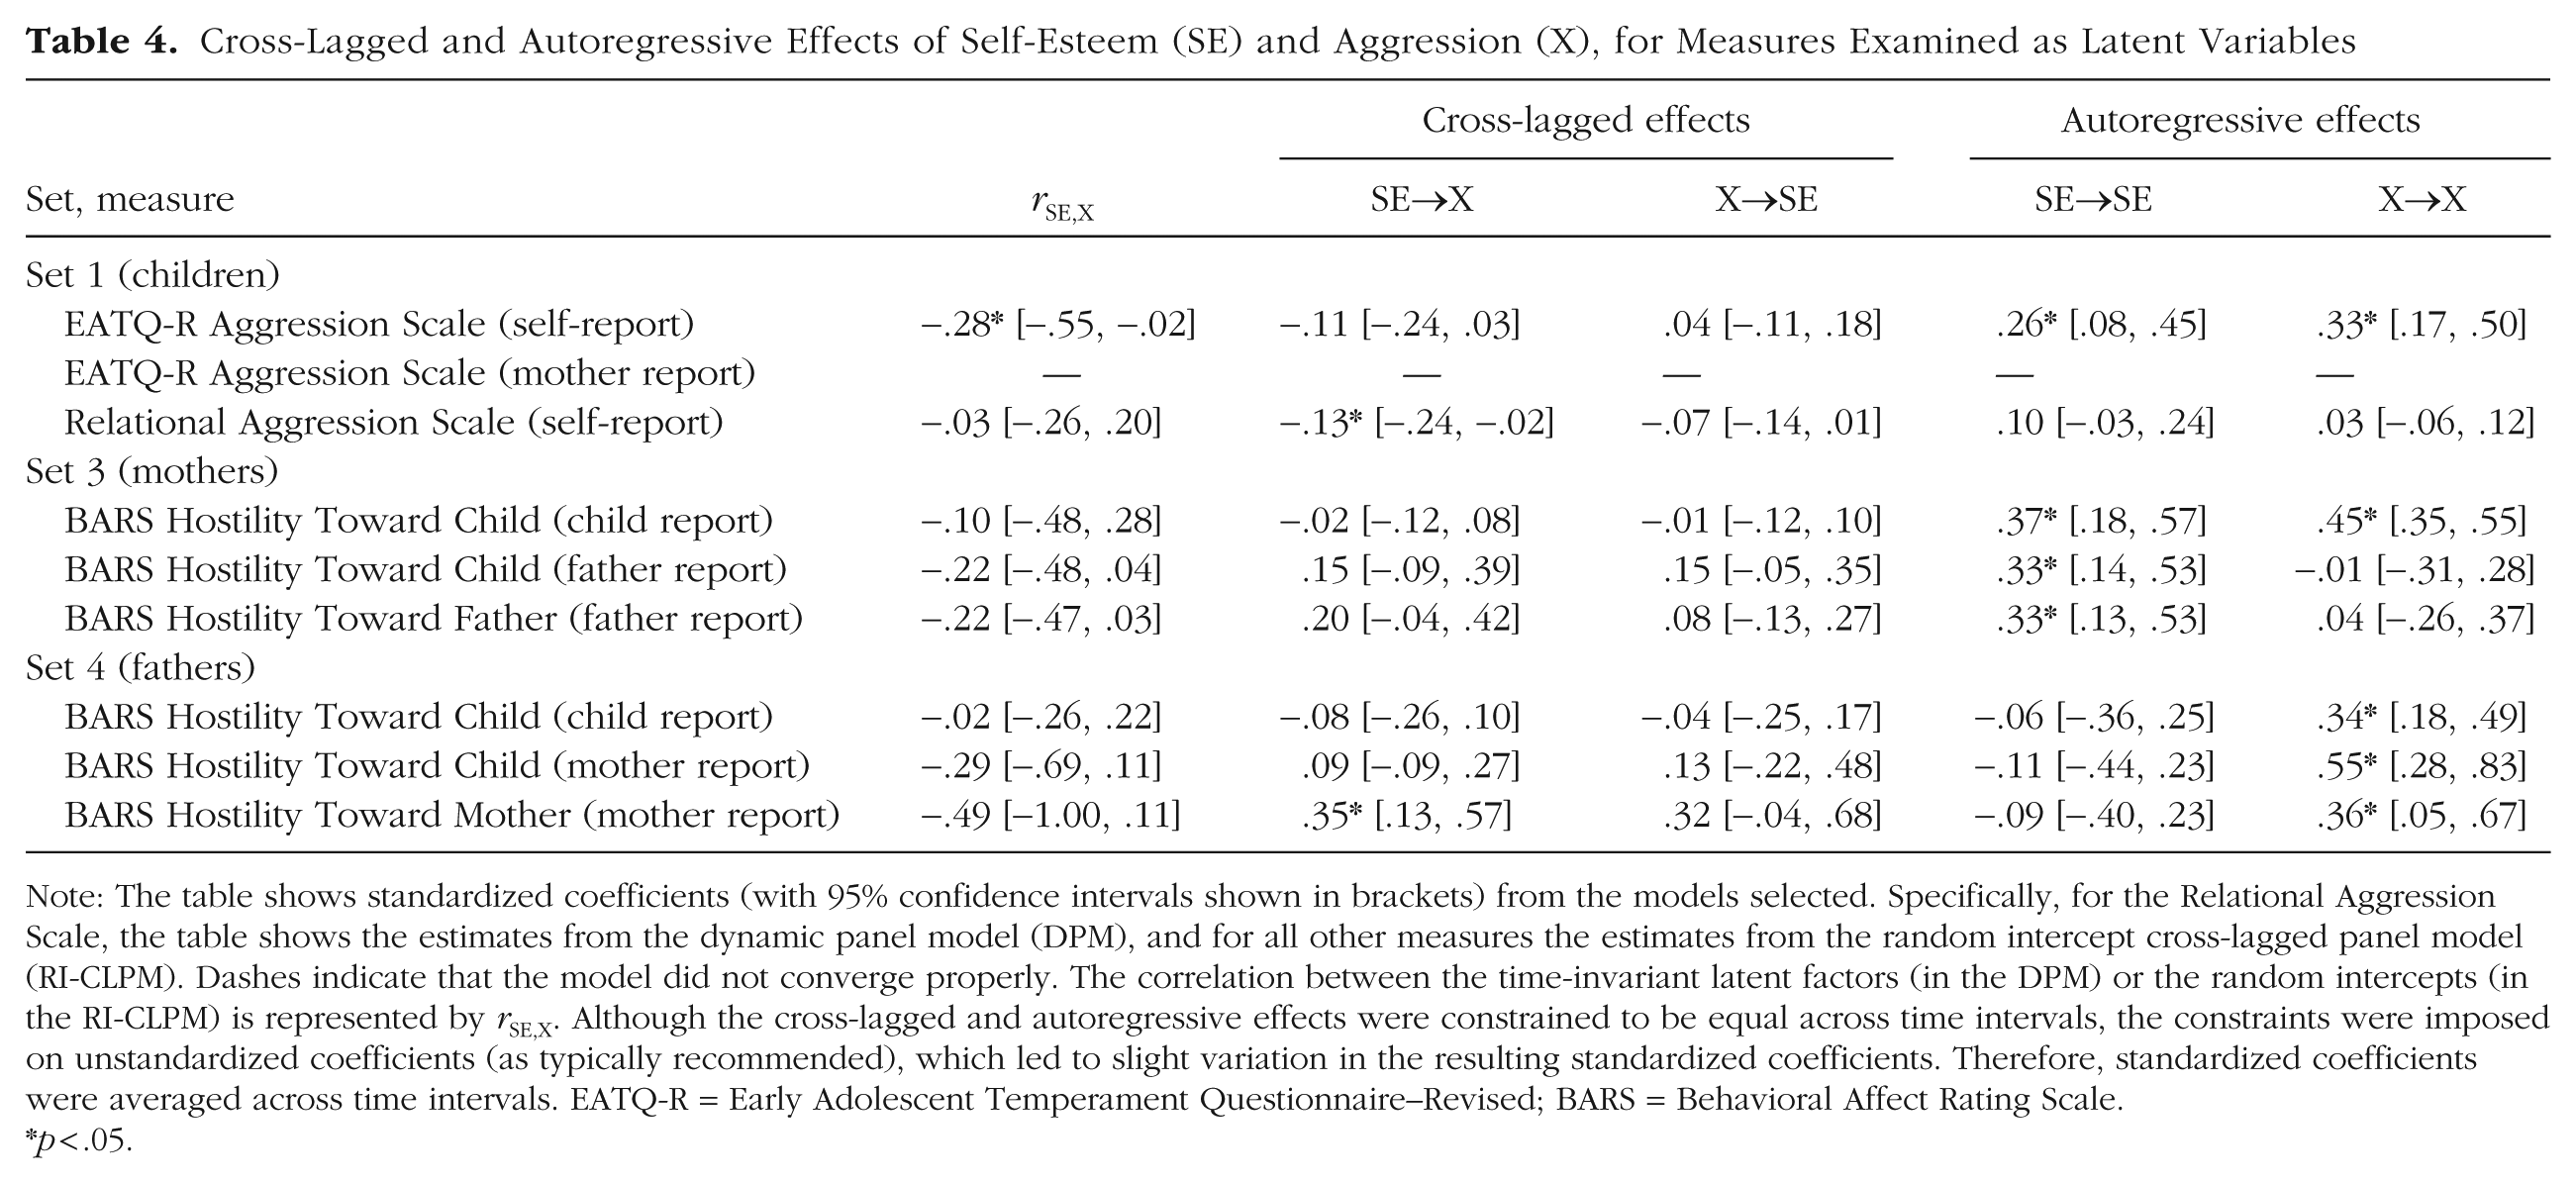
Note: The table shows standardized coefficients (with 95% confidence intervals shown in brackets) from the models selected. Specifically, for the Relational Aggression Scale, the table shows the estimates from the dynamic panel model (DPM), and for all other measures the estimates from the random intercept cross-lagged panel model (RI-CLPM). Dashes indicate that the model did not converge properly. The correlation between the time-invariant latent factors (in the DPM) or the random intercepts (in the RI-CLPM) is represented by rSE,X. Although the cross-lagged and autoregressive effects were constrained to be equal across time intervals, the constraints were imposed on unstandardized coefficients (as typically recommended), which led to slight variation in the resulting standardized coefficients. Therefore, standardized coefficients were averaged across time intervals. EATQ-R = Early Adolescent Temperament Questionnaire–Revised; BARS = Behavioral Affect Rating Scale.
*p < .05.
Cross-Lagged and Autoregressive Effects of Self-Esteem (SE) and Aggression (X), for Measures Examined as Binary Variables
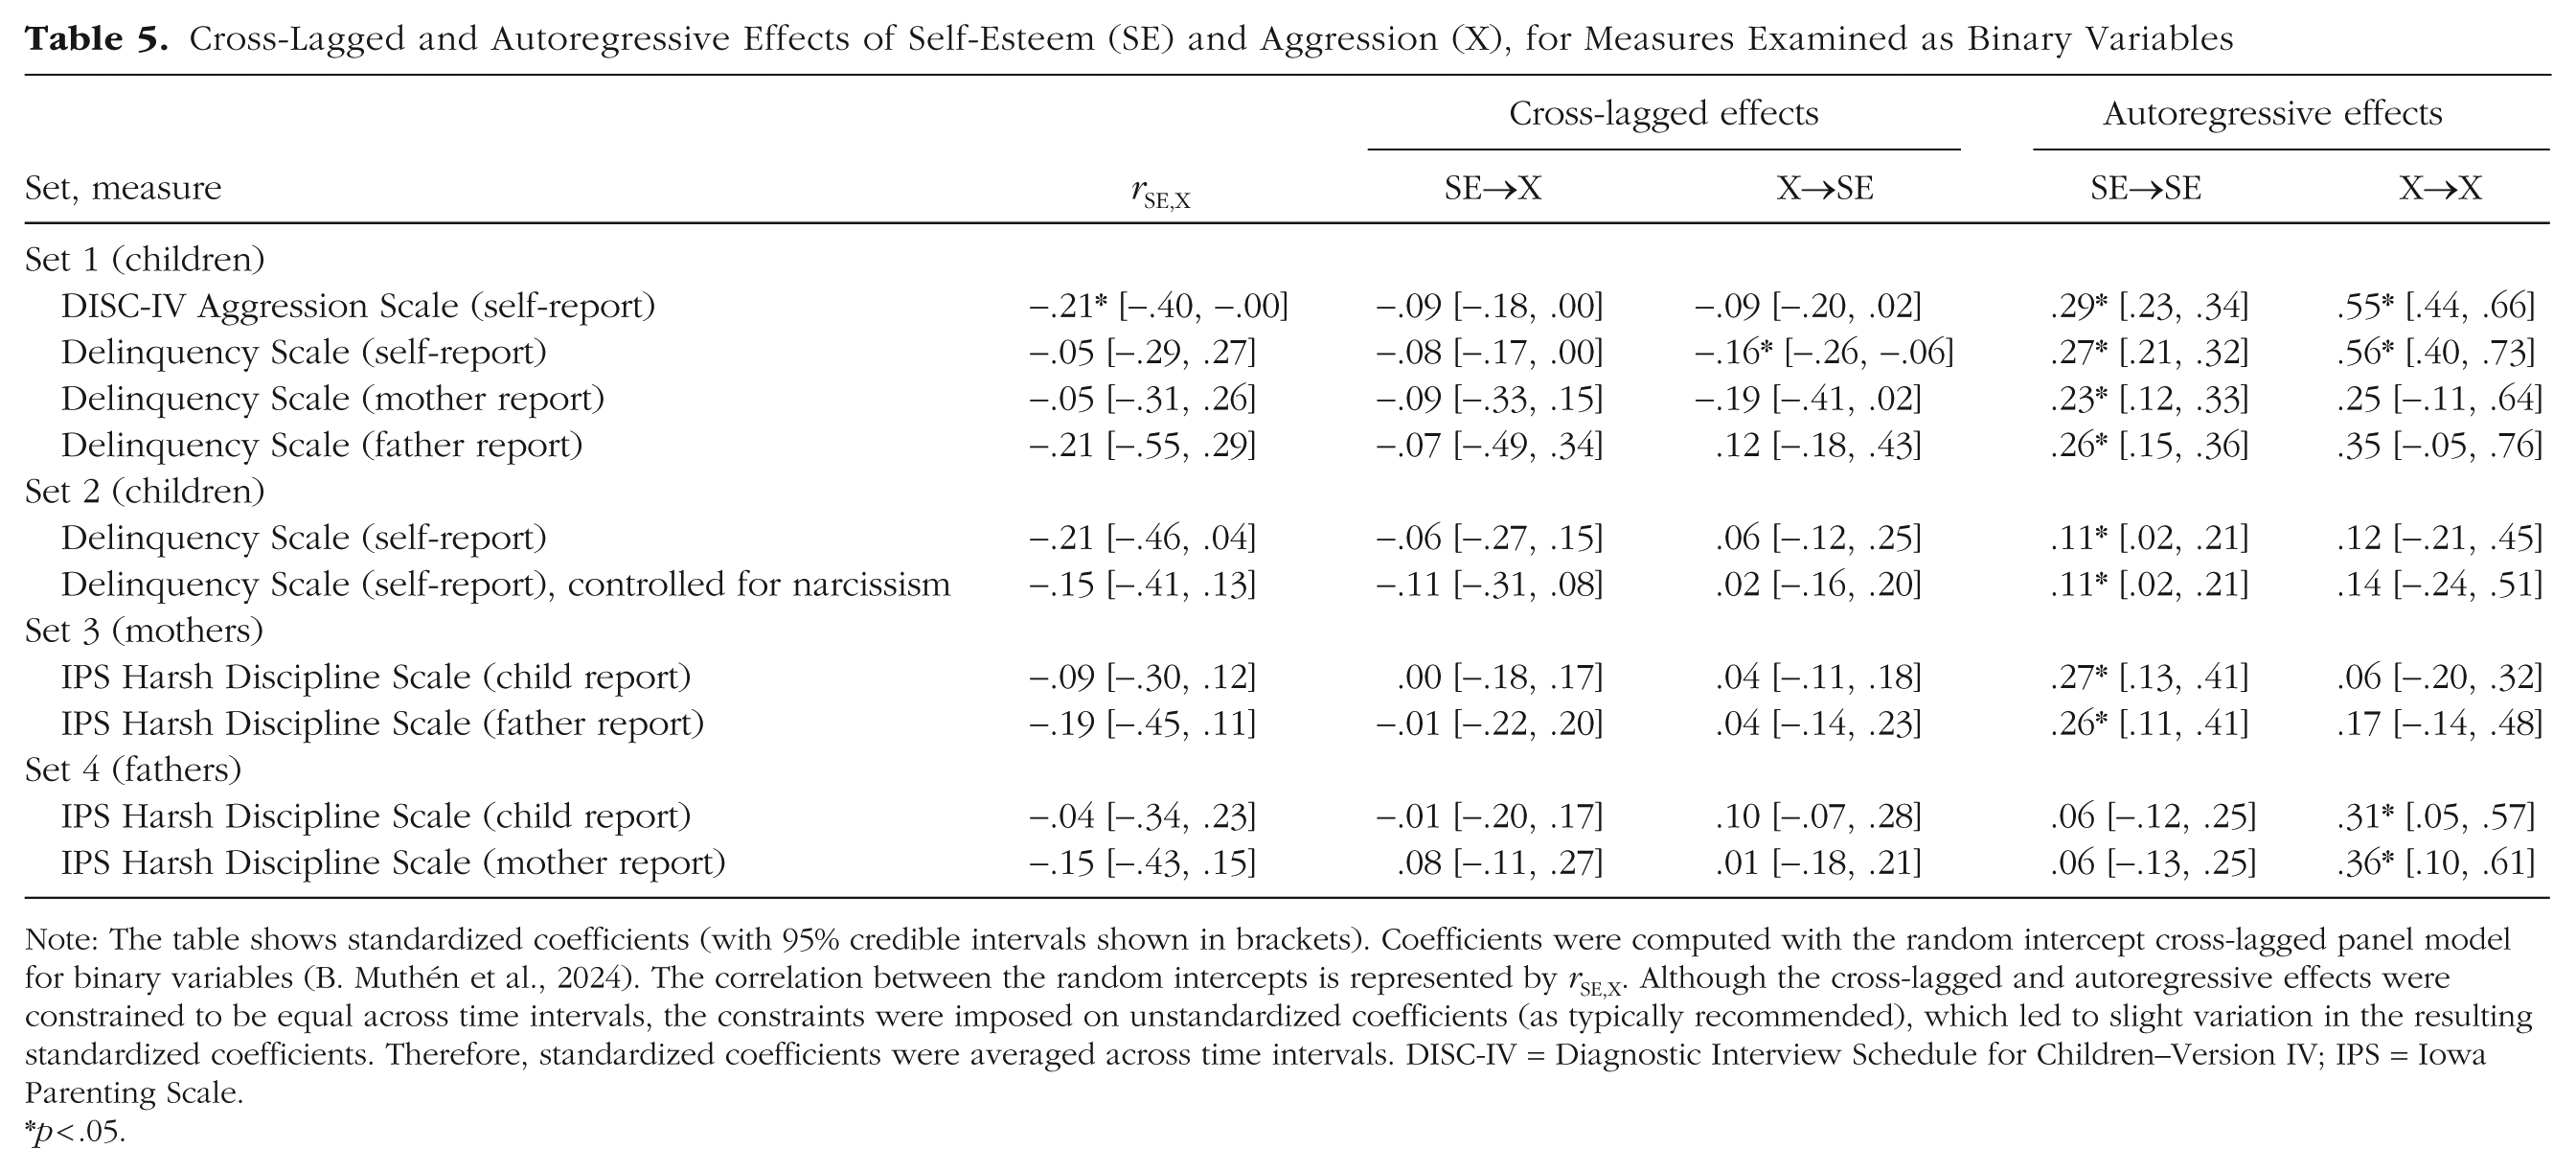
Note: The table shows standardized coefficients (with 95% credible intervals shown in brackets). Coefficients were computed with the random intercept cross-lagged panel model for binary variables (B. Muthén et al., 2024). The correlation between the random intercepts is represented by rSE,X. Although the cross-lagged and autoregressive effects were constrained to be equal across time intervals, the constraints were imposed on unstandardized coefficients (as typically recommended), which led to slight variation in the resulting standardized coefficients. Therefore, standardized coefficients were averaged across time intervals. DISC-IV = Diagnostic Interview Schedule for Children–Version IV; IPS = Iowa Parenting Scale.
*p < .05.
Our second research question was whether the self-esteem effect holds when the influence of shared-method variance can be ruled out. Overall, there was little evidence of systematic self-esteem effects on aggression, regardless of whether aggression was assessed by self-report or informant report (Tables 4 and 5).
Our third research question was whether self-esteem effects on aggression are curvilinear. We tested for curvilinear effects by computing models in which the quadratic self-esteem effect was included in addition to the linear effect. As noted above, these tests could not be conducted for the binary variables, but only for the measures examined as latent variables. Consequently, curvilinear effects were tested in 18 models (i.e., the DPM and RI-CLPM for each measure shown in Table S4 in the Supplemental Material). Only five of these 18 models converged properly. In all five cases, the quadratic effect was nonsignificant, with p values ranging from .086 to .929; thus, although we had preregistered to adjust the alpha level in the tests of curvilinear effects, all effects were nonsignificant even for an α of .05. In sum, in most cases the present research did not allow us to evaluate whether there is curvilinearity in the effects of self-esteem on aggression, and in the few cases where it was possible, the effects were nonsignificant. Of the models with convergence issues, eight yielded inadmissible solutions because the latent variable covariance matrix was not positive definite, and five did not converge at all (e.g., because the estimated covariance matrix could not be inverted). These issues occurred despite the use of 20 random sets of starting values, a procedure that generally decreases the likelihood of convergence problems when estimating complex models.
Our fourth research question was whether the longitudinal association between self-esteem and aggression is confounded by narcissism. Testing this was possible for the Delinquency Scale in Set 2, in which narcissism had been assessed simultaneously with self-esteem and aggression. When narcissism was included in the model, the self-esteem effects remained virtually unchanged, and the other key estimates were also very similar (Table 5). Moreover, narcissism did not show significant effects on aggression (β = 0.10, 95% CI = [−0.129, 0.339], p = .206), nor was it predicted by aggression (β = 0.05, 95% CI = [−0.200, 0.295], p = .340). For comparison purposes, we also computed the effects between narcissism and aggression without controlling for self-esteem. Again, narcissism did not show a significant effect on aggression (β = 0.00, 95% CI = [−0.247, 0.250], p = .487), nor was it predicted by aggression (β = −0.03, 95% CI = [−0.272, 0.222], p = .422). In sum, controlling for narcissism did not alter the effects between self-esteem and aggression.
Our fifth research question was whether engaging in aggression prospectively predicted lower self-esteem. As evident from Tables 4 and 5, there was only one significant cross-lagged effect of aggression on self-esteem. Thus, the results do not suggest that perpetrating aggression leads to changes in the perpetrator’s self-esteem.
Our sixth research question was whether the longitudinal association between self-esteem and aggression is moderated by gender. We tested for moderator effects by comparing multi-group models with, versus without, equality constraints across gender. The tests were conducted for the type of model that had shown better fit in the model comparisons. For all measures for which the multi-group models converged, the model comparisons supported the equality constraints across gender (Table 6), suggesting that the effects did not differ significantly between girls and boys, or between mothers and fathers. Given that Table 4 shows the estimates separately for mothers and fathers, we also computed the estimates with the combined parent sample (see Table S6 in the Supplemental Material). The findings for the combined sample did not differ systematically from the findings for the separate samples of mothers and fathers.
Fit of Multi-Group Models Testing Gender Equality Constraints on Prospective Effects, for Measures Examined as Latent Variables
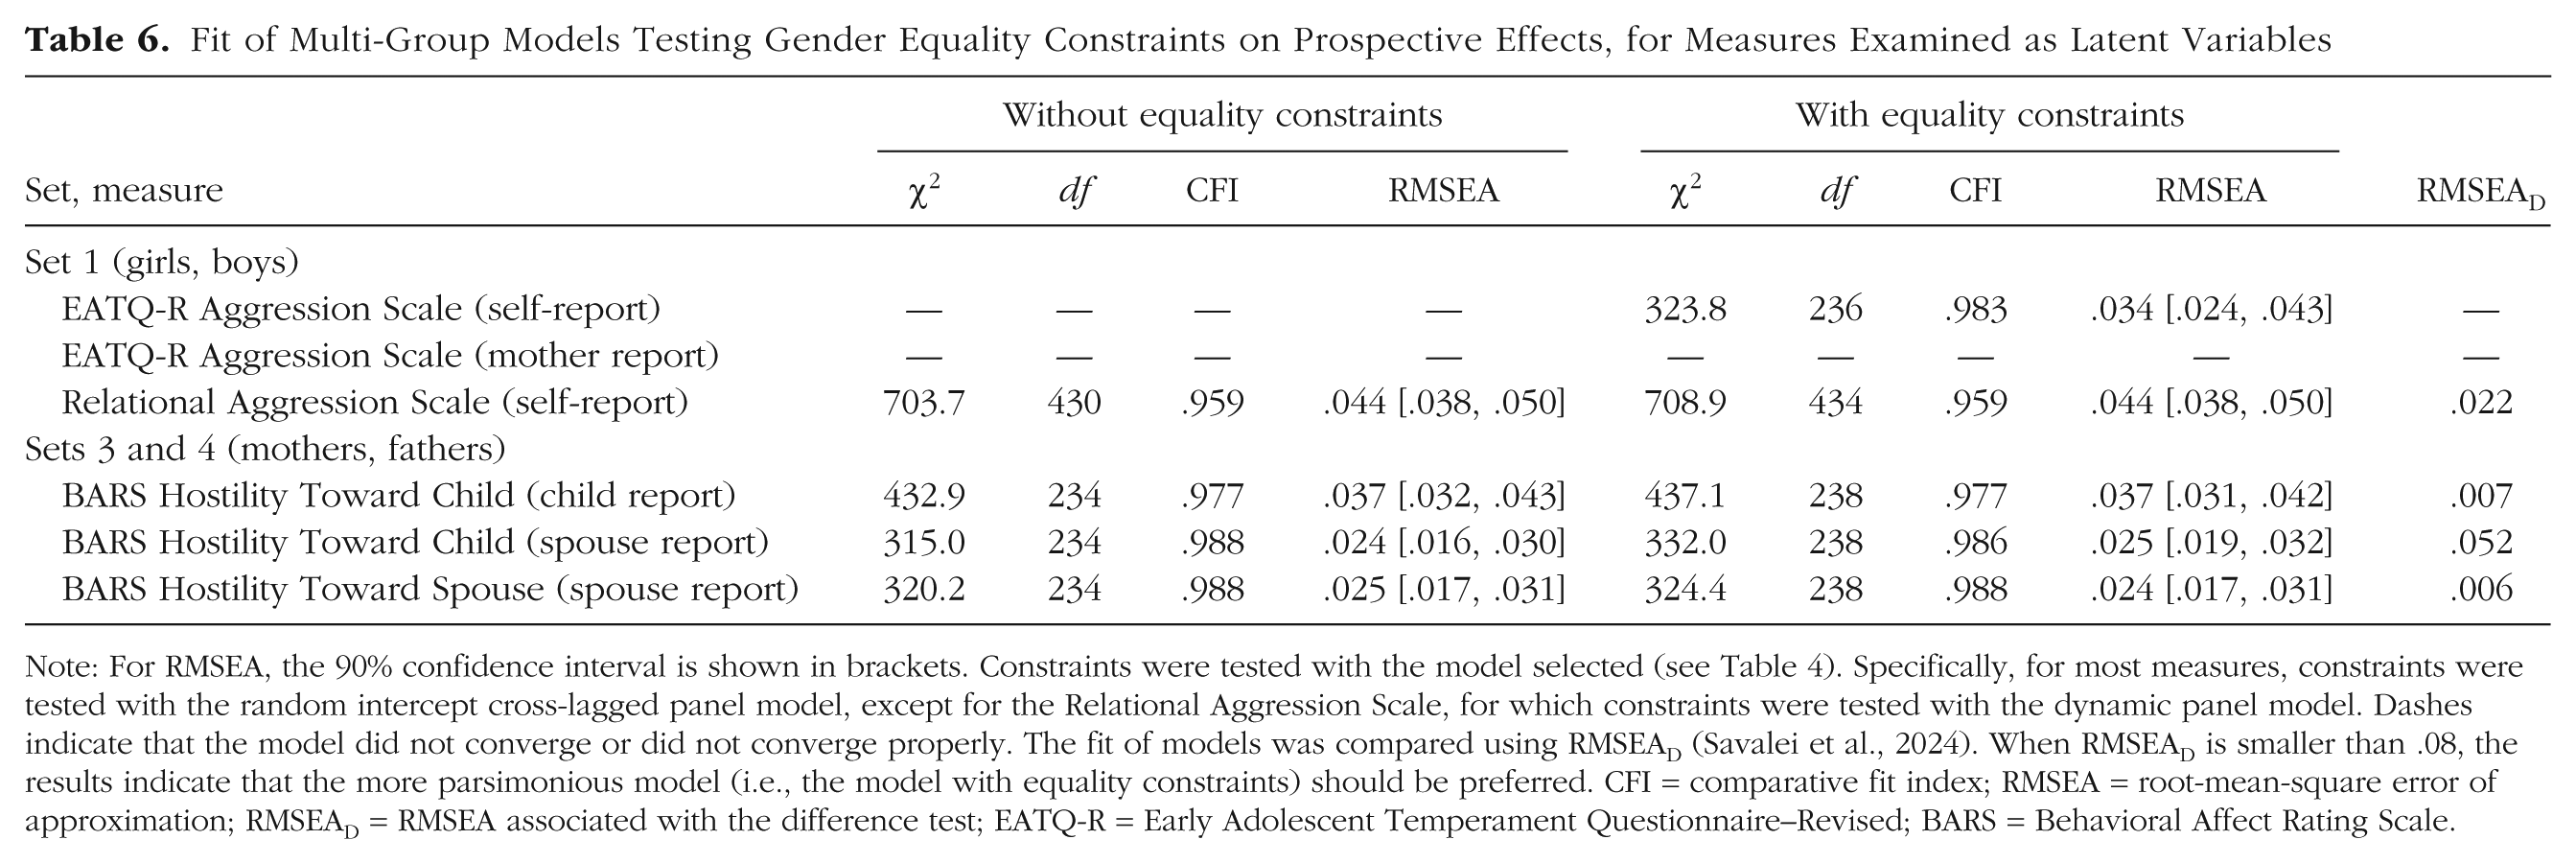
Note: For RMSEA, the 90% confidence interval is shown in brackets. Constraints were tested with the model selected (see Table 4). Specifically, for most measures, constraints were tested with the random intercept cross-lagged panel model, except for the Relational Aggression Scale, for which constraints were tested with the dynamic panel model. Dashes indicate that the model did not converge or did not converge properly. The fit of models was compared using RMSEAD (Savalei et al., 2024). When RMSEAD is smaller than .08, the results indicate that the more parsimonious model (i.e., the model with equality constraints) should be preferred. CFI = comparative fit index; RMSEA = root-mean-square error of approximation; RMSEAD = RMSEA associated with the difference test; EATQ-R = Early Adolescent Temperament Questionnaire–Revised; BARS = Behavioral Affect Rating Scale.
Supplemental analyses
Given that we found no evidence of a systematic pattern of cross-lagged effects, we examined the cross-sectional correlations between self-esteem and aggression for exploratory purposes (see Tables S7–S9). The results showed that the correlations were generally negative, consistent with prior meta-analyses (Lei et al., 2020; Teng et al., 2015). However, whereas most of the correlations were significant in adolescence (averaging −.13, Set 1), the correlations were rarely significant and close to zero in adulthood (Sets 2 to 4). A somewhat similar picture emerged for the correlations between the time-invariant latent factors (in DPMs) and random intercepts (in RI-CLPMs), which consistently had a negative sign and were of small to medium size in both adolescence and adulthood (Tables 4 and 5; see also Table S6 in the Supplemental Material).
We also estimated traditional cross-lagged panel models for exploratory purposes and for comparison with past research (Table S10). Compared with the DPM and RI-CLPM, more cross-lagged effects were significant, which could be expected given the lower complexity of the traditional cross-lagged panel model and, consequently, increased statistical power. Moreover, all significant cross-lagged effects and most of the nonsignificant effects were in the expected negative direction. Nevertheless, although four of the self-esteem effects on aggression were significant in the child sample, none were significant for the parents. Also, remember that the traditional cross-lagged panel model (unlike the DPM and RI-CLPM) does not control for unmeasured stable confounders.
Discussion
The present research examined the effects of self-esteem on aggression using data from a longitudinal study of 674 families. We partially replicated the widely observed negative concurrent association between low self-esteem and aggression, but found no evidence of systematic prospective self-esteem effects, at least across the observed time intervals of 1 or 2 years. Although null findings are often of little interest, we believe the present findings have significant theoretical implications because of decades of debate over whether low or high self-esteem predisposes individuals to aggression (e.g., Baumeister et al., 1996; Donnellan et al., 2005; Ostrowsky, 2010; Zeigler-Hill et al., 2016). The present findings do not support either hypothesis.
Several aspects of the research design strengthen the validity of the conclusions. First, we replicated the findings across three subsamples of participants—children, mothers, and fathers. Second, our statistical models control for additive effects of time-invariant confounders (Murayama & Gfrörer, 2025), and provide partial control for time-varying confounders (Bailey et al., 2026). Therefore, it is reasonable to assume that the models control, to a substantial degree, for third variables such as genetic factors, temperament, family environment, socioeconomic status, and neighborhood characteristics. Third, our multi-informant assessments allowed us to test whether the results were influenced by shared-method variance, which they were not. Fourth, we tested, in the child sample, whether the self-esteem effects were altered when we controlled for narcissism; the results remained virtually unchanged. Finally, the effects were not moderated by gender, supporting the robustness of the findings.
At the same time, the models tested in this research are based on specific assumptions, and the validity of causal conclusions hinges on the extent to which these assumptions are justified. The key assumption is that there were no omitted confounders or that the effects of any unmeasured confounders are appropriately controlled for (Lüdtke & Robitzsch, 2022). Thus, although the models controlled for additive effects of time-invariant confounders, they did not control for nonadditive or nonlinear effects (Murayama & Gfrörer, 2025). Moreover, although the models partially controlled for unmeasured time-varying confounders (Bailey et al., 2026), some of these variables may be mediators, which should not be controlled for (Robitzsch & Lüdtke, 2025). In fact, controlling for mediators increases rather than decreases bias in causal estimates (Rohrer, 2018). Consequently, if time-invariant confounders have primarily additive effects and if other time-varying processes do not function as mediators, the models may provide relatively unbiased estimates of the causal effects.
The present study could not rule out effects that occurred across a shorter time span than 1 or 2 years. If the self-esteem effects faded before the next assessment, then these effects could not be detected by the present analyses; they could contribute to concurrent associations between self-esteem and aggression, but there is no way to determine the temporal order or direction of these effects. To determine whether the effects occur over short periods of time (e.g., hours, days, or weeks), future researchers should examine the association between self-esteem and aggression using experience-sampling data and statistical methods such as continuous time modeling (Driver & Voelkle, 2018), which provide insight into the precise timing of effects. Thus, it remains possible that low (or high) self-esteem causes aggression, or that aggression influences self-esteem, just not on the timescale examined with the current data.
Another limitation is that in most cases we could not test whether the self-esteem effects are curvilinear (presumably because of the complexity of the DPM and RI-CLPM), which would have added important information for evaluating the “dark side of high self-esteem” hypothesis. Future researchers should test for curvilinear effects using more waves, which often improves convergence. Moreover, conclusions about the absence of curvilinear effects would require using equivalence tests (Lakens, 2017). However, because of the convergence problems in these models, we did not further probe the effects using this nonpreregistered strategy. Also, the power of tests may have been restricted because of the complexity of the models. This is particularly relevant for the models with binary variables, given that severe acts of aggression were rare in the sample, which may have further decreased power. Thus, future research would benefit from larger samples. Another way to increase power would be to aggregate effects across many samples in a meta-analytic review.
In summary, the present study yielded no evidence of systematic effects of either low or high self-esteem on aggression across the observed intervals of 1 or 2 years. Moreover, although a few effects (out of many) were significant and tests of curvilinear self-esteem effects are needed, the present findings do not, overall, suggest a link between high self-esteem and aggression. If anything, the pattern of concurrent correlations indicates that low, not high, self-esteem is associated with aggression. In conclusion, the findings do not provide support for the long-standing hypothesis that high self-esteem has a dark side.
Supplemental Material
sj-docx-1-pss-10.1177_09567976261459011 – Supplemental material for No Evidence for Self-Esteem Effects on Aggression: Findings from a Multi-Year, Multi-Informant Longitudinal Study of Mexican-Origin Families
Supplemental material, sj-docx-1-pss-10.1177_09567976261459011 for No Evidence for Self-Esteem Effects on Aggression: Findings from a Multi-Year, Multi-Informant Longitudinal Study of Mexican-Origin Families by Ulrich Orth, Jasmin A. Aebi and Richard W. Robins in Psychological Science
Footnotes
Transparency
Action Editor: Julia Stern
Editor: Simine Vazire
Author Contributions

References
Supplementary Material
Please find the following supplemental material available below.
For Open Access articles published under a Creative Commons License, all supplemental material carries the same license as the article it is associated with.
For non-Open Access articles published, all supplemental material carries a non-exclusive license, and permission requests for re-use of supplemental material or any part of supplemental material shall be sent directly to the copyright owner as specified in the copyright notice associated with the article.
