
Abstract
All-terrain vehicles have a remarkable capacity to handle a variety of irregular pavements, demonstrating its great potential in military domain as well as in the field of sports, entertainment, and so on. For all-terrain vehicles, the ride comfort is the core skill and one of the most important performance parameters. Little researches have been done into the ride comfort of all-terrain vehicle, particularly into the comprehensive ride comfort test and evaluation system. Combing the all-terrain vehicle vibration characteristics with the standards of ISO 2631, ISO 5349, and so on, a hardware testing system was developed for evaluating the all-terrain vehicle ride comfort. At the same time, a software analysis system was also built under the help of the hardware test system, which has been used to test and analyze many all-terrain vehicles. According to the test results and drivers’ subjective evaluation, the test system was proved to be reliable, convenient, and able to effectively evaluate the all-terrain vehicle ride comfort, providing the theoretical basis for improving the ride comfort of all-terrain vehicles.
Introduction
All-terrain vehicle (ATV) is globally recognized during the Iraq War. It has enormous potential in military applications due to its great traveling ability on different kinds of irregular pavements. In many countries, ATVs are widely equipped in the special troops for detection, attacks, and so on. In addition, the ATVs are also used in leisure, sports, entertainment, and other fields.
The ride comfort is of great significance to ATV. It determines not only the ATV using levels in military but also the core competitiveness in market. Currently, domestic ATVs are mainly in the stage of imitation, which lags far behind the foreign products in terms of the ride comfort.1–6 Therefore, it is of utility value to develop a test system evaluating ATV vibration and ride comfort.
This article developed a hardware test system for assessing ride comfort of the ATV referring to the standards of ISO 2631, ISO 5349, and so on.7–9 In addition, a complete ride comfort test system has been developed for ATV on the basis of a software analysis system designed in FAMOS development environment, which matched the previous hardware test system.
The ride comfort analysis was conducted on a variety of ATVs with this system. And the analysis results were compared with the subjective evaluation of professional testers. It proved that the test system could evaluate the ride comfort of ATVs accurately and rapidly, providing a theoretical basis and an effect assessment for improving ATV ride comfort.
Hardware test system development
According to ISO 2631, ISO 5349, and other international standards, the vibration accelerations of touch points between the body and the ATV are needed for the ride comfort evaluation, such as handles, seat cushions, and pedals.
Hardware test system requirement
The vibration acceleration sensor was chosen in consideration of sensitivity, response characteristics, linear range, reliability, and accuracy. 10 According to the ATV vibration characteristics and repeated comparative analysis, the sensor at the seat should possess the ability to measure vibration from 0.5 to 300 Hz. While the sensors at the handles and the pedals should detect vibration between 6.3 and 1000 Hz.
In accordance with above requirements, the American PCB-type three-direction piezoelectric sensor was adopted at the seat. This sensor can be driven by the collectors supporting the ICP-type sensors, thus free from separate power supply. The ICP-type three-way acceleration sensor produced by PCB Company was selected for the handles. Meanwhile, the ICP-type one-way sensor was chosen for the pedals.
As for selection of the collector, many factors should be taken into consideration such as A/D resolution, maximum sampling rate, signal-to-noise ratio, range, and data transmission/storage mode. According to the standard requirements of QC/T 4774-1999 (“Riding comfort evaluation index and limit value for coach”) and GB/T 4970-1996 (“Method of random input running test for automotive ride comfort”), frequency range was set from 0.1 to 1000 Hz. Dynamic range was from 100 to 166 dB. The error was supposed to be 0.5 dB. The signal-to-noise ratio should be better than 40 dB.
In accordance with above requirements, the IMC portable collector powered by 12-V battery was selected in consideration of the ATV characteristics. Seven data acquisition channels were needed to measure the vibration acceleration in three directions at the handle and the seat, as well as the vibration acceleration in single direction at the pedal. However, there were only six channels in each portable IMC collector. Consequently, two IMC devices in parallel would be used during the experiment.
The IMC collector can store the test data on the CF card of the collector, which would be subsequently duplicated into computers for analyzing with the help of software.
Hardware system design
According to the requirements of ISO 2631, ISO 5349, and other international standards, the sensor data at the points of seats, handles, and pedals were collected under the specified uniform speed. Due to the limitation of test site and collection time, professional testers were needed to control the beginning time of data collection, while the collector did not have this function. Taking advantage of the digital input module and constant-current source in IMC collector, the external trigger module was designed using a common constant-current switch.
The design of the external trigger modules is shown in Figure 1. The DIN_Bit01 of a portable IMC collector was chosen as the trigger source. A node switch was set between the bit_01 with LCOM in the DSUB-plug digital box. Then, the triggering condition was defined in the collector. It would be trigged at high power. Finally, the end of acquisition was determined by the collection time, which was set in the collector.
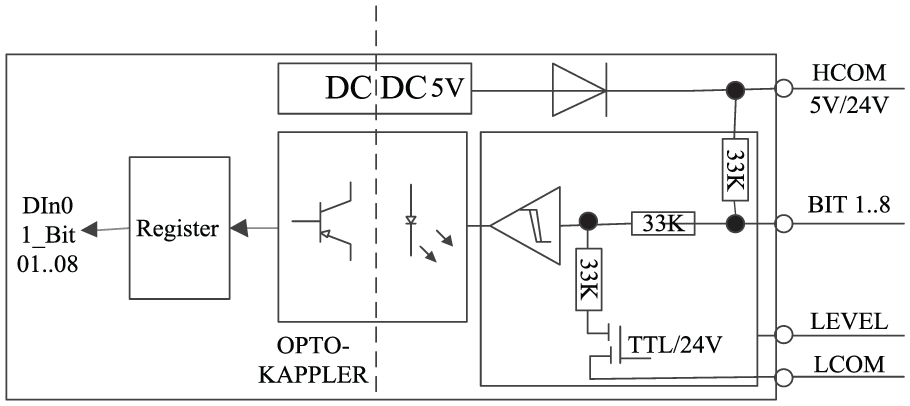
Circuit diagram of external triggering.
Software analysis system design
FAMOS is a signal analysis software with high market share in Europe, which is similar to MATLAB and can complete data processing analysis and signal processing. FAMOS has the advantages of fast computing speed and simple operation supporting Chinese language. More than 300 functional analysis functions are accessible, including a variety of special analysis suites with powerful functions.
FAMOS is a programming software for IMC collector. To avoid the data format conversion, an analyzing software system was designed for ride comfort analysis of ATV based on FAMOS post-processing platform, which was matched with the hardware. 11 The achievement of ride comfort evaluation method, including time domain and frequency domain, was the core for the designing of the analysis software system.
Time-domain method
For the recorded time history of acceleration, a(t), the time history of weighted acceleration, aw(t), can be obtained by the filtering network of the frequency weighting function. The root-mean-square (RMS) value of weighted acceleration is given by equation (1)
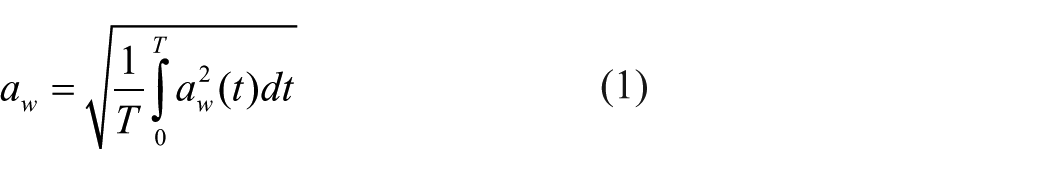
where T is the vibration analysis time, which is supposed to be more than 1 min.
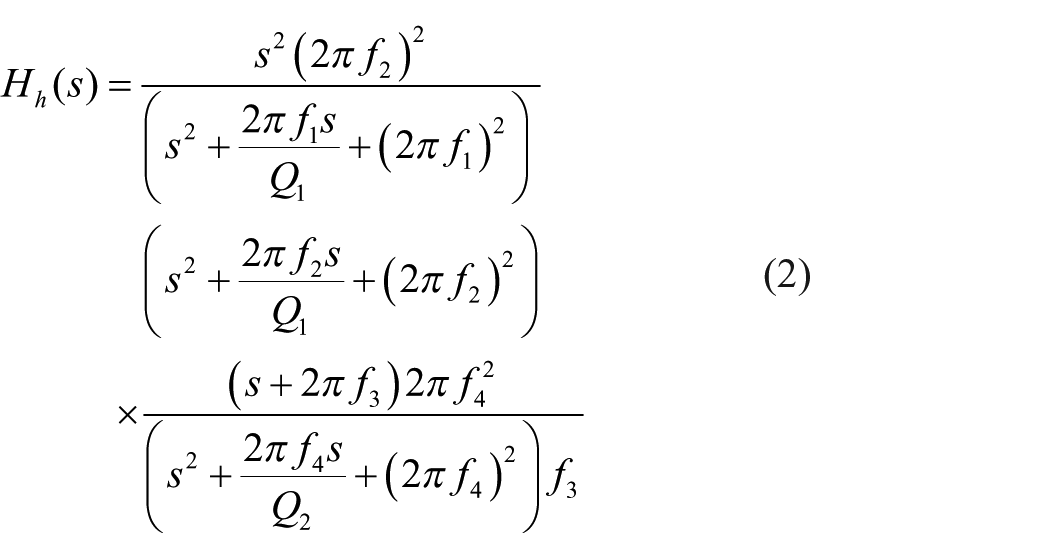
The frequency response function of the filter, corresponding to the frequency weighted function, wh, of the RMS value of weighted acceleration at the handles, is shown in equation (2)
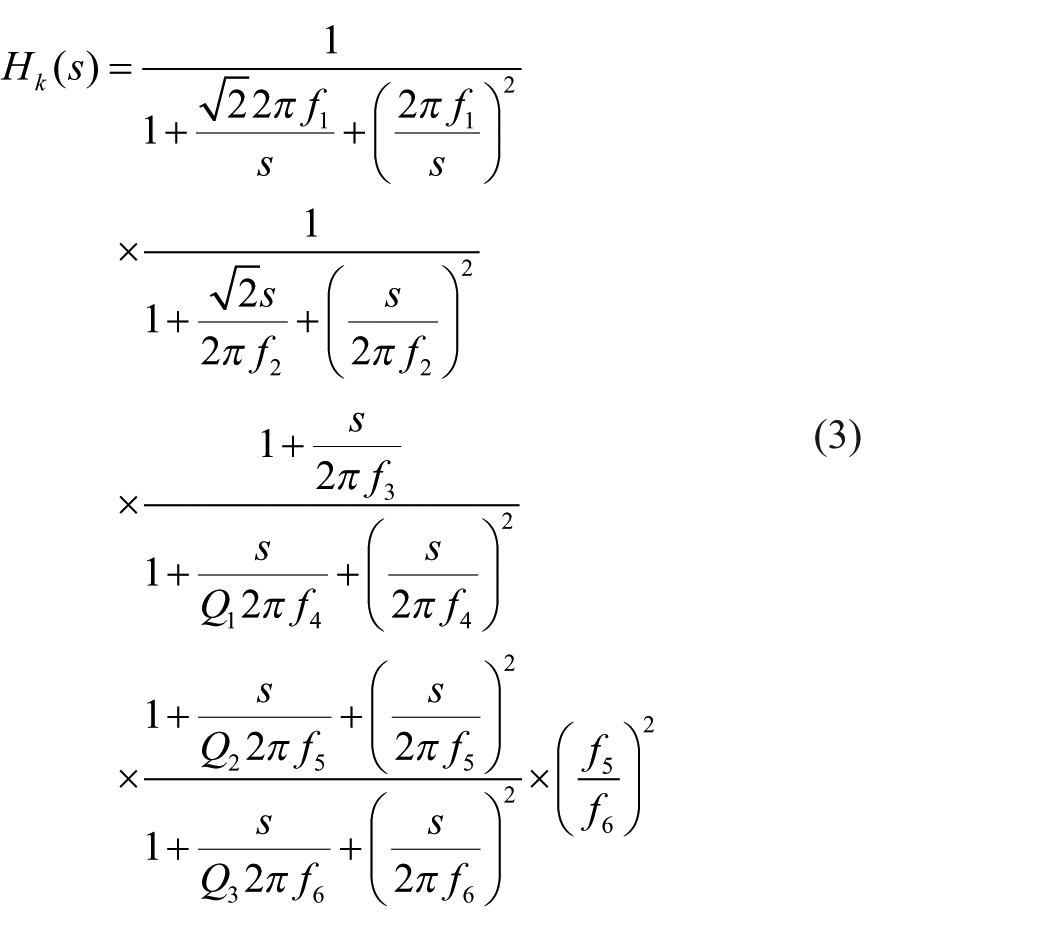
The frequency response function of the filter, corresponding to the frequency weighted function, wk, of the RMS value of vertical weighted vibration measured at the seats, is shown in equation (3)
Similarly, the frequency response function of the filter, corresponding to the horizontal vibration frequency weighted function, wd, at the seats, is given in equation (4)
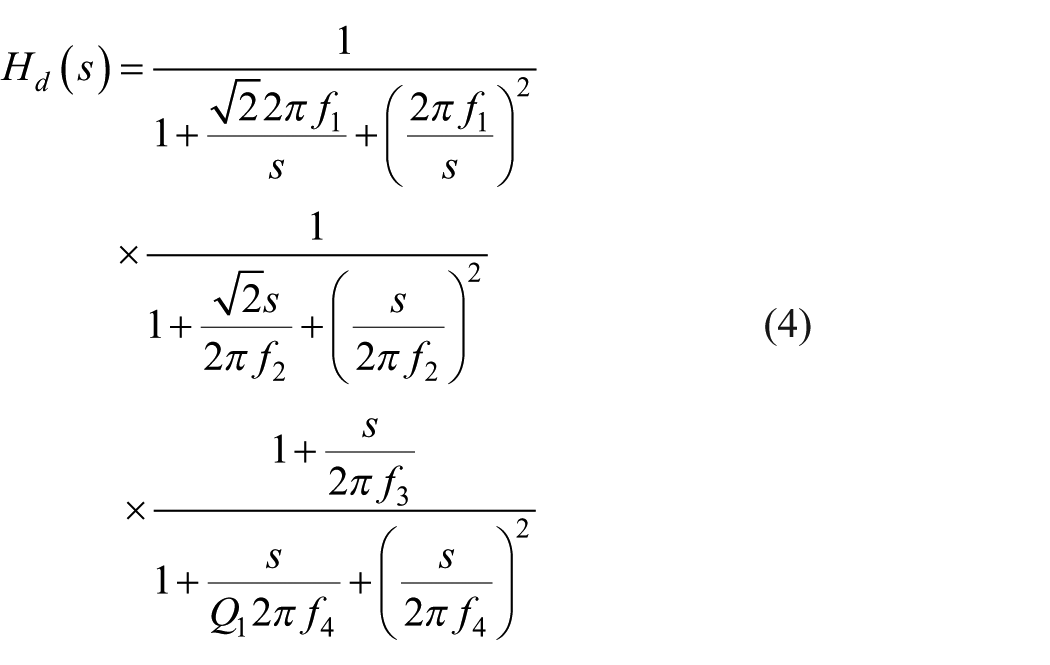
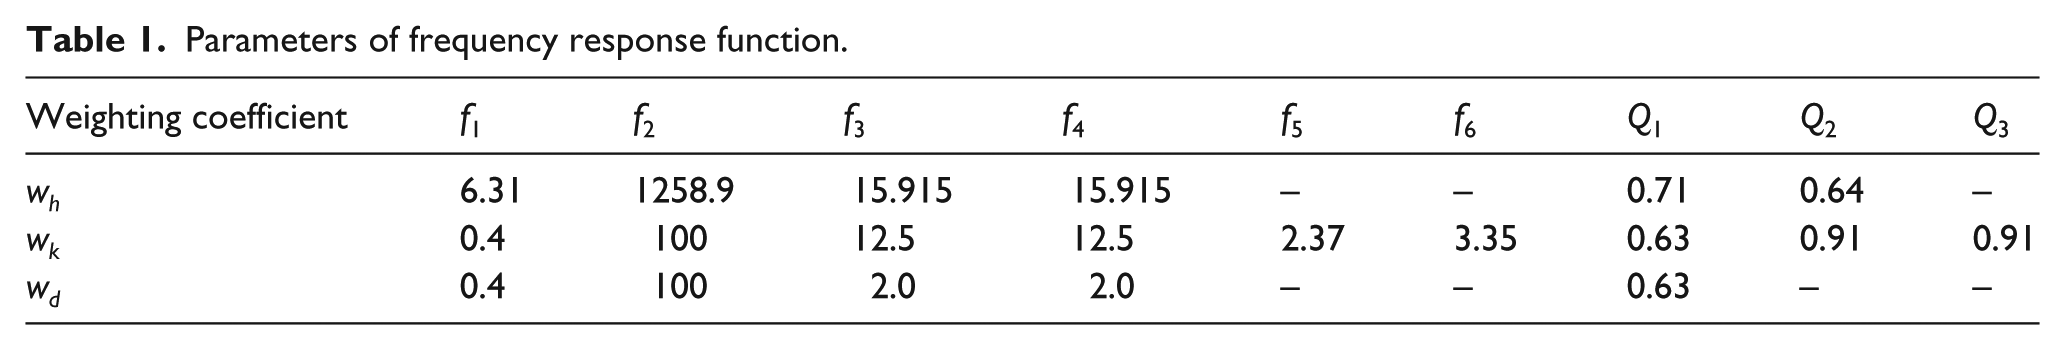
In equations (2)–(4), s is a complex variable in Laplace transform and f1, f2, f3, f4, f5, f6, Q1, Q2, and Q3 are the weighting coefficients shown in Table 1.
Parameters of frequency response function.
Frequency-domain method
The power spectral density (PSD) function,
where
In the analysis of frequency-domain method, power spectrum estimation is the key, where classical and modern spectral estimation methods can be used. 12 The classical spectral estimation is the main spectral estimation method. Welch’s modified periodic graph method is taken as an example for illustration. In the calculation of power spectrum, the time series of samples should be segmented to ensure the frequency resolution and reasonable variance estimation. Then, appropriate window functions (such as Hanning window) are selected to weight each section of data in turn, and the PSD after adding windows should ensure that the energy is compensated. Then, the power spectrum is calculated for each section of data after windowing. Finally, the power spectrum is obtained by averaging all the estimates.
The classical spectral estimation method has some shortcomings such as low resolution and poor variance performance, which could be compensated by modern spectral estimation methods. The modern spectral estimation method estimates the parameter model through the observation data and then estimates the power spectrum by calculating the output power of the parametric model.
Take the autocorrelation method in autoregressive model as an example. The premise of AR method is to satisfy the minimum power of forward prediction error of stationary random sequences and to obtain satisfactory frequency resolution and good variance performance when the data volume is large. When estimating power spectrum by AR method, the autocorrelation coefficient matrix of observation data is obtained first. Then, the recursive properties of autocorrelation equations are used to solve the model parameters. Then, according to equation (6), the output power spectrum of the model is solved to estimate the true power spectrum
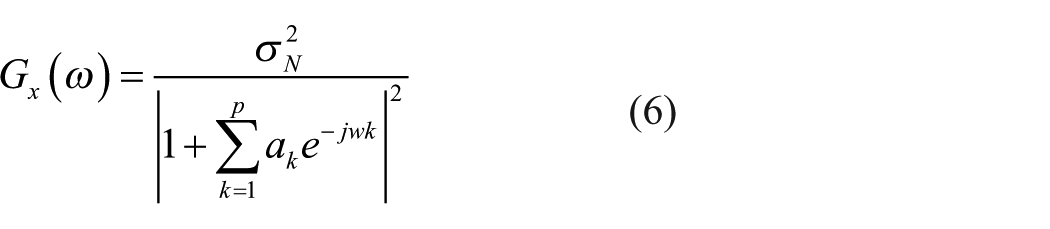
where
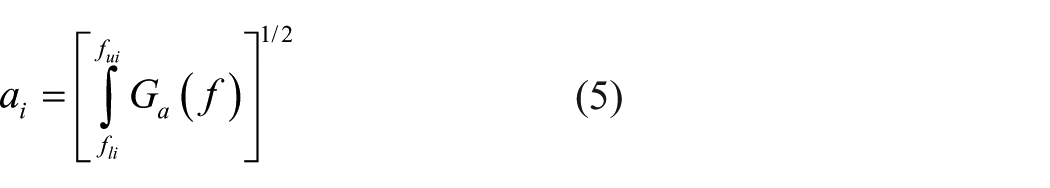
According to the calculation results of 1/3 frequency band RMS of vibration acceleration, the RMS of uniaxial vibration weighted acceleration is shown in equation (7)
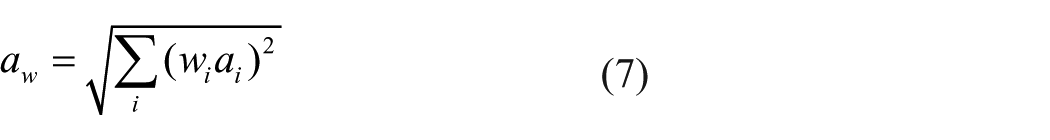
where wi is the weighted coefficient of the ith 1/3 frequency band and aw is the RMS value of weighted acceleration in single axis (unit: m/s2).
Considering the accuracy, the test data were divided into 12 independent samples in order during data processing with the frequency method. Also, the Hanning windows were applied with 50% overlaps.
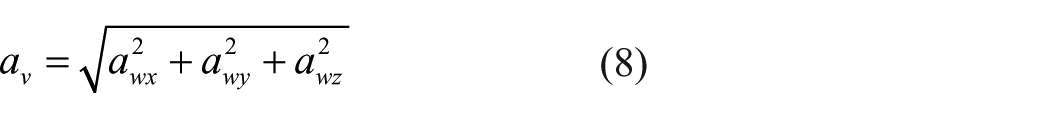
The time-domain and frequency-domain methods calculated the RMS of uniaxial weighted acceleration. According to ISO 2631 and ISO 5349 international standards, each axial weighted coefficient was 1. Therefore, the total RMS of triaxial weighted acceleration was
The weighted vibration level was more suitable to evaluate the ride comfort of the ATV. Therefore, the weighted RMS value of the acceleration was converted to the weighted vibration level
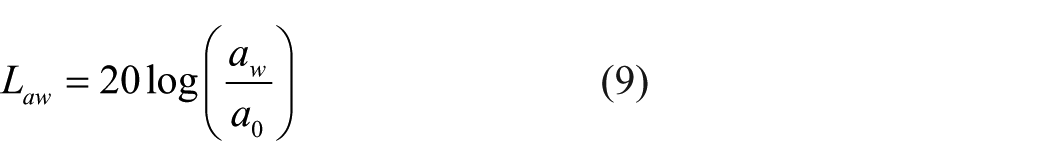
where
The software analysis system was designed based on the modular programming. The block diagram of software system is shown in Figure 2 according to the requirements. It consisted of program main interface, read data, vibration evaluation and analysis, graphic display, report-output modules, and so on.
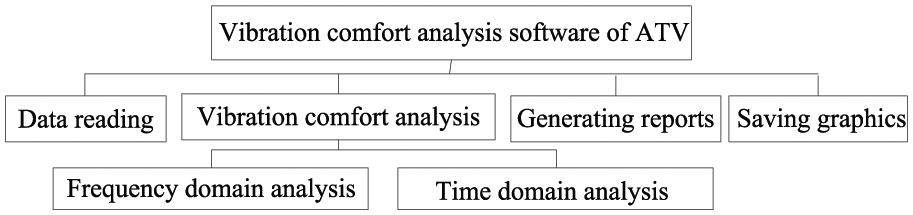
Schematic representation of the analyzing software for riding comfort analysis.
At present, the frequency-domain method is commonly used in the vibration comfort analysis for ATV, generally neglecting the time-domain method.13,14 The software analysis system involved the time-domain and the frequency-domain methods for better vibration analysis and evaluation.
Application of the vibration comfort test system for ATV
The vibration test system of ATV has been used to analyze the ride comfort for many ATVs. Together with the subjective evaluation results of drivers, the analysis results showed that the test system was reliable and convenient. In this article, take a certain ATV as an example to evaluate the ride comfort.
The test was conducted at an airport. The road grade was equivalent to Class B. The weather was sunny. The temperature was about 30°C. The wind speed was less than 3 m/s. The operating conditions of ATV met the requirement. The professional tester was about 75 kg. The test speed was 30, 40, 50, 60, and 70 km/h.
Considering the actual processing precision, the sampling frequency was 2000 Hz and the time was 60 s. The speed was calibrated using the high-precision GPS before the test. The professional tester observed the calibrated speedometer during the test. When the specified speed was reached, the external trigger switch was triggered to collect the test data. During the measurement of the data, the ATV was maintained at a steady speed until the specified distance was reached.
The data were processed with the developed software analysis system. It was necessary to judge the peak factor when evaluating the human body vibration with the time-domain method. Thus, the peak factors in each speed were obtained when the data were analyzed in the time domain. All the peak factors were less than 6, which met the requirements of the time-domain method.
The final results of the ride comfort evaluation for ATV are shown in Table 2, which contains the time-domain and the frequency-domain methods. In addition, the analysis results of frequency method were composed of both classical spectral estimation (Welch’s method) and modern spectral estimation (AR method).
Vibration evaluation results of handles, seats, and pedals.
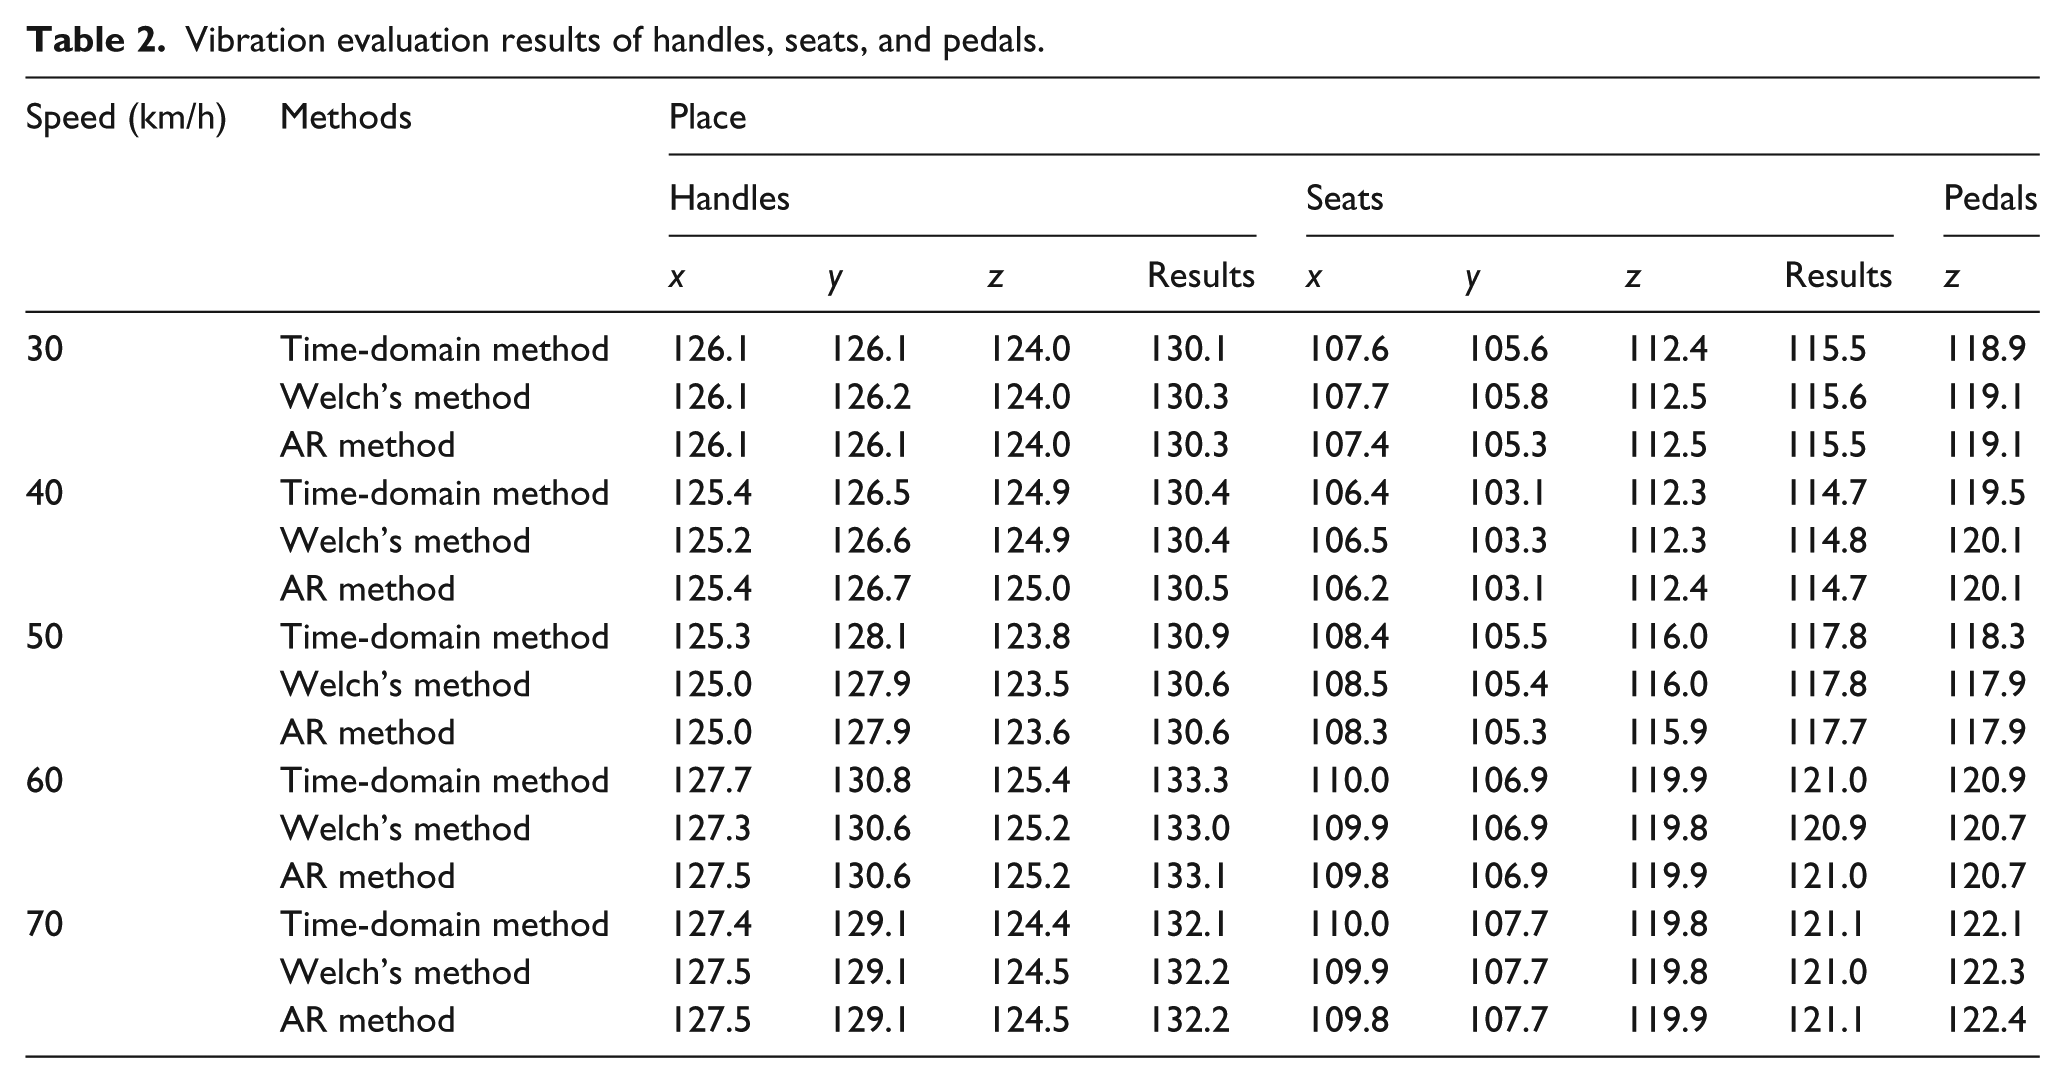
As shown in Table 2, the differences in results calculated by the time-domain method, Welch’s frequency-domain method, and AR frequency-domain method were very small. In addition, these evaluation results were consistent with the subjective evaluation of professional testers. It proved that the three methods can be used to evaluate the ride comfort of ATV.
In addition, it was found that the time-domain method was faster than the frequency-domain method in actual data processing. Therefore, the time-domain method was recommended to calculate the final evaluation result.
In order to compare the differences between the classical spectral estimation (Welch’s method) and the modern spectral estimation (AR method) for analyzing the ride comfort of ATVs, an example at 50 km/h was taken. The PSD diagram of the ATV in the z-direction using Welch’s method and AR method is shown in Figure 3.
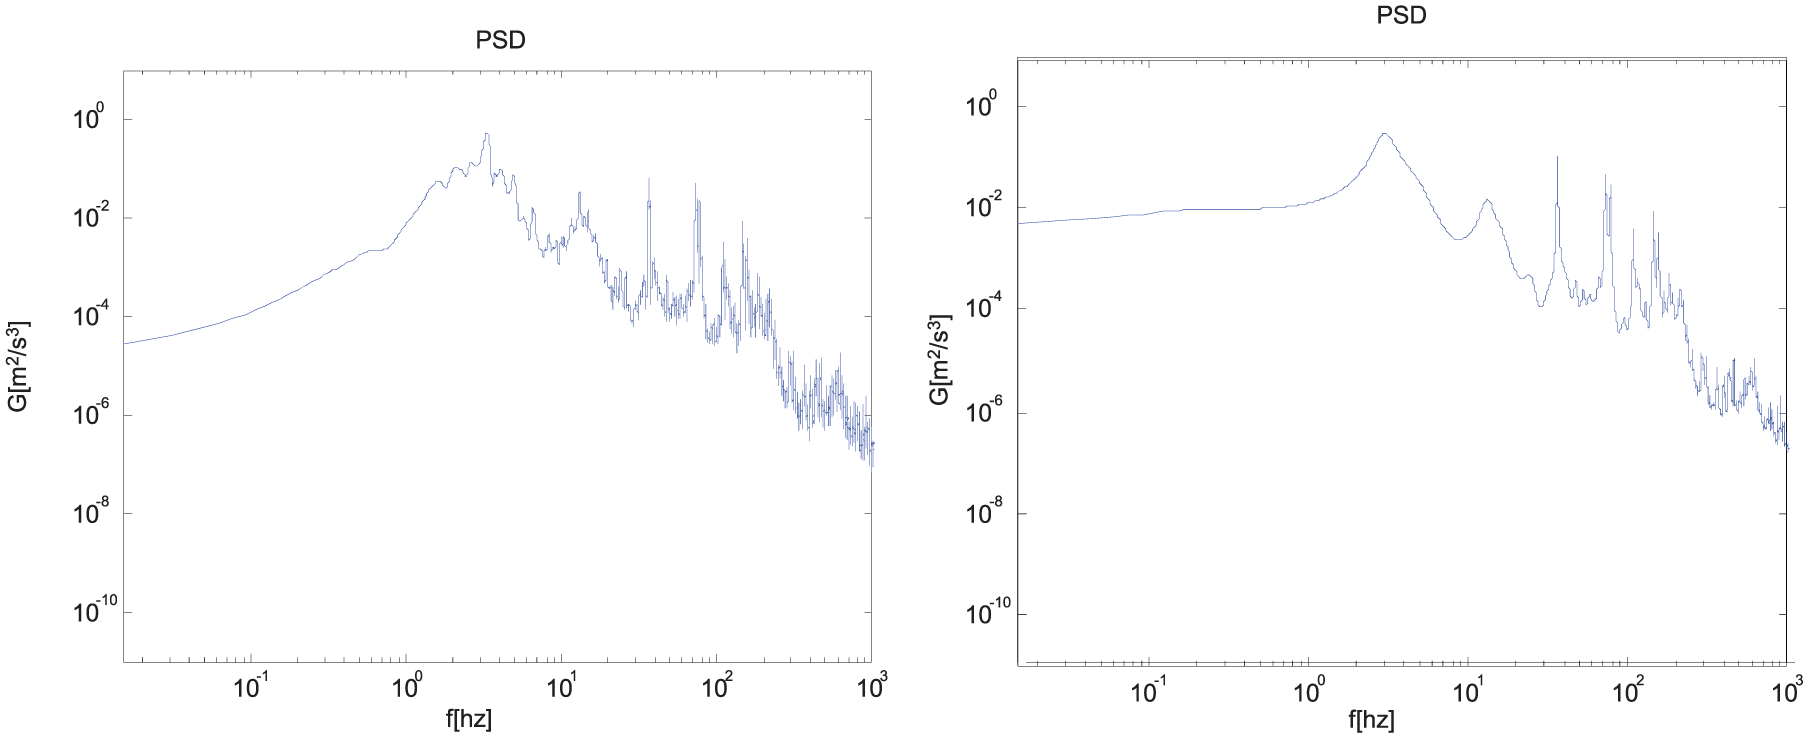
PSD of the z-direction at the cushion for 50 km/h: (a) Welch’s method and (b) AR method.
As it is shown in Figure 3, the trend of PSD and amplitude of Welch’s method was in agreement with AR method. However, the curve obtained by AR method was smoother than that by Welch’s method. It was easier to analyze the spectral characteristics and understand the vibration characteristics of ATV. Also, it can be provided as theoretical guidance for later improvement.
In addition, it was found that when Welch’s method of classical spectral estimation was used to estimate PSD, the more the points of fast Fourier transform (FFT), the more the independent segments, and the smoother the curve. However, the number of FFT points and the number of independent segments were a pair of contradictory quantities. Welch’s method can only make a compromise according to the actual situation.
Conclusion
From this study, the following conclusions can be drawn:
According to the standards of ISO 2631 and ISO 5349, a hardware test system for assessing ATV vibration as well as ride comfort is developed based on the vibration characteristics of ATV. Considering the compatibility with hardware test system, the software analysis system is designed in FAMOS environment. Finally, a reliable and convenient ride comfort test system of ATV is built.
Based on the vibration test system of ATV, the ride comfort of a certain ATV is evaluated. The results show that the quantitative evaluation results of time-domain and frequency-domain methods are consistent. Both of them can be used to evaluate the ride comfort of ATV.
The trend of power spectrum curve obtained by Welch’s method and AR method, which represent the classical spectral estimation and modern spectral estimation, respectively, is consistent. However, the power spectrum curve obtained by AR method is smoother and more conducive for analysis.
The time-domain method can quickly discover the ride comfort condition of ATV. But there does not exist frequency-domain analysis results. Frequency-domain method is time-consuming while reserving the power spectrum, which can be used for improvement analysis of the ride comfort of ATV.
Footnotes
Declaration of conflicting interests
The author(s) declared no potential conflicts of interest with respect to the research, authorship, and/or publication of this article.
Funding
The author(s) disclosed receipt of the following financial support for the research, authorship, and/or publication of this article: This study was supported by the Science and Technology Research Program of Chongqing Municipal Education Commission (Grant No. KJQN201803408).