
Abstract
Structural sizing optimization is a crucial step in the process of modern satellite structural design. It warrants minimizing the satellite structural mass while improving the overall quality and reliability of such design. This article discusses thoroughly the structural optimization of a small earth remote sensing satellite whose primary structure is based upon aluminum honeycomb sandwich plates. A novel contribution has been conducted in extending the optimization problem to include the main static and dynamic loads acting simultaneously on the satellite during launch phase utilizing the results of static, buckling, modal, and harmonic response analyses. The small satellite optimization process starts initially with formulating the optimization problem based upon the structural analyses results. Subsequently, miscellaneous optimization techniques utilizing ANSYS workbench capabilities represented in “DesignXplorer” module are employed. Finally, the results are compared with other results obtained from a MATLAB code based upon both genetic and sequential quadratic programming algorithms. The optimization process leads to approximately 30% mass reduction in the proposed satellite structure. A special attention is drawn towards meta-models due to their capabilities in solving complex structural models with a reasonable wall-clock time.
Introduction
The satellite structural mass is regarded as a critical design parameter in the process of satellite structural design. Reducing such mass simultaneously with satisfying miscellaneous design constraints is extremely crucial design objective. It results obviously in launch cost reduction and payload portion increment. 1 The role of employing structural optimization for satellite mass reduction has been under investigation since 1980s. 2 Structural optimization is the subject of making an assembly of materials withstands loads with a minimized mass while satisfying applied constraints. 3 Thus, structural designers utilize different optimization methodologies in the design process of efficient lightweight structures that fulfill the structural requirements without violating design constraints. 4 Considerable progress has been carried out in the field of structural optimization during the past decades. A brief survey of pertinent literature follows next.
Yoon et al. 5 utilized particle swarm optimization toolbox (PSO) algorithms to optimize a satellite adapter ring. A mass reduction in the adapter of 54% was achieved compared to the original one. Boudjemai et al. 6 introduced the structural topology optimization of “Alsat1” subject to natural frequency and maximum stress constraints using genetic algorithm. Results indicated that the use of isogrid and honeycomb structures has a great potential in reducing structural mass. Tizzi 7 presented the optimization problem of a cantilever truss space structure under natural frequency constraints. Ritz procedure, combined with FEM, was applied for the optimization of the satellite appendage. Significant weight saving of truss beams was assessed. Chen et al. 4 applied a two-level multipoint approximation method (TMA) and its corresponding optimization system “ESSOSII” in the space frame of a satellite structure. Numerical results indicated the robustness and efficiency of the proposed method and developed system. Structural size optimization using “OPTISTRUCT” tool was applied to a spacecraft base structure in order to minimize mass and maximize natural frequency. 8 The optimized base structure weighed 7.54 kg with mass saving of 35% without violating design constraints.
Ravanbakhsh et al. 9 developed a structural design sizing tool, including both static and dynamic models in addition to multi objective genetic algorithm with the aim of maximizing the payload mass and minimizing the total satellite mass. They concluded that the selection of a satellite total mass in the range between 40 kg and 60 kg is considered the optimum approach for the university microsatellite. Mao et al. 10 carried out design optimization of two satellites primary structure via ANSYS/CATIA system. A non-linear design optimization problem, with an objective to minimize the structural mass subjected to frequency, strength, displacement and buckling constraints, was established. The optimized structural mass decreased with a percentage of 4.95% and 7.18% compared with the original design. Design and optimization of lattice composite satellite central cylinder were presented by Pavlov et al. 11 An automated interaction between CAD, FEM, and optimization method was implemented in order to minimize the structural mass subject to static and buckling constraints. Results indicated a structural mass reduction of 27%. Hai et al. 12 introduced structural optimization of multiple structure cases or multiple payload cases using MSC. Patran/Nastran software. Multiple finite element models were involved at each iteration step. The main target was to minimize the structural mass while satisfying frequency constraints. Results of numerical examples assessed the efficiency and feasibility of the optimization system. Finite element models are quite large and complex models that require tremendous calculation. Optimization of such systems is severely complicated, if not impossible, because evaluation of objective and constraint functions requires large numbers of calculations.
Arora introduced the usage of meta-models in solving such tedious and time-consuming optimization problems. 13 Xu et al. 14 introduced a multi-objective structural optimization of the supporting legs of TianTuo-3 microsatellite considering stiffness, stability, and strength requirements. Results indicated that the mass of one leg, natural frequency and equivalent von Mises stress were reduced by 17.9%, 4.5% and 11.7% respectively compared with the original design. An et al. 15 proposed the optimum design of the stacking sequence of a satellite central cylinder. Recently, a two-level approximation method combined with a genetic algorithm was utilized as an optimization method. The results indicated that the structural mass can be reduced by 36.70% compared with the empirical designs, meanwhile satisfying all the considered design constraints.
Despite these aforementioned researches, to the author’s foremost information, the researches on satellites’ structural optimization remain quite insufficient so far. This article aims to extend the optimization problem to include the main static and dynamic loads acting simultaneously on the satellite during launch phase utilizing the results of static, buckling, modal, and harmonic response analyses.
In this article, the whole process of structural optimization of a small earth remote sensing satellite is thoroughly discussed. The process starts initially with the satellite configuration and structural design. Subsequently, detailed structural analyses of the satellite are presented in order to verify the satellite structural integrity during launch phase. Structural analyses are divided into two main categories; static and dynamic (vibration) analyses. Both are conducted using finite element analysis (FEA) via “ANSYS” workbench software. Analyses include static, buckling, modal using modal effective mass concept (MEM), and harmonic response. In this context, the equivalency of harmonic and random vibrations approach is utilized via Mile’s equation.16,17 Additionally, superposition of the von Mises stresses due to both quasi-static and sinusoidal loads is carried out to locate the maximum stresses encountered by the satellite structure during launch stage. Finally, miscellaneous optimization techniques are utilized via Ansys workbench and MATLAB m-files with the objective of minimizing the satellite structural mass without violating the design constraints obtained from different analyses. The optimization process of the whole satellite is such a tough and time-consuming process because of the nonlinearities of both objective and constraint functions, which impose limitations on the selection of the optimization algorithm. In addition, optimizing such complicated structures is of a high computational expense. Therefore, the need for utilizing meta-models (surrogates) is indispensable to facilitate such time-consuming process with an acceptable accuracy.
Satellite overview
The satellite under discussion is a small earth remote sensing satellite working in low-earth orbits. Its payload is an optical electronic observation system intended to acquire highly resolution images of the earth’s surface. The process of satellite configuration started with mission objectives definition, and subsystem identification. This is followed by selecting a suitable structural shape and distribution of subsystems components internally and externally. Finally, the satellite mass properties were calculated with a satellite total mass of approximately 205 kg.
1
The whole process was performed using computer aided design (CAD) program namely “Pro-ENGINEER” software as shown in Figure 1. Satellite stowed and in-orbit configurations.
1
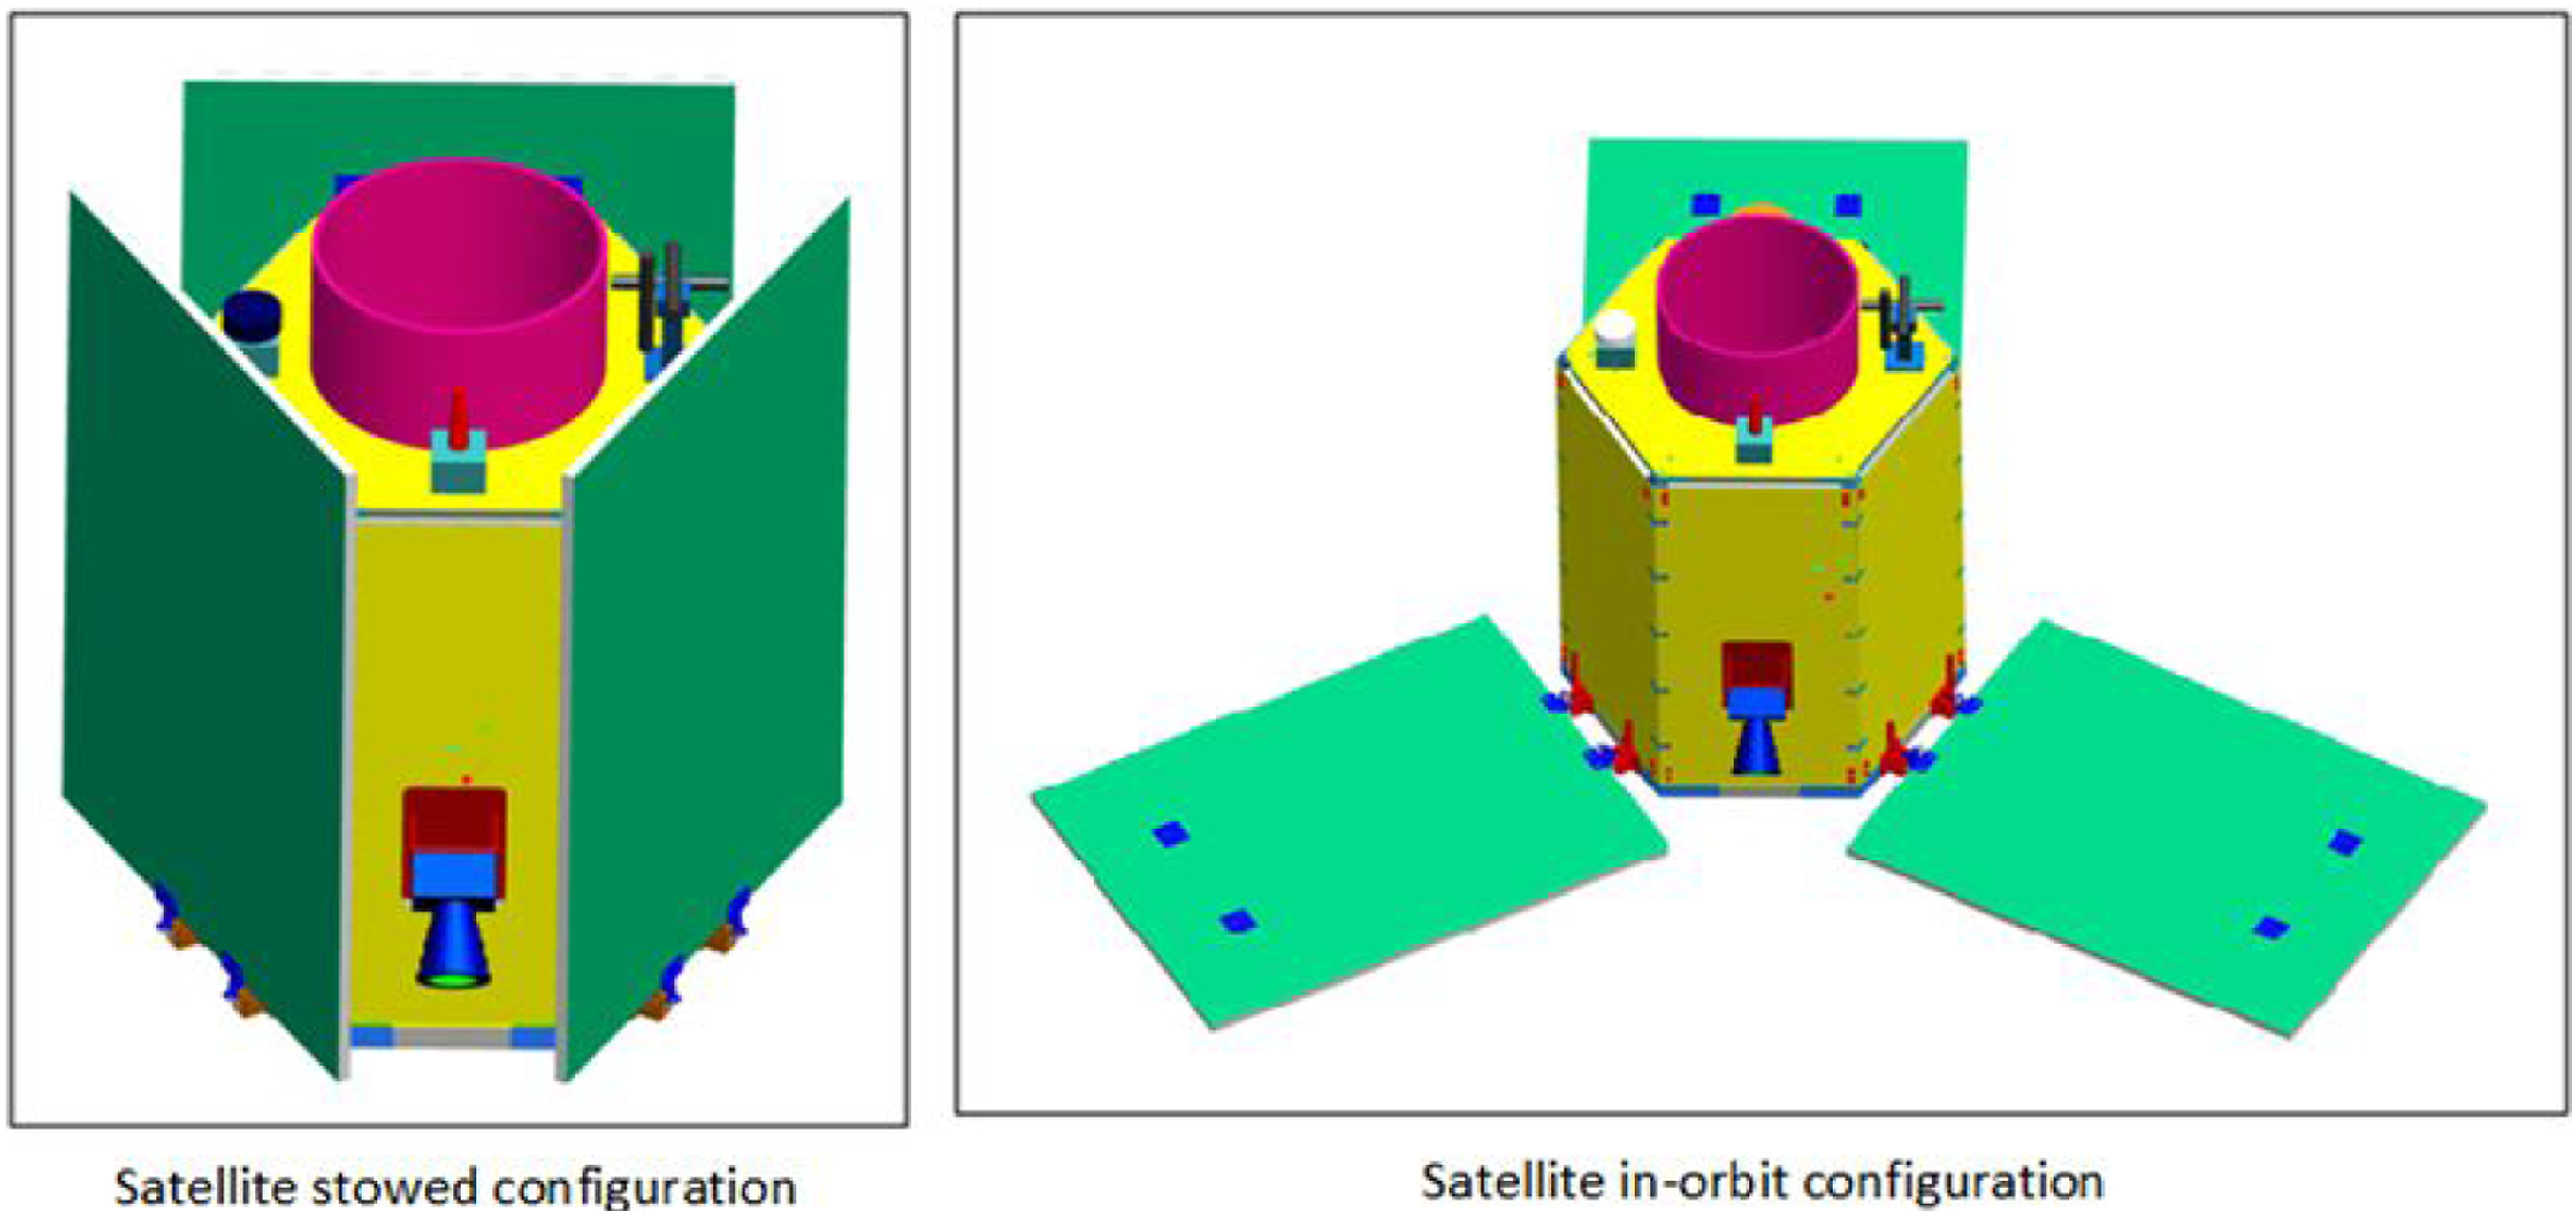
The proposed satellite structure is a hexagonal prism of 1000 mm height, 430 mm side length, and 31.5 kg.
1
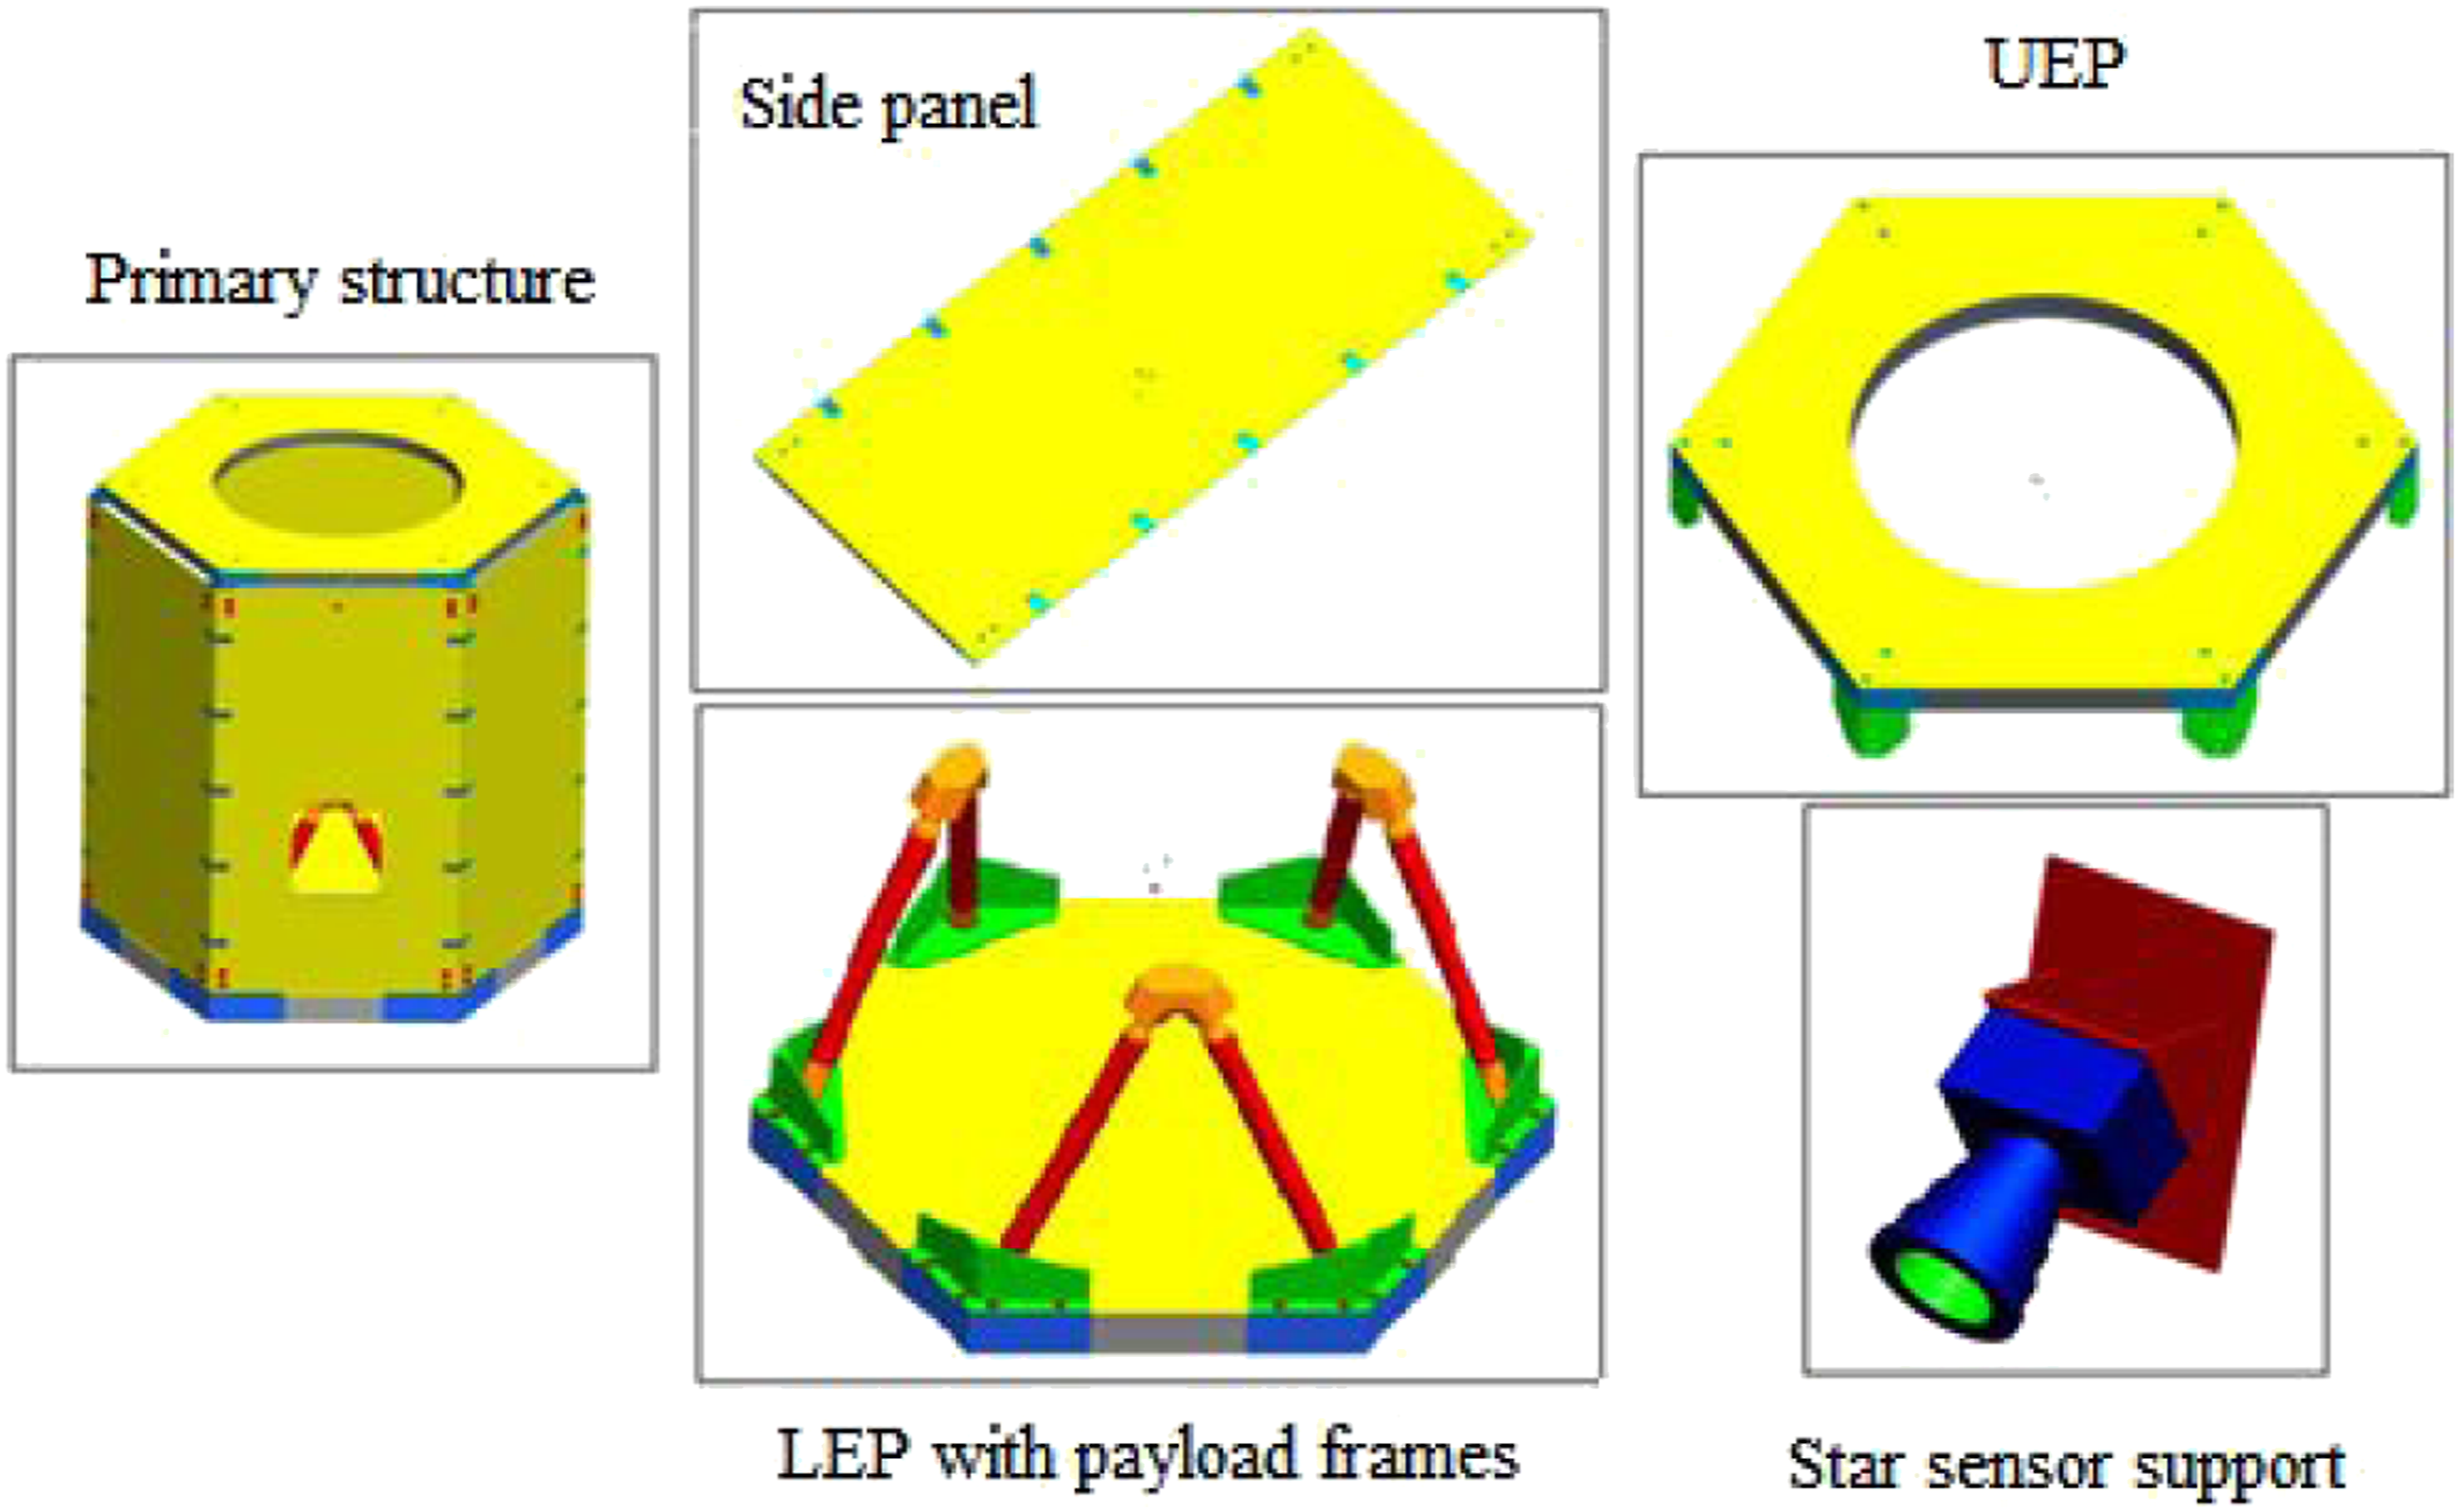
Such structure is based upon stiffened honeycomb sandwich plates. This structural design copes effectively with minimum mass requirements. Moreover, the utilization of honeycomb sandwich plates as the main constituent of the proposed structure improves stiffness to weight ratio, buckling resistance, and dimensional accuracy. The satellite load-bearing structure is composed of eight aluminum honeycomb sandwich plates; upper end plate (UEP), lower end plate (LEP), and six side panels. On the other hand, the satellite secondary structure includes three frames for payload fixation in addition to the star sensor support as shown in Figure 2. Satellite primary and secondary structures.
1
Satellite finite element modeling
In this section, the process of building the satellite FEM is briefly introduced. A 3-D model of the satellite primary and secondary structures is implemented via Pro\ENGINEER software package, and then transferred to ANSYS workbench package “DesignModeler section” using “parasolid.x_t” format. All structural elements are represented by three-dimensional solid finite elements “solid 186” with exception that the upper and lower facing sheets of the honeycomb sandwich panels are modeled using two-dimensional shell finite elements “shell 181,” and side panels longerons are represented using one dimensional beam finite elements “beam 188”.
Modeling of honeycomb sandwich structures
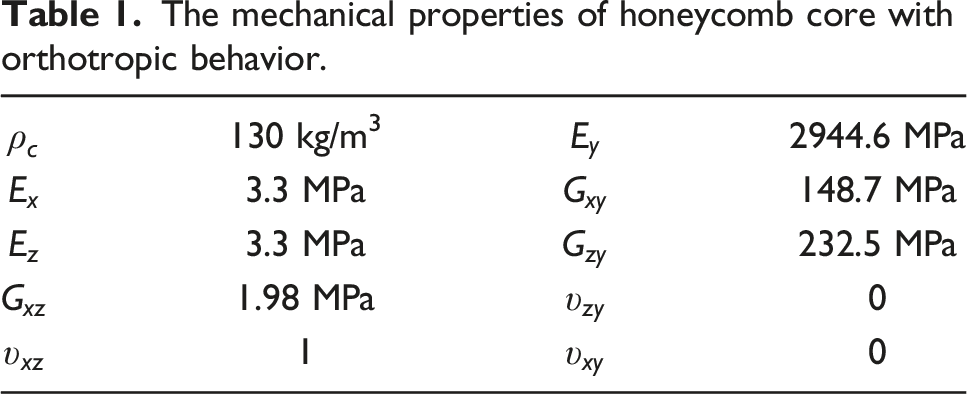
Honeycomb sandwich plates are modeled using the sandwich theory where the core is homogenized with orthotropic properties.18,19 The shell-volume-shell (SVS) is utilized such that the two facing sheets are modeled via shell elements “SHELL181”, and the core is represented with solid elements “SOLID186”.20,21 This model is validated in experimentally using experimental modal testing and three-point bending tests via authors’ published work.22–24 Moreover, the finite element model updating of a honeycomb sandwich plate is carried out to obtain the most accurate equivalent elastic properties values to be used in the whole satellite finite element model. This goal is achieved by reducing the mean deviation between the experimental modal testing results and the related computational results via authors’ published work. 25
Mechanical properties of employed materials
The mechanical properties of honeycomb core with orthotropic behavior.
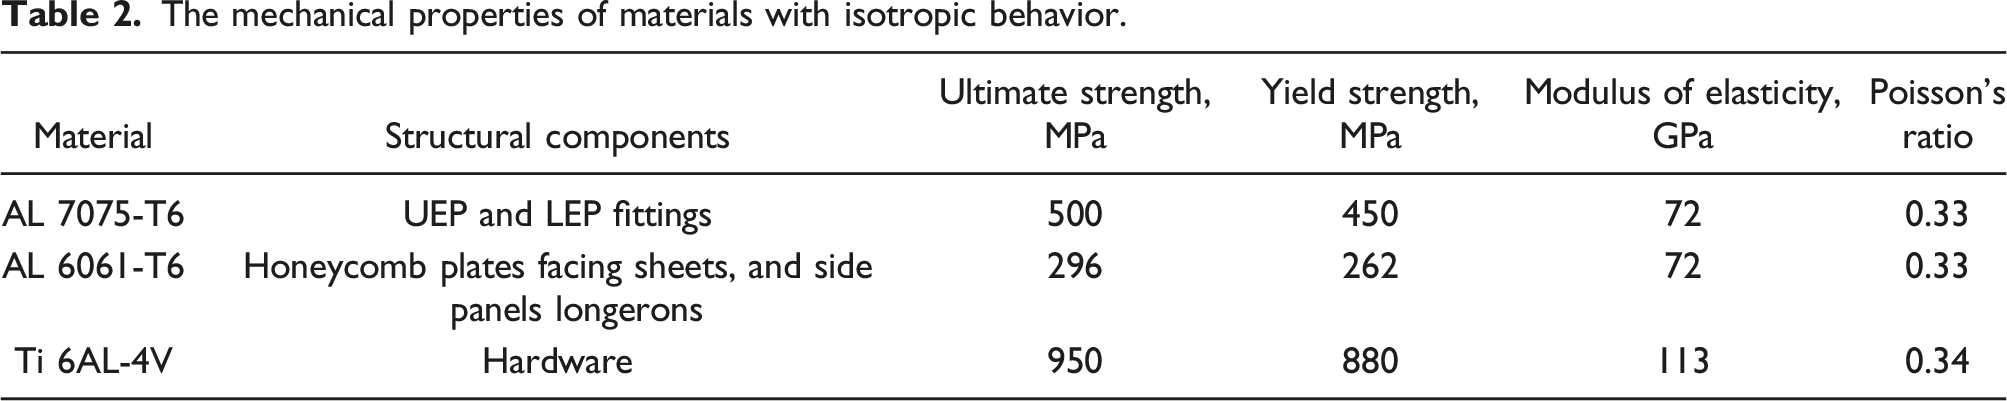
The mechanical properties of materials with isotropic behavior.
Modeling of electronic devices
During static analysis, satellite electronic devices are represented as distributed masses along the satellite miscellaneous plates. Throughout modal analysis and further dynamic analyses, devices are represented as deformable point masses placed at their centers of mass with their assigned centroidal mass moments of inertia.
Satellite structural analysis
This section discusses the satellite structural analysis process. It includes static analysis, buckling analysis, modal analysis, and sorting of satellite operating modes. This is followed with the harmonic response analysis and its equivalency with the random vibrations.
Satellite static analysis
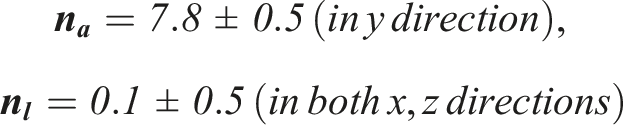
Static analysis is carried out to assess the satellite structural integrity subject to quasi-static loads during launch phase. Maximum equivalent von Mises stresses and maximum displacements are calculated.
1
The equilibrium equation for linear static analysis is:
29


Static analysis results.
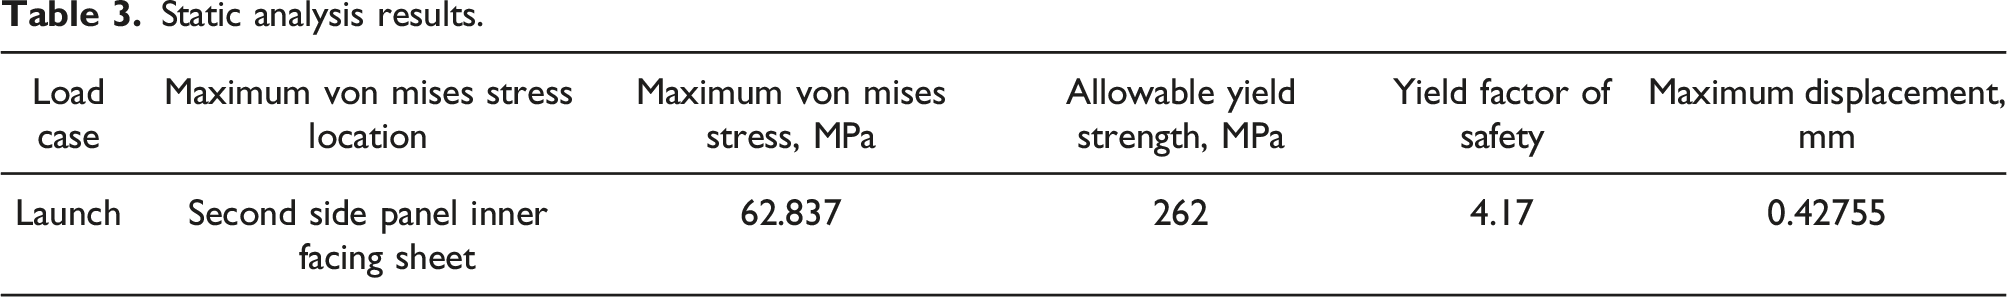
Based on analysis results, it can be denoted that the factor of safety value complies with the safety criteria. In addition, the values of the maximum displacement do not exceed the maximum permissible limit (1 mm). 1
Satellite buckling analysis
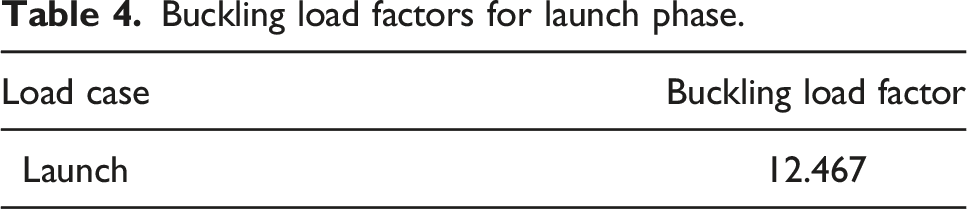
Linear buckling or Eigen-value buckling analysis is carried out to estimate the buckling strength of an elastic structure neglecting nonlinearities. Such class of analysis requires a pre-loaded environment from which the solution data is drawn. Based on this requirement, an Eigen-value Buckling analysis must be linked to (preceded by) a “Static Structural” Analysis. Linear buckling analysis using FEM is implemented by including the geometric stiffness matrix to the linear stiffness matrix.
8
The geometric stiffness matrix depends on the model geometry, element type and applied loads. Thus, the total system stiffness matrix can be introduced as follows:

Thus, the governing equation for performing linear buckling analysis can be formulated as follows:

Buckling load factors for launch phase.
Satellite modal analysis
Modal analysis is implemented in order to evaluate the satellite natural frequencies and mode shapes during both stages according to the following governing equations:

The analysis results display a total number of satellite natural frequencies of 586 modes up to 2000 Hz, where the first calculated natural frequency is 63.165 Hz. 1 The results are apparently compatible with the Russian LV Dnepr 30 caution in which the satellite first natural frequency should be greater than 20 Hz longitudinally; and 10 Hz laterally to avoid dynamic coupling with the selected launcher.
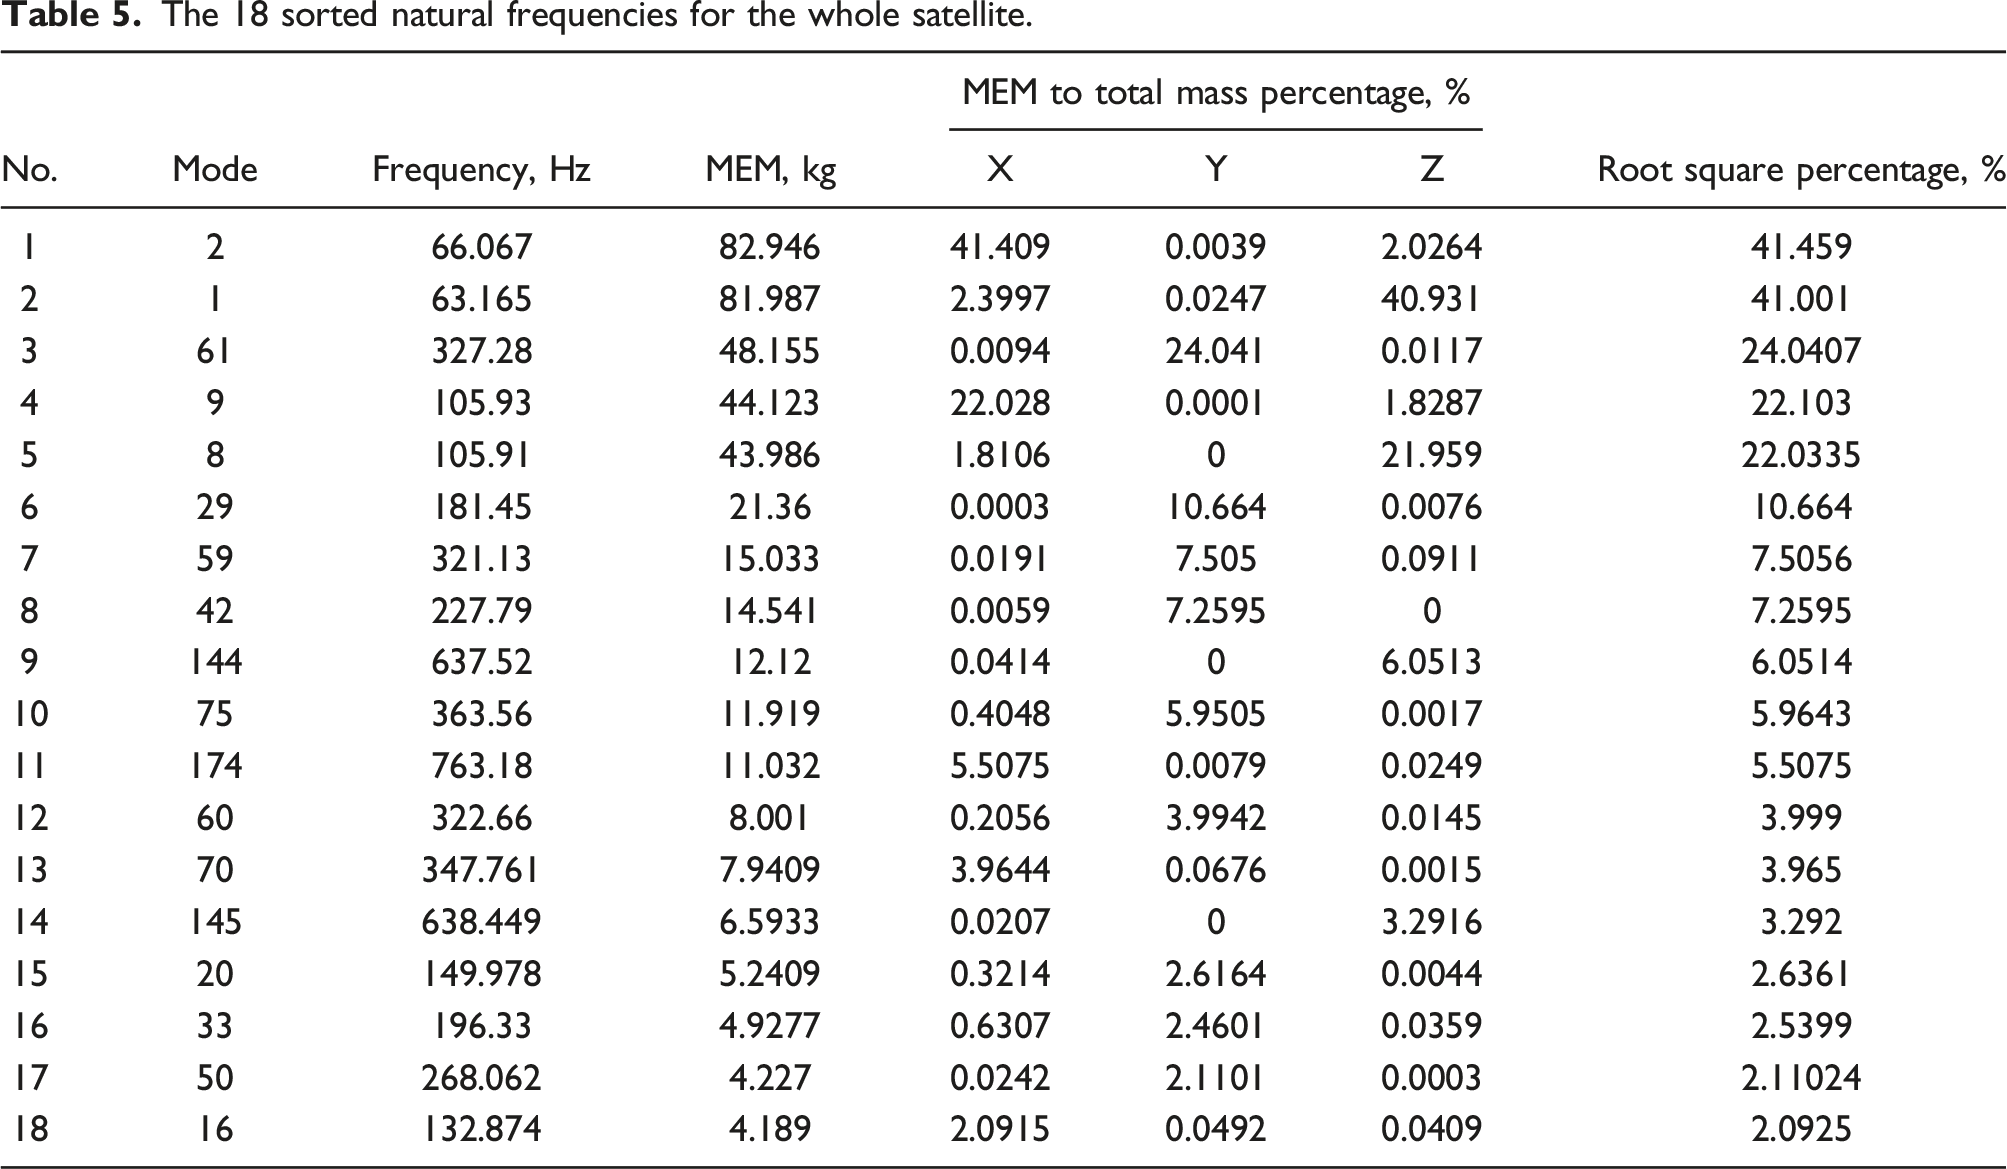
Modal analysis results are used in carrying out harmonic response analysis and random vibration analysis. However, implementing such analyses on the 586 modes is a very complicated process. Thus, it is mandatory to reduce the number of the utilized modal natural frequencies based on their contribution such that the less important modes are eliminated and the more important ones are kept. In this article, the modal effective mass (MEM) concept is utilized in ranking the satellite modal frequencies and selecting the most important modes. MEM is a dynamic property of the given structure that is linked to modal characteristics; natural frequencies and mode shapes. It represents the amount of system mass participating in that mode in a given direction. Participation factors are scalars that exhibit the importance of the given mode as follows:
31


The 18 sorted natural frequencies for the whole satellite.
Harmonic response analysis
Harmonic response analysis is carried out to ensure that the satellite structure is capable of overcoming the dynamic loads applied during rail transportation and launch phases. Such analysis enables to assess whether or not the satellite structure withstands the effects of the forced vibrations represented mainly in the resonance. The governing equation of this analysis is expressed as follows:
29

In this article, the harmonic response analysis is performed via harmonic response module in ANSYS workbench in order to estimate the satellite structure response at the 18 sorted natural frequencies listed in Table 4. Thus, the peak stresses at each resonant frequency are calculated for the whole satellite structure.
Satellite applied dynamic loads
It can be concluded that such frequency range (up to 20 Hz) has no direct effect on the satellite structure as the satellite first natural frequency is ∼63 Hz.
The second type of dynamic loads is the random vibrations. They are stochastic loads with unpredictable behaviour and thus they are dealt with only in a statistical manner using probability laws.
16
Such vibrations are characterized by a power spectral density (PSD) and frequency range. Power spectral density is the Fourier transformation of the auto correlation function of a random signal
Random vibrations in three perpendicular directions during launch. 30

Random vibrations analysis is a complicated type of structural analysis and requires a high computational expense.31,33 Thus, the concept of random and sinusoidal vibrations equivalency is utilized in this research. Transforming random vibrations to equivalent harmonic vibrations simplify the analysis of such stochastic vibrations.
Equivalency of random and sinusoidal vibrations
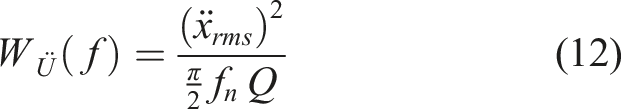
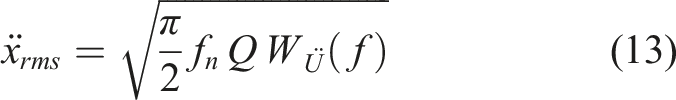
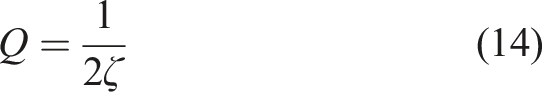
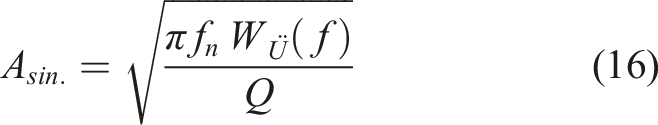
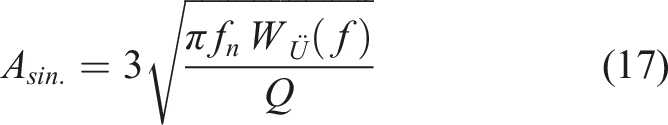
The equivalence of both random and sinusoidal vibrations is based upon Mile’s equation applications for single degree of freedom systems.16,17 It can be observed that the root mean square acceleration (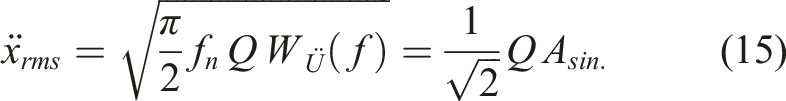
Equivalent sinusoidal vibrations during launch (g).
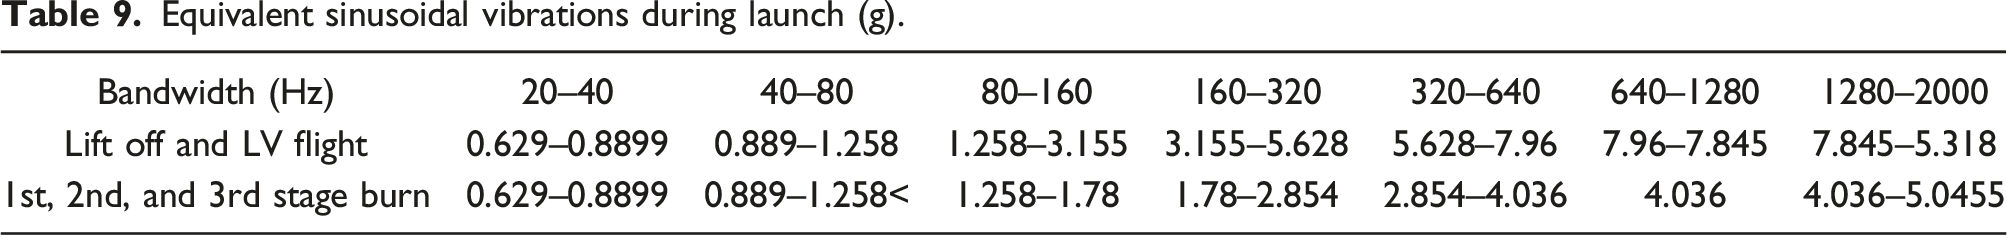
It can be denoted that the estimated equivalent sinusoidal vibrations during 1st, 2nd, and 3rd stage burn are much lower than that estimated for Lift off and LV flight. Hence, it is sufficient to implement the harmonic response analysis for the Lift off and LV flight stage only.
Harmonic (sinusoidal) response analysis procedure and results
Harmonic response analysis of the small satellite is carried out using harmonic response module in ANSYS workbench package. The boundary conditions during both cases fix the degrees of freedom at the points of joining the satellite structure to the selected launch vehicle and transportation container.
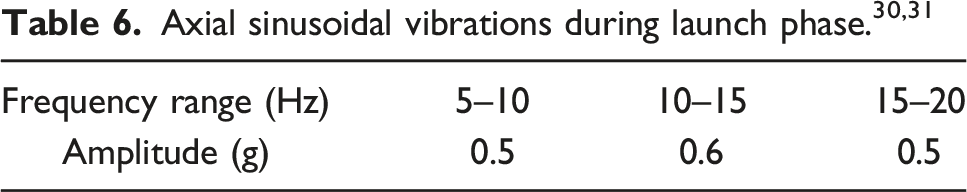
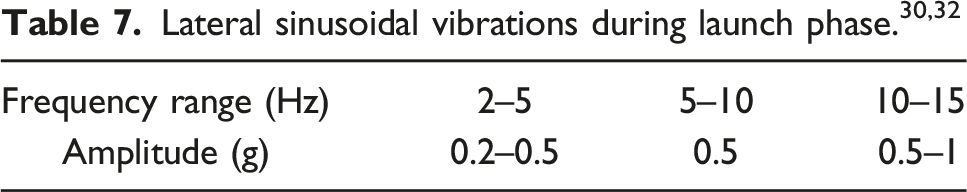
The harmonic load in ANSYS workbench is sinusoidal, fully reversed, with zero mean value, and without the gravitational effect. Such load is specified using three parameters: the resonance frequency, the amplitude, and the damping ratio. The resonance frequencies are the 18 sorted natural frequencies listed in Table 5, the damping ratio equals 0.05 for satellite structures design, 16 and the amplitude is listed in Table 9 based upon the load case and the frequency band.
The harmonic response analysis is calculated for the 18 sorted natural frequencies in both rail transportation and launch phases individually. The variation of the amplitude within each frequency band is linear on logarithmic scale of frequency. Thus, a linear interpolation is carried out to estimate the amplitude value (g) at each resonant frequency as follows: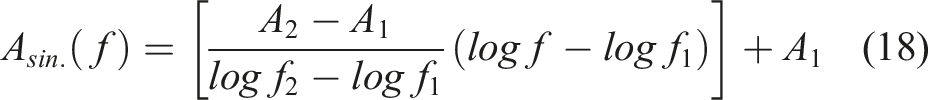
The harmonic analysis is implemented using mode superposition method which is the default in ANSYS Workbench. It utilizes the modal analysis results, so it is less computationally expensive than the full method.
29
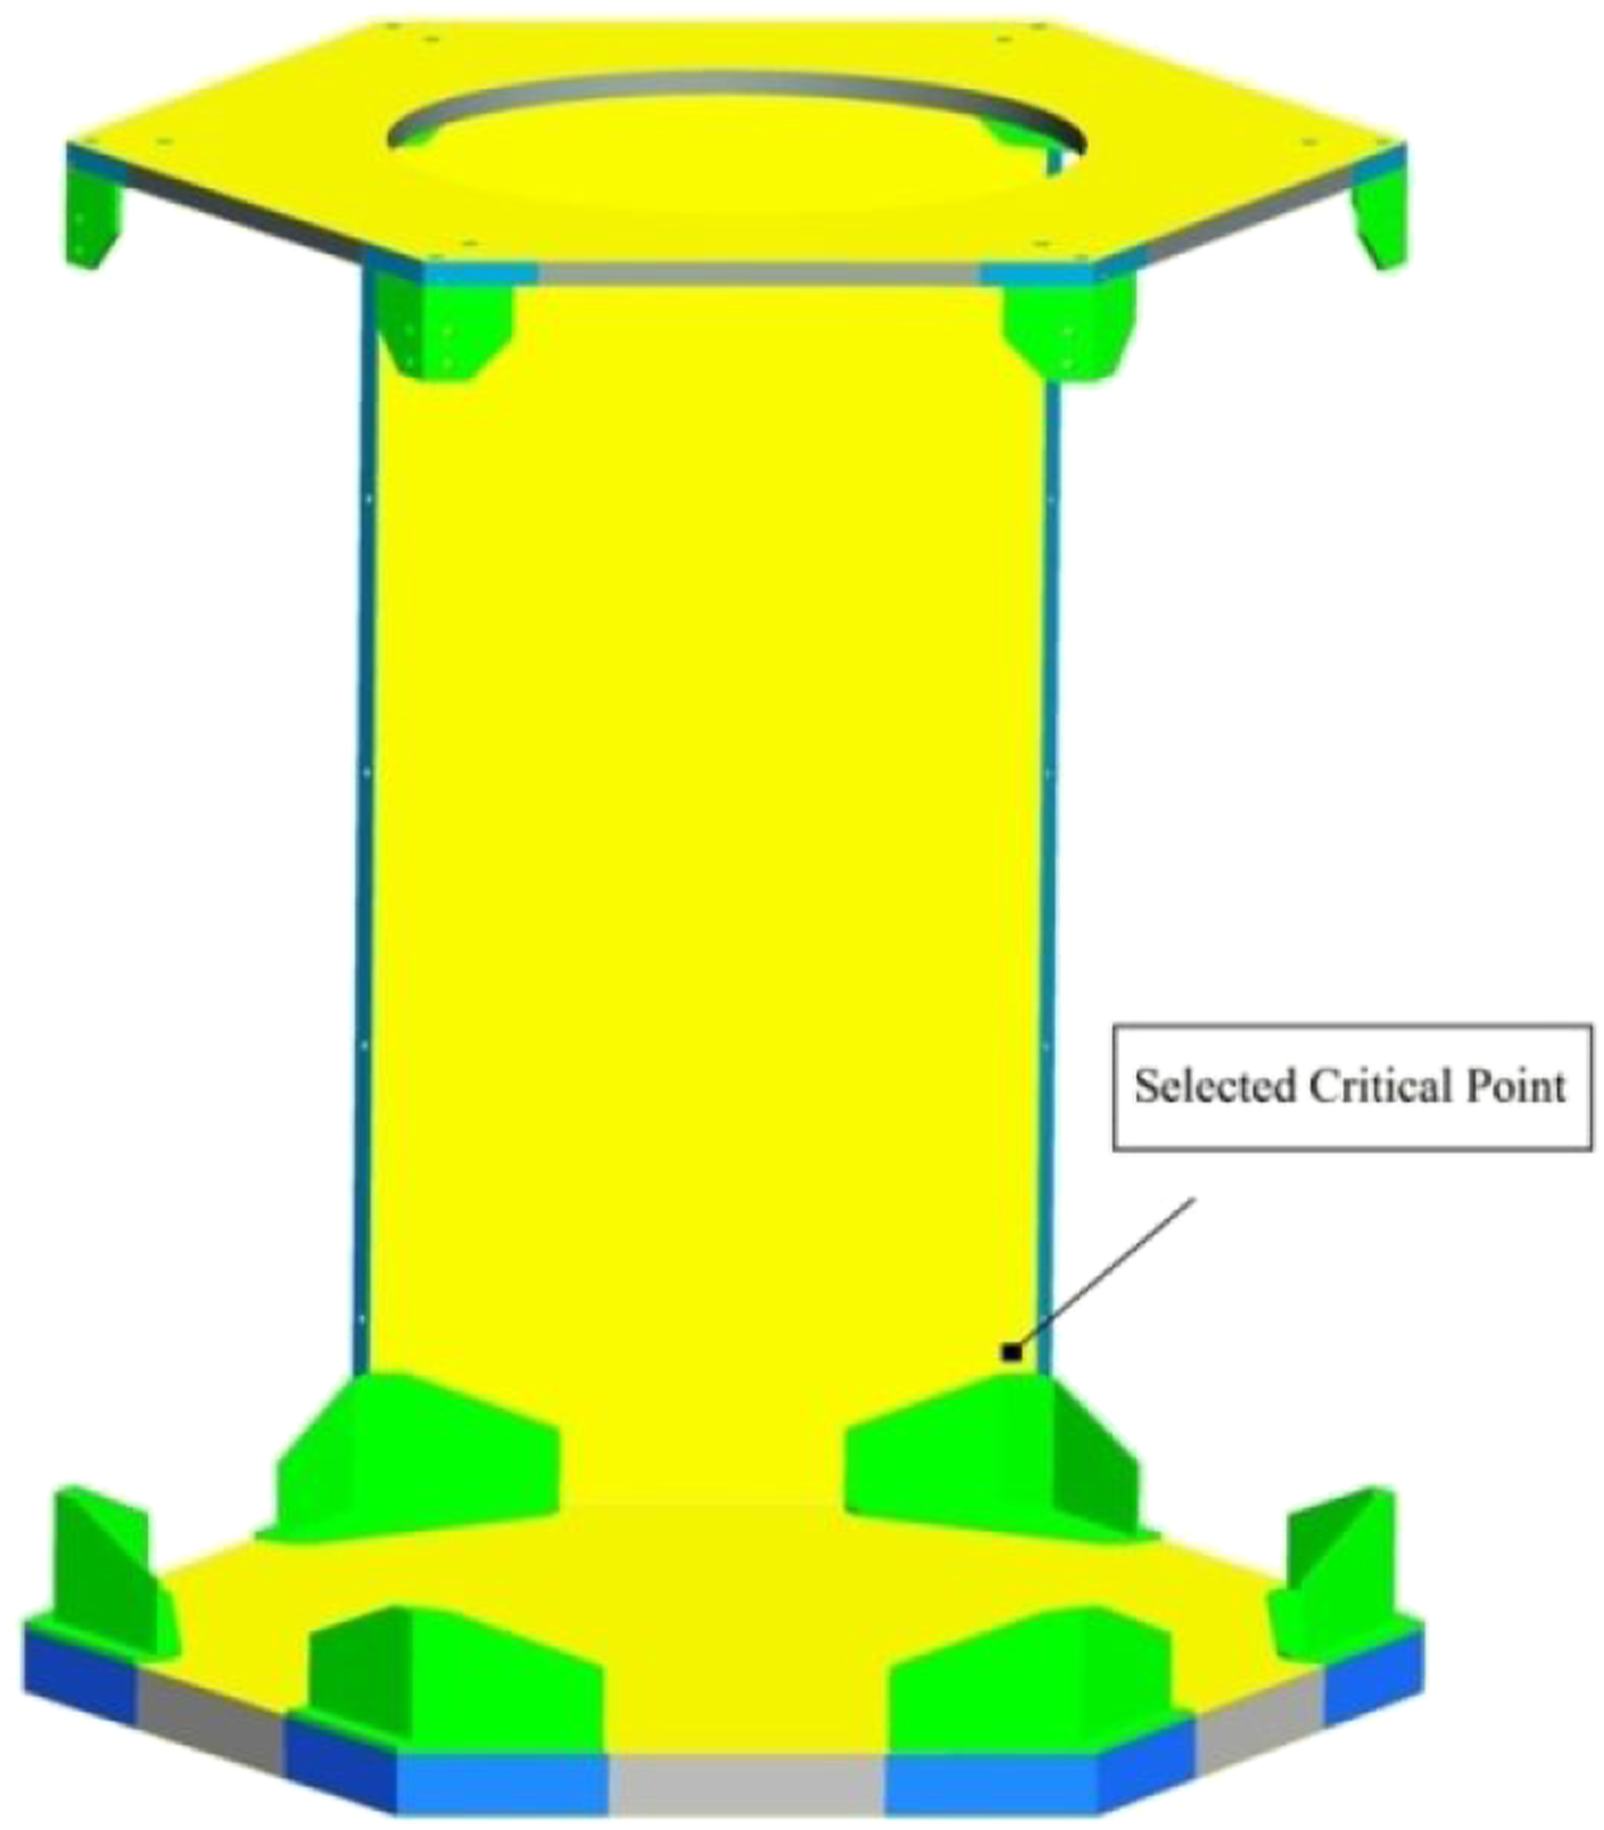
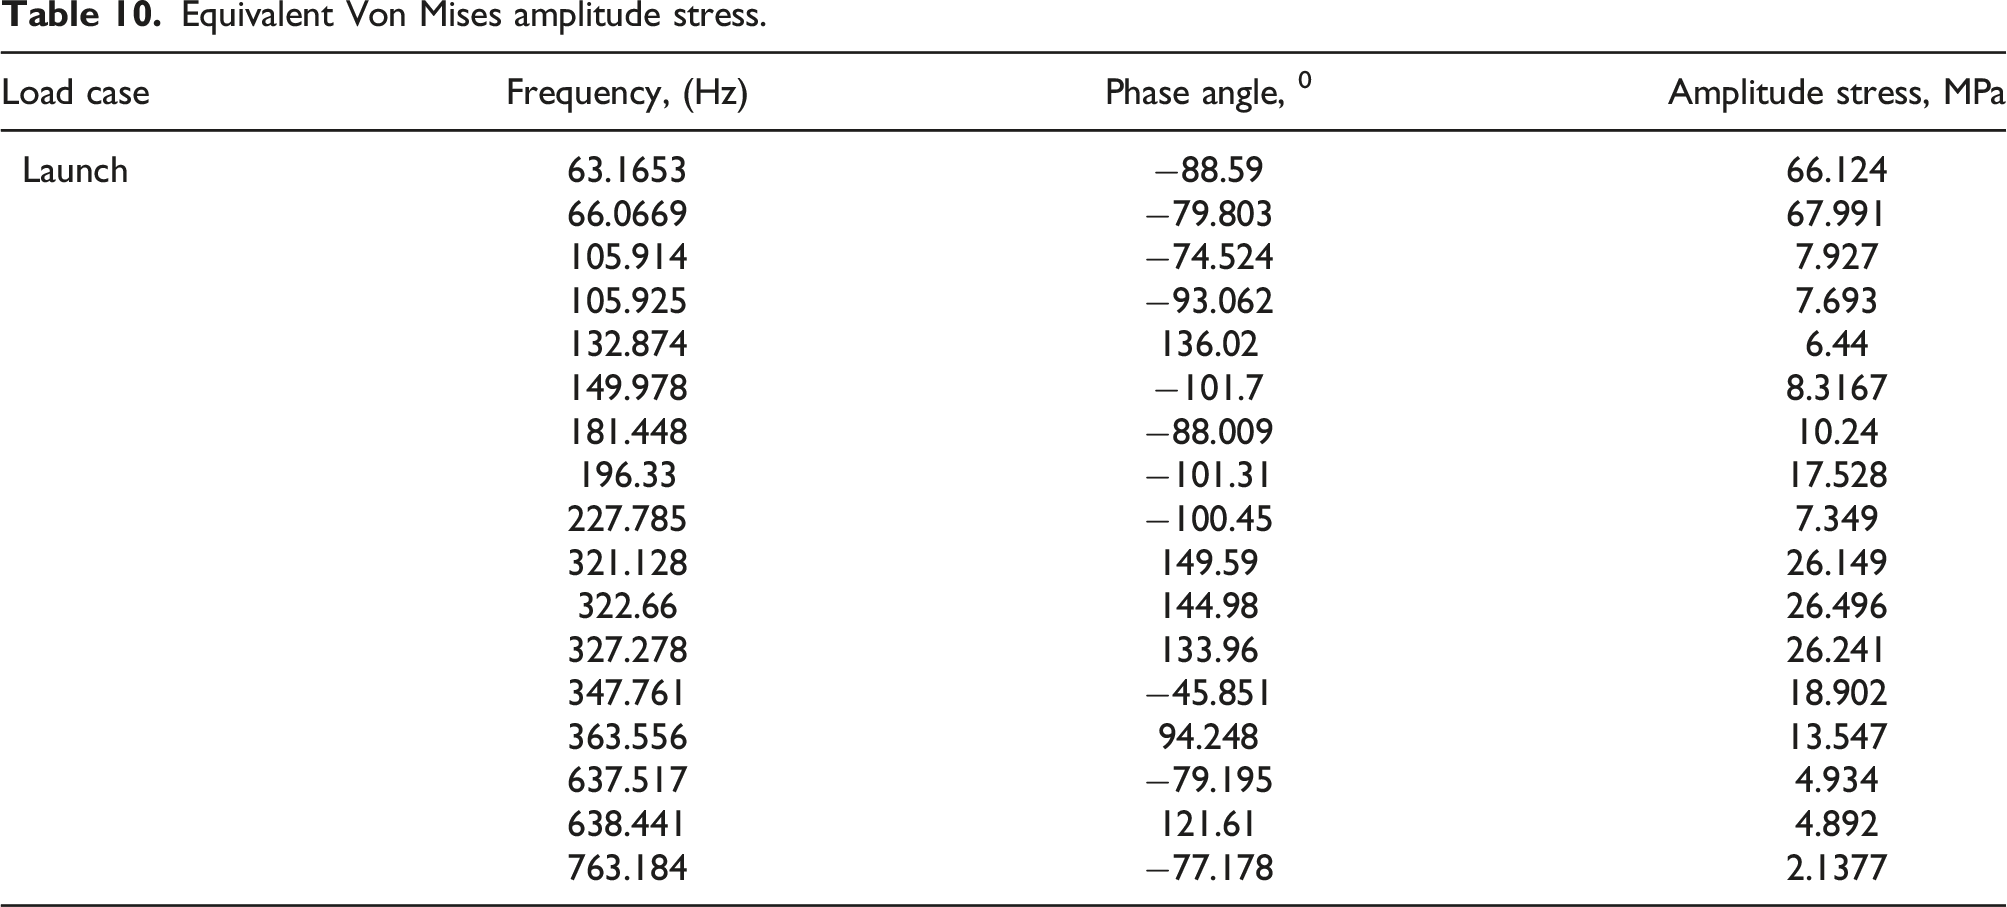
The output of the harmonic response analysis is the equivalent Von Mises amplitude stresses calculated as follows: Selected critical point for calculating equivalent amplitude stress.
Superposition of static and dynamic loads
During launch phase, harmonic loads do not affect the satellite structure separately, but they act concurrently with the quasi-static loads. The quasi-static loads include steady-state acceleration in addition to a dynamic component with frequency that is significantly lower than the satellite natural frequencies. 34
Equivalent Von Mises amplitude stress.
Total maximum equivalent stress.
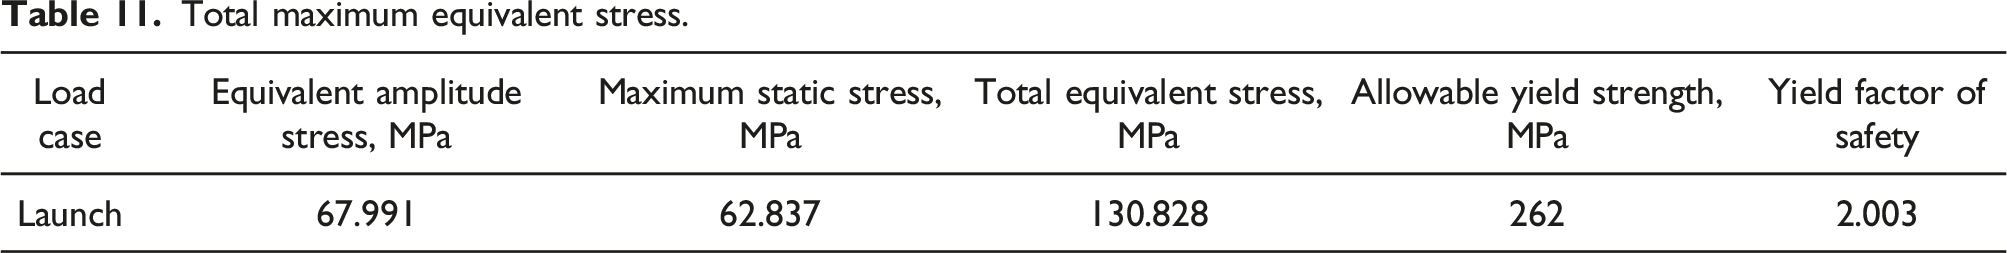
Based upon the safety factors, it can be denoted that the proposed satellite structure based upon stiffened honeycomb sandwich plates can withstand safely the simultaneous static and dynamic loads during launch phase. However, the high values of safety factors and buckling load factors, obtained during the satellite structural analysis, reveal that the proposed primary structure is still over-designed. Thus, structural optimization is inevitable in the design process of the satellite structure as it leads to an efficient structural design.
Satellite structural optimization
The satellite optimization process starts initially with formulating the optimization problem. Subsequently, miscellaneous optimization techniques utilizing ANSYS workbench capabilities represented in “DesignXplorer” module are employed. Finally, the results obtained are compared with one obtained from a MATLAB code based upon both genetic and sequential quadratic programming (SQP) algorithms.
Satellite optimization problem formulation
The following three-step formulation procedure is used in the satellite optimization problem:
Definition of design variables. The first step in the formulation process is to identify a set of variables that are capable of describing the system. The design variables of the satellite optimization problem are specified as follows: P
1
: thickness of LEP honeycomb core, P
2
: thickness of LEP facing sheets, P
3
: thickness of UEP honeycomb core, P
4
: thickness of UEP facing sheets, P
5
: thickness of side panels honeycomb core, and P
6
: thickness of side panels facing sheets.
Optimization criterion (objective). Optimization criterion is so called the objective function for the optimization problem. A criterion that needs to be minimized is denoted by cost function. In this research, the objective function is to minimize the satellite total mass “M” and thus minimizing the satellite structural mass (Equipment mass is constant).
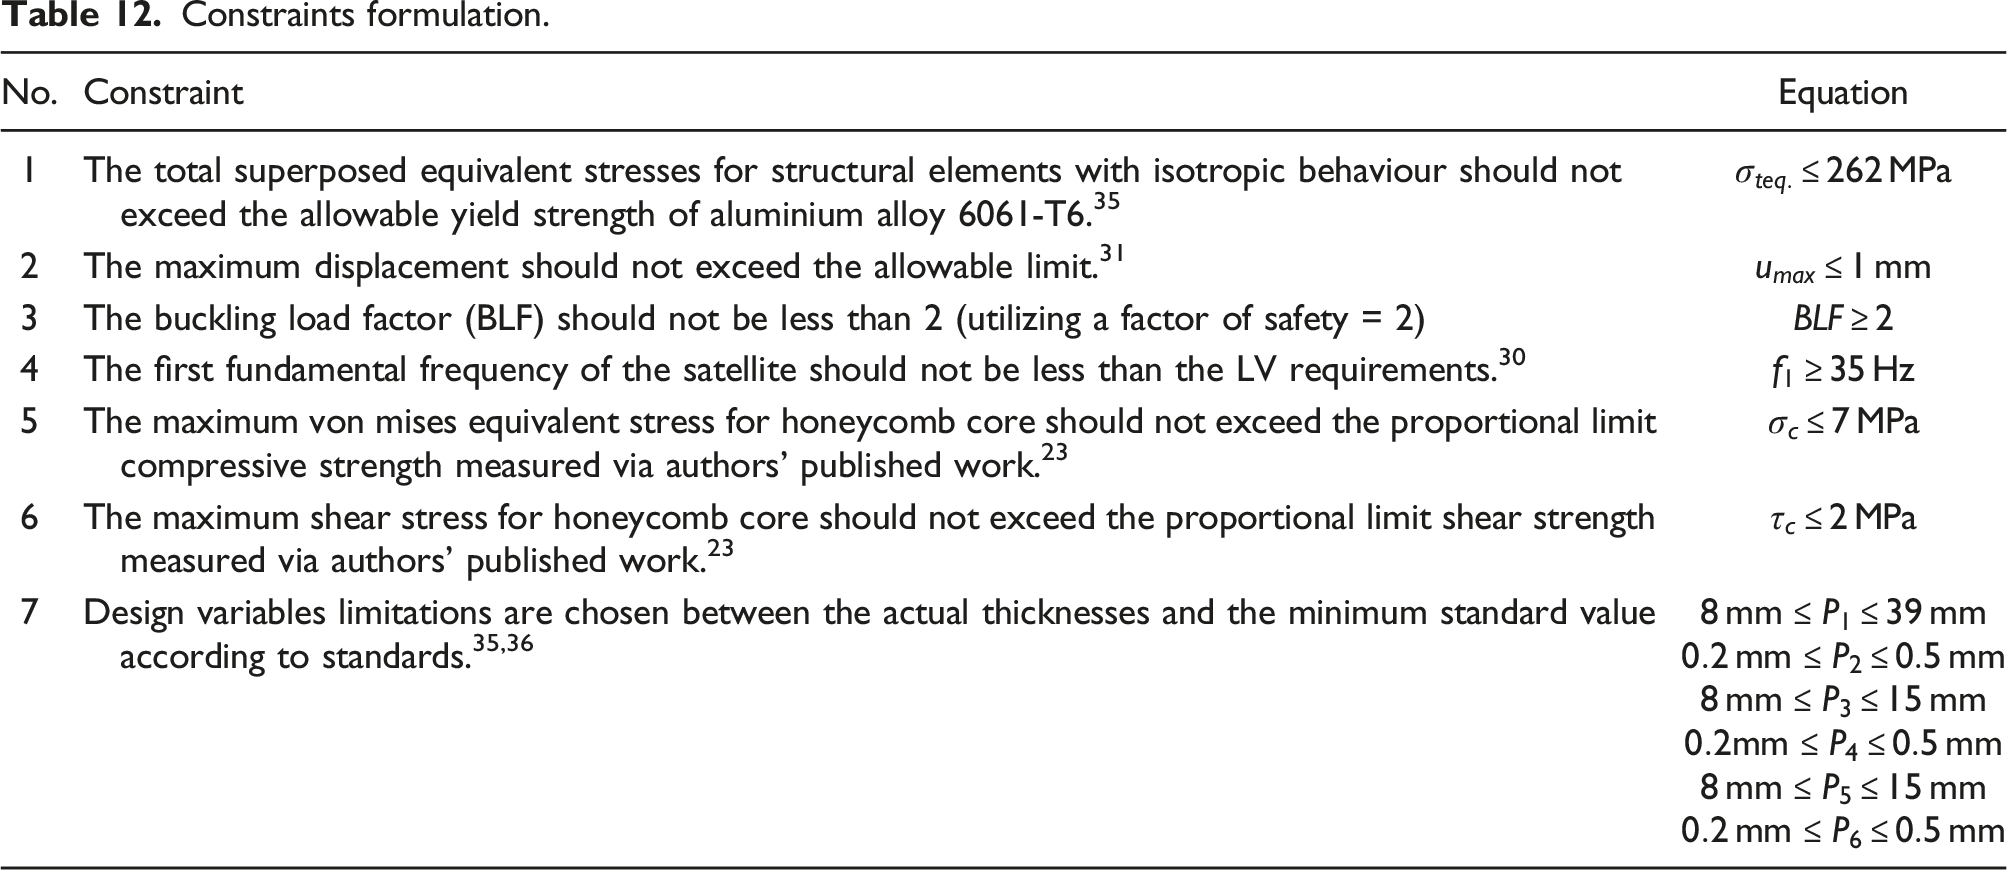
Formulation of constraints. The final step in the formulation process is to classify the constraints and establish appropriate expressions for them. In this research, the constraints are evolved from the miscellaneous implemented analyses during the critical launch phase as listed in Table 12.
Constraints formulation.
Adaptive multiple-objective algorithm using ANSYS
Adaptive multiple-objective (AMO) is a hybrid algorithm that utilizes a combination of both genetic algorithms and Kriging within “Direct Optimization” module in ANSYS workbench software. It uses the same procedure as Multi-objective Genetic Algorithm (MOGA), but a Kriging response surface is employed; part of the population is “simulated” by evaluations of the Kriging and the Kriging error predictor minimizes the number of evaluations used in finding the global optimum. The AMO scheme is shown in Figure 4. AMO flow chart.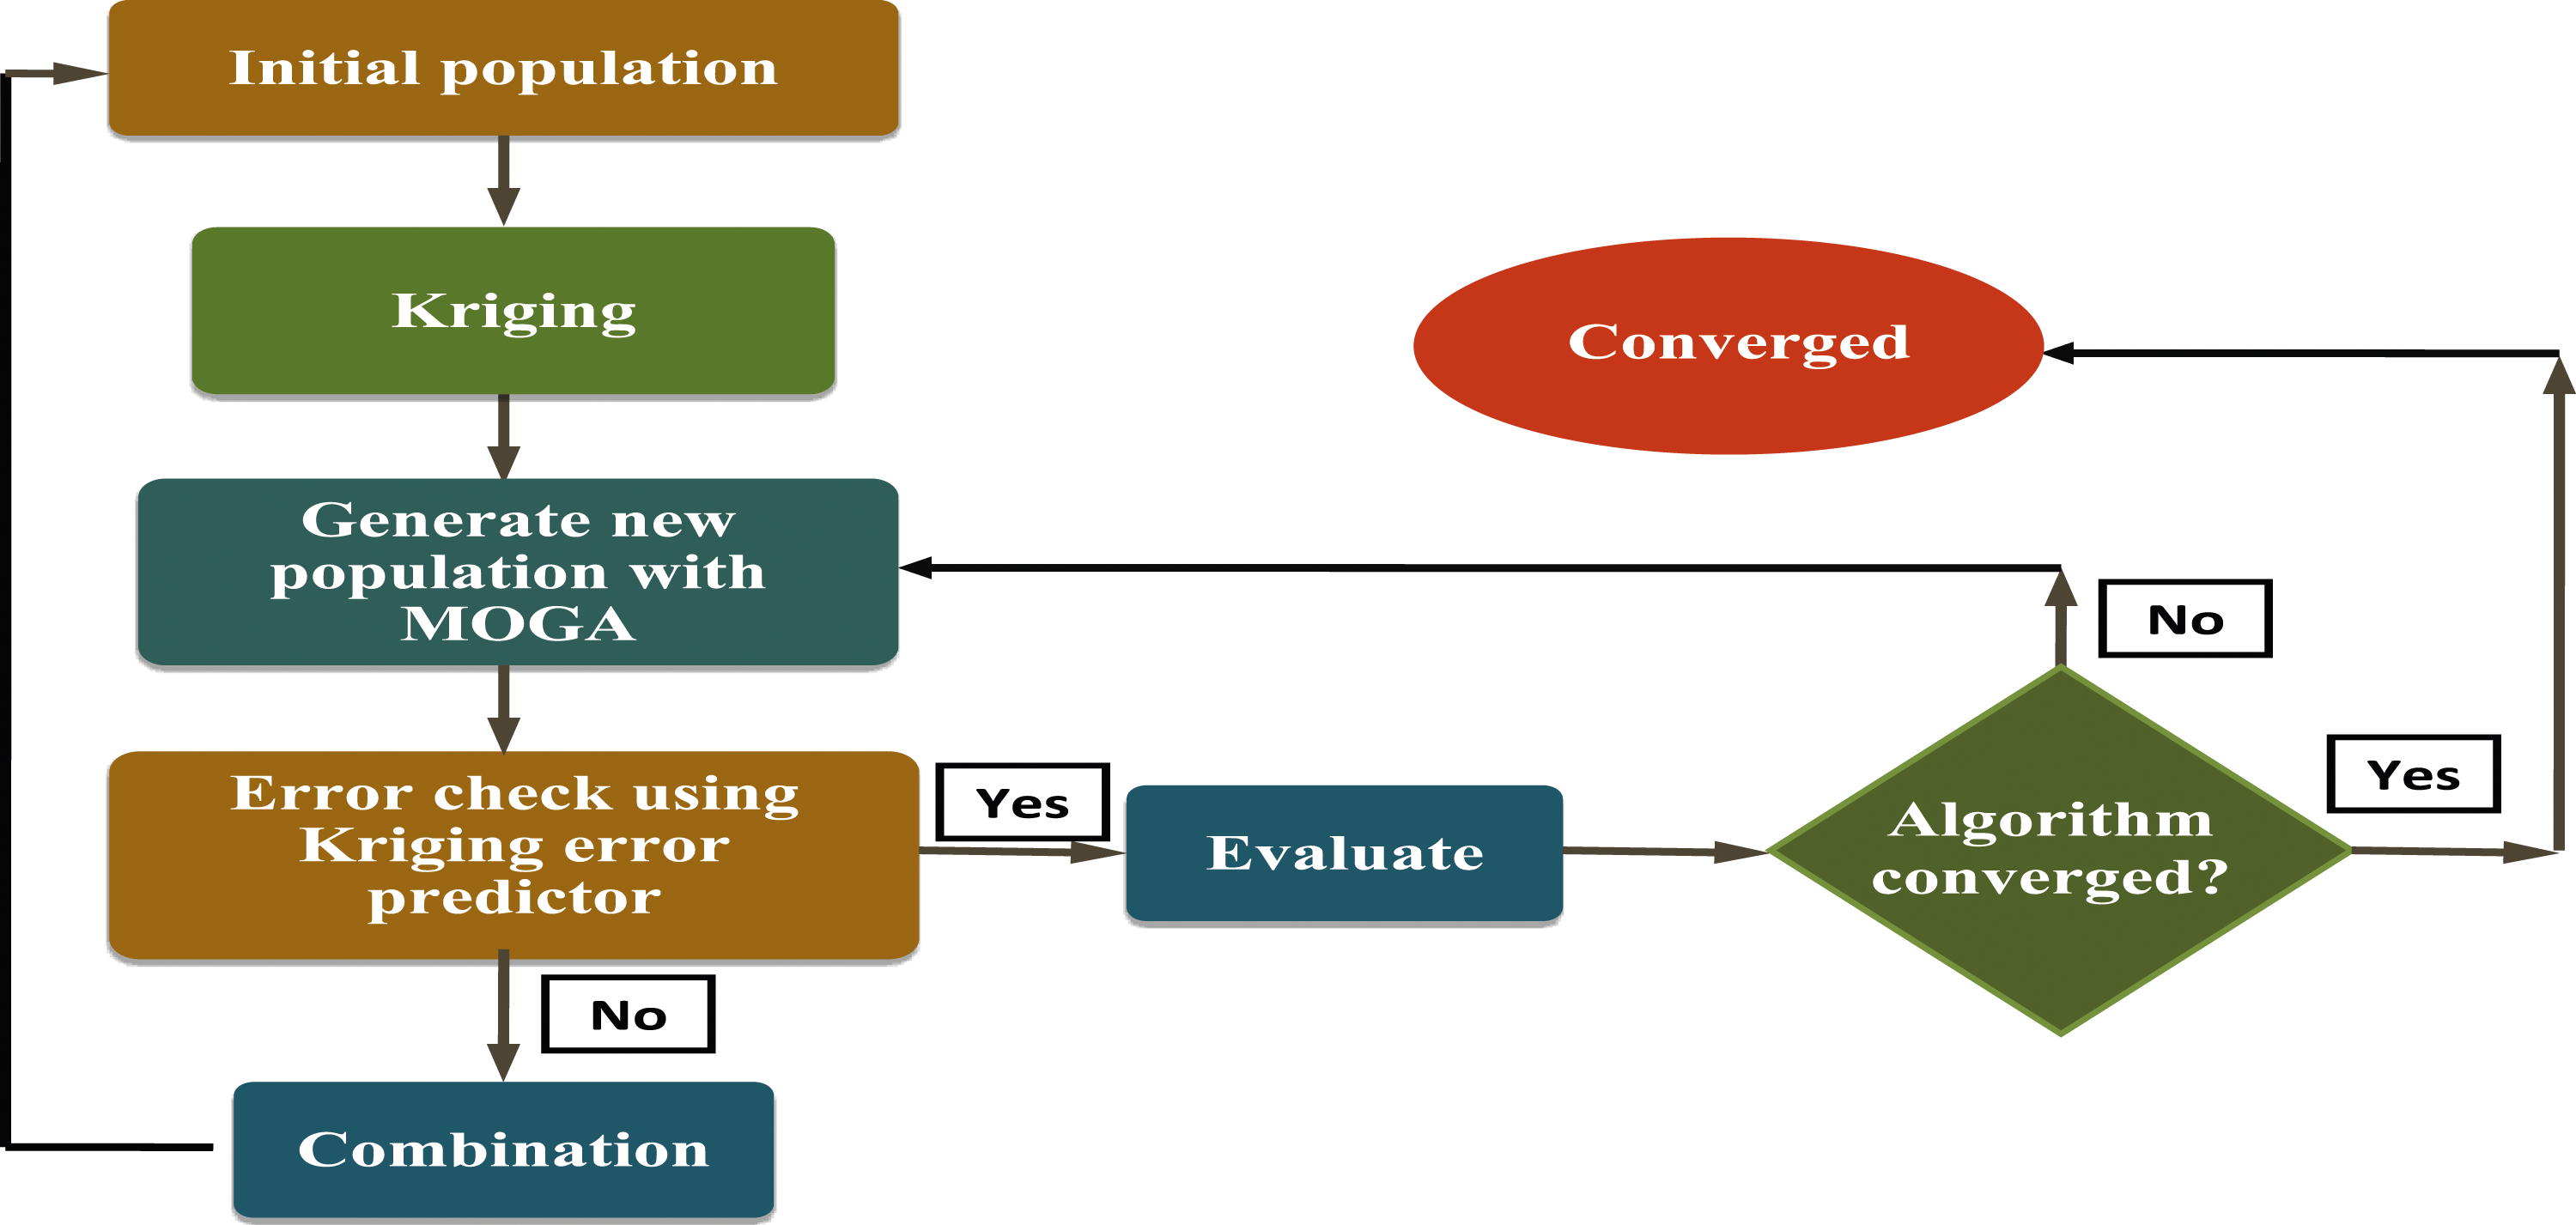
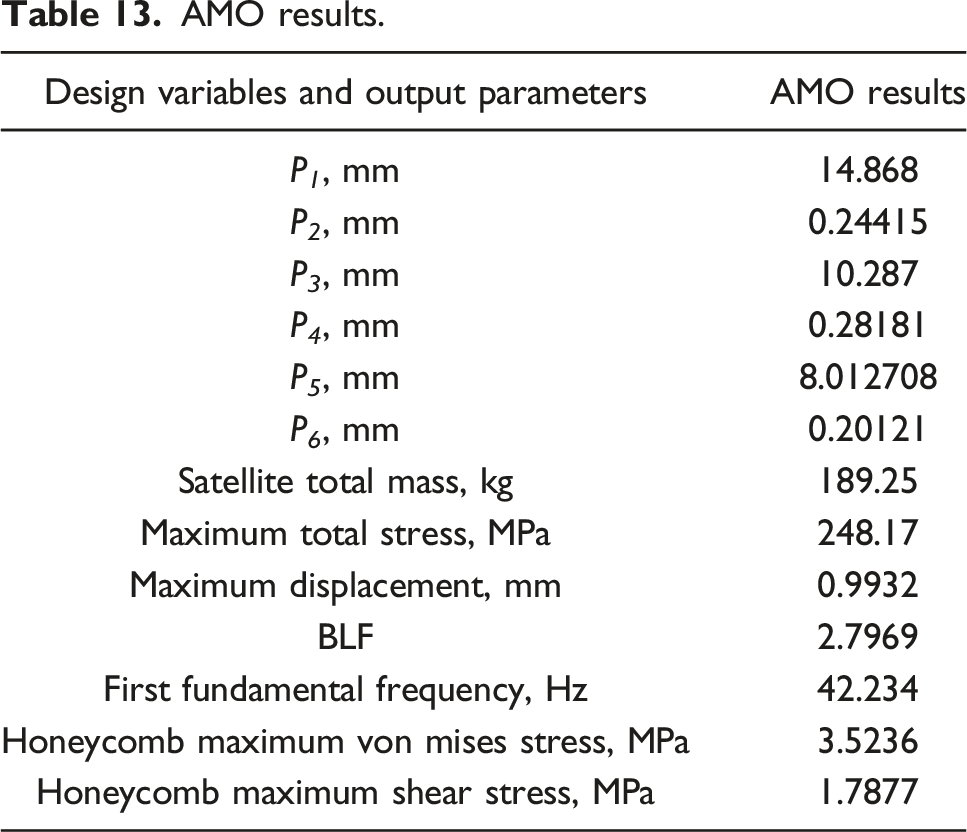
AMO results.
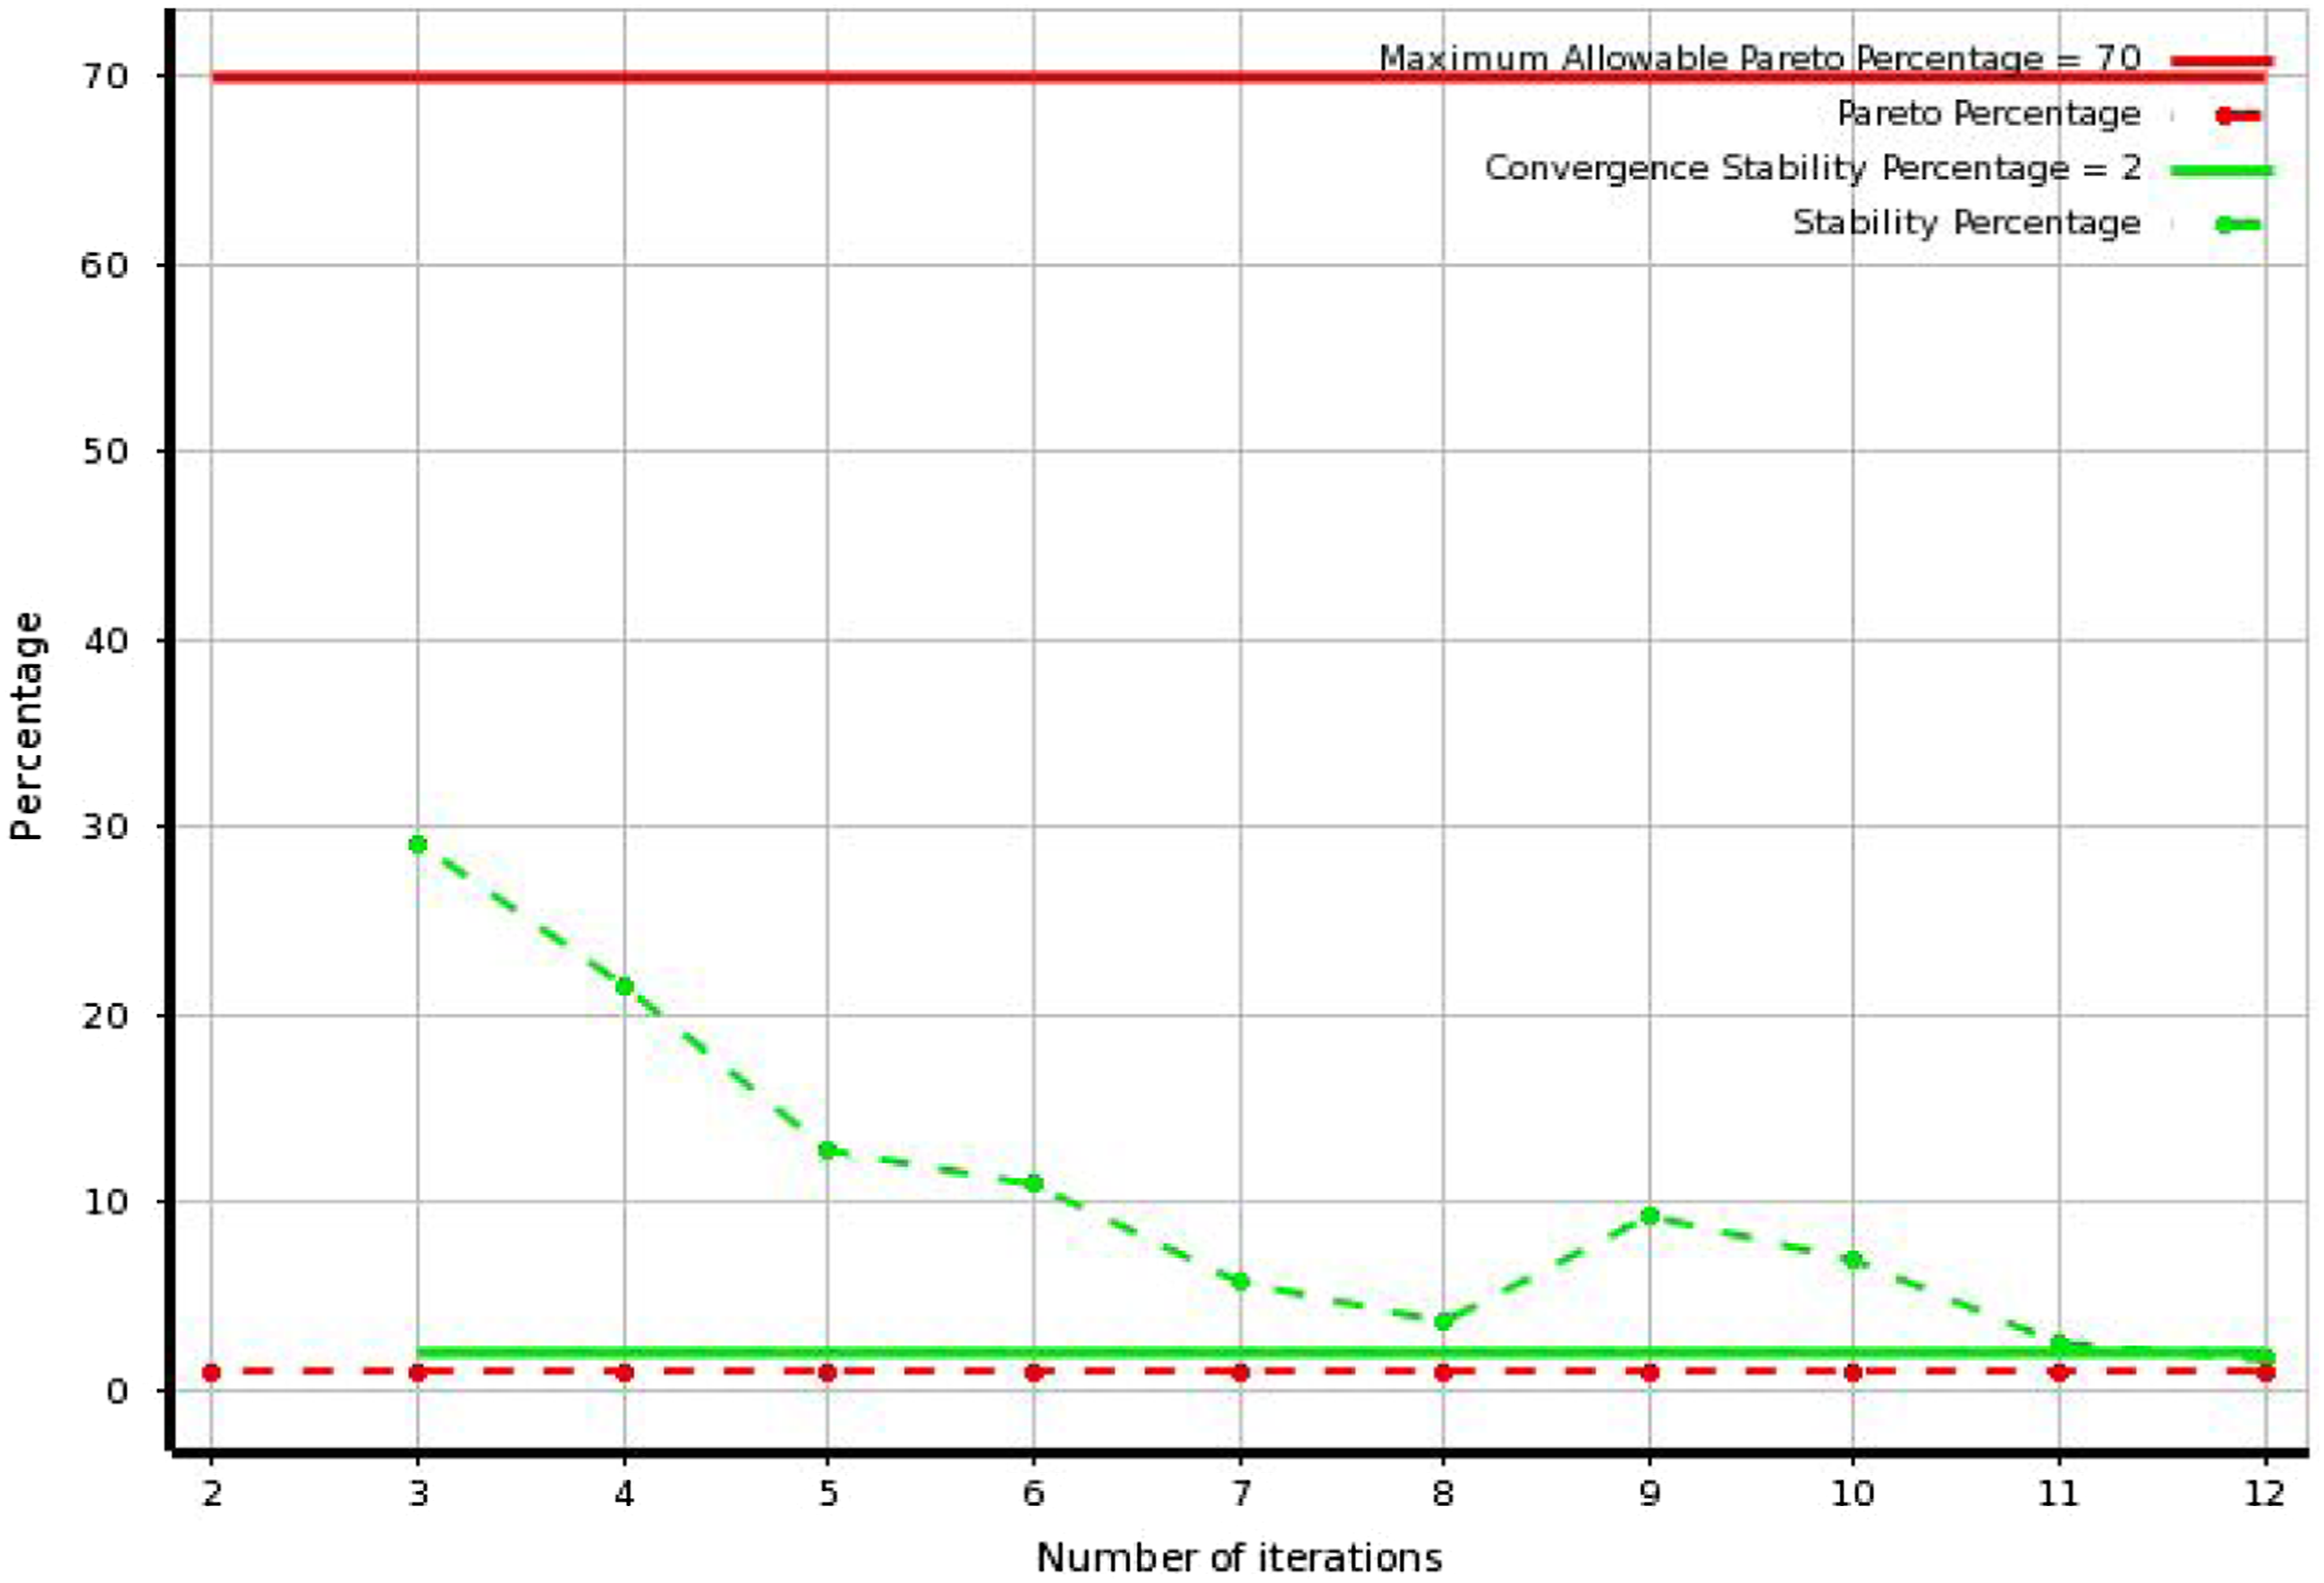
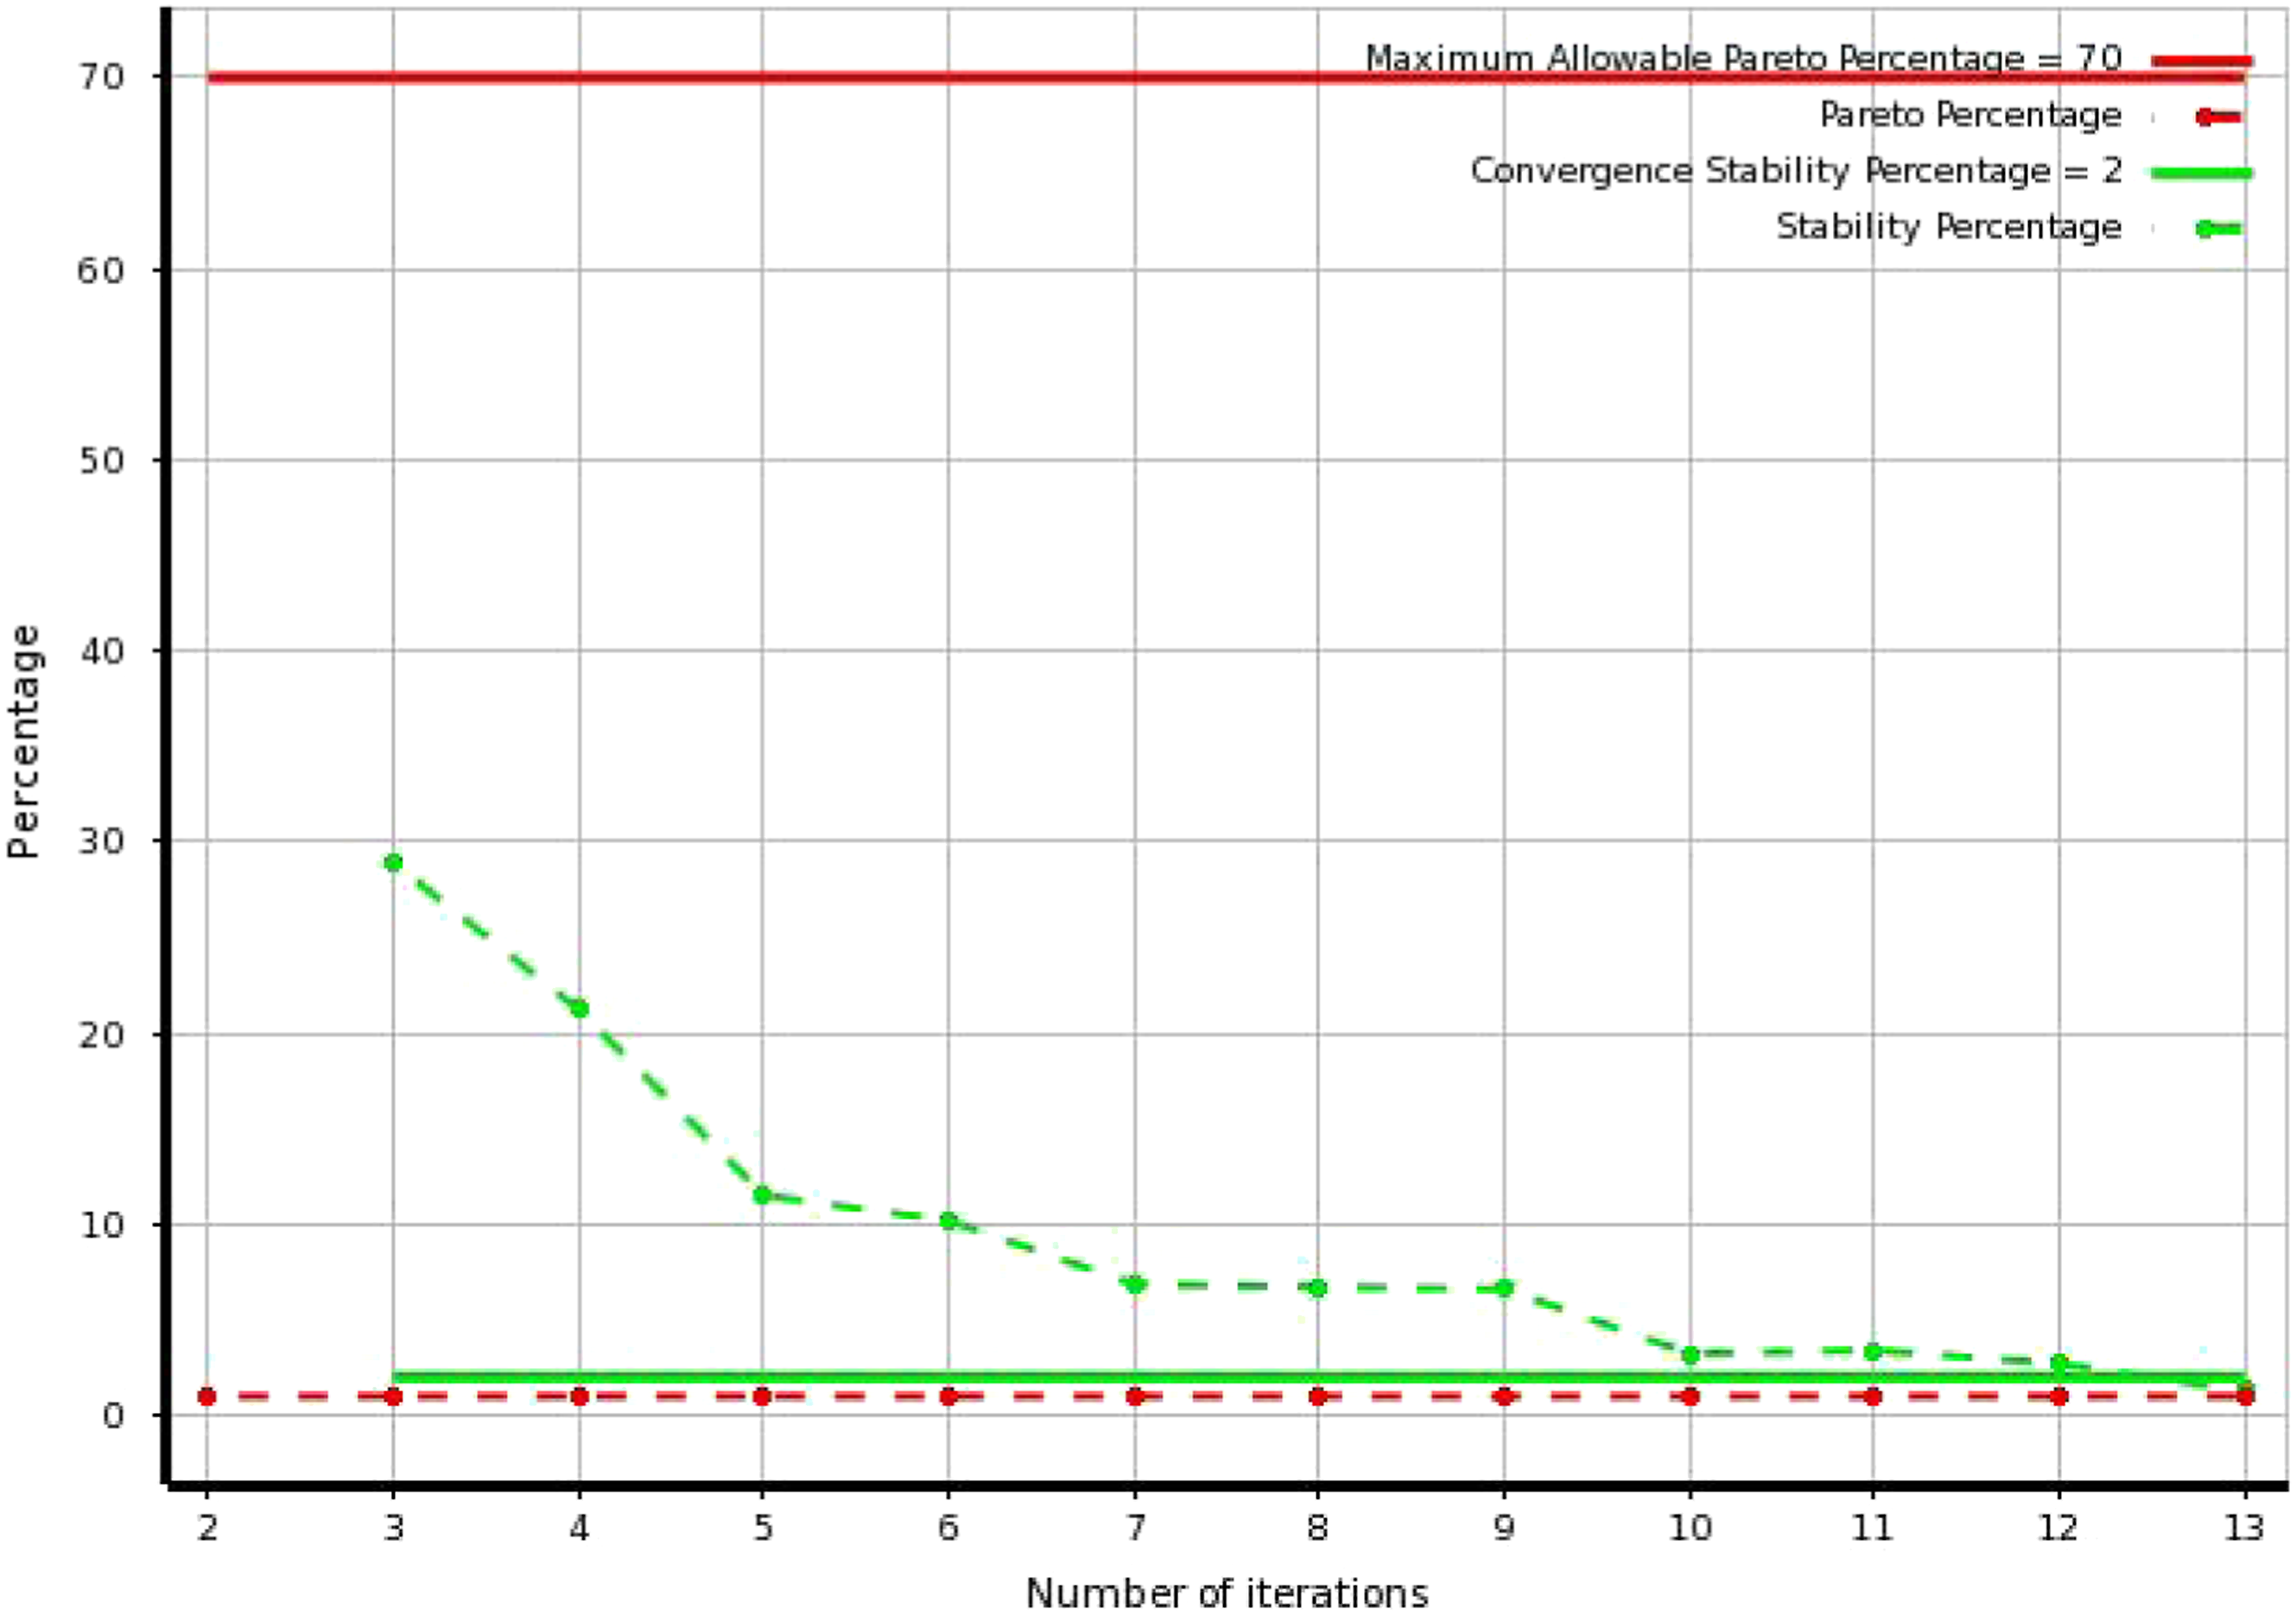
Adaptive multiple-objective converges when the maximum allowable Pareto percentage or the convergence stability percentage has been reached.
37
In this research, after 10 iterations, AMO converges as the convergence stability percentage reaches 2% as shown in Figure 5. AMO convergence.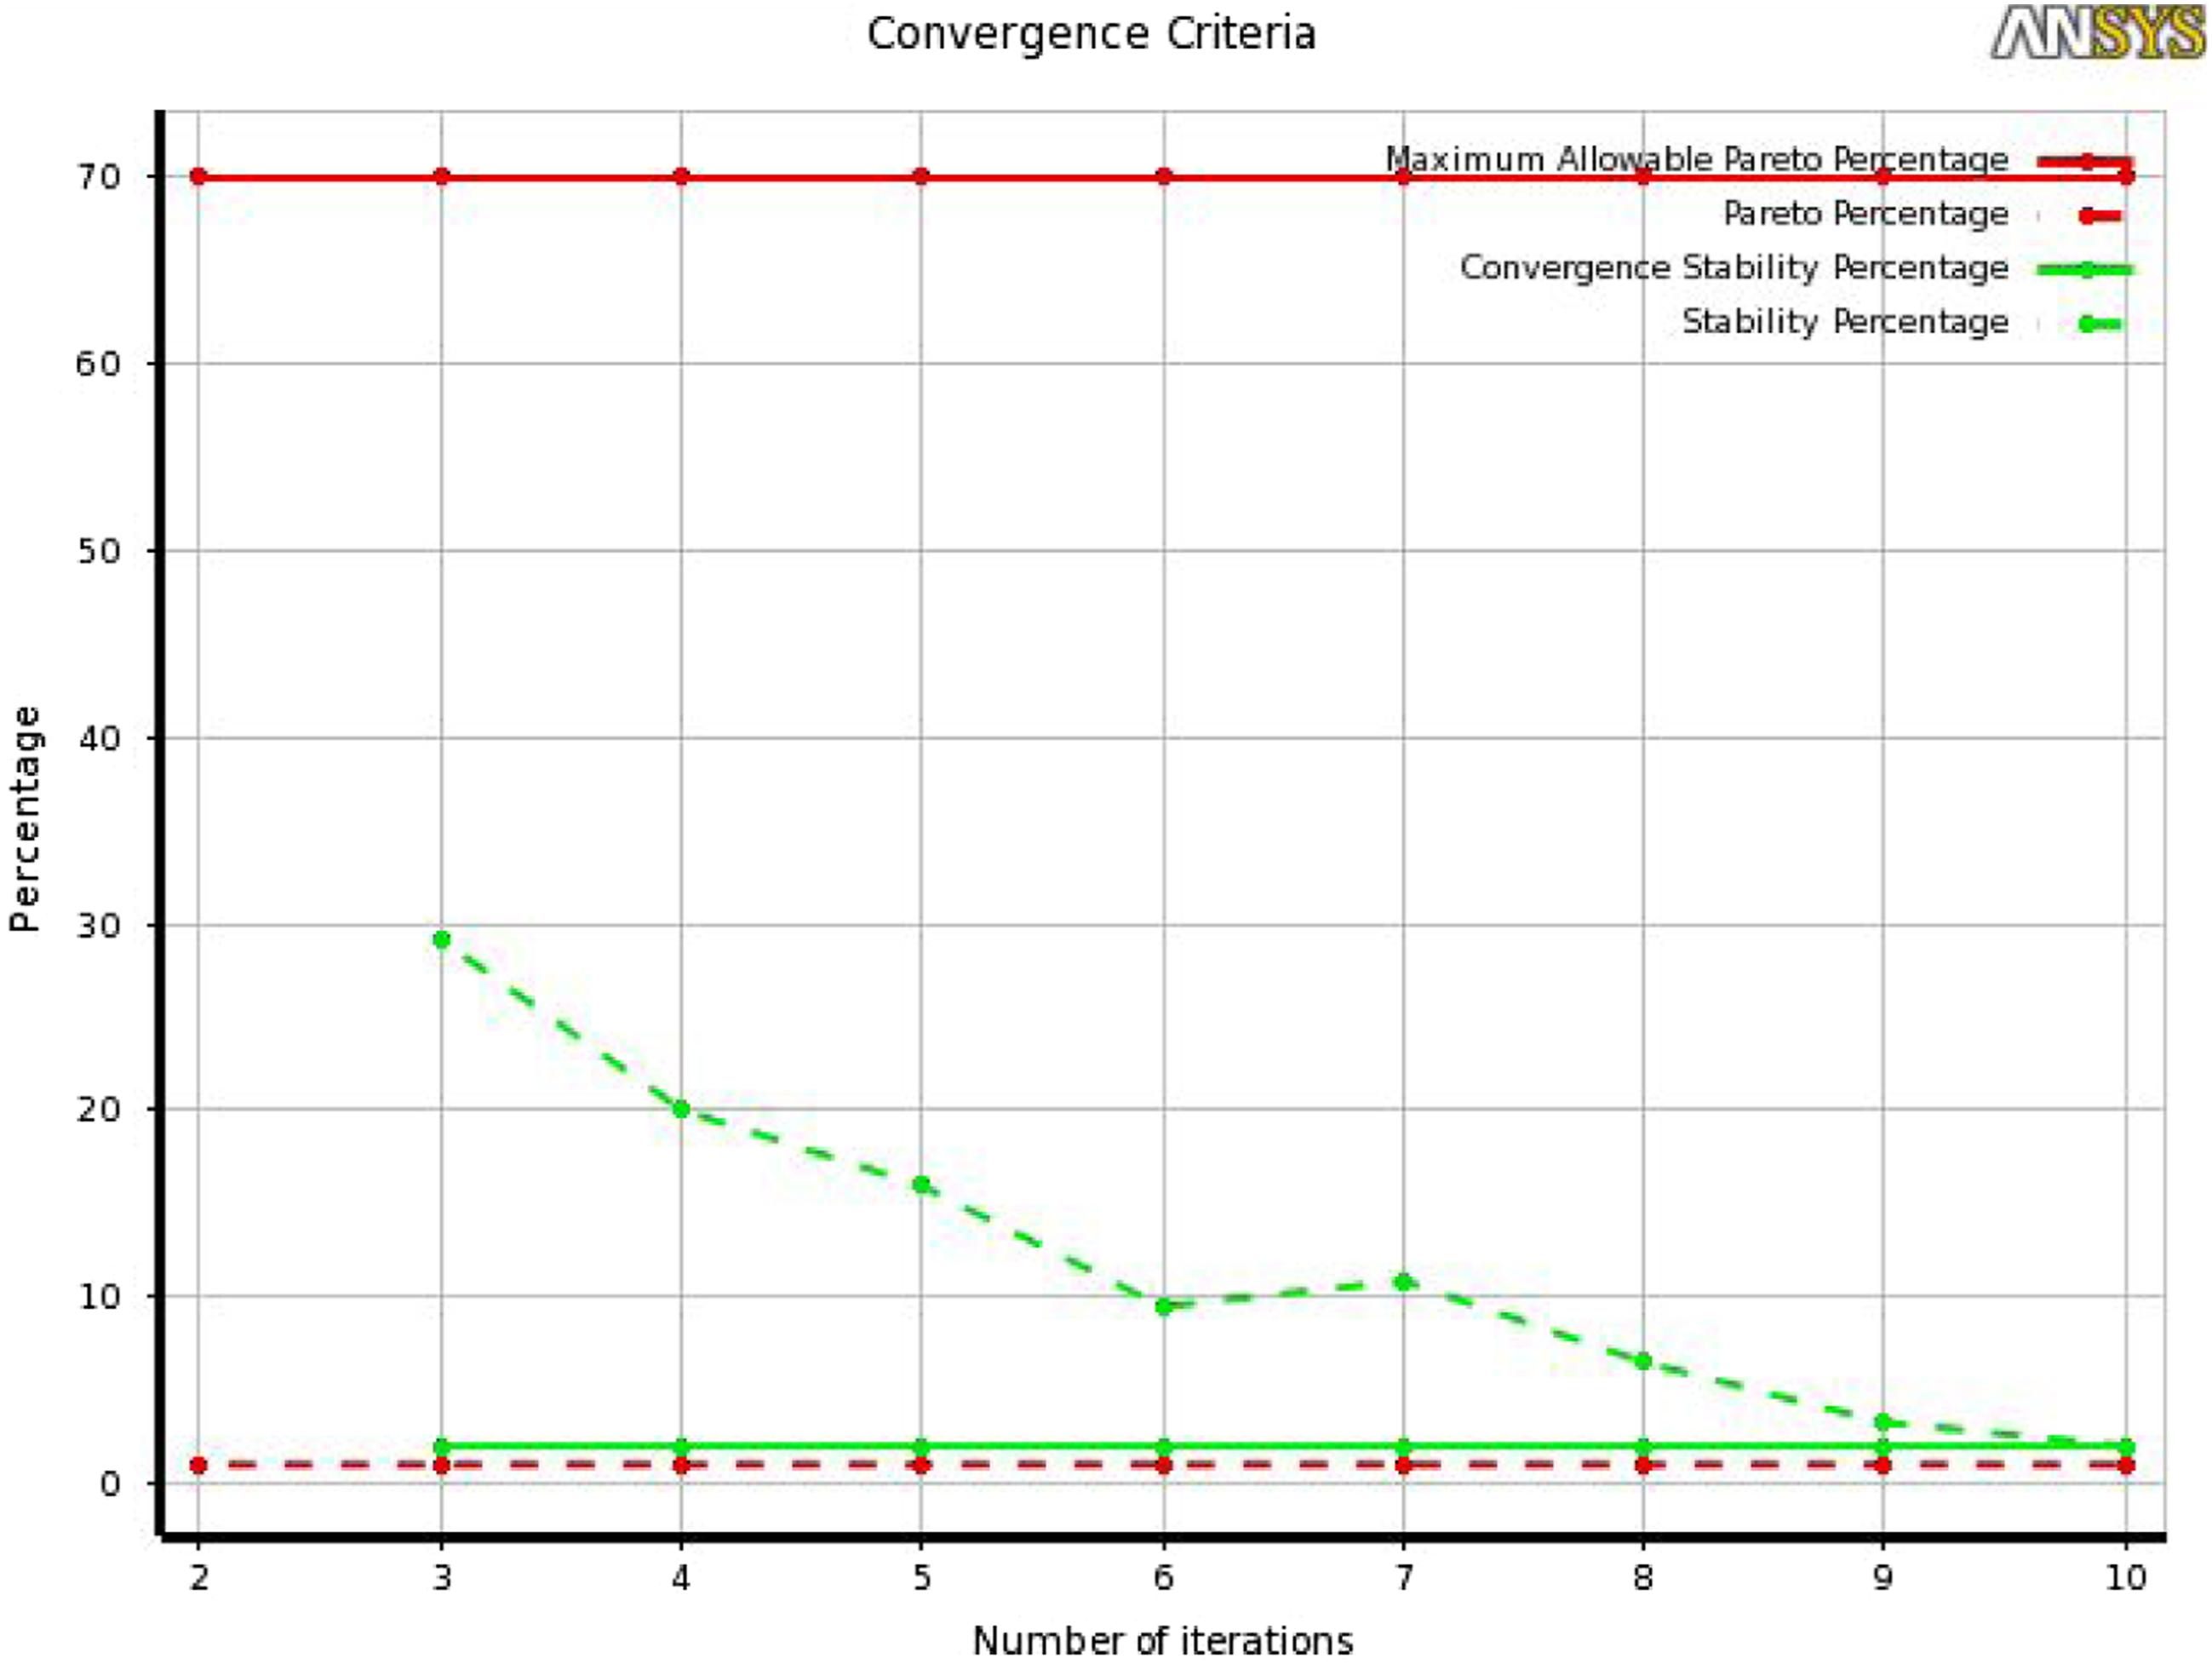
Based upon the previously-mentioned results, AMO algorithm succeeds in finding a candidate point with approximately 30% structural mass reduction in the proposed satellite structure with stiffened honeycomb sandwich panels. Nevertheless, simulating 591 evaluations is still considered of high computational expense. Thus, employing approximate techniques as Response Surface Method (RSM) and kriging is inevitable in the structural optimization process of the small satellite.
Response surface optimization using ANSYS
Response surface optimization is an indirect optimization technique that relies on building a meta-model using approximation techniques. It derives its data from the Response Surface component depending on the quality of such surface. RSO is a three-component system within ANSYS workbench “DesignXplorer” module. It is composed of three modules in ANSYS workbench: design of experiments (DOE), response surface method (RSM), and finally applying the optimization technique.
Design of experiments
DOE is a statistical tool intended to minimize the number of highly computational expense experiments while maximizing the data gain from such experiments. It tends clearly to locate efficiently the minimum number of the sampling points in the design space while increasing the accuracy of the response surface derived from them.
37
In this research, optimum space filling (OSF) algorithm is employed as an effective type of DOE algorithms. Originally, OSF is an optimized Latin Hypercube Sampling Design (LHSD), while acquiring a homogeneous space distribution of points. The number of sampling points relies on CCD algorithm formula as follows: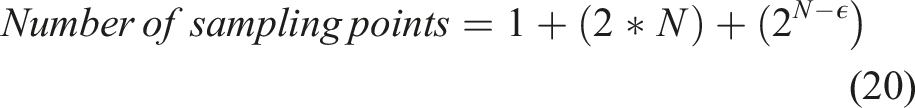
Response surface method
Response surface method or meta-modeling or surrogate models refer to a simple mathematical relationship between input parameters and output response that is based on a limited data derived from DOE. Such relationship is a smooth approximation for severely nonlinear, discontinuous, and non-convex or even locally undefined objective and constraint functions of complex finite element models.
Popular techniques include polynomial regression, kriging, and radial basis neural network. In this research, heavy emphasis is placed on both full second order polynomial regression and kriging.
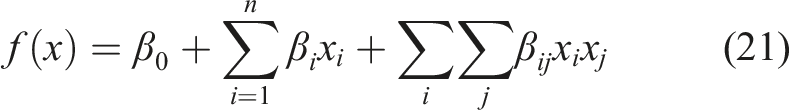
Full second order polynomial model
Such model is employed according to the following form:
38
Kriging
Kriging is a meta-modeling algorithm that is capable of supporting an improved response quality. It is a combination of the aforementioned polynomial model 
The effectiveness of such algorithm is based on the ability of its internal error estimator to improve the response surface quality by generating refinement points and adding them to the areas of the response surface most in need of improvement.
37
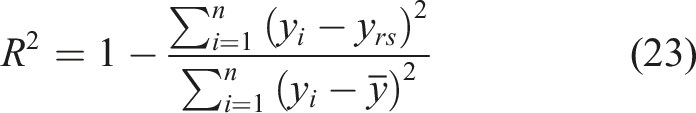
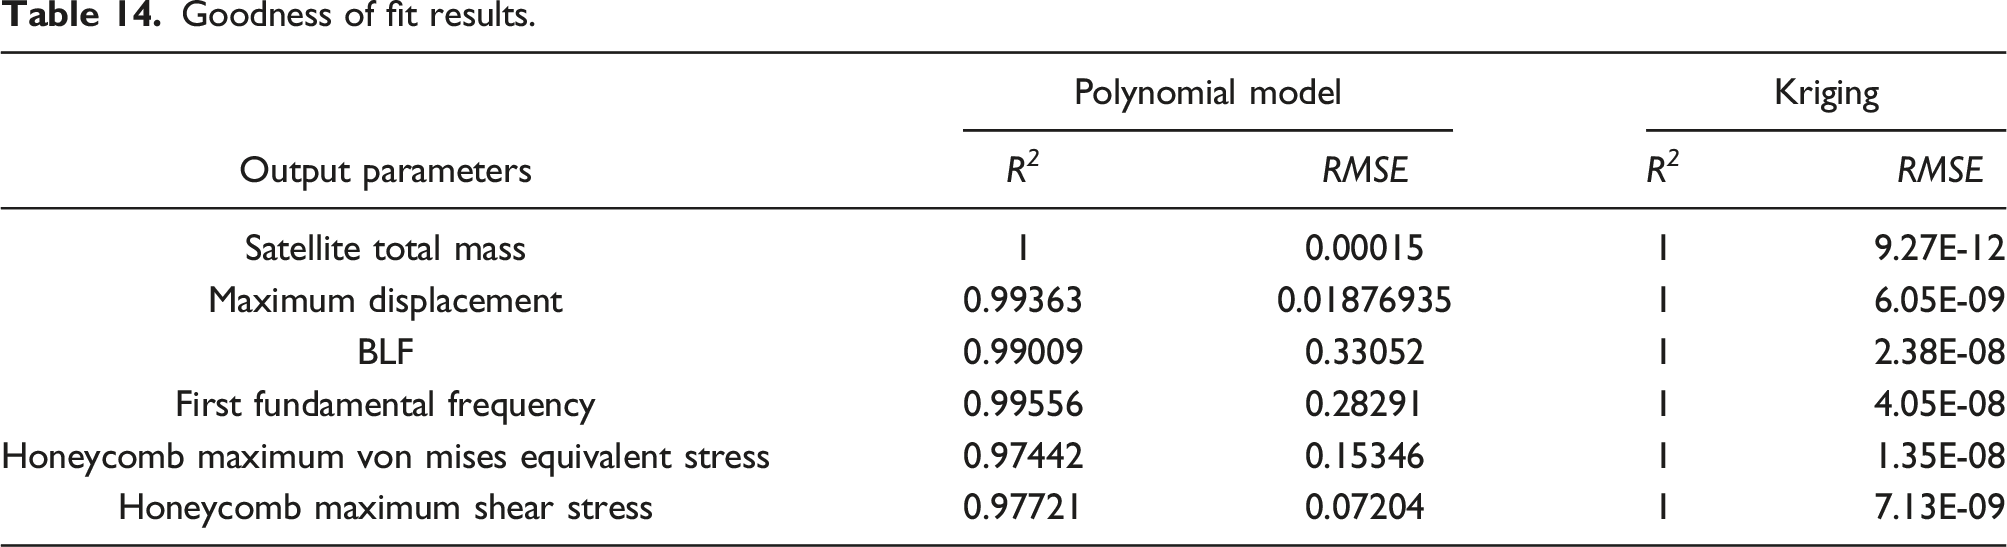
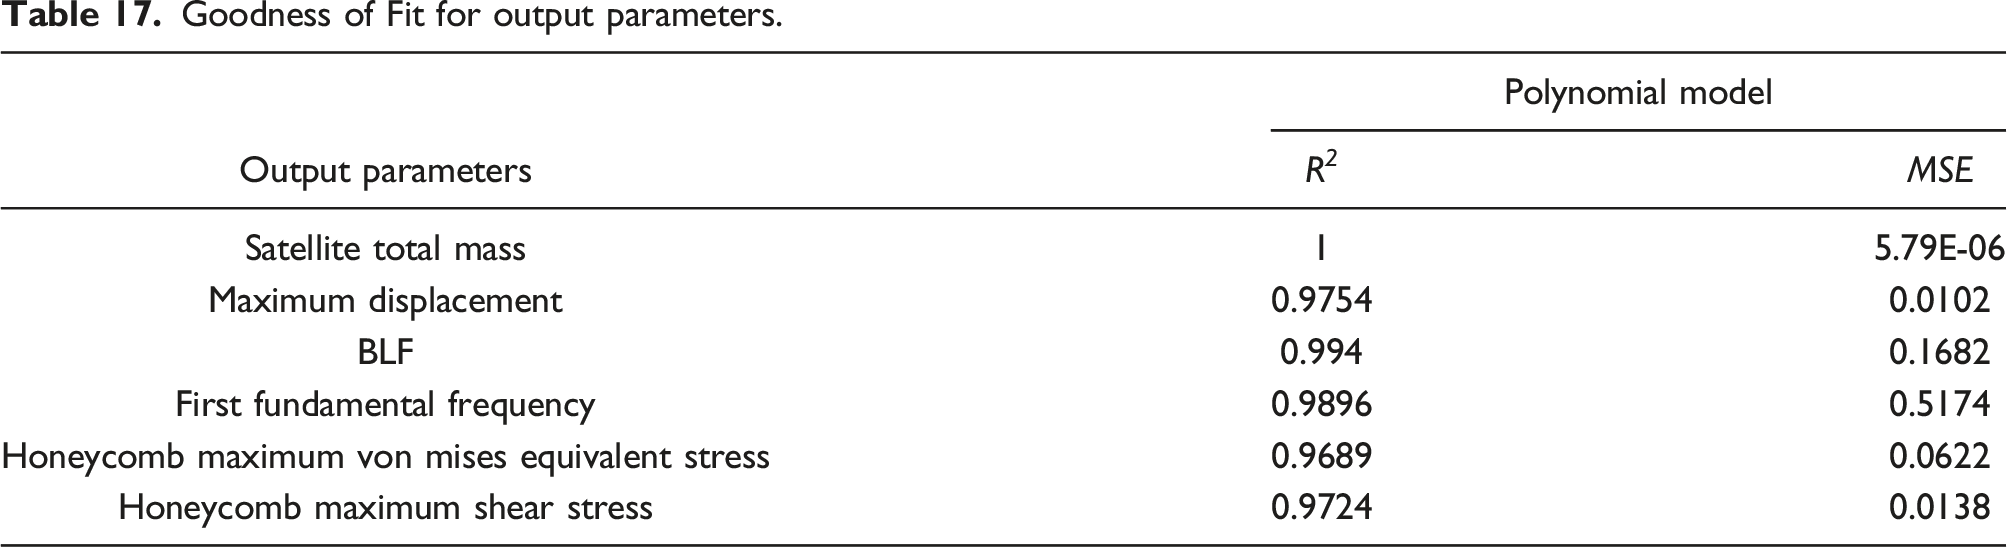
In order to check the accuracy of the built response surface, Goodness of Fit is estimated for each output parameter. It includes the following parameters: - Coefficient of determination (R
2
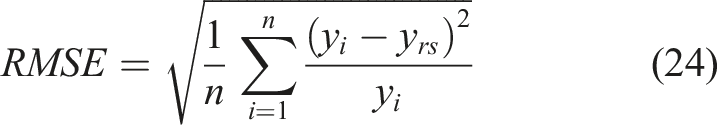
):37,38 it is the percentage of variation of the output parameter, the best value is 1. - Relative root mean square error (RMSE):37,38 it is the square root of the average square error divided by the true values of the output parameter, best value is 0%.
Goodness of fit results.
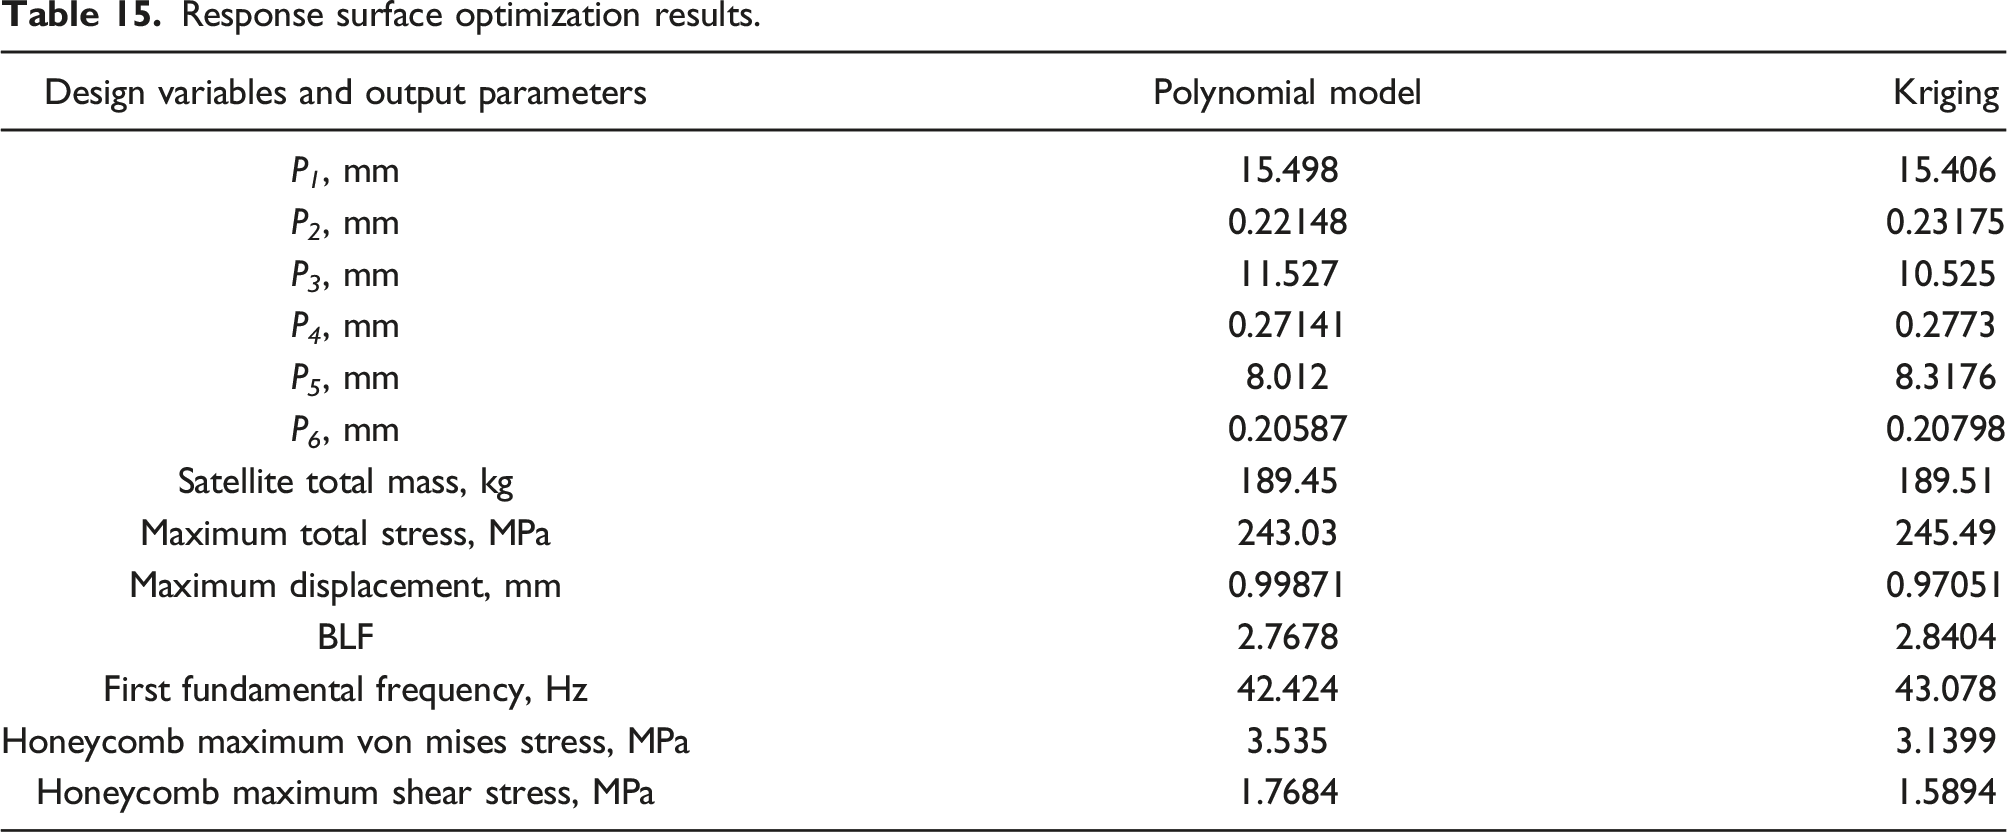
Optimization module
Response surface optimization results.
MOGA convergence concerning polynomial model.
MOGA convergence concerning kriging model.
Figures 8 and 9 show a comparison between AMO, polynomial, and kriging models results concerning both objective function value (satellite total mass) and input design variables values. Objective function comparison (AMO, polynomial, and kriging). Design variables comparison (AMO, polynomial, and kriging).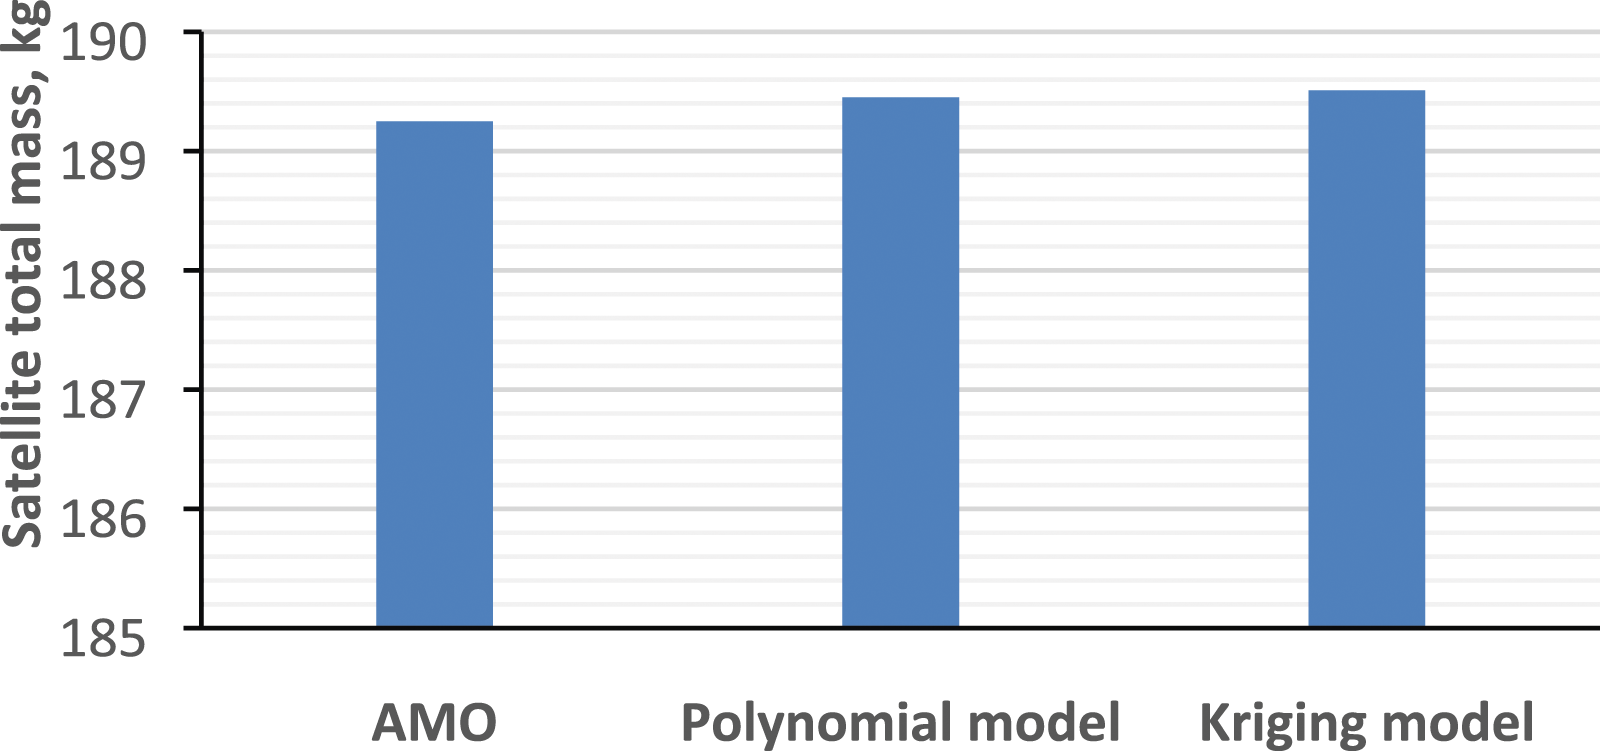
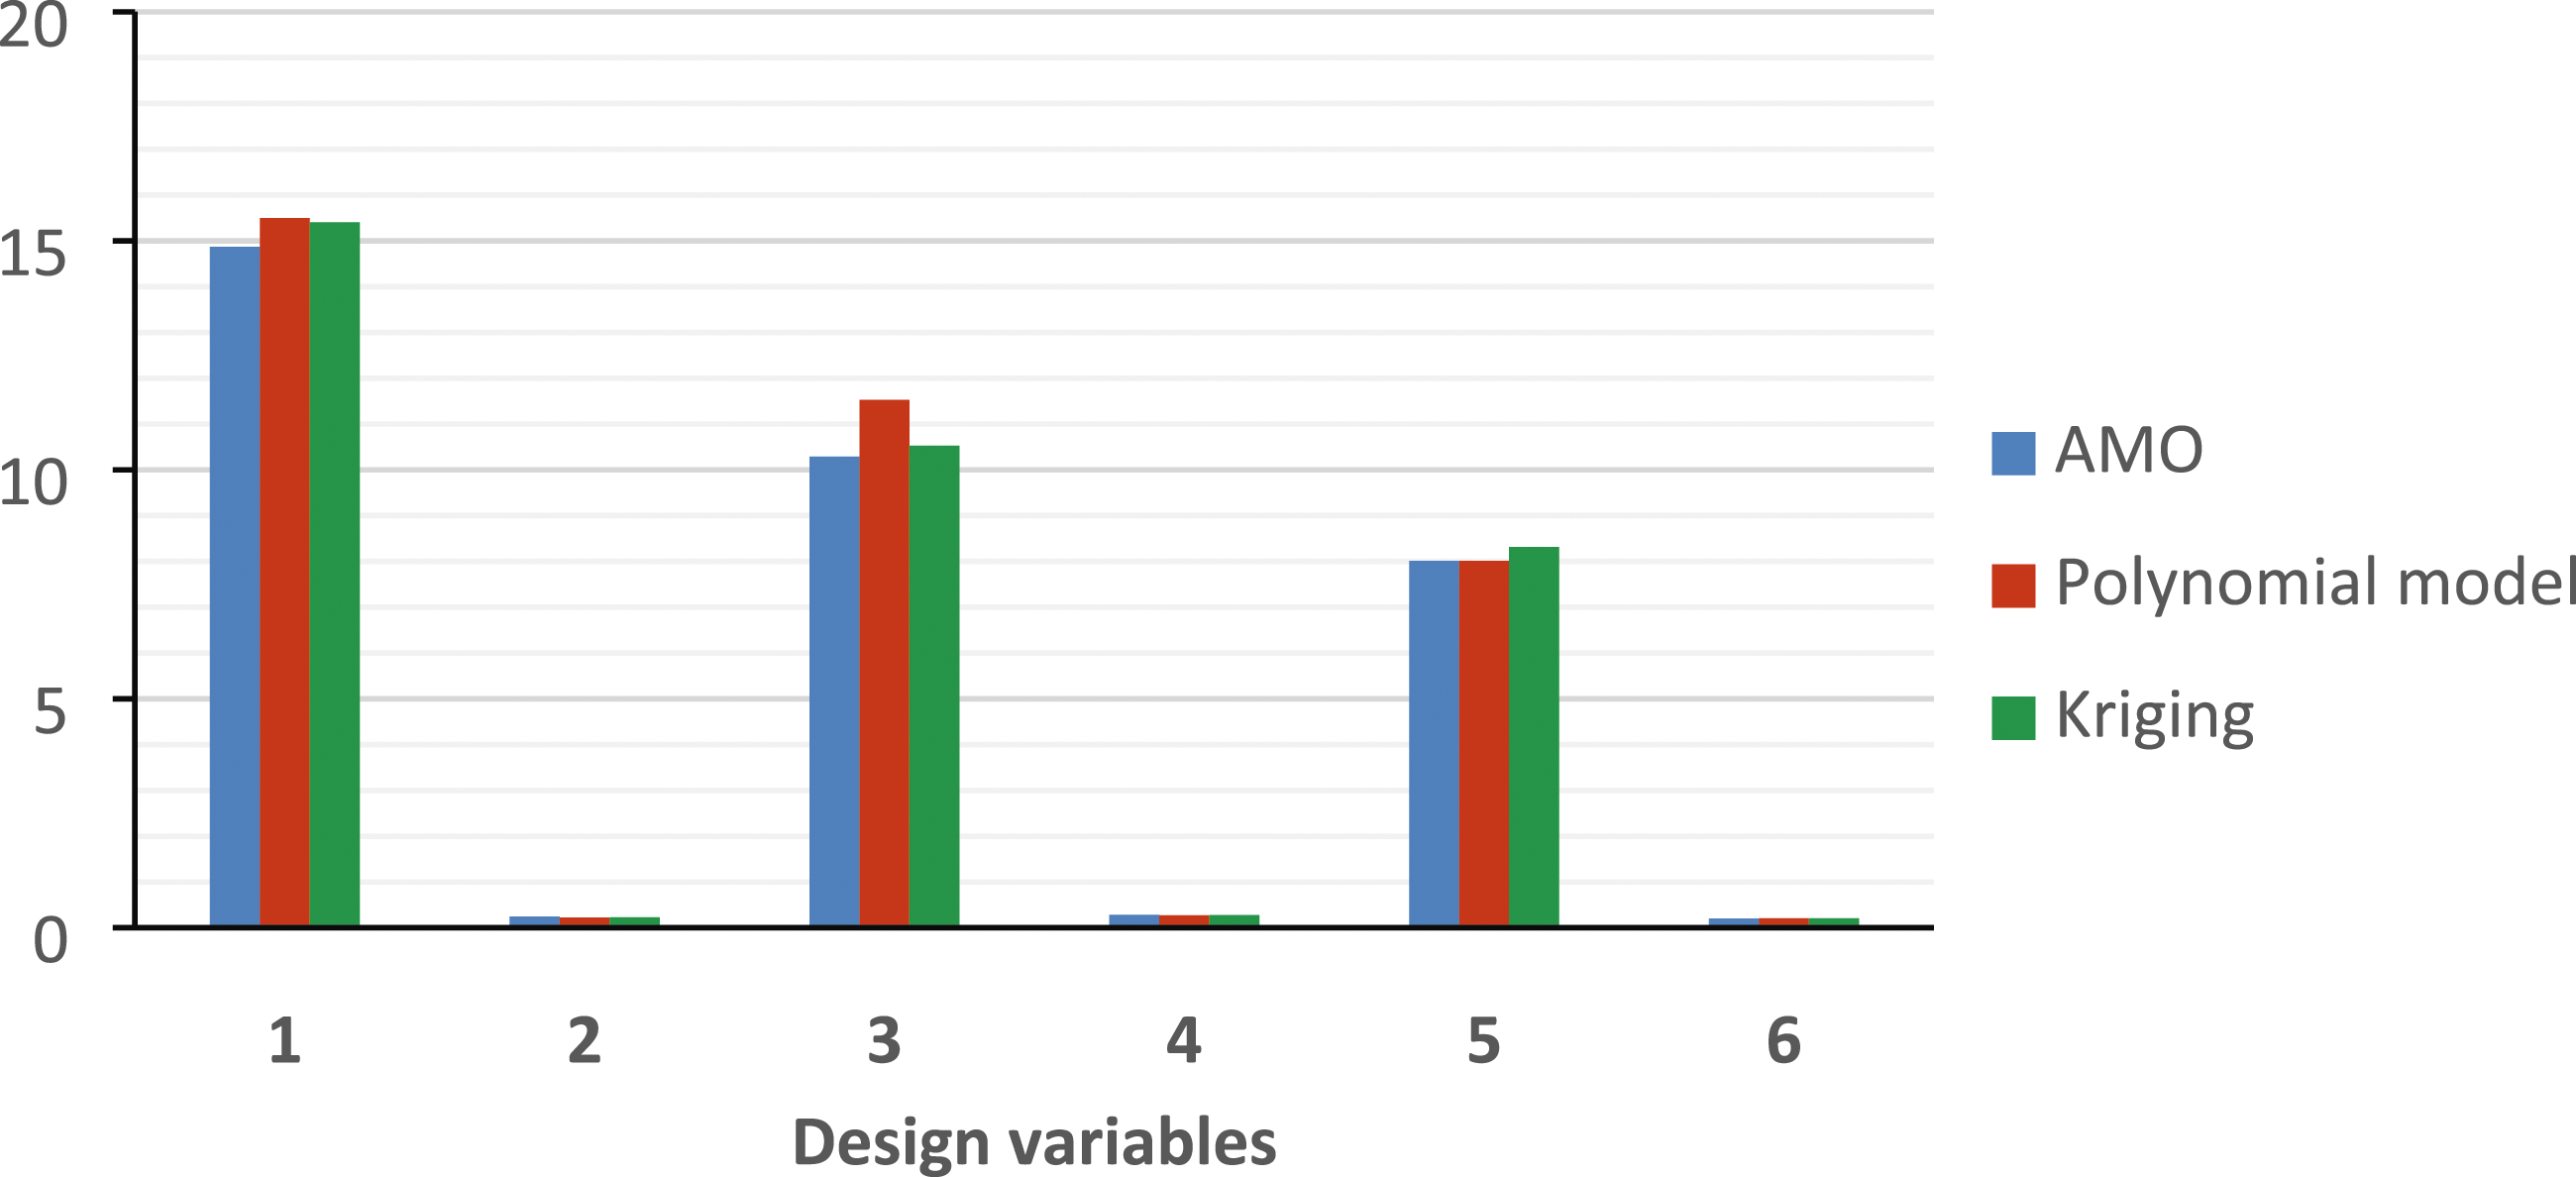
It can be denoted from the previous results that both techniques employed in the build-up of the problem approximated response surfaces, succeed in capturing candidate points with minimum deviation in results (maximum deviation in objective function does not exceed 0.1% for both polynomial and kriging models compared to AMO, and maximum deviation in design variables is approximately 5.3% and 3.3% for polynomial and kriging models respectively compared to AMO). Assuming a constant devices mass (∼168 kg), therefore the optimized structural mass is approximately 22 kg, which means about 30% structural mass reduction in the proposed satellite structure with stiffened honeycomb sandwich panels with a reasonable computational expense (45 evaluations). The results ensure that the use of meta-modeling techniques develop approximate simplified models for design optimization and solve the generalized problems encountered during direct optimization represented in severely nonlinear, discontinuous, and non-convex functions of complicated FEM in addition to the inherent high computational expense and the need of extremely efficient computer. Additionally, kriging model with its internal error estimator and the inherent refinement points provides a high regression accuracy of the built surface and thus, more trustable precision concerning the obtained candidate point.
Response surface optimization using MATLAB
Response surface optimization is carried out using an efficient MATLAB code via optimization toolbox in MATLAB in order to verify the results obtained from ANSYS workbench “DesignXplorer” module. Quadratic polynomial model is utilized in the build-up of the approximated response surfaces based upon the 45 evaluations.
Four MATLAB m-files are implemented; main file, a file imports the data, a file contains the objective function, and a file that contains the constraints functions. The main m-file is composed of three main sections as follows: - Section I: includes importing the 45 evaluations from an Excel file. - Section II: incorporates building-up the approximated response surfaces based upon the imported 45 evaluations. - Section III: involves invoking the MATLAB optimization function utilizing the optimization toolbox.
Response surface section
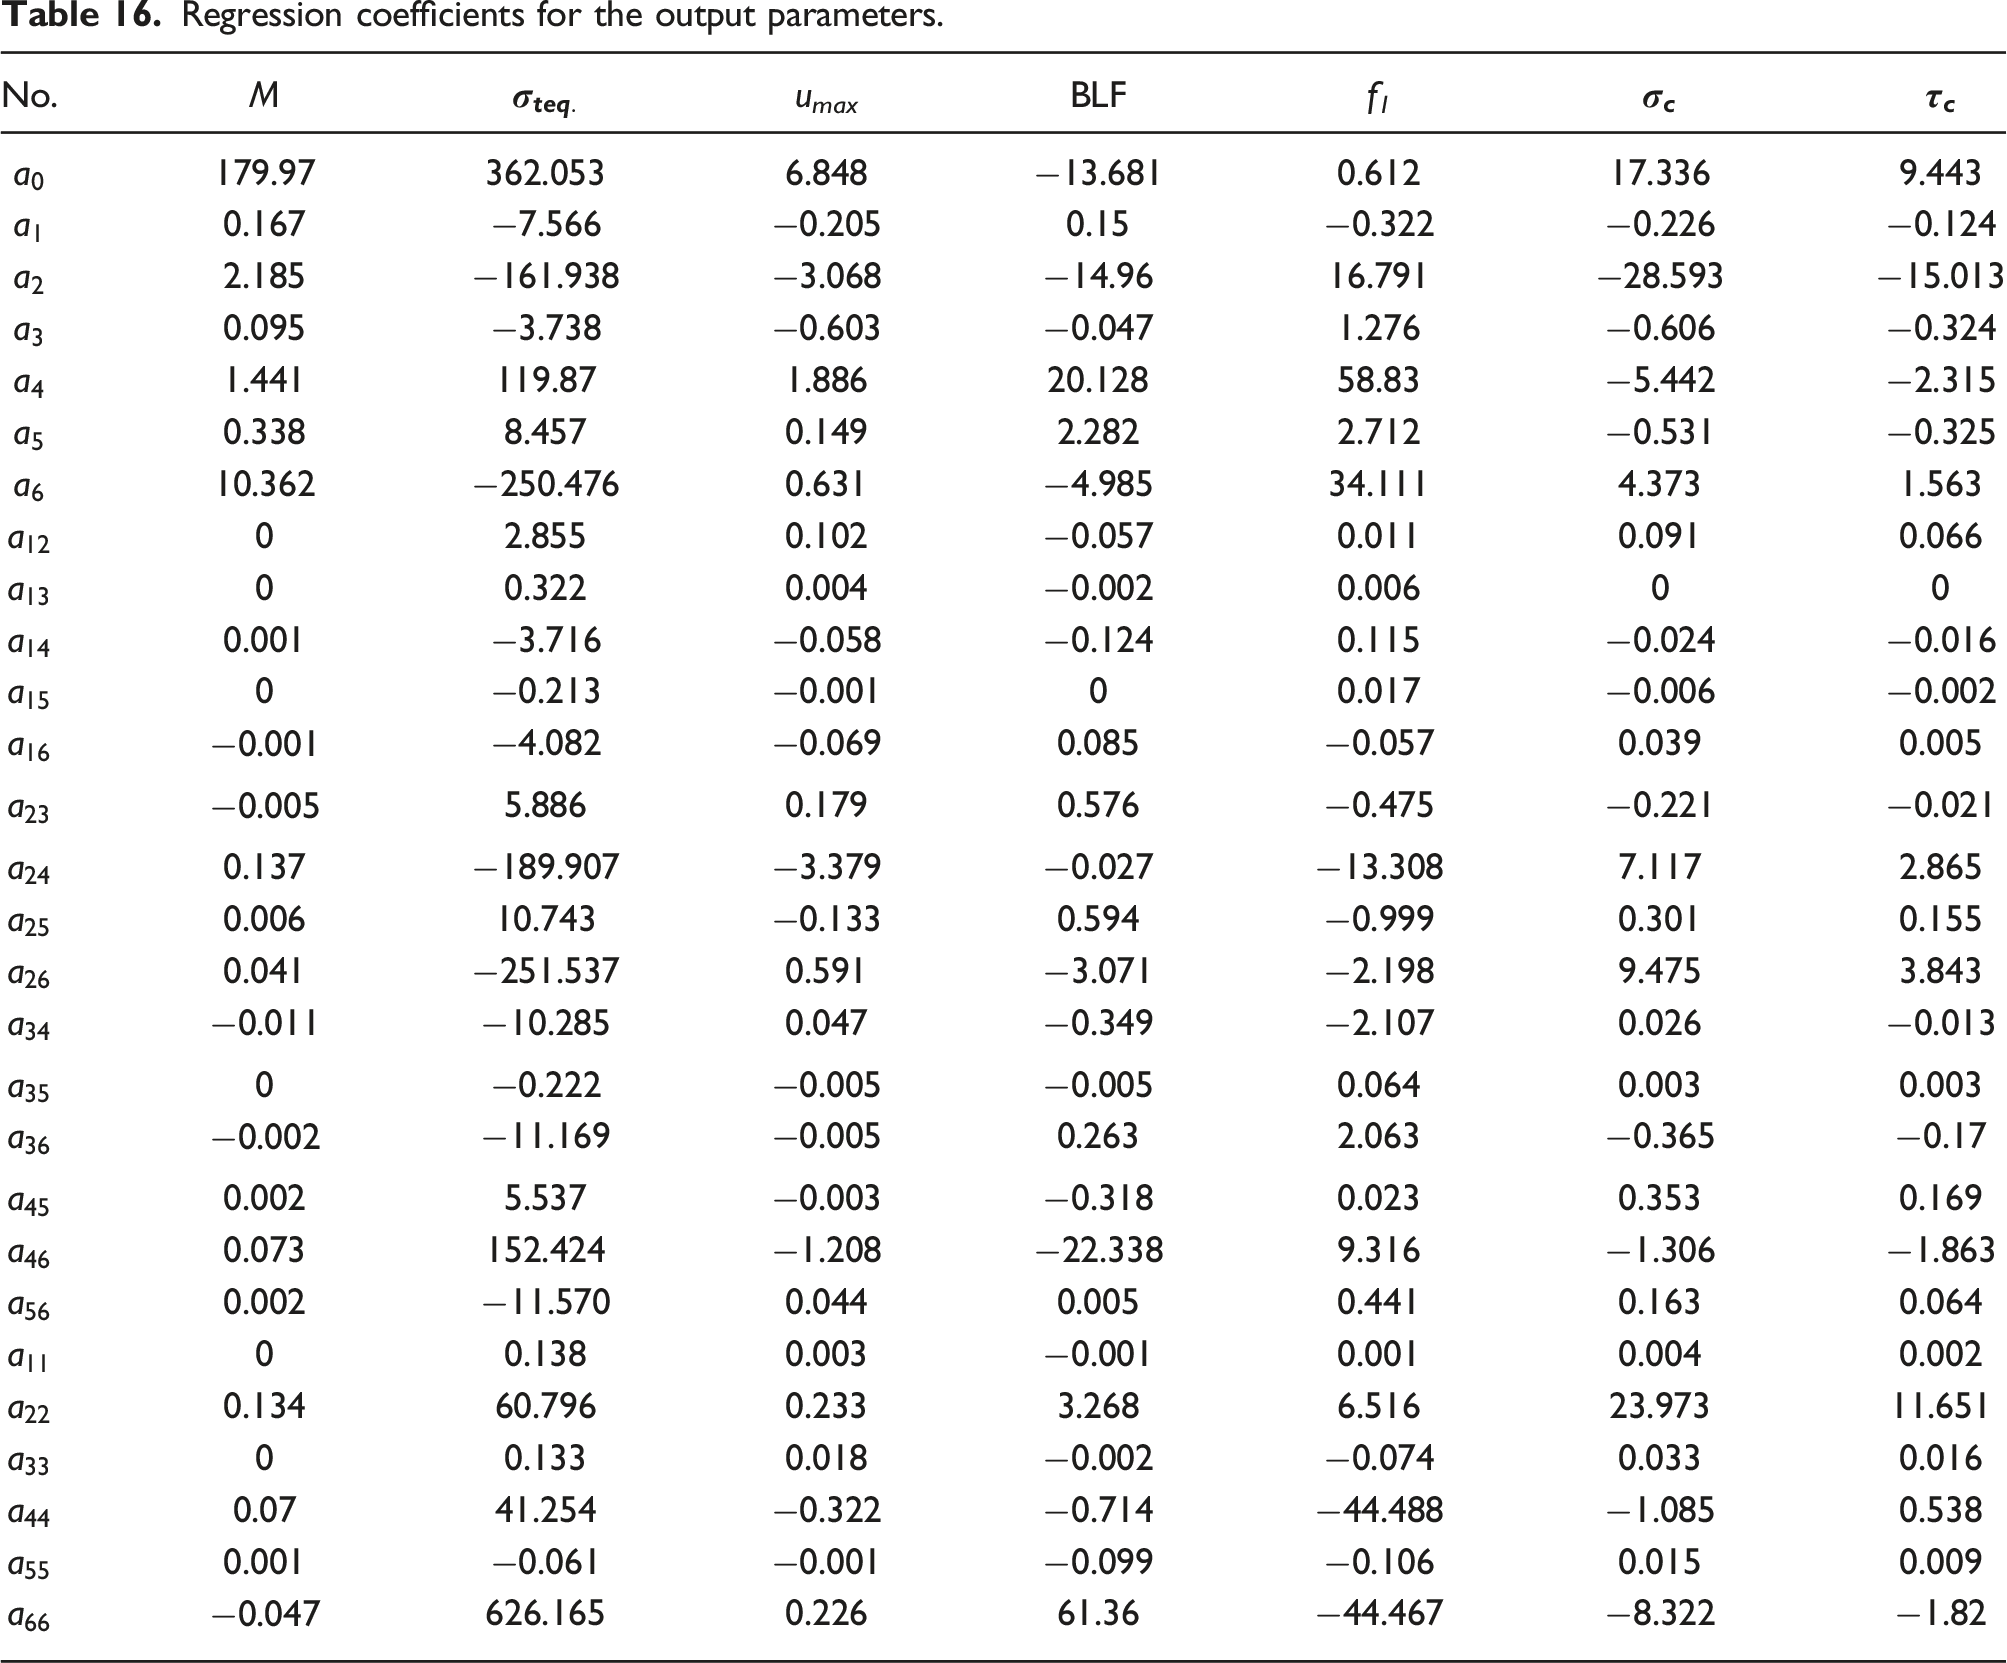
A regression analysis is performed to formulate a full 2nd order polynomial model based upon the imported evaluations. For six design variables, the model takes the form shown in equation (25) with 28 regression coefficients.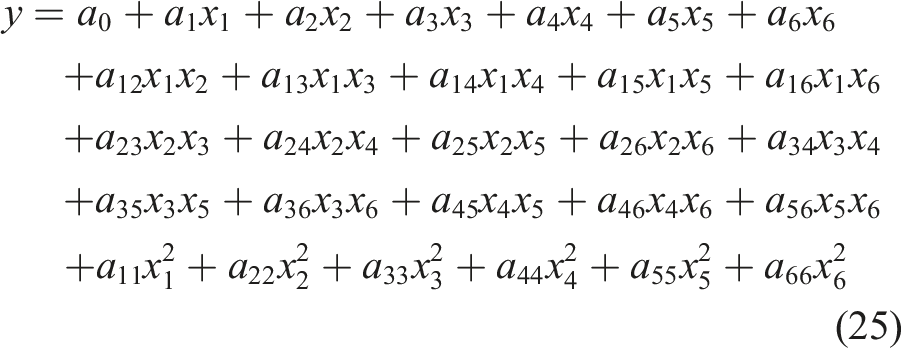
Regression coefficients for the output parameters.
Goodness of Fit for output parameters.
Optimization section
This section involves the utilization of the MATLAB optimization toolbox functions. Two algorithms are used; Genetic algorithm (previously explained) and Sequential Quadratic Programming (SQP) algorithm.
Sequential quadratic programming is a gradient-based algorithm that is adopted to solve smooth nonlinear programming problems. This method works iteratively as follows:
13

The superscript k indicates the iteration number, the subscript i represents the ith design variable, 
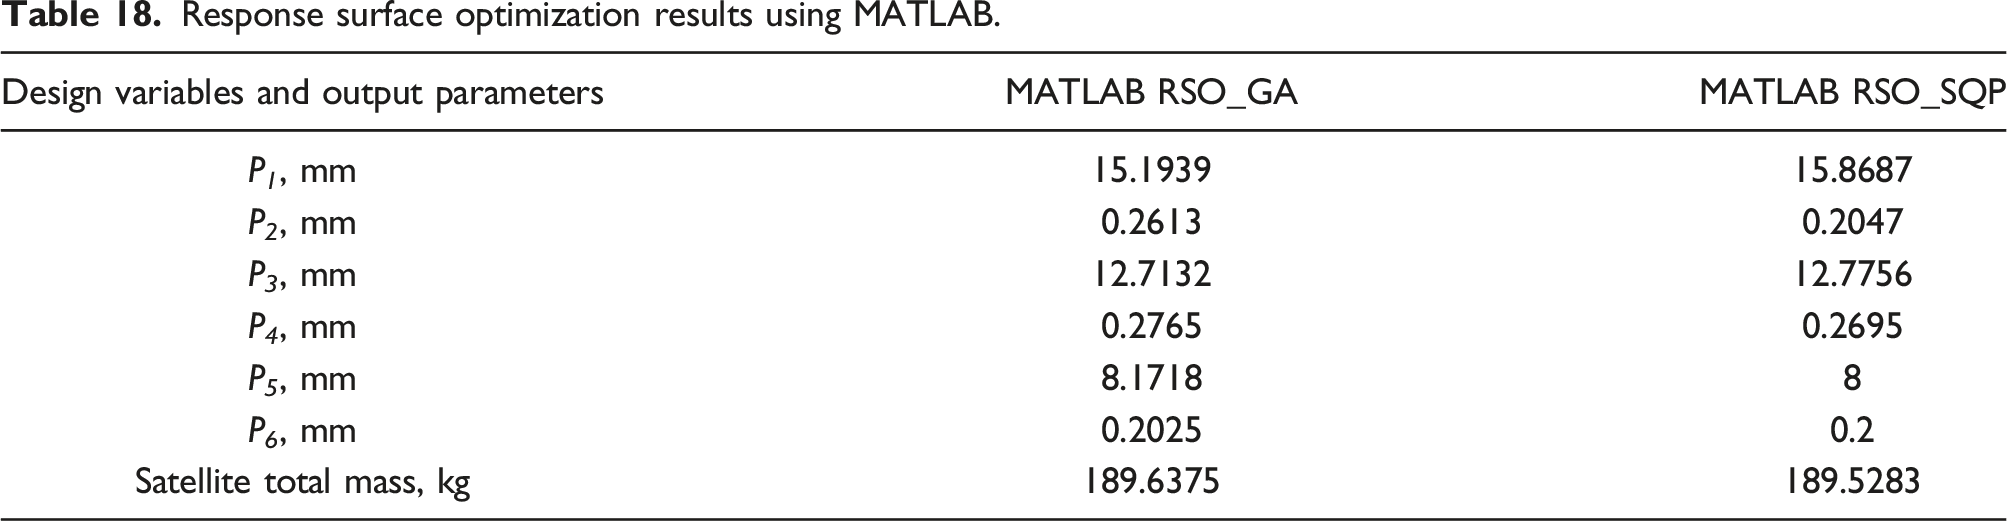
Response surface optimization results using MATLAB.
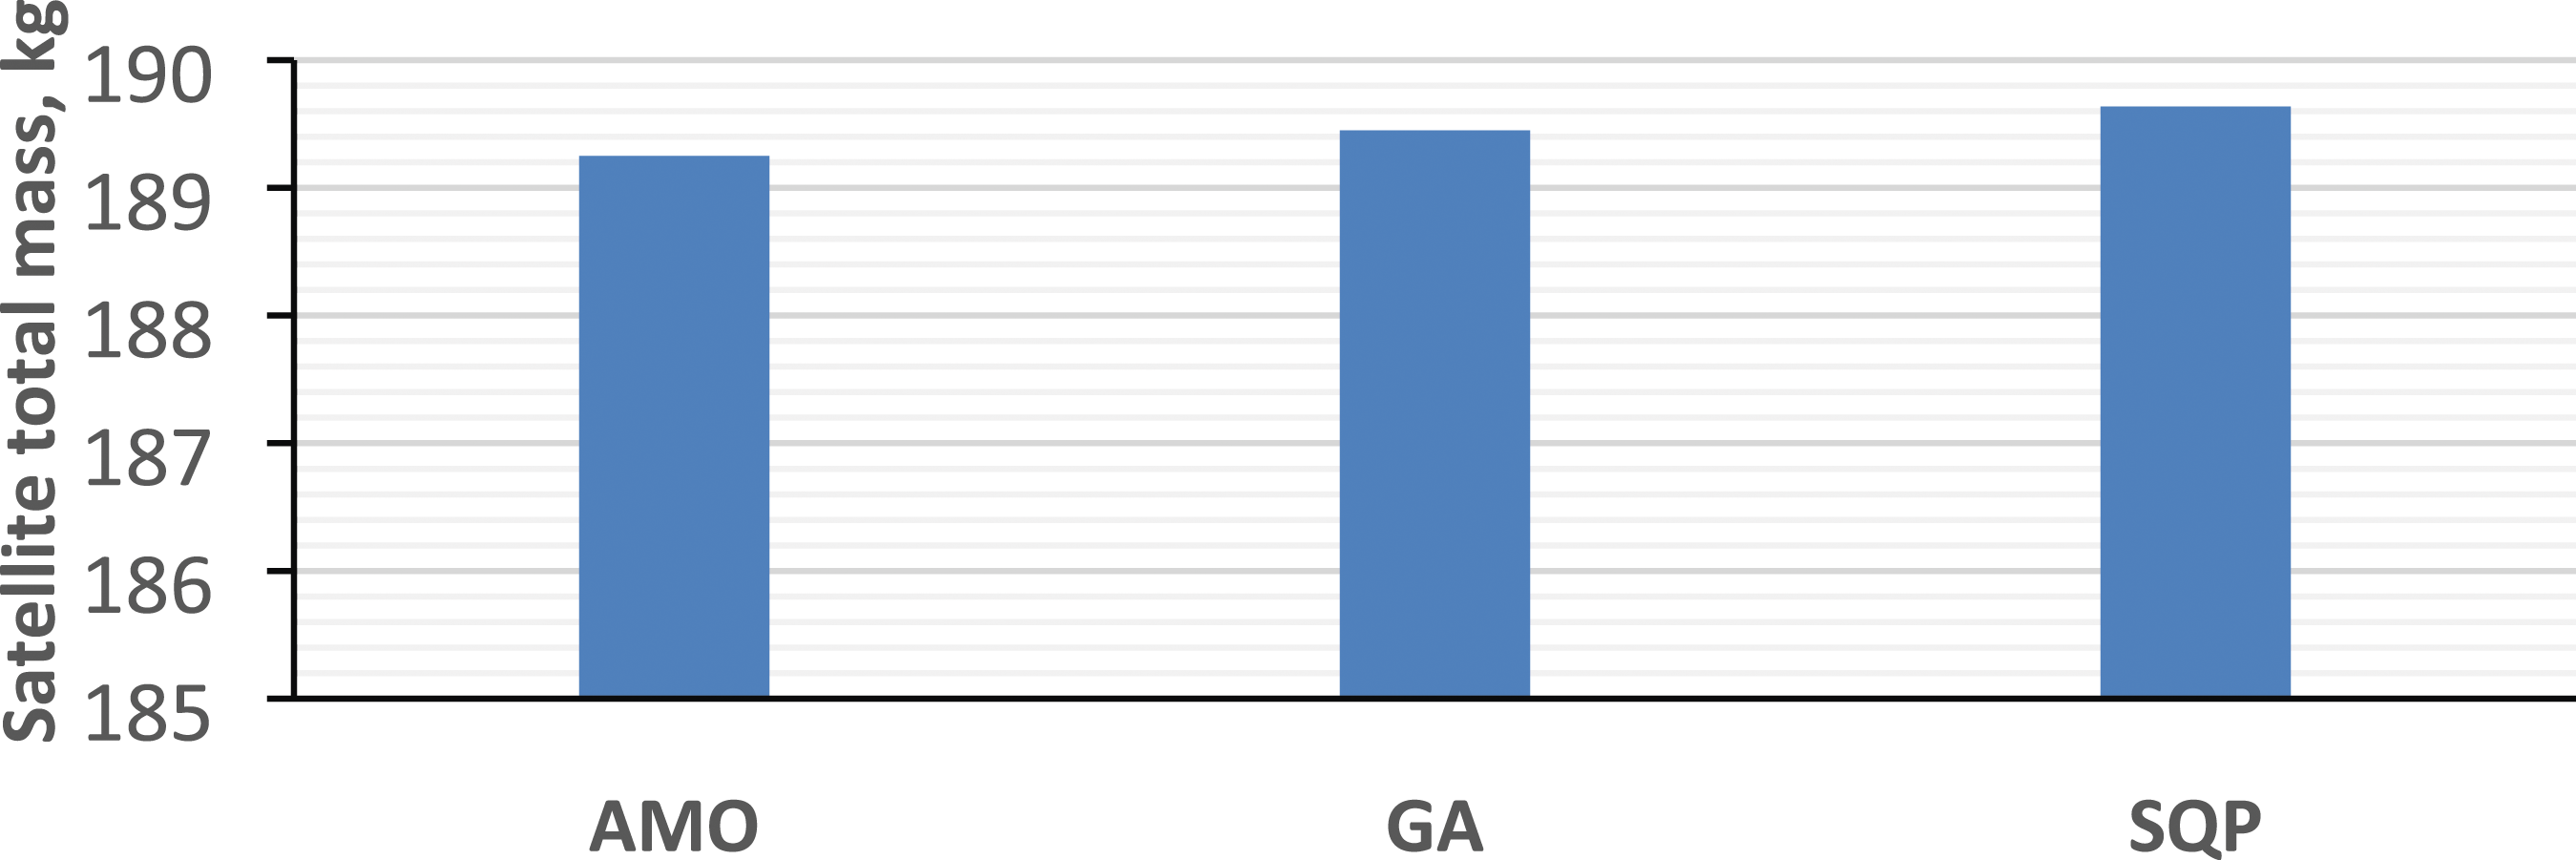
Objective function comparison (AMO, MATLAB RSO_GA, and MATLAB RSO_SQP).
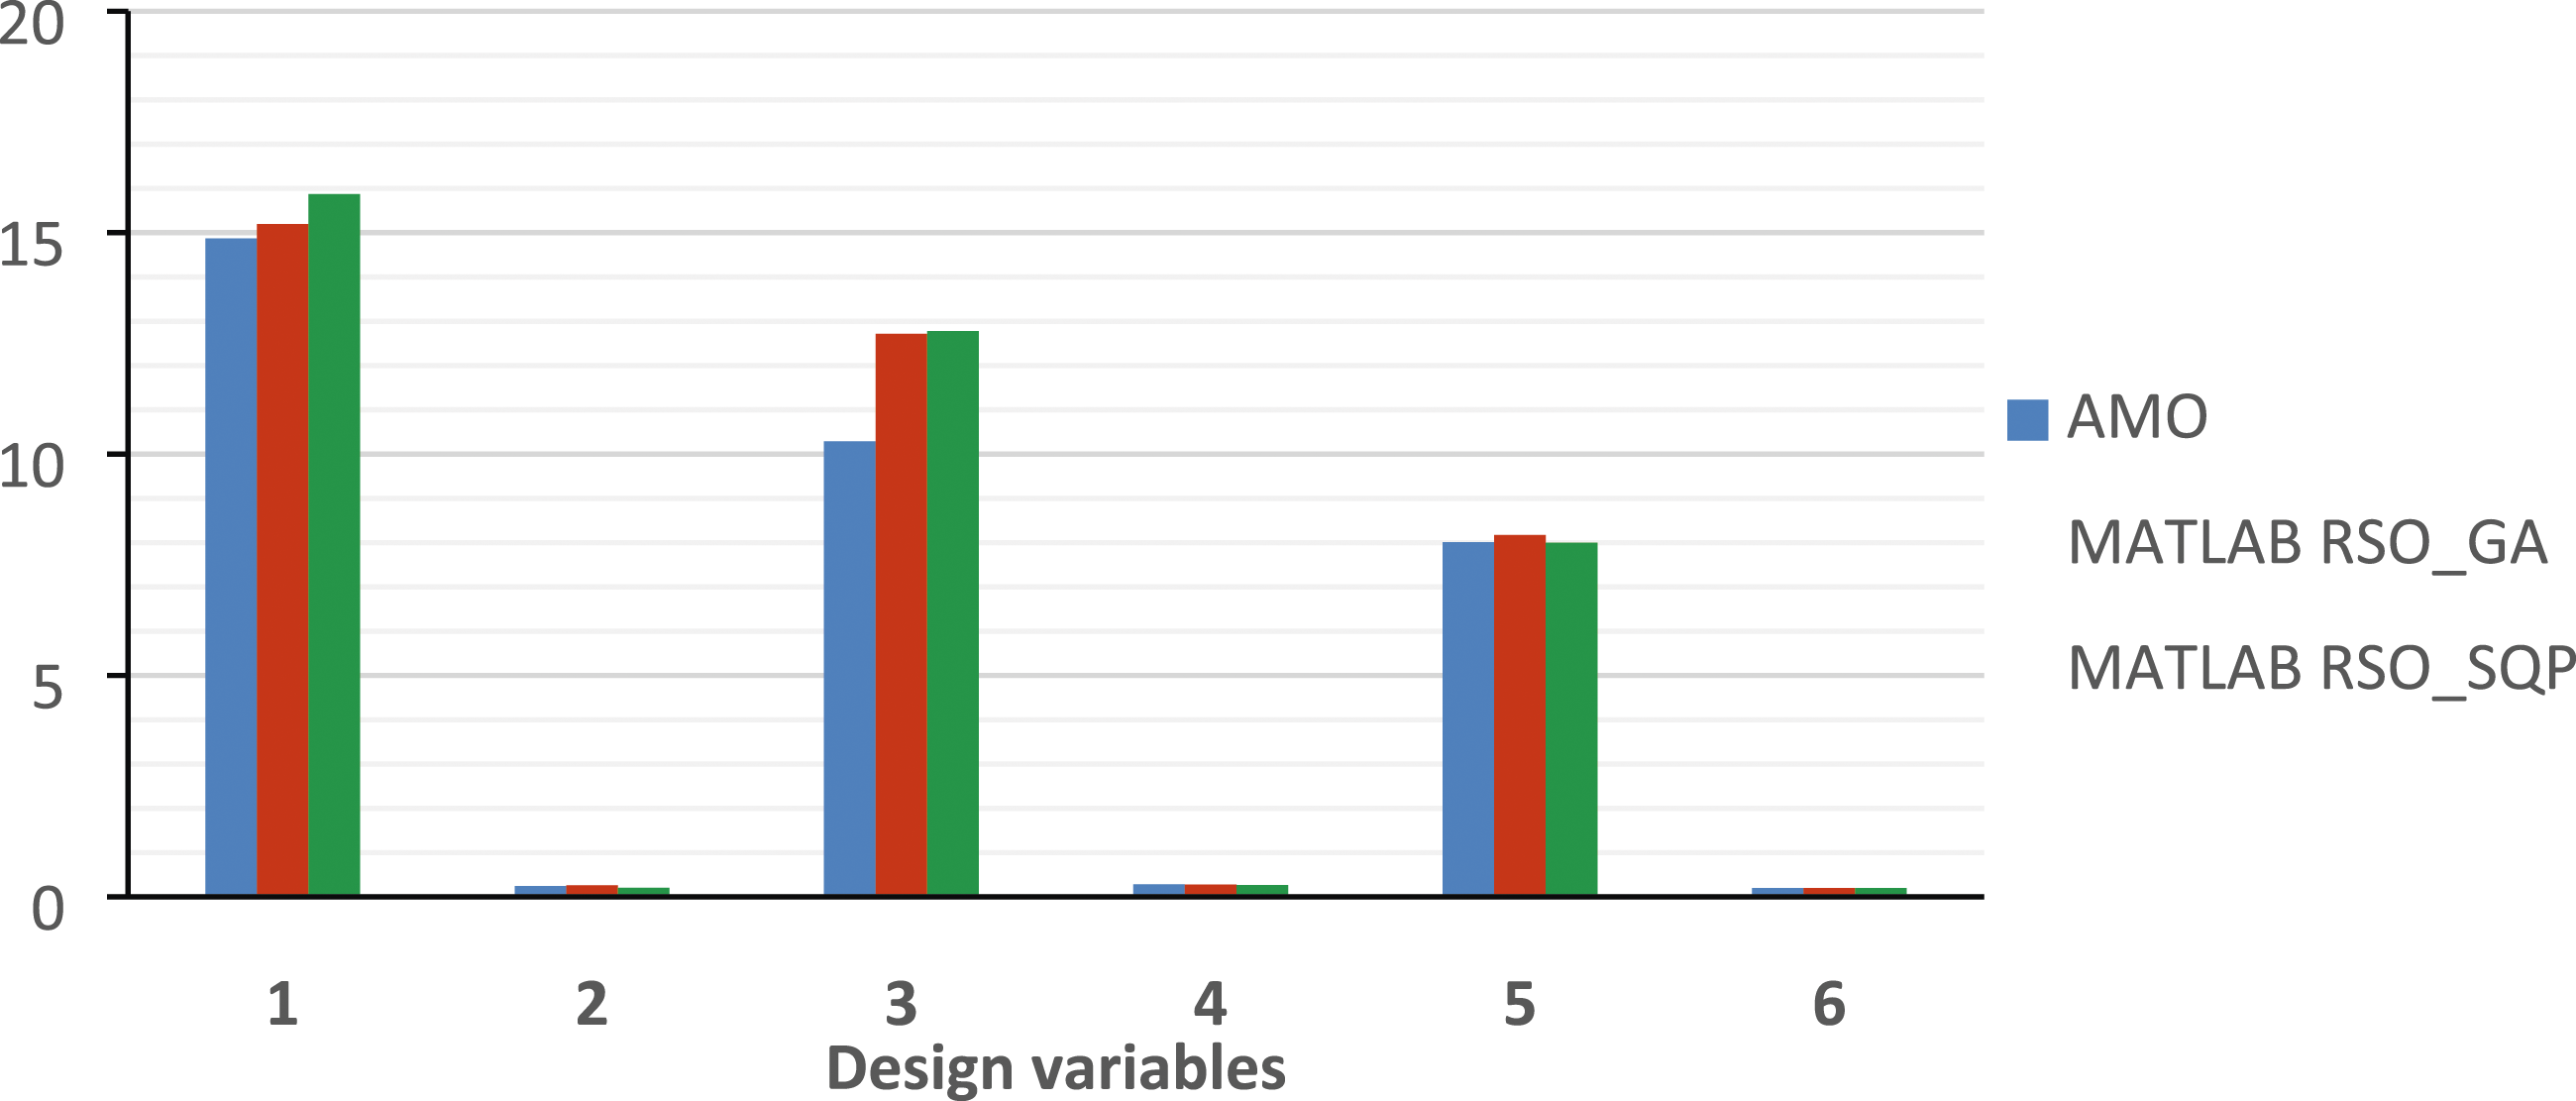
Design variables comparison (AMO, MATLAB RSO_GA, and MATLAB RSO_SQP).
The previously-mentioned results indicate that using an efficient MATLAB code is capable of verifying the results obtained from ANSYS workbench with a good agreement compared to AMO. The approximated built response surfaces followed by both GA and SQP acquire candidate points with minimum deviation in results (maximum deviation in objective function does not exceed 0.1% for both MATLAB models compared to AMO, and maximum deviation in design variables is approximately 6.2% and 8.7% for MATLAB RSO followed by both GA and SQP respectively compared to AMO). The optimized structural mass is approximately 22 kg, which means nearly 30% structural mass reduction in the proposed satellite structure. Meanwhile, GA shows a better agreement than SQP due to its higher capability in identifying a global optimum solution than the gradient-based algorithms which is highly sensitive towards the values of the design variables in the starting design point.
Conclusions
The whole process of structural optimization of a small earth remote sensing satellite, whose structure is based upon stiffened honeycomb sandwich plates, is thoroughly discussed. The satellite optimization process starts initially with formulating the optimization problem based upon the results of static, buckling, modal, and harmonic response analyses during launch phase. Subsequently, miscellaneous optimization techniques utilizing ANSYS workbench and MATLAB code are employed. Applying hybrid optimization technique, represented in Adaptive Multiple-Objective (AMO) algorithm utilizing ANSYS workbench, results in approximately 30% structural mass reduction in the proposed satellite structure. Nevertheless, simulating 591 evaluations is still considered of high computational expense. Both polynomial regression and kriging approximated models, utilizing ANSYS workbench, leads to about 30% structural mass reduction in the proposed satellite structure with a minimum deviation in results compared to AMO algorithm and with reducing the number of evaluations into 45 evaluations. However, kriging model with its internal error estimator and the inherent refinement points provides a high regression accuracy of the built surface. Thus, the need for approximate meta-models is essential due to their capabilities in solving complex structural optimization models with a reasonable computational time. Response surface optimization is re-carried out using an efficient MATLAB code via optimization toolbox in MATLAB in order to verify the results obtained from ANSYS workbench “DesignXplorer” module. The approximated built response surfaces via MATLAB code followed by both genetic and sequential quadratic programming algorithms acquire a candidate point with a good agreement compared to AMO results. The optimized structural mass is approximately 22 kg, which reduces the proposed satellite structure mass by about 30%. Meanwhile, Genetic algorithm (GA) shows a better agreement than sequential quadratic programming algorithm (SQP) due to its higher capability in identifying a global optimum solution than the gradient-based algorithms which is highly sensitive towards the values of the design variables in the starting design point. Therefore, using MATLAB code in solving the current optimization problem leads to similar results as Ansys workbench but with the advantage of providing a full monitoring of the output parameters (objective and constraints) in terms of their regression coefficients. A main contribution has been conducted in extending the optimization problem to include the main static and dynamic loads acting simultaneously on the satellite during launch phase. Such contribution involves also developing an efficient approach for finding the optimum design for a complex satellite structure at a reasonable computational expense.
Footnotes
Acknowledgements
The authors would like to express their sincere gratitude to Professor Mohamed Yehia Zakaria (head of Aircraft Mechanics Department , Military Technical College, Cairo, Egypt) and Professor Jordi Romeu Garbi (director of Department of mechanical engineering, Polytechnic University of Catalonia, Barcelona, Spain), for their valuable guidance and managerial support throughout the research process.
Declaration of conflicting interests
The author(s) declared no potential conflicts of interest with respect to the research, authorship, and/or publication of this article.
Funding
The author(s) received no financial support for the research, authorship, and/or publication of this article.