
Abstract
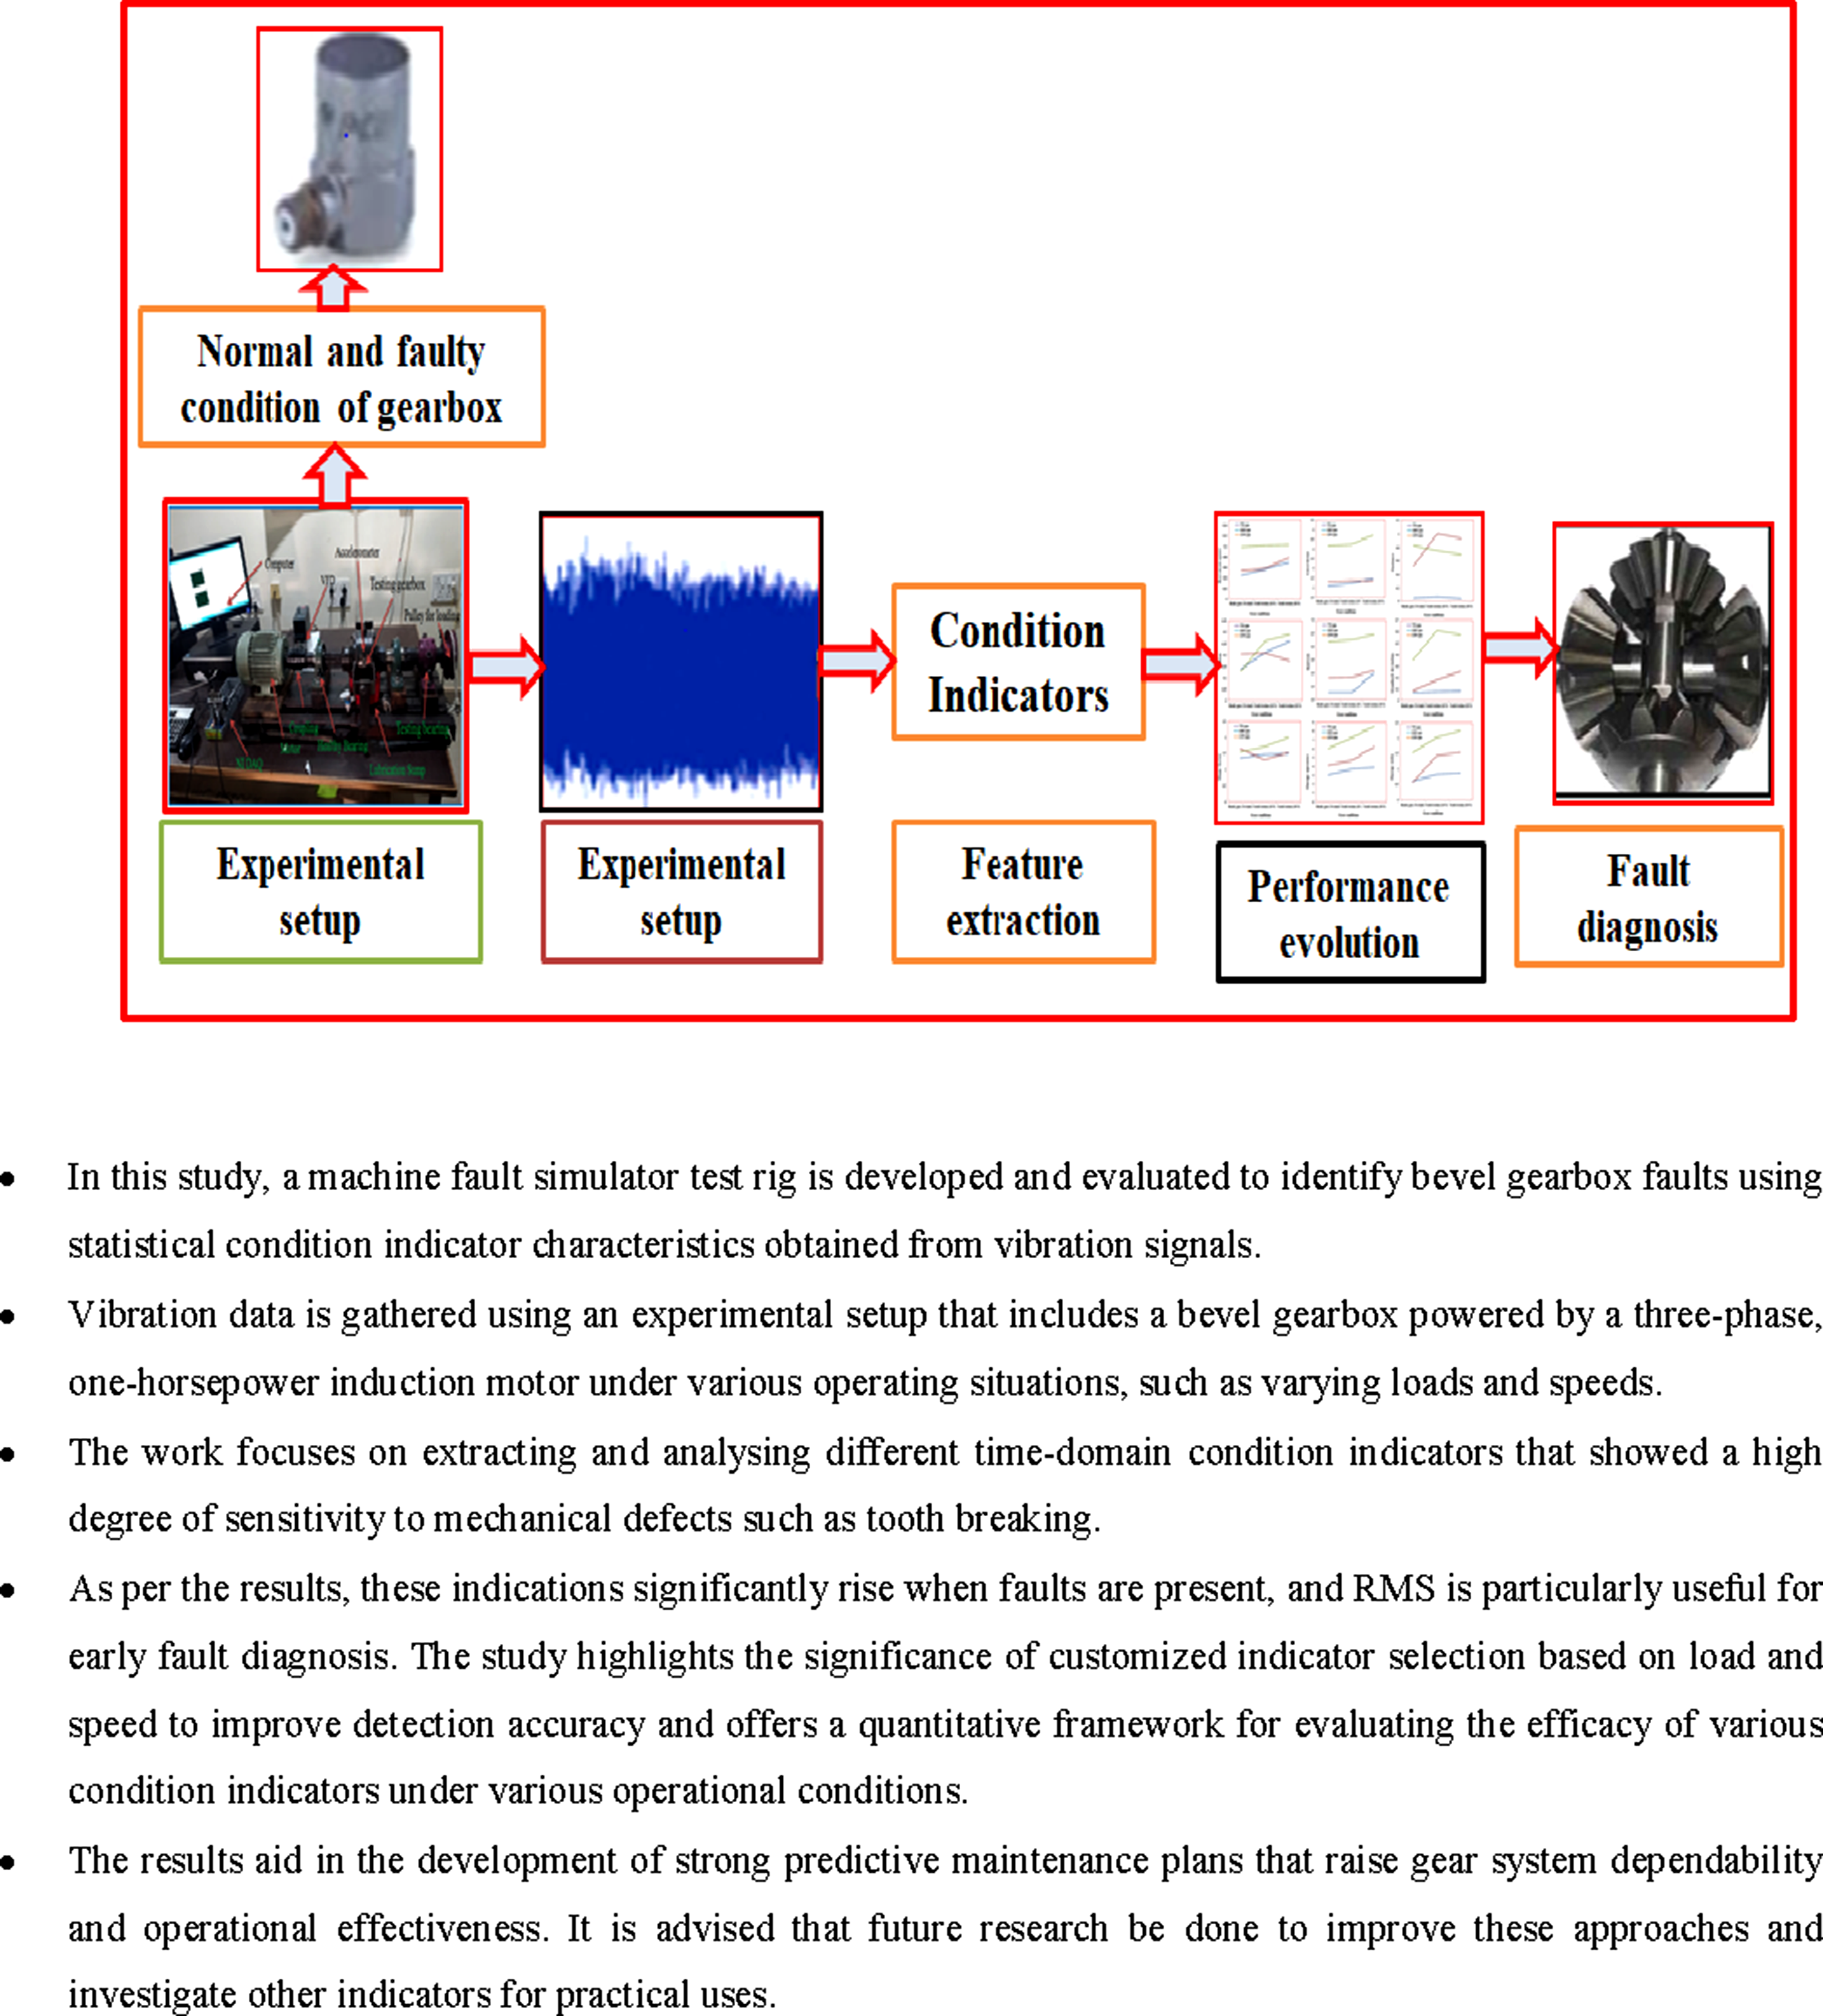
Vibration issues have increased in recent years due to automated processes, more rapid machinery, and more sensitive designs. These difficulties arise from the need for increased production combined with reduced operating, maintenance, and expenditures for investment. To address this issue, a machine faults simulator test rig under healthy and faulty conditions has been developed. An important component of a machine fault simulator is a gearbox widely used in both the military and the industrial sectors. Excessive service load, difficult working conditions, or inevitable fatigue can all lead to gear failures. Equipment failures will continue to deteriorate if they are not identified in a period potentially leading to significant financial loss or even disaster. For condition monitoring that connects fault diagnosis, and degradation assessment application, Condition indicators have been developed in the past few years. The construction of condition indicators is decisive for extracting informative fault information from the monitoring vibration signals. The novelty of condition indicators is to provide accurate information regarding the condition of the gearbox at different levels of damage. Various condition indicators are generally used for fault detection and diagnosis of the gearbox. Condition indicator techniques would assist users in opting for valuable condition indicators and obtain better fault diagnosis performance of the gearbox. The investigation shows that under a variety of operating situations, statistical time-domain features greatly increase the accuracy of defect identification when paired with comprehensive vibration signal processing strategies. By incorporating these signs into intelligent monitoring systems, condition-based maintenance is made easier, which lowers maintenance expenses and unplanned equipment failures. The results highlight how crucial it is to incorporate condition indicators into Industry 4.0 frameworks in order to improve machinery dependability and operational effectiveness.
Introduction
Condition indicators are generally used for fault detection and diagnosis of the gearbox. Condition indicator techniques would assist users in opting for valuable condition indicators and obtain better fault diagnosis performance of gearbox.
1
Fault diagnosis of the gearbox at the beginning of the fault is extremely significant before it gets turned into a disaster. Condition indicators react differently to different faults and sensor positioning. This means that while some indicators are good at differentiating one issue, they might not be as effective for other faults. This means that while some indicators are good at differentiating one issue, they might not be as good at other faults.
2
This is due to the fact that every indicator is susceptible to distinct fault features, and the potential of each indicator to distinguish between various fault types may be impacted by its individual fault responses. However, gear systems are susceptible to multiple fault modes, including pitting and cracking. Normally, a myriad of condition indicators is used to identify gear system flaws to account for the above.
3
Then with the help of various dimensional reduction techniques such as Principle Component Analysis, Genetic algorithm and Decision tree to take out important information.4,5 Early defect detection can assist prevent system failure, shutdown, and even catastrophic events that cause significant harm and human casualties. A fault diagnosis system is a system that has the ability to identify, isolate, detect, and classify faults. Damaged gears, bearing imperfections, misalignment, mechanical looseness, and electrically driven vibration are the most frequent machine fault types.
6
However, in practice, the amount of computing power available for defect detection is always limited,
7
thus dimensional reduction signal processing is not a superior option. Thus, search for a technique to assess the ability of each condition indicator to differentiate a specific fault of gear systems. To deal with this difficulty, we did a comparative study among various Condition indicators like Root mean square, Kurtosis, Mean, Standard deviation, Crest factor, Variance, Shape factor, Energy ratio and Energy operator performed under normal and faulty conditions of gear systems. Finally, a number of Condition indicators are assessed with proposed techniques to reveal their usefulness. The three primary components of condition monitoring are data collection, data processing, and maintenance decision-making, as illustrated in Figure 1. Data acquisition is a process of collection of important information from the rotating machinery systems for fault detection these data can be vibration data, acoustic data, oil analysis data, temperature, pressure, moisture and humidity.8,9 Data processing filters out unwanted signals which are not informative and uses a variety of damage detection techniques to generate condition indicators that give an assessment of a gear system’s conditions. Then maintenance decision-making weighs a variety of condition indicators against determined threshold values and, if required, then some corrective action is taken.10,11 It is possible to achieve the important diagnosis of fault information from the vibration signals of a rotating element. However, a group of techniques currently existing involves a major input of expertise to execute them effectively.
12
Hence there is a requirement for a domain-specific understanding of maintenance engineering. Normally the expert is not instantly available. Consequently, there is a requirement for partially skilled operators to make reliable decisions on the health condition of rotating machines without diagnosis expertise. When a rotating machine is subjected to any kind of fault then the vibration characteristics measured by the sensor is deviated from its normal condition. Various researchers have performed the fault detection and diagnosis of gear systems using vibration signals. W. Feng et al
13
analysed the fault diagnosis of spall gear fault by using Ferromagnetic vibration analysis. The various time domain parameters such as variance, mean square value, peak value and kurtosis were analysed under faulty conditions. These parameters were increased as the severity increased. Li, X., and He, Z.
14
introduced a methodology that uses machine learning and statistical feature extraction to diagnose rolling bearing defects. To describe the bearings’ operational status, the investigators extract a variety of time-domain statistical parameters from vibration signals, including mean, standard deviation, skewness, and kurtosis. Machine learning classifiers, such as Support Vector Machines and Random Forests, are then trained using these features to differentiate between perfect and defective situations. Experimental data is used to validate the suggested method, which shows excellent defect detection and classification accuracy. For predictive maintenance and real-time monitoring of spinning machinery, this approach provides an appropriate response. Through the integration of machine learning and statistical analysis, the study advances the creation of dependable and effective defect diagnosis systems for industrial applications. In this study, both simulated and experimental vibration signals are utilized to assess the detection of defects in bevel gear systems. For efficient gear fault detection, it places a strong emphasis on time-domain and frequency-domain analysis. Real-time vibration data under various fault circumstances is gathered using test equipment. A dynamic model of the bevel gear system is used to create simulated signals. The correctness of the model is verified by comparing the simulated and experimental signals. The results validate the use of signal analysis as a trustworthy technique for early gear defect identification.
3
Bechhoefer et al.
15
looked into a number of condition indicators, such as pitting, cracking, and wear, for the purpose of diagnosing and detecting faults in a split torque gearbox. In order to identify the most dependable technique for identifying and diagnosing gear system problems, their study concentrated on assessing these indicators’ efficacy under various failure scenarios. They discovered that some indicators-such as vibration characteristics that show the spread of cracks or acoustic emission signals that show pitting were more sensitive to particular fault types. Kumar, S., and Singh, R.
16
described a technique for employing ensemble machine learning classifiers to diagnose bevel gearbox problems. The researchers extract relevant features that are used as inputs for ensemble models like Random Forests and Gradient Boosting Machines by examining vibration data that were gathered under varied operating situations. By efficiently differentiating between normal and problematic states, these models are trained to classify the gearbox’s health status. When using an ensemble approach instead of a single classifier, the diagnostic accuracy and resilience are improved. Validations from experiments show how effective this method is at detecting faults early on, which helps to enhance maintenance plans. The possibility of combining vibration analysis with cutting-edge machine learning approaches for trustworthy mechanical system condition monitoring is highlighted by this work. In order to effectively diagnose gearbox faults, Tyagi and Panigrahi
17
presented a hybrid diagnostic model that combines a Genetic Algorithm with an Artificial Neural Network trained by backpropagation. By optimizing the Artificial Neural Network’s initial weights and biases, the Genetic Algorithm increases the Artificial Neural Network training effectiveness and rate of convergence. Features of vibration signals taken from gearboxes under various failure circumstances are subjected to this hybrid Genetic Algorithm-B Back-Propagation technique. The model outperforms conventional BP-trained Artificial Neural Networks in identifying various gear failures with excellent classification accuracy. The study emphasizes how neural networks and evolutionary algorithms can be combined to enhance mechanical system failure detection. By facilitating early and precise defect identification, such approaches can make a substantial contribution to predictive maintenance efforts. Response Surface Methodology was first used by Singh, P., and Gupta, R.
18
to diagnose vibration-induced gearbox system defects. The relationship between several operational parameters and the ensuing vibration responses is modelled and examined using the Response Surface Methodology. This method makes it easier to diagnose fault circumstances and identify essential components affecting gearbox performance. Experimental data validates the system, showing how well it detects faults and offers insights for improving gearbox design and maintenance strategies. A methodical foundation for improving the durability and dependability of gearbox systems is provided by the use of Response Surface Methodology in vibration analysis. Kumar and Sharma
19
combined Artificial Neural Networks and Response Surface Methodology to develop an integrated approach for bearing system fault detection. In order to identify the crucial elements affecting bearing performance, the Response Surface Methodology is used to model the link between different operational parameters and vibration responses. The Artificial Neural Network exhibits good fault detection accuracy after being trained with data from Response Surface Methodology to categorize various fault states. Experimental data demonstrates the efficacy of the suggested methodology in real-time bearing system monitoring and predictive maintenance. This integrated methodology advances fault diagnosis methods in mechanical systems by providing a methodical foundation for improving bearing systems’ lifetime and dependability. An approach for diagnosing rolling bearing defects using statistical feature extraction combined with Support Vector Machine classifiers is presented by Li, C., Sanchez, R. V., and Sanz-Bobi, M. A.
20
To describe the bearings’ operational situation, the investigators extract a variety of time-domain statistical parameters from vibration signals, including mean, standard deviation, skewness, and kurtosis. Support Vector Machines models that are able to differentiate between normal and defective bearing situations are trained using these features as inputs. Using experimental data, the study assesses the effectiveness of the suggested method, showing excellent defect detection and classification accuracy. The findings suggest that combining statistical analysis with machine learning methods such as support vector machines provides a workable way to monitor rotating machinery in real time and perform predictive maintenance. This work advances the creation of reliable and successful fault diagnosis systems for use in workplaces. A comparison study of several statistical indicators used for diagnosing bearing faults was published by Chen, Z., and Lee, S.
21
The authors assess the efficacy of many time-domain statistical indicators in identifying bearing flaws, including mean, standard deviation, skewness, and kurtosis. The sensitivity and dependability of each statistical indicator are evaluated by the study through the analysis of vibration signal data from bearings under various operating situations. The results provide insights into the best feature selection for diagnostic purposes by highlighting which features respond well to particular fault categories. This comparative method helps to improve bearing defect detection systems’ precision and effectiveness. Sires et al.
22
obtained simulated gearbox faults and accelerometers located on bearings or on a gearbox casing. The investigation of the vibration signal obtained from gear systems is done by using the time domain, frequency domain, and time-frequency domain. Condition indicator is also used to figure out the stage of vibrations that are produced due to fault phenomenon. These Condition indicators were used to observe different kinds of wear, pitting, and cracking on gear systems. It must be discovered that when there is a defect in the systems, the values of certain statistical parameters rise above the nominal values, indicating the presence of a fault. Steps of condition monitoring.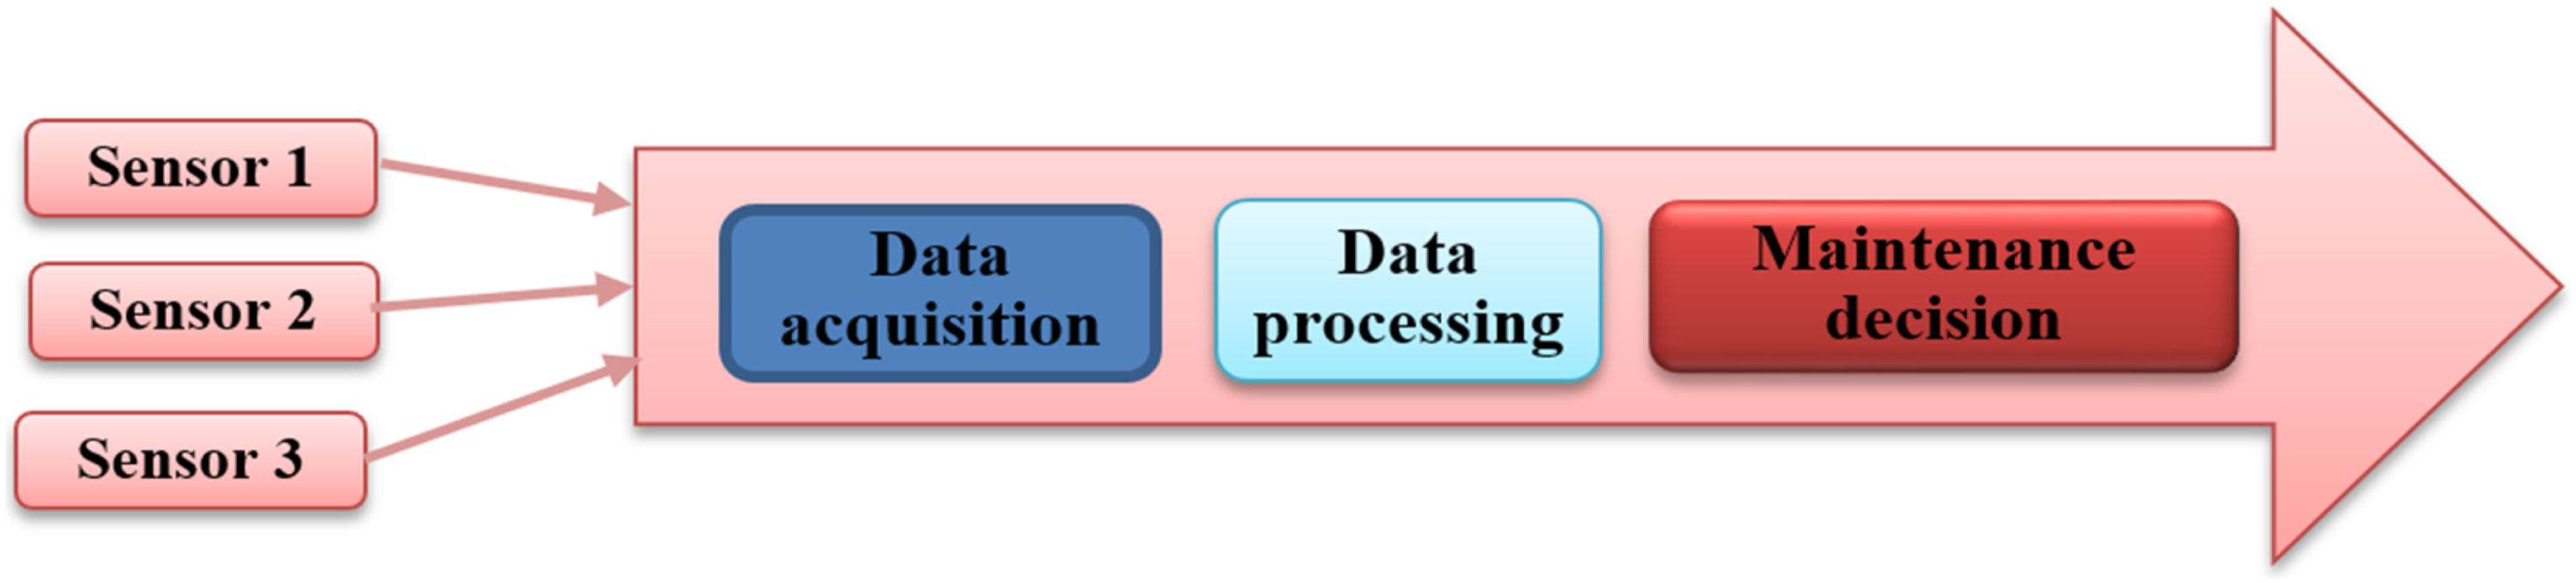
In this work, several Condition indicators under both normal and fault gearbox system conditions are compared. Due to their high sensitivity to mechanical damage, vibration signals are useful for early gearbox failure diagnostics. For diagnosing gearbox faults, time domain condition indicators work better since they show the change in vibration amplitude and pattern brought on by faults. They are easy to compute and can identify short-term events such as stress or impact from tooth fractures and cracks.
Experimental setup and procedure
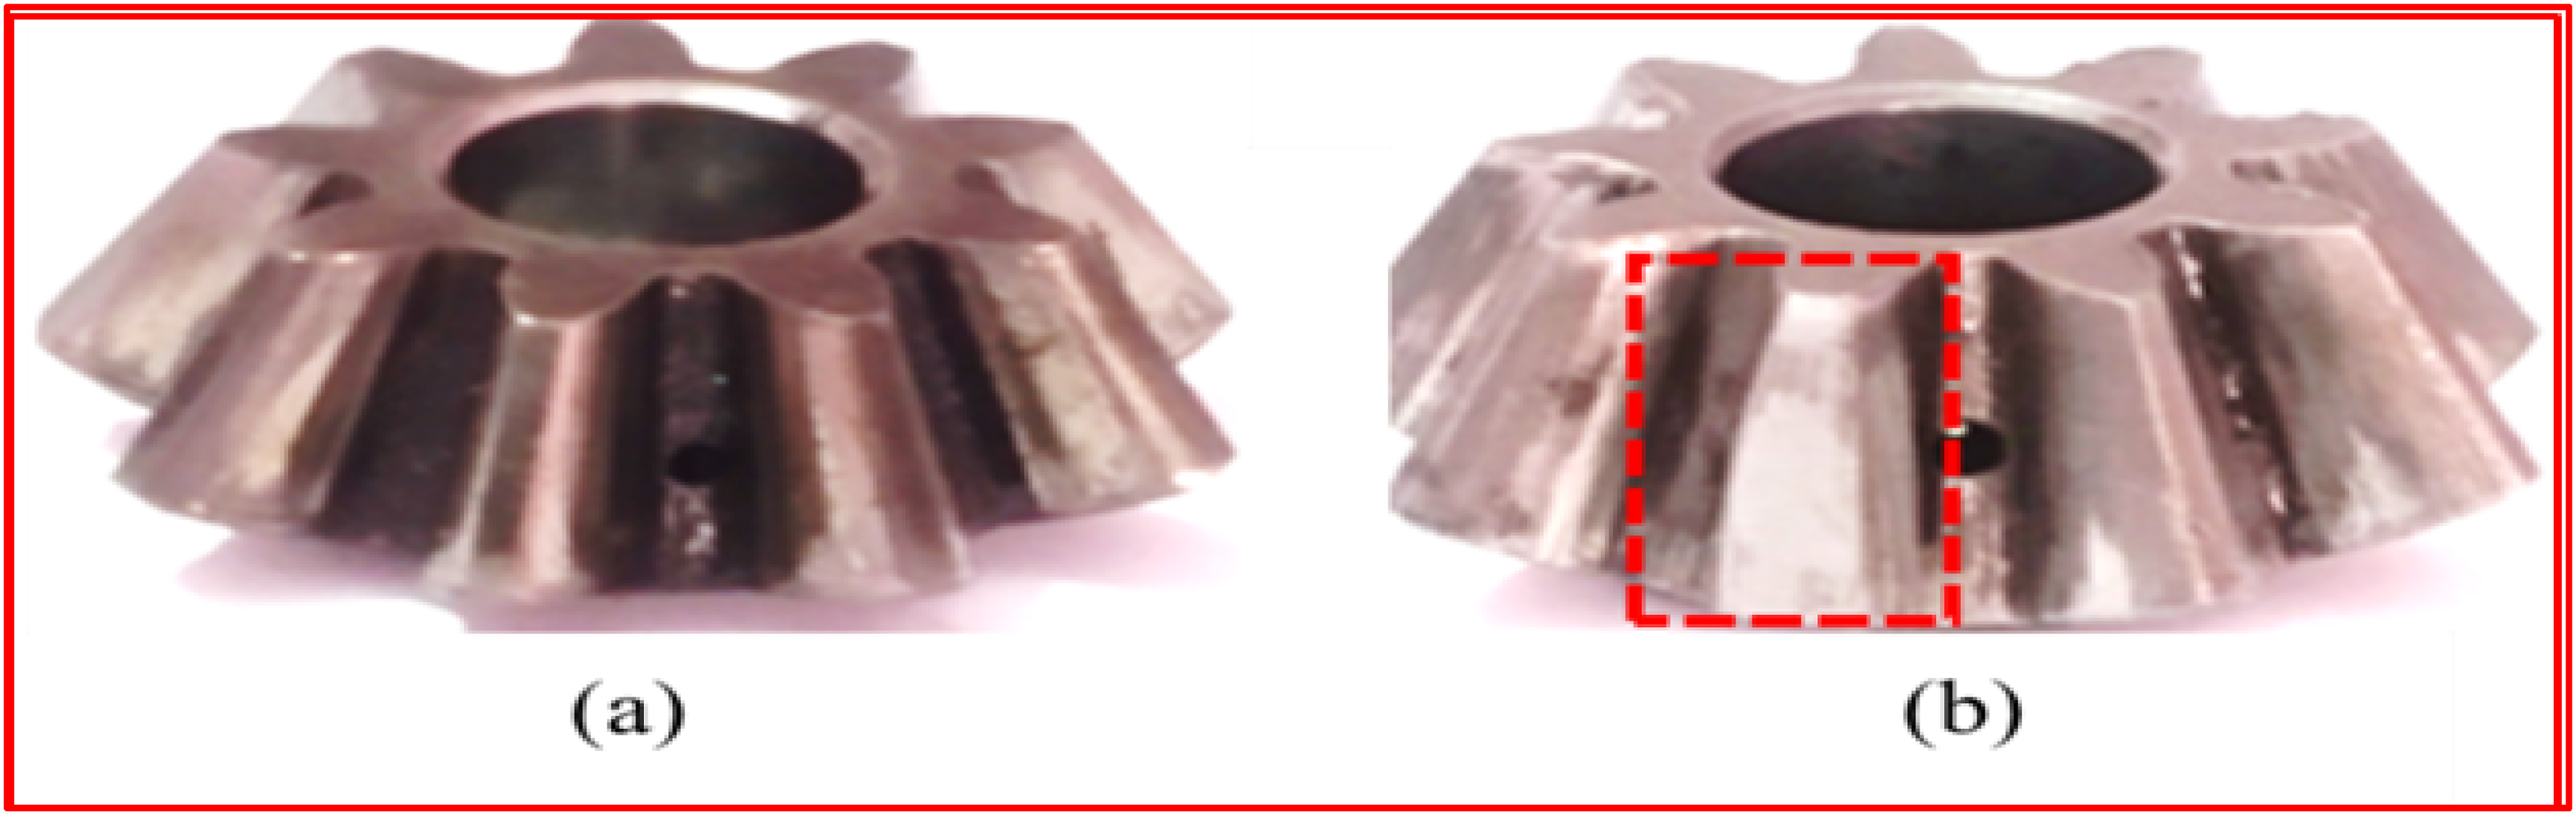
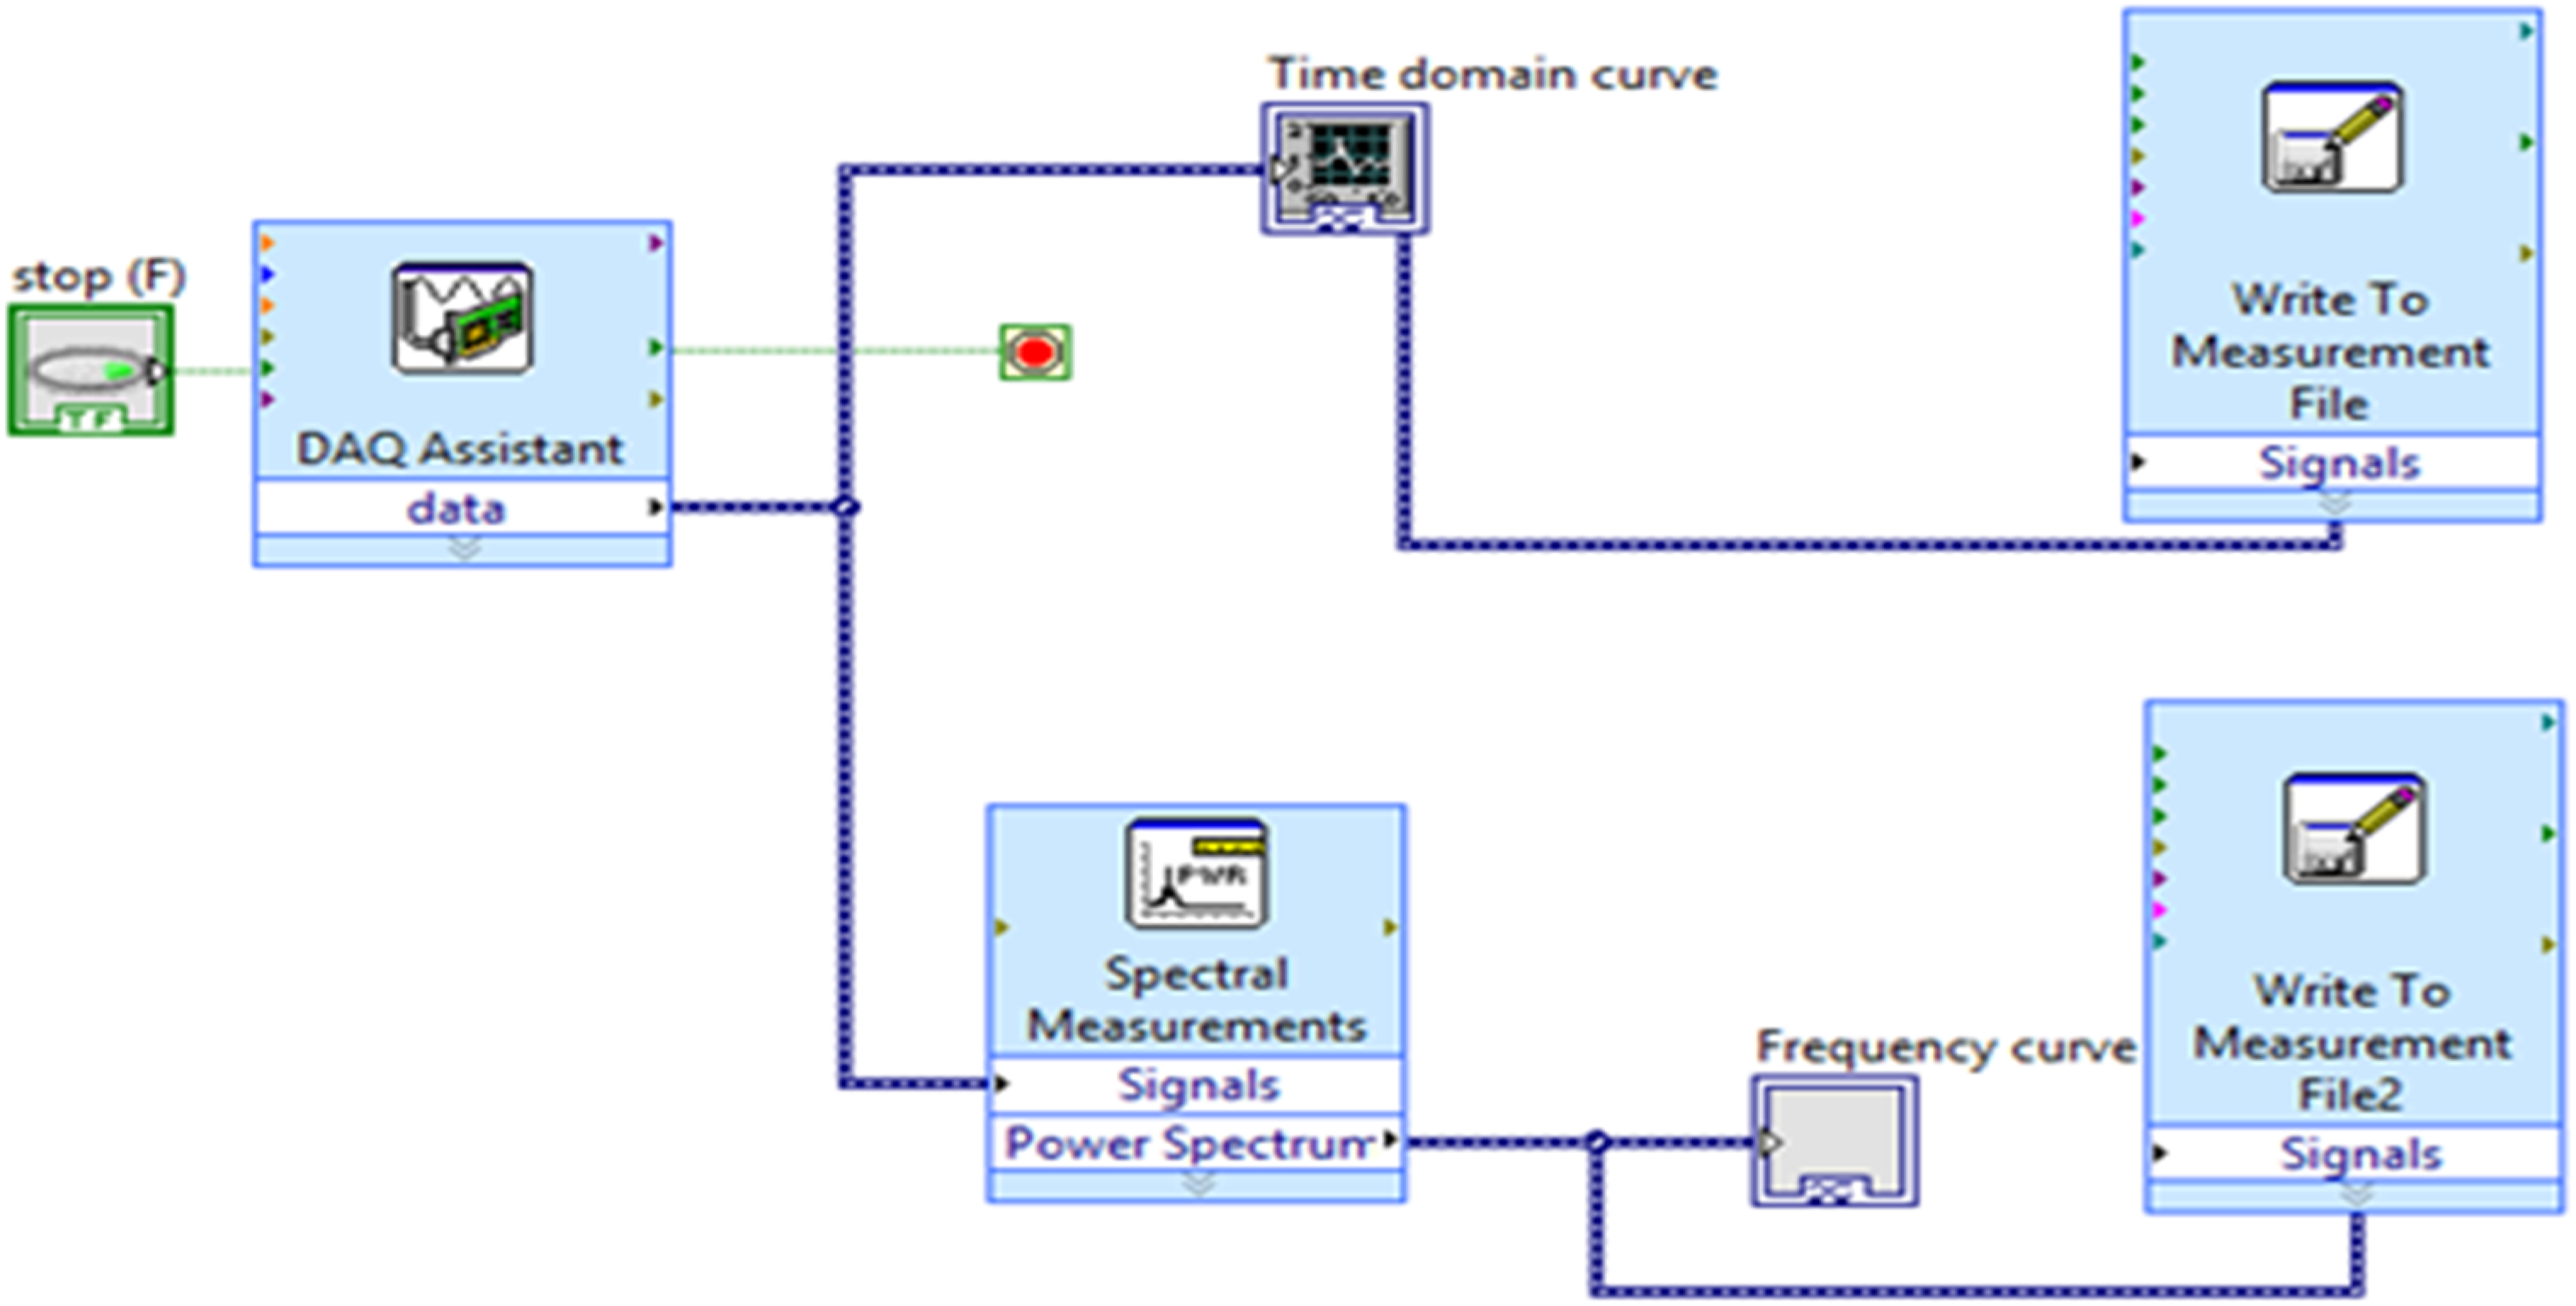
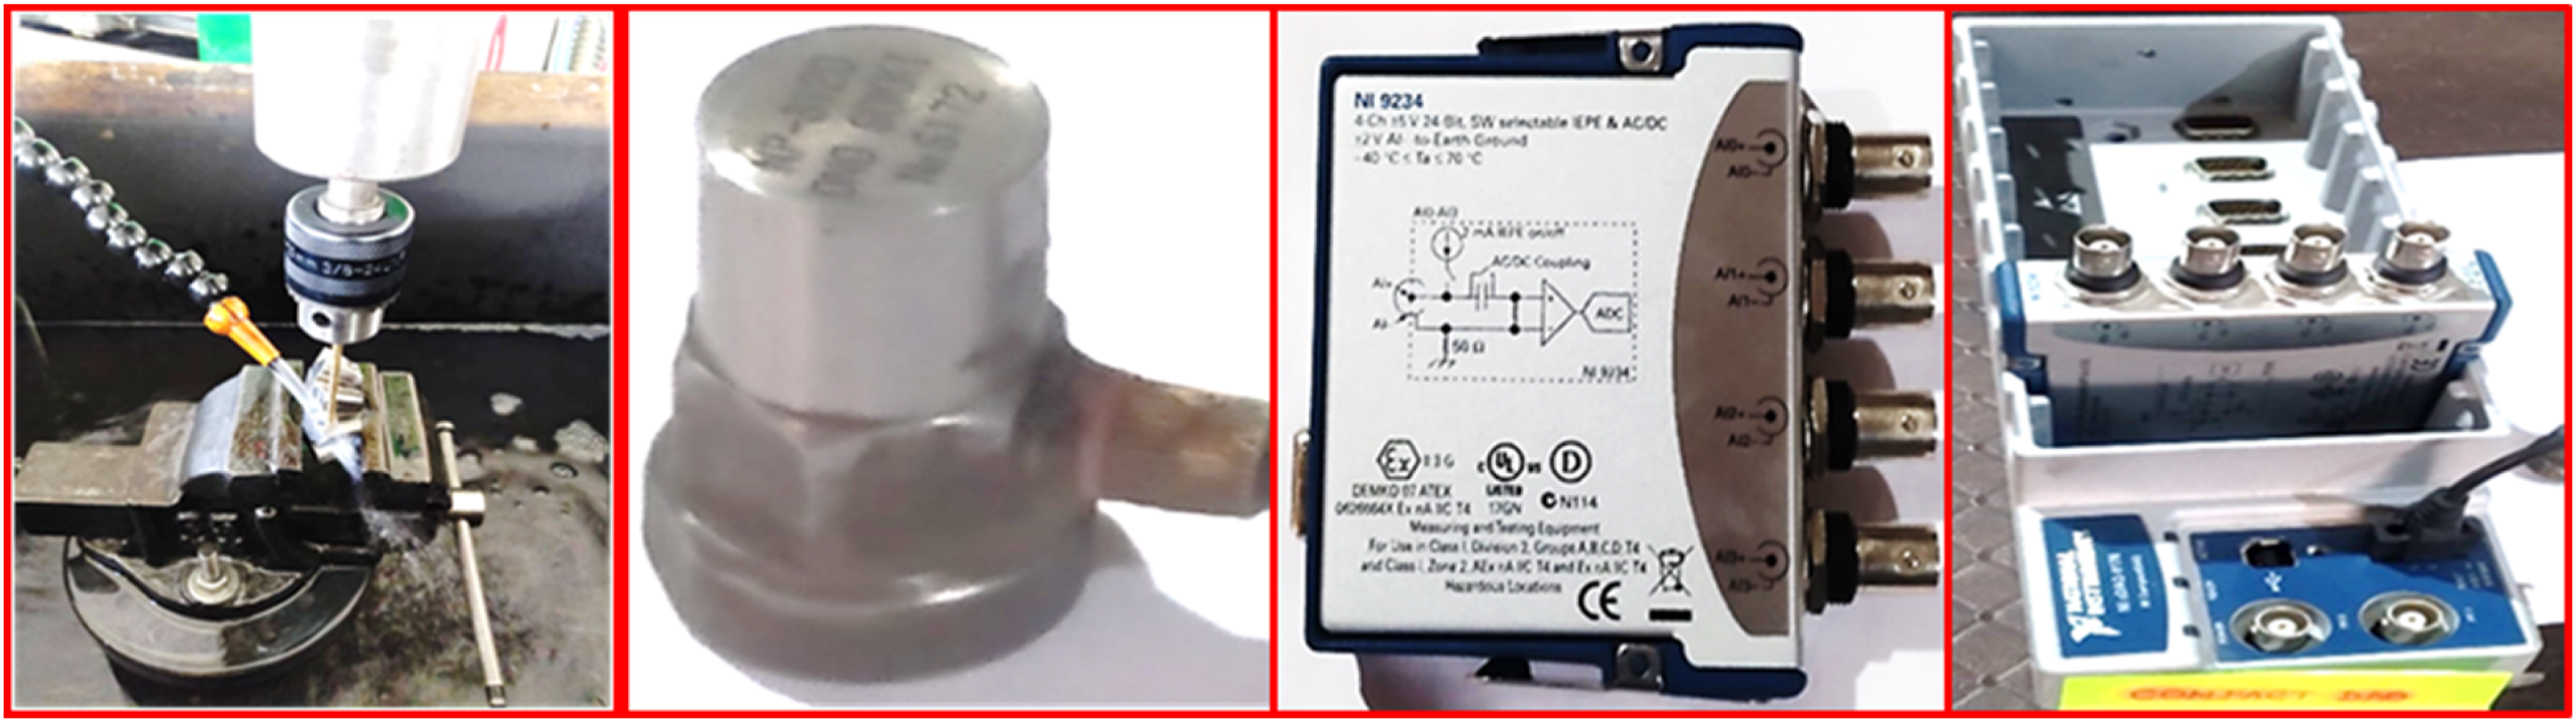
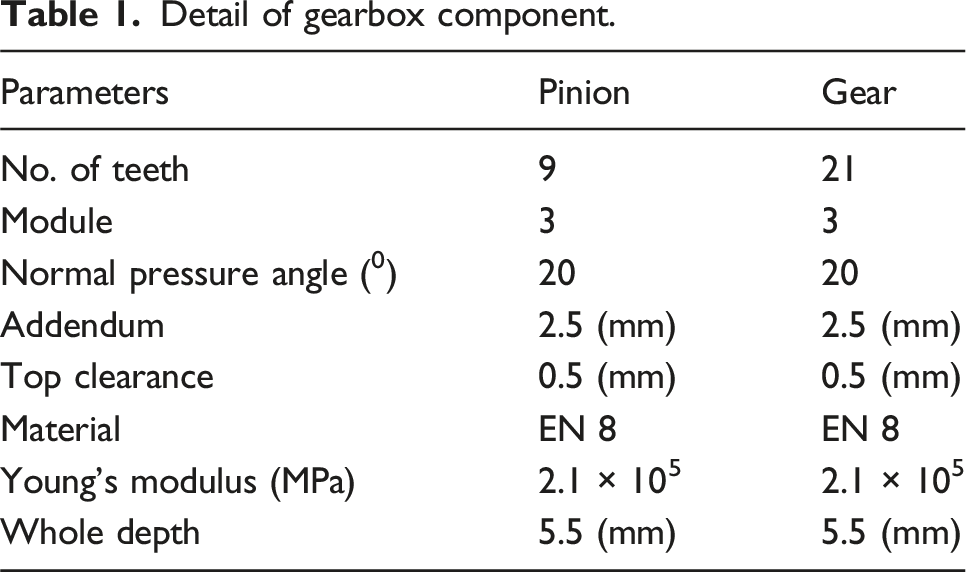
Based on the literature that is currently available, an experimental setup has been created for the necessary bevel gearbox failure diagnosis. Figure 2 depicts the experimental test rig configuration utilized to identify the bevel gearbox’s problem in both real-world and simulated defective conditions. The vibrational signals from the accelerometer were recorded under varying loads and rotating speeds. As a test component, a bevel gearbox is connected to a one-horsepower, three-phase induction motor to transfer power. Gearbox systems can operate at speeds between 100 and 1440 r/min. A frequency range of 1 to 4000 Hz is used to collect the vibration data from an accelerometer with a sensitivity of 10.19 mV/(m/s2). A National Instruments 9234 four-channel data capture kit and NI Lab-VIEW software are used to gather and analyse vibration data. For every set of gear conditions, five sets of trials were carried out at the designated speed, and the data file was saved. A sample length of 12800 and a sampling frequency of 25.6 kHz are selected, and each sample is captured for 0.8 seconds in all scenarios under the specified operating circumstances of load and speed. As a result, each of the 30 data sets contains 20,640 samples. Consequently, 619,200 samples were gathered from both healthy people and those with various illnesses. In this way, a total of 2476800 datasets for both healthy and simulated faulty gears were obtained. Figure 3 displays the bevel gear circumstances that are utilized to determine the gearbox setup’s problem. One gear, which has no defects, was considered to be in normal condition. To control the size of the defect, simulated flaws in other gears were created using an electrical discharge machine on the bevel gearbox. The accelerometer installed on the test equipment was used to extract the vibrational signals. For all situations at (no load, 10 N and 30 N) and (750 r/min, 1000 r/min and 1250 r/min) conditions and a sampling frequency of 25.6 kHz the vibration signals are collected at normal and tooth breakage gearbox. Figure 4 illustrates how Lab-VIEW graphical programming is an effective instrument to create programs that can monitor and regulate equipment, acquire data, and analyse outcomes. The various gearbox component that is necessary to take the vibration signals in normal and faulty condition shown in Figure 5. Table 1, explores into the specifics of a gearbox component; these parameters are essential for gearbox system design and analysis. The efficiency of the gearbox is greatly influenced by each part. This can lower the chance of failure and increase the service life of the machinery by ensuring that machines run smoothly and effectively. Bevel gearbox experimental set-ups. (a) Healthy gear (b) tooth breakage conditions of bevel gear. Lab-VIEW graphical programming. Gearbox component used for vibration signals in normal and faulty conditions. Detail of gearbox component.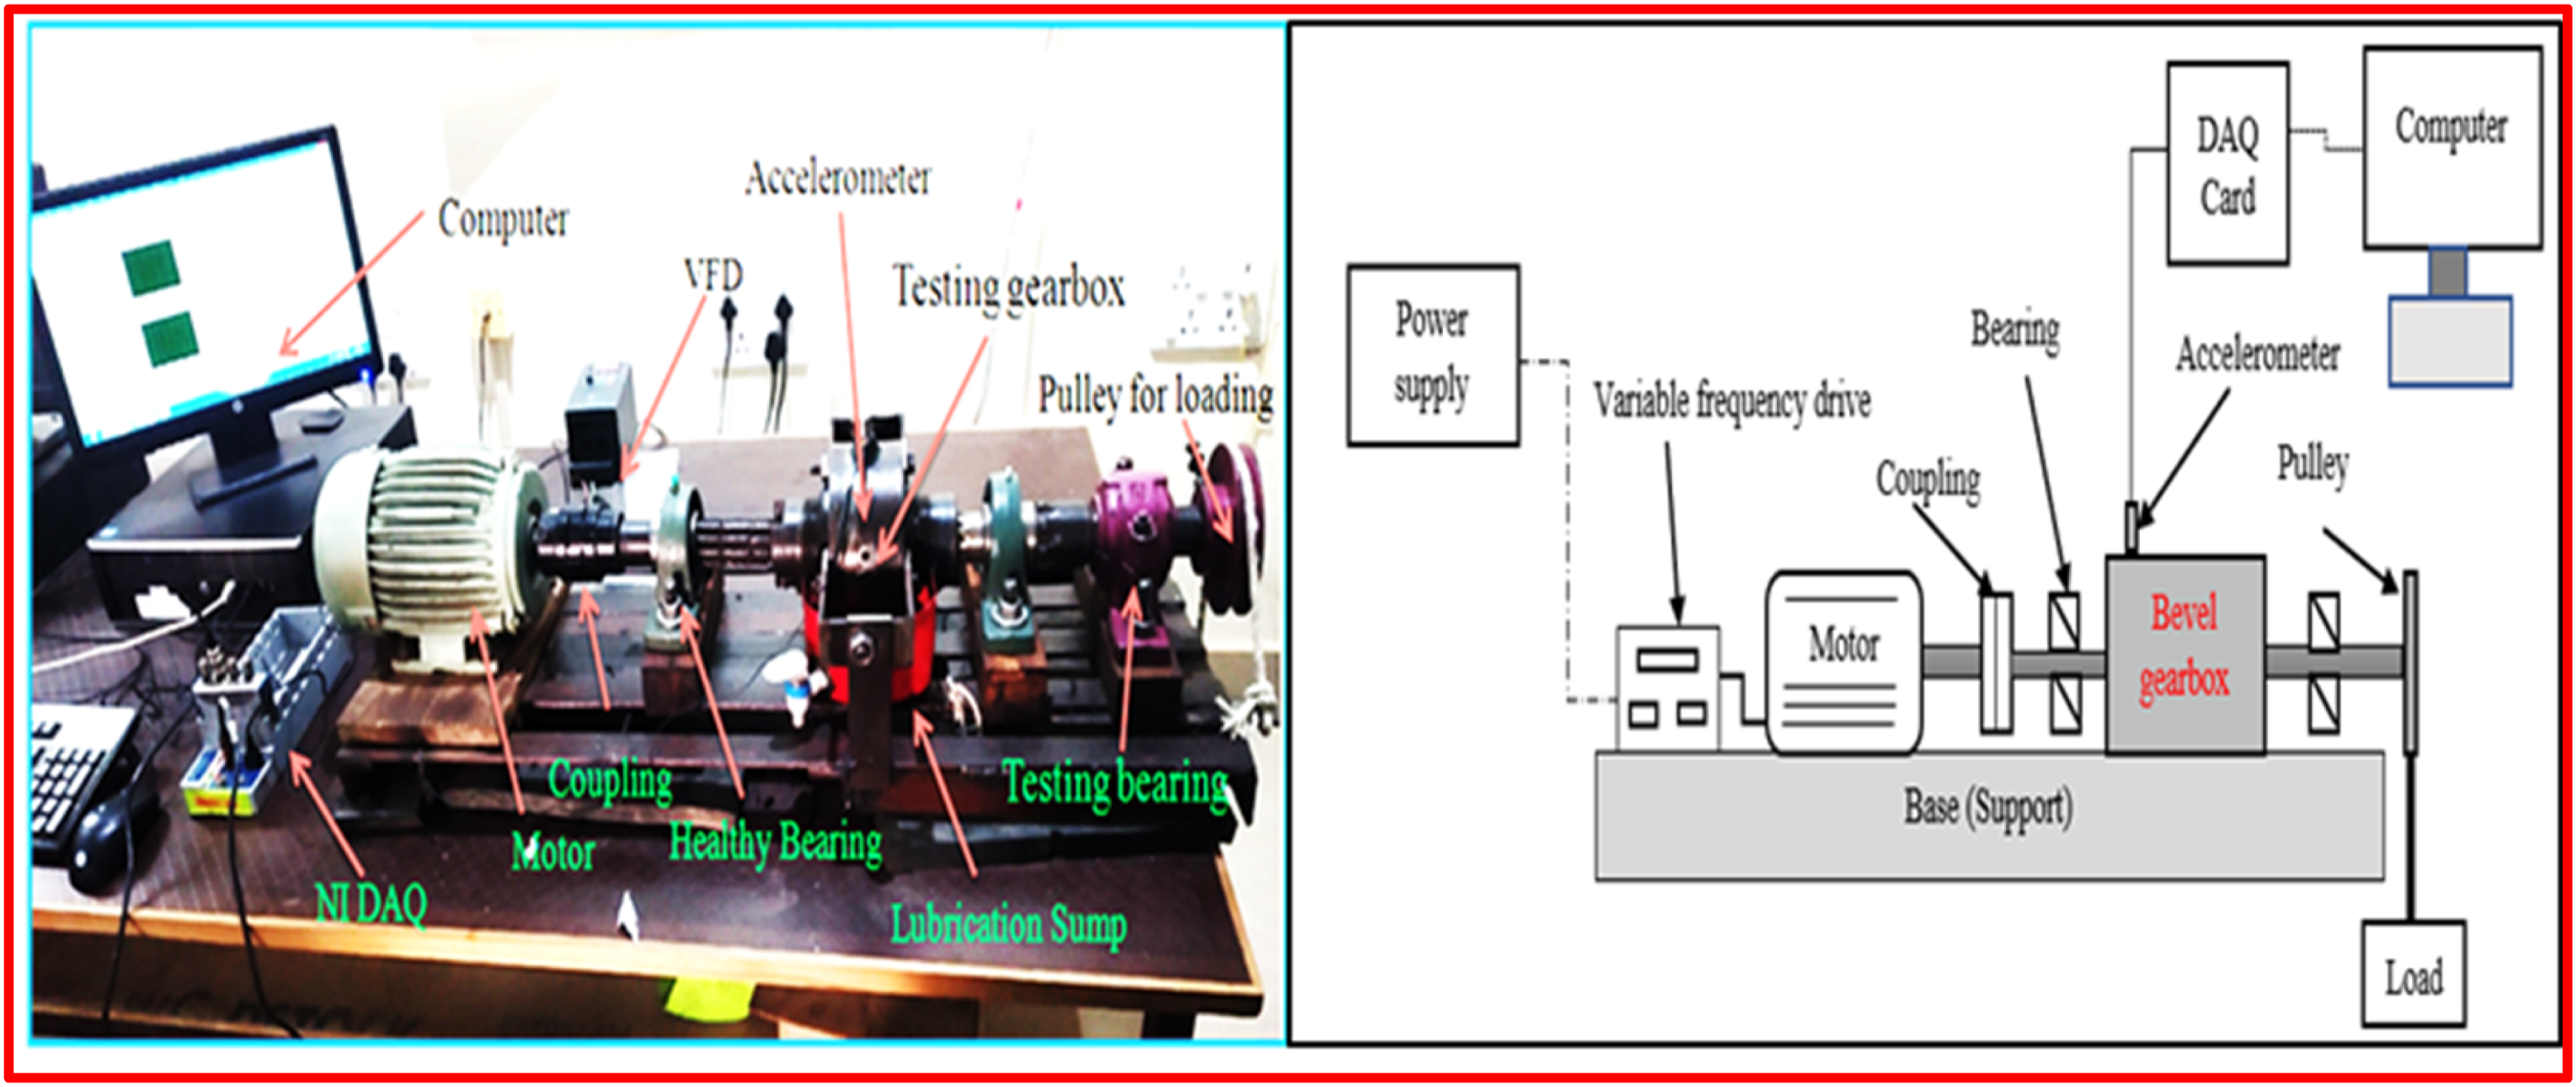
Condition monitoring indicators
Condition monitoring of gears involves tracking certain indicators or parameters that help in detecting and diagnosing faults at an early stage. Time domains condition indicators are more effective for gearbox fault diagnosis because they directly reflect the change in vibration amplitude and pattern caused by defects. They are simple to compute and can detect transient event like impact or shock from crack and tooth breakage. Various condition indicators are used for fault detection of gear systems under normal and faulty condition.
Kurtosis
Kurtosis is a statistical measure used in fault diagnosis to detect the presence of impulsive or abnormal events in vibration signals. In rotating machinery, a healthy system typically shows a Gaussian-like distribution with a kurtosis value close to 3. When a fault such as a crack or bearing defect occurs, it generates sudden spikes in the signal, increasing the kurtosis significantly. This makes kurtosis a reliable indicator for early fault detection. Its simplicity and sensitivity to transients make it widely used in real-time condition monitoring systems. Kurtosis
23
is the scaled form of fourth moment, to find tallness in probability distribution curve and represented using equation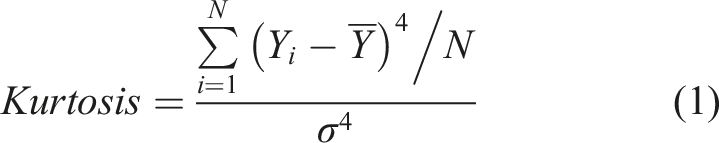
Energy operator
The energy operator, often referred to as the Teager–Kaiser Energy Operator (TKEO), is used in signal processing to measure the instantaneous energy of a signal. It is particularly effective for detecting rapid changes or transients in vibration signals, making it useful in fault diagnosis. By emphasizing sharp variations, it helps identify early-stage faults in mechanical systems. It is determine the normalized kurtosis
24
from the signal where each point is analysed as the difference of two squared neighbourhood points of the original signal.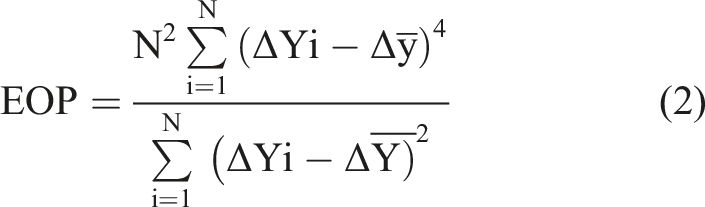
Root mean square
Root Mean Square is a widely used feature in fault diagnosis to measure the overall energy or power content of a vibration signal. It reflects the effective amplitude of the signal and increases when faults like imbalance or misalignment occur. Root mean square is useful for detecting gradual changes in machine health over time. Root mean square
25
is amplitude modulated Gaussian random process and is expressed using equation: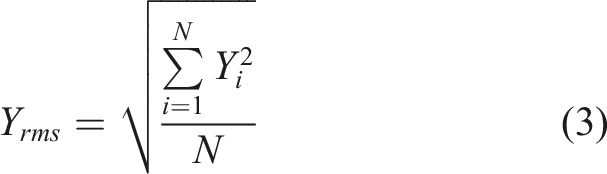
Mean
The mean is a basic statistical feature that represents the average value of a signal over time. In fault diagnosis, it helps establish the normal behavior or baseline of a system. Any significant shift in the mean can indicate a potential fault or change in operating condition. Mean
25
is given by sum of values of sample data to the total number of sample. It is given by equation: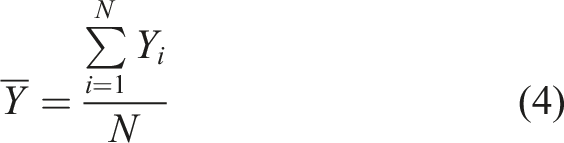
Standard deviation
Standard deviation measures the amount of variation or dispersion in a signal. In fault diagnosis, a higher standard deviation often indicates increased vibration levels due to faults like wear or looseness. It helps identify deviations from normal operating conditions. Standard deviation
25
is a quantity expressing by how much the members of a group differ from the mean value for the group.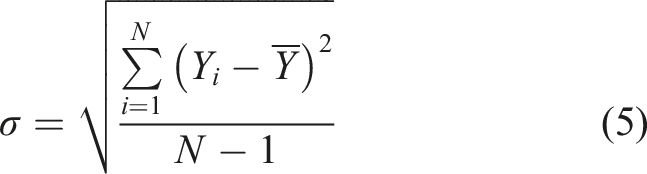
Crest factor
Crest Factor is the ratio of the peak value to the Root mean square value of a signal and is used in fault diagnosis to detect impulsive faults like cracks or bearing defects. A higher crest factor indicates sharp spikes or impacts in the signal. It helps differentiate between steady-state and transient vibration components. Crest factor
24
is the Ratio of maximum amplitude value to square of mean of root of absolute values and represented by following expression:
Energy ratio
In fault diagnosis, the energy ratio is a feature used to analyse the distribution of signal energy across different frequency bands, aiding in the detection and classification of faults. It is typically calculated by decomposing a vibration signal into multiple frequency components using methods like Wavelet Packet Transform. The energy of each frequency band is then computed, and the energy ratio for a specific band is determined as the proportion of its energy to the total energy of all bands. It is the ratio
25
between the energy of the difference signal and the energy of the regular meshing component.
Variance
Variance measures the spread of vibration signal data points around the mean, indicating the level of deviation from normal operation. An increased variance often suggests the presence of faults such as imbalance or misalignment in machinery. It simply the square of standard deviation and represent absolute deviation
25
of date from mean.
Shape factor
Shape Factor is a dimensionless parameter used in fault diagnosis to assess the form of a vibration signal’s waveform. It is defined as the ratio of the Root Mean Square value to the average of the absolute values of the signal, providing insight into the distribution of energy within the waveform. A deviation from the normal shape factor value can indicate abnormalities such as misalignment or imbalance in rotating machinery.
25
Performance assessment of condition indicators
Condition indicators at 750 r/min.
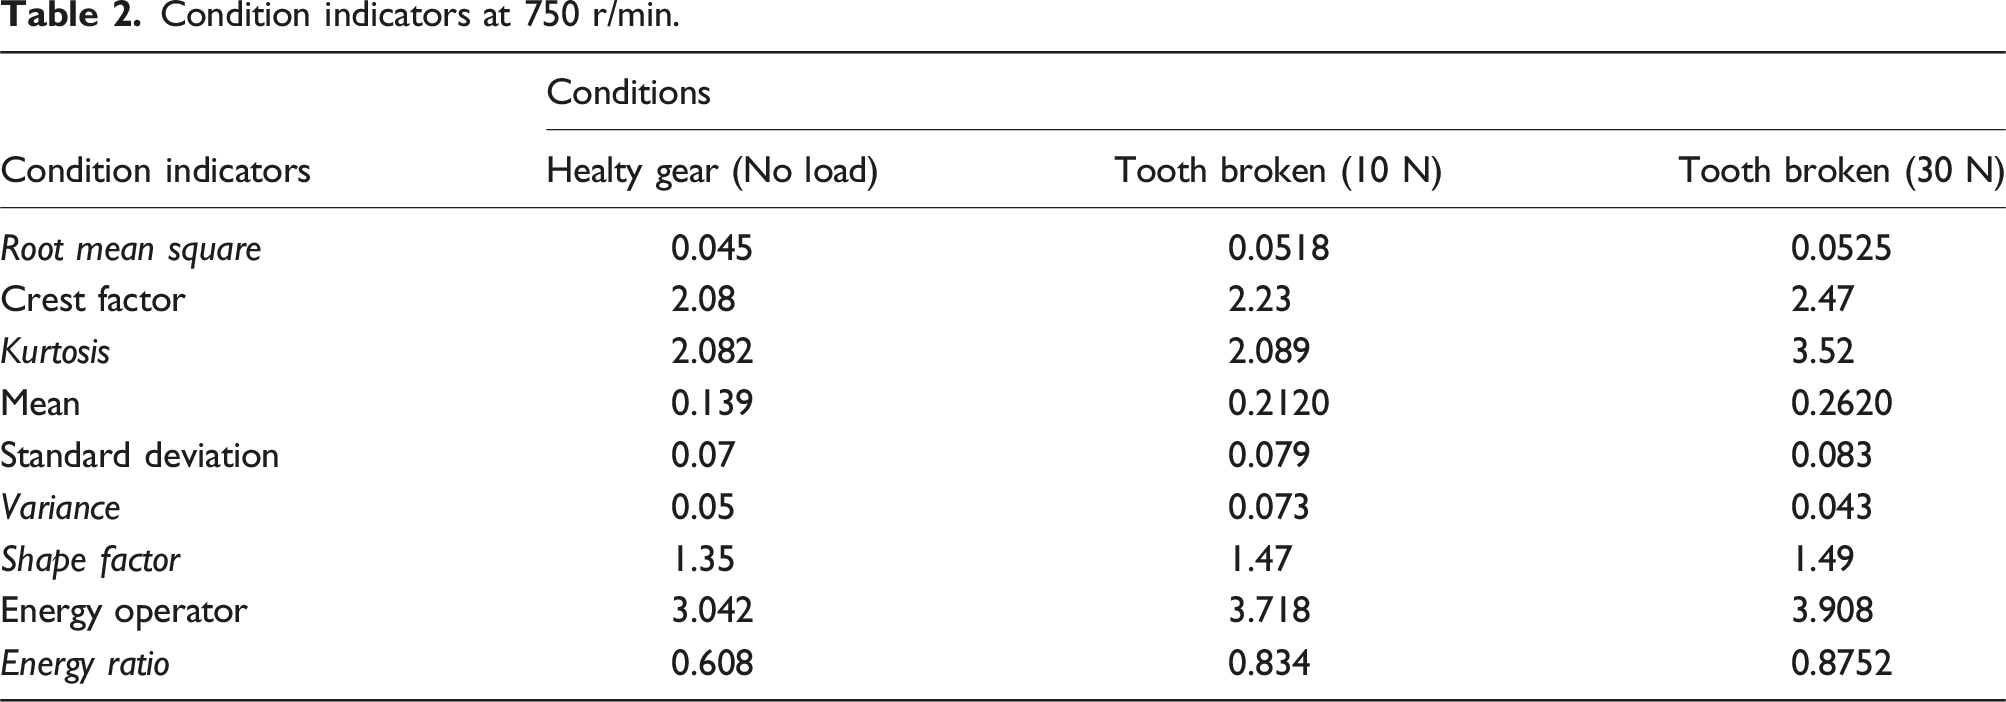
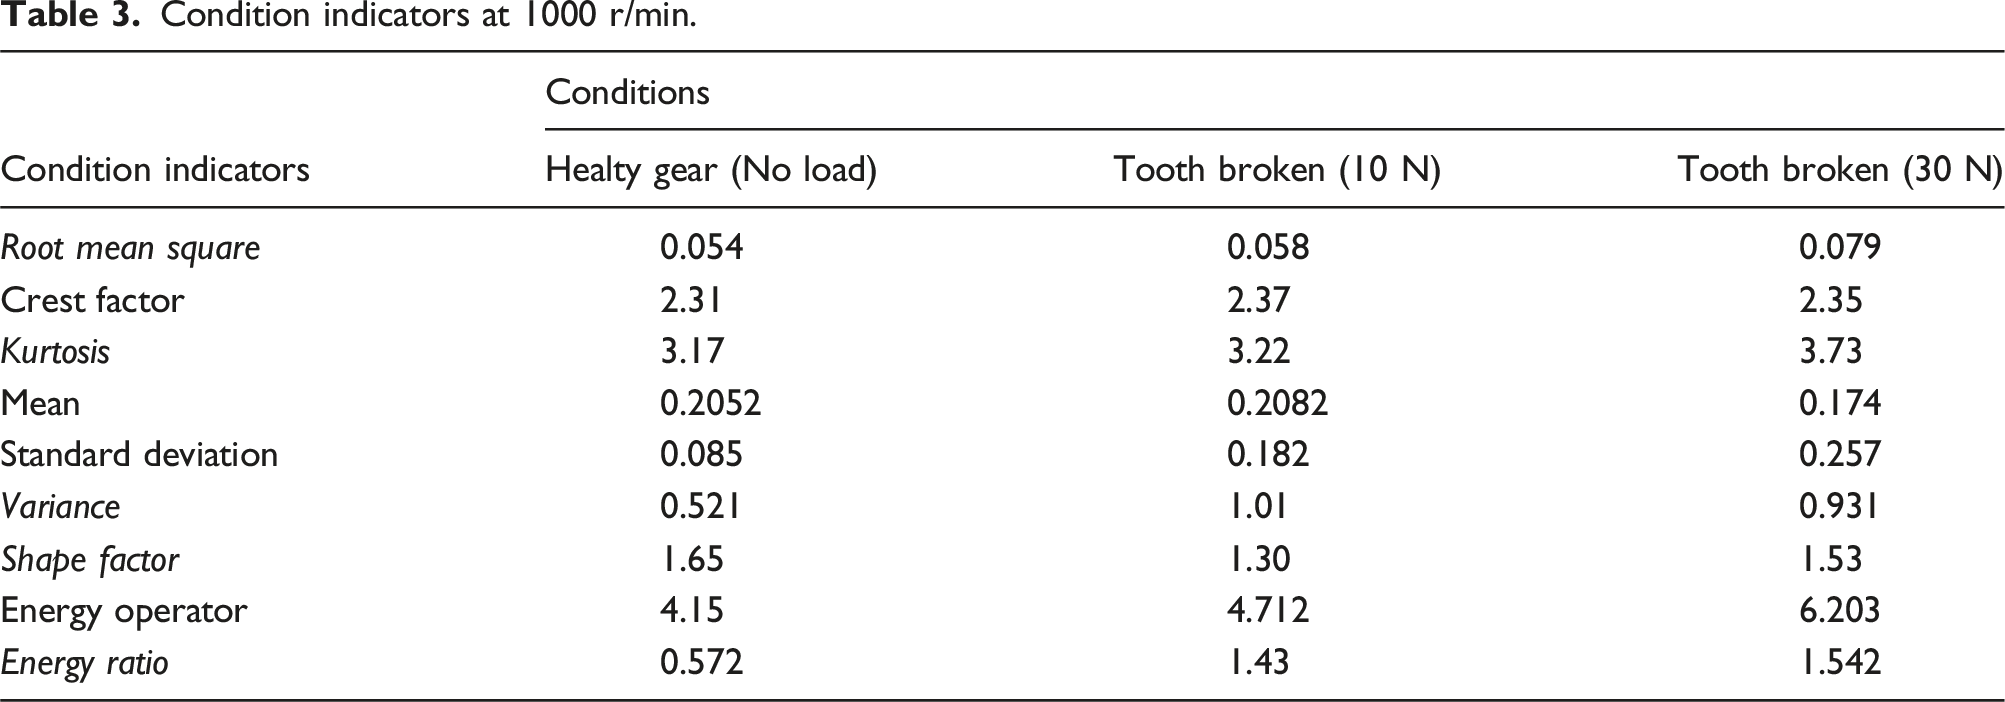
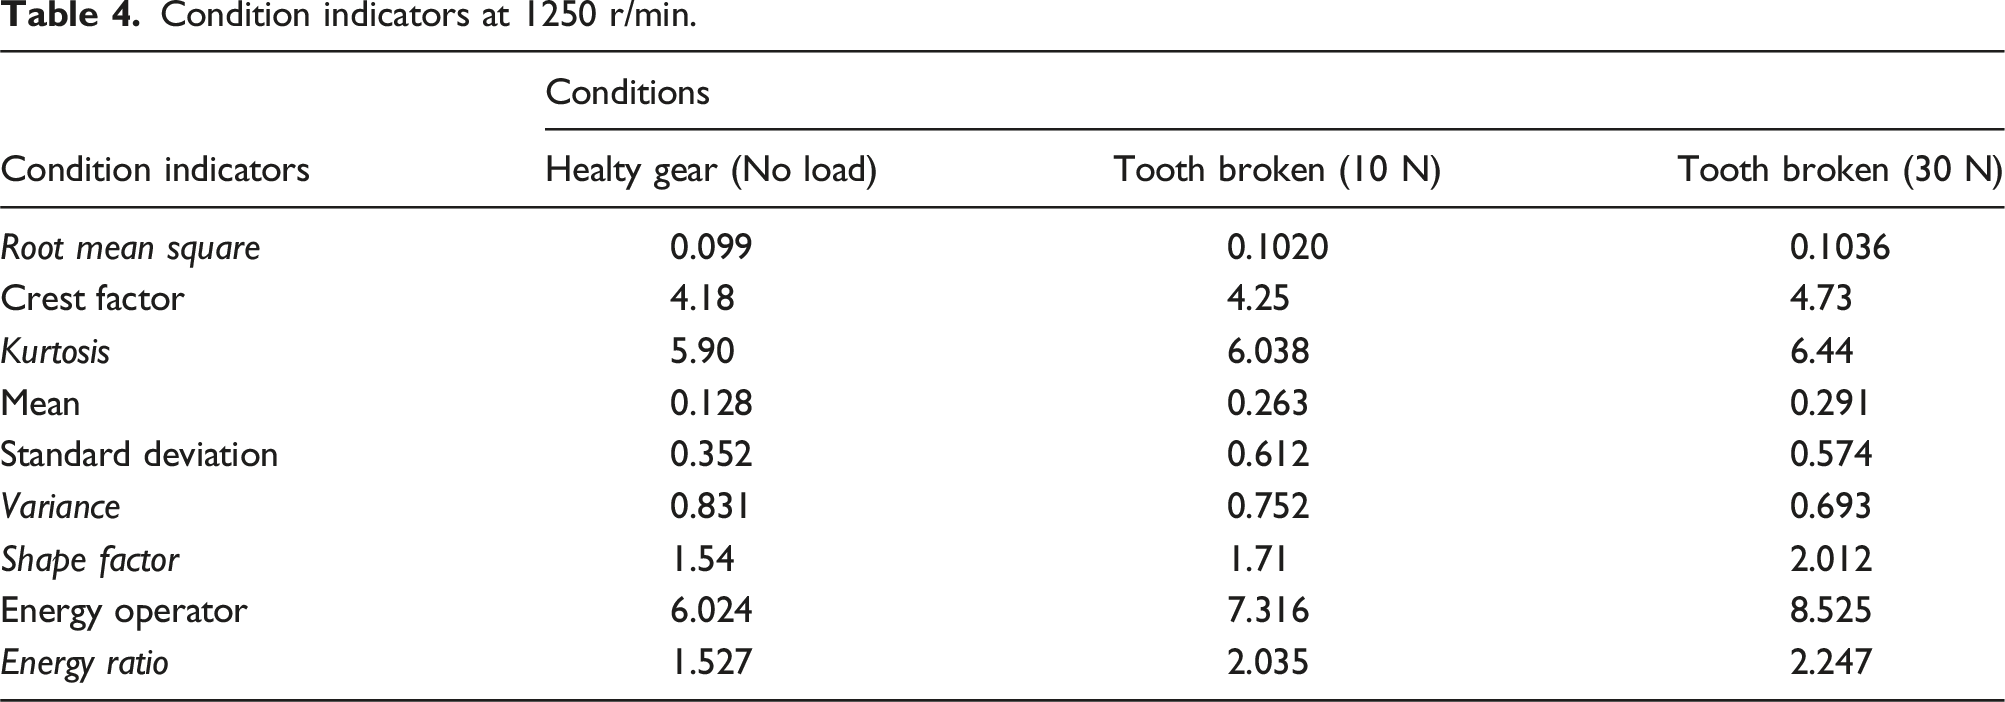
Figure 6 shows a bevel gearbox’s vibration waveforms at 1000 r/min at different loading conditions. To comprehend how gear health affects vibration behaviour, these waveforms are essential. In contrast to problems like tooth breakage or multiple faults, which add inconsistencies and larger amplitudes, normal gear usually shows minimum and consistent vibration levels. The Root Mean Square values increase with fault severity, indicating that tooth breakage leads to higher vibration levels. The Crest Factor, which reflects the ratio of peak amplitude to the Root mean square, also shows an increase, suggesting that faults result in more pronounced peaks in the vibration signal. Similarly, Kurtosis values rise, indicating that faults lead to more extreme values in the signal distribution. Other indicators such as Mean, Standard Deviation, Variance, Shape Factor, Energy Operator, and Energy Ratio also demonstrate increasing trends with fault severity, highlighting the growing variability and energy content in the vibration signals due to faults. In Table 3, the analysis continues at 1000 r/min, where the Root mean square values again increase with fault severity, although the Crest Factor remains relatively stable, indicating that peak amplitudes are less affected by load changes compared to the lower speed. The Kurtosis values continue to rise, reinforcing the trend of increased extremity in the vibration signal due to faults. The Mean shows a decrease with increasing load, suggesting that higher loads may reduce average vibration levels, while Standard Deviation and Variance increase, and indicating greater variability in the signals. The Shape Factor, Energy Operator, and Energy Ratio also reflect changes consistent with fault severity. Table 4 presents the indicators at 1250 r/min, where the Root mean square values continue to rise with fault severity, and the Crest Factor shows a notable increase, indicating that peak amplitudes are significantly affected by faults at this speed. The Kurtosis values further increase, suggesting that faults lead to even more extreme values in the vibration signal. The Mean increases with fault severity, while Standard Deviation and Variance continue to reflect greater variability in the signals. Overall, the tables illustrate how various condition indicators respond to different fault conditions in gear systems, emphasizing the importance of considering operational conditions when interpreting these metrics for effective fault diagnosis. The increasing values of Root mean square, Crest Factor, Kurtosis, and other indicators with fault severity suggest that these metrics are effective for diagnosing gear health and detecting faults. Time domain amplitude at 1000 r/min (a) normal no load (b) tooth breakage 10 N (c) tooth breakage 30 N Condition indicators at 1000 r/min. Condition indicators at 1250 r/min.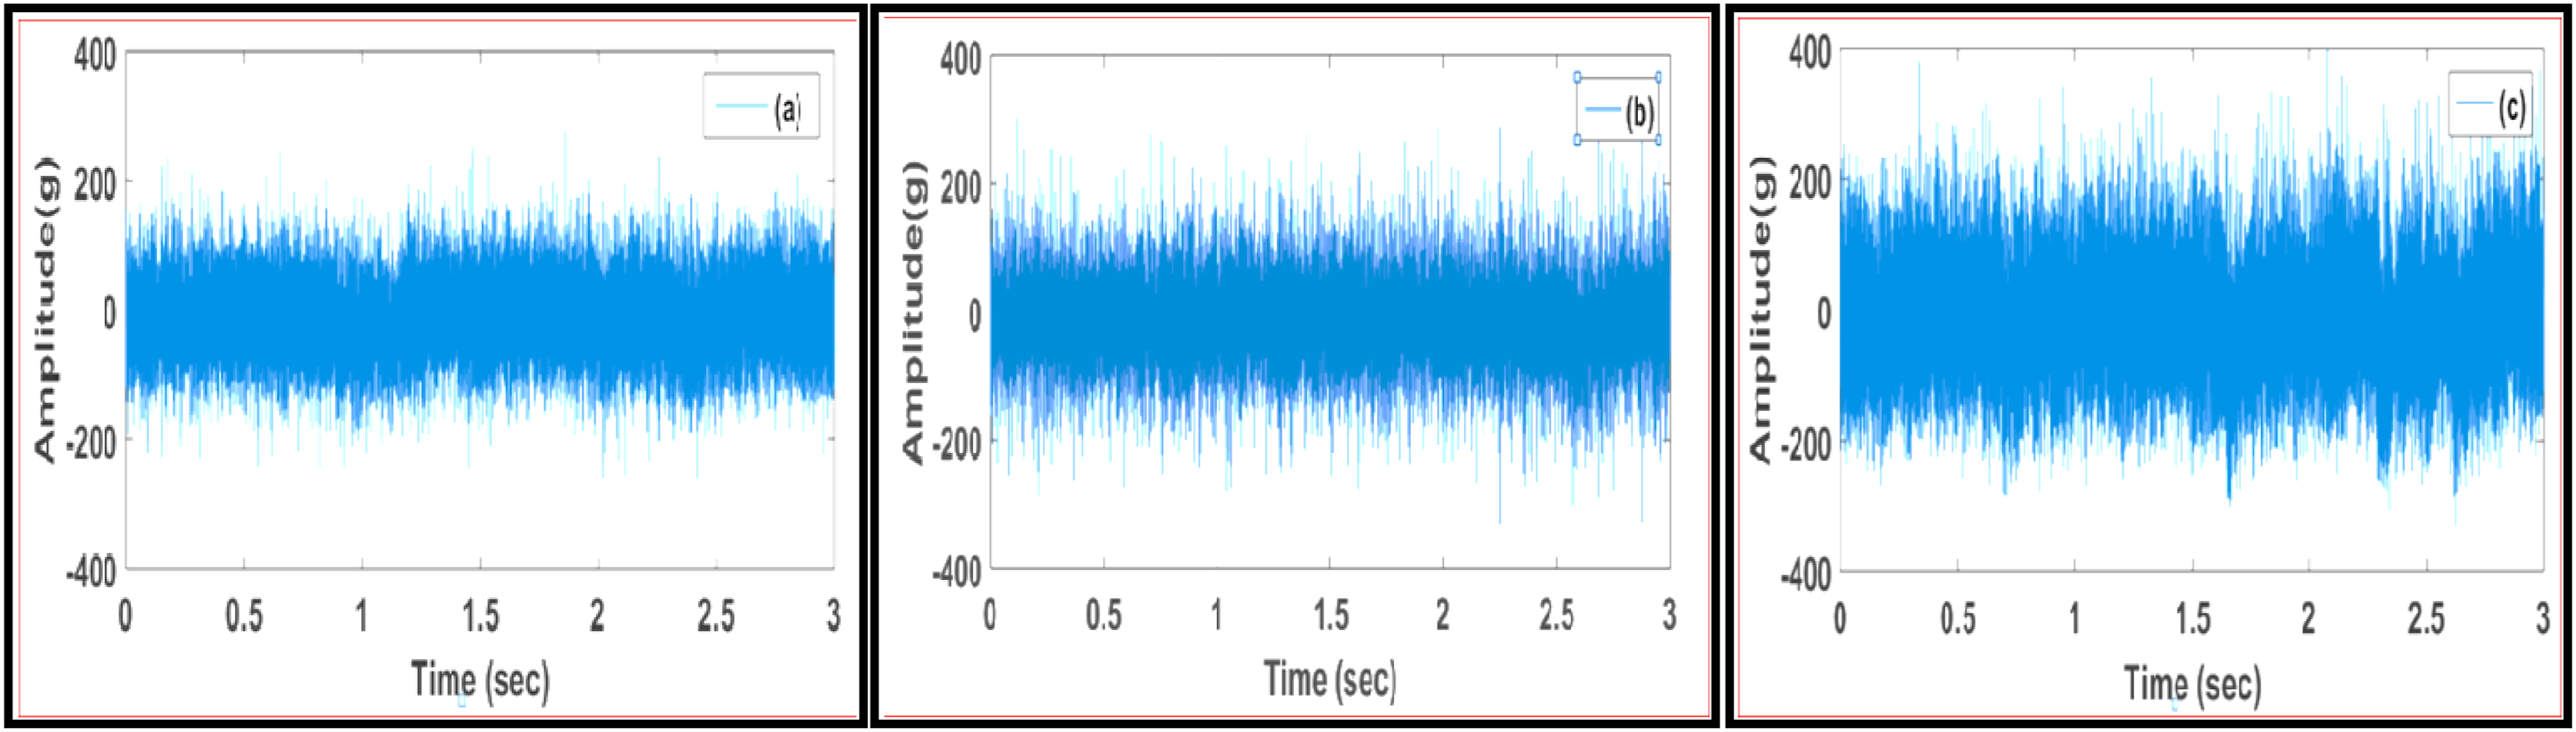
The graph illustrates the variation of condition indicators under healthy and tooth breakage conditions of gear systems, highlighting the impact of different operational parameters such as speed and load on the performance of these indicators. As the load increases, the Condition indicator generally shows an upward trend, indicating that the presence of faults, such as tooth breakage, leads to higher values across various indicators. For instance, the Root Mean Square and Crest Factor exhibit significant increases, suggesting that faults result in greater vibration amplitudes and more pronounced peaks in the vibration signal. Additionally, the Kurtosis values rise, indicating that the distribution of the vibration signal becomes more extreme in the presence of faults, reflecting a higher likelihood of significant deviations from the mean. The graph effectively demonstrates that as the operational conditions change, particularly with increased load and speed, the condition indicators become more sensitive to the health status of the gear systems, thereby providing valuable insights for fault diagnosis and maintenance strategies. Overall, the trends depicted in the graph underscore the importance of monitoring these indicators to assess gear health and detect potential failures proactively.
Result and discussions
The comparative study of different condition indicators which are used by several researchers for gear fault detection and diagnosis under the variable working conditions have been shown here. The various condition indicators enlisted by the gear systems are used as a measure of the peaked-ness of the vibration signal. Increasing the value of the Condition indicator showed the faulty condition of gear systems. It can be concluded from It can be concluded from Figure 7 that for the case of 750 r/min and different loading conditions, all the condition indicators are working well showing an increasing trend while Mean values are more responsive towards fault diagnosis. For the case of 1000 r/min and different loading conditions, the mean value decreases with increasing load whereas the shape factor cannot predict fault diagnosis other condition indicators increase with a load but the energy ratio and standard deviation give the more responsive towards the fault. Similarly, at 1250 r/min energy operator, mean value and shape factor will give a better fault response towards fault as compared to other indicator parameters. With increasing the speed all the condition indicators parameters are increasing except the crest factors, mean value, shape factors and variances. Also, with increasing load all the indicators are working well showing increasing patterns except mean value, shape factor and variance. Variation of condition indicators for different speed and loading conditions for bevel gearbox.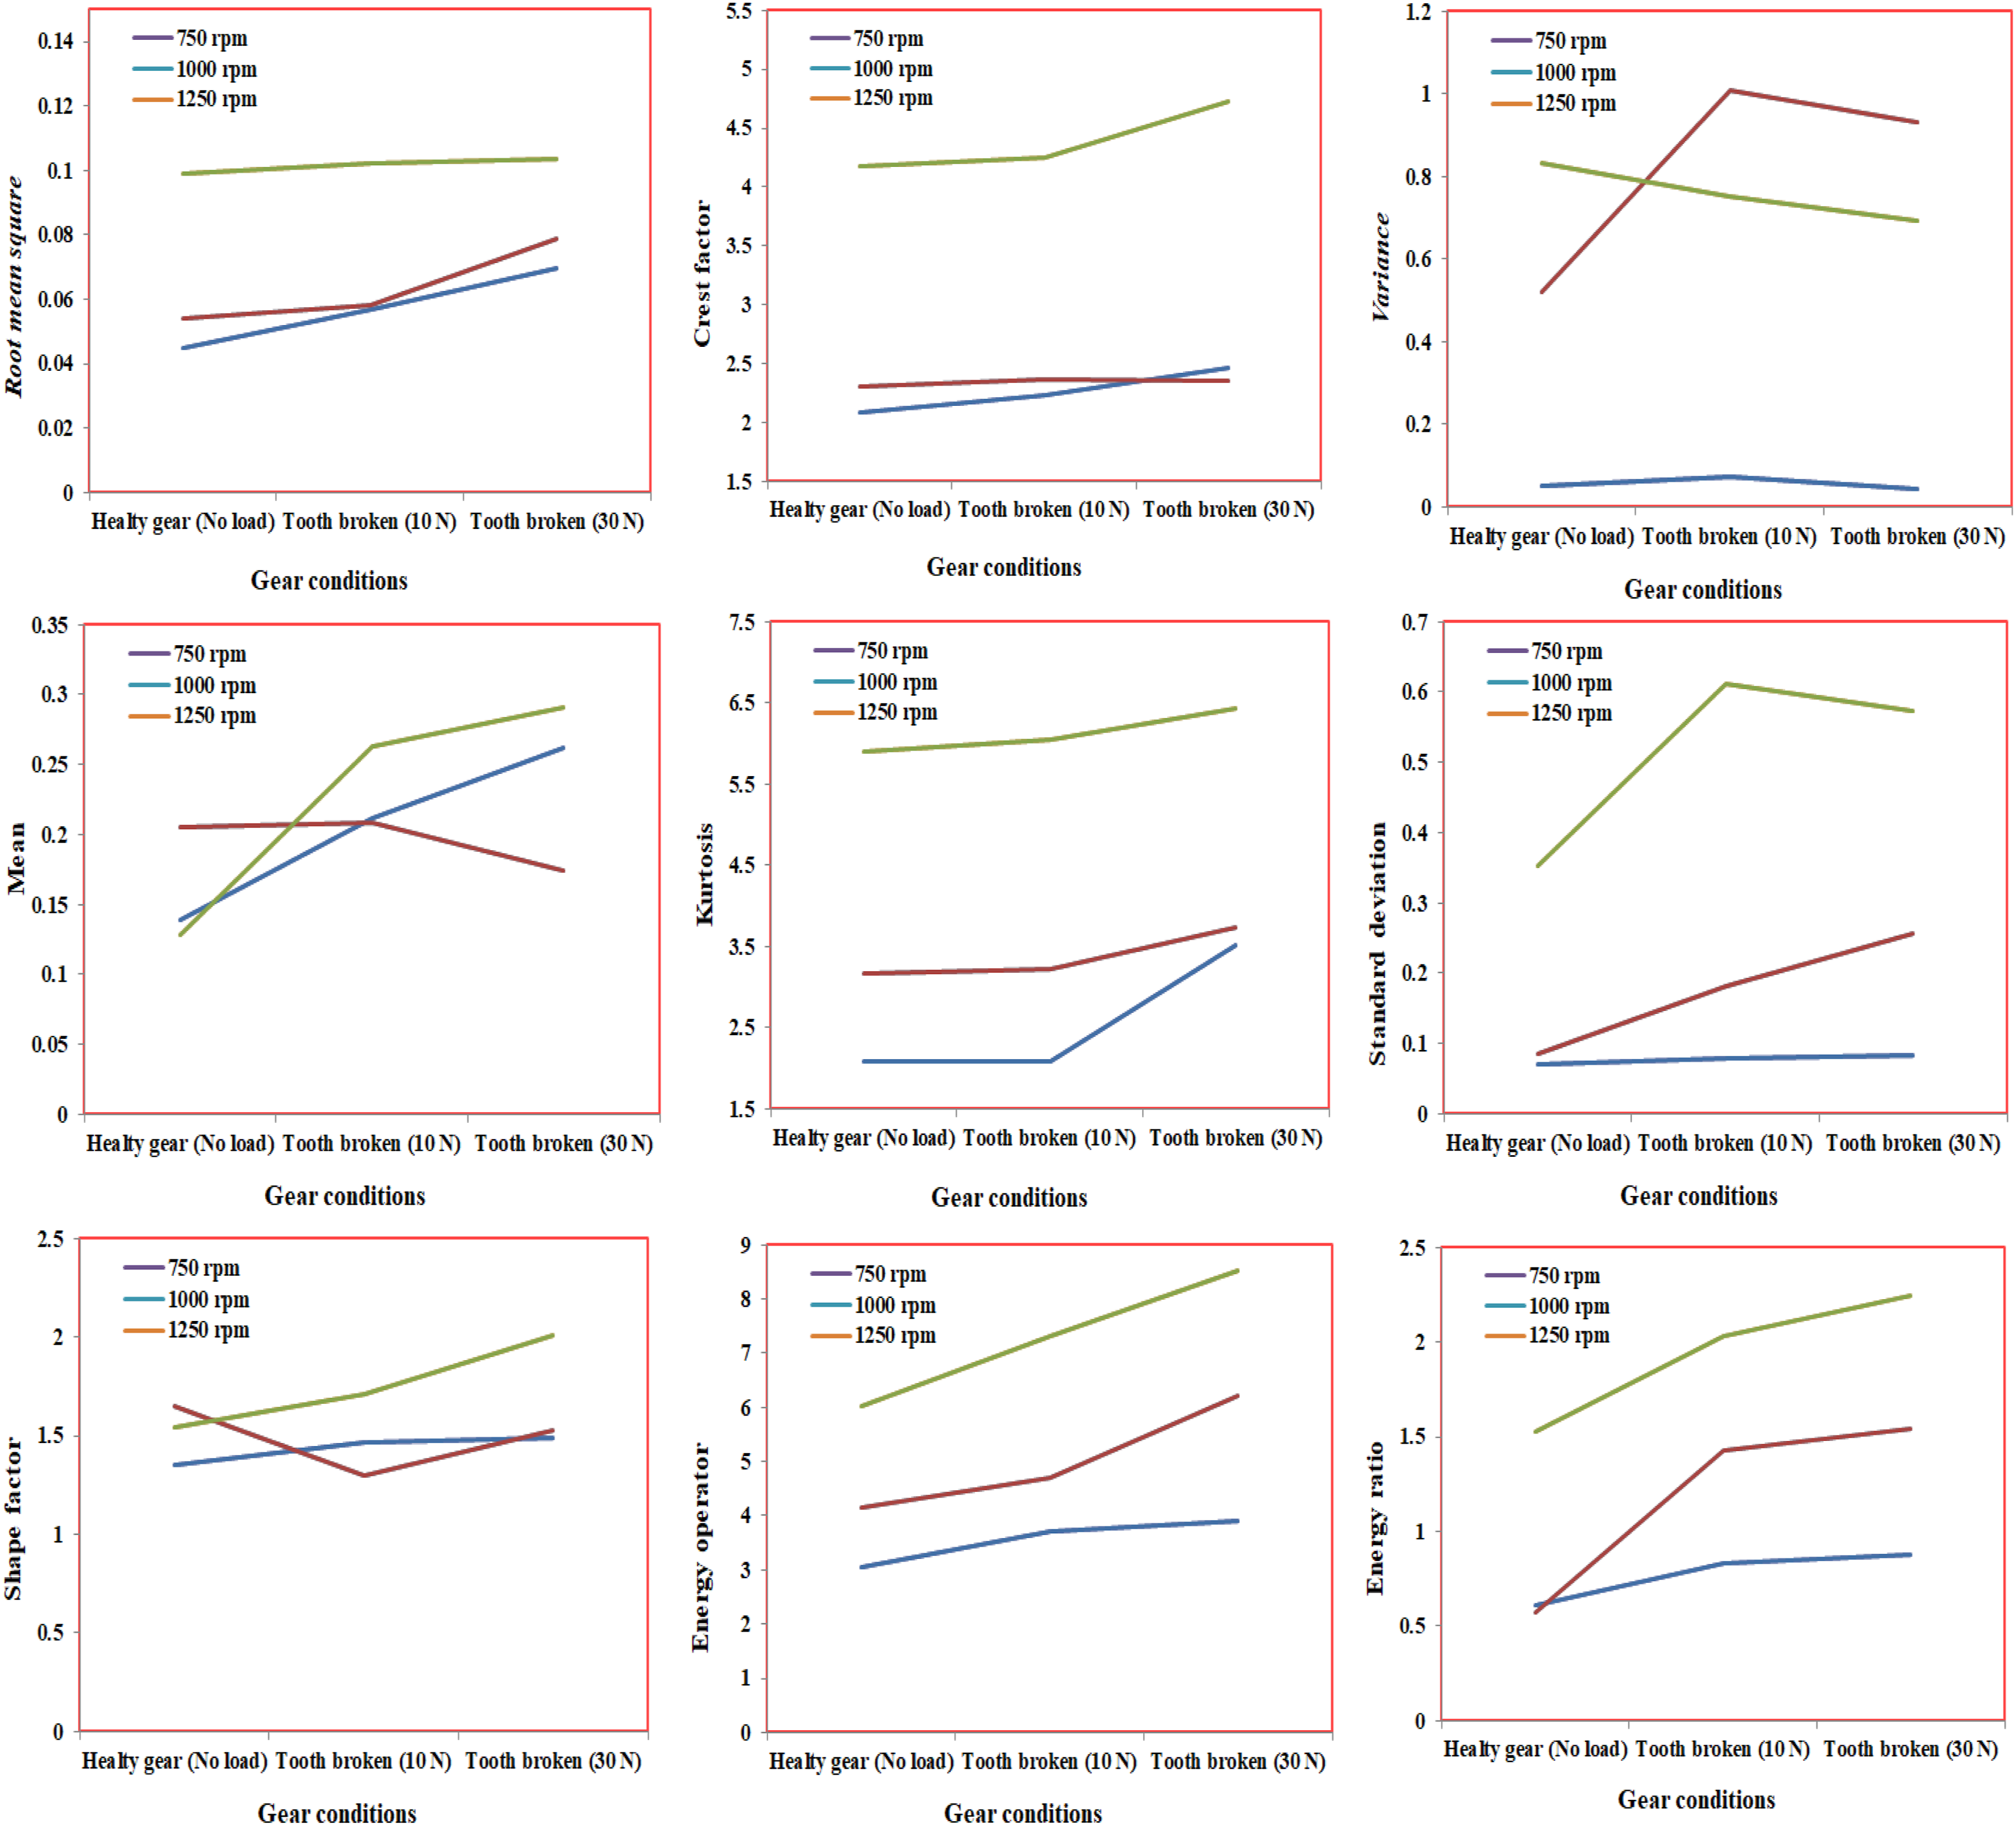
The results indicated that all tested Condition indicators demonstrated a marked increase in values when faults were present, confirming their sensitivity to changes in the gearbox’s health. Specifically, at a speed of 750 r/min, the Condition indicator exhibited a consistent upward trend with increasing load, suggesting that higher loads exacerbate the effects of faults, making them more detectable. This finding aligns with the understanding that mechanical stress can amplify the vibrational signatures associated with gear defects. Among the Condition indicators tested, the time-domain indicators, particularly the Root mean square value, emerged as the most effective for diagnosing gearbox faults. The Root mean square value directly correlates with the amplitude of vibration, making it a reliable indicator of mechanical integrity. The study found that as faults developed, the Root mean square values increased substantially, providing a clear signal for maintenance intervention. Additionally, the Crest Factor and Kurtosis values also increased, but their sensitivity varied depending on the specific fault type and operational conditions.
Conclusions
In this paper, the experiments have been performed for gear systems at various speeds and loading conditions. A comparative study among various condition indicators is performed under healthy and faulty conditions of gear systems. Based on the condition indicators parameters study a performance evaluation technique is presented, the techniques compare how these condition indicators respond to health and tooth breakage gear systems and provide a quantitative method to compare the capability of various condition indicators to differentiate fault from original vibration signal. The findings highlight the importance of selecting appropriate condition indicators based on specific operational parameters, as their performance can vary with changes in load and speed. Time-domain indicators proved to be particularly effective for early fault diagnosis, reflecting changes in vibration amplitude and patterns caused by defects.
The study evaluated various condition indicators for fault diagnosis in bevel gearboxes under different operational conditions. • Key condition indicators such as Root Mean Square, Crest Factor, and Kurtosis were found to be effective in detecting mechanical damage. • The values of these condition indicators significantly increased in the presence of faults, indicating their sensitivity to gear health. • Performance of condition indicators varied with changes in load and speed, emphasizing the need for tailored selection based on operational parameters. • Time-domain indicators, particularly Root Mean Square, were identified as particularly effective for early fault diagnosis. • The research provides a quantitative framework for assessing the effectiveness of different condition indicators in fault detection. • Findings contribute to the development of robust predictive maintenance strategies, enhancing the reliability and efficiency of gear systems. • Future research should focus on refining methodologies and exploring additional condition indicators for improved fault detection in real-world applications.
Footnotes
Acknowledgments
We are grateful to the Director MNNIT Allahabad, Prayagraj, Uttar Pradesh, India for providing necessary laboratory facilities. The Ministry of Education, Govt. of India, New Delhi, India, is acknowledged for providing financial assistance to Sheo Kumar throughout this tenure.
Author contributions
Praveen Kumar Agarwal: Designed the study and guided to perform experiments; Sheo Kumar: Performed the experiments analysed the results, Writing- original draft preparation; all authors read and commented on the manuscript.
Declaration of conflicting interests
The author(s) declared no potential conflicts of interest with respect to the research, authorship, and/or publication of this article.
Funding
The author(s) received no financial support for the research, authorship, and/or publication of this article.