
Abstract
Rolling bearing fault diagnosis under complex operating conditions forms the essential foundation for the predictive maintenance of rotating machinery. However, traditional methods are often overwhelmed by strong noise, and constrained by the empirical risk minimization (ERM) principle, leading to significant overfitting in small sample learning scenarios. To address the aforementioned limitations, a lightweight diagnostic model integrating S-Transform (ST), convolutional neural network (CNN), and support vector machine (SVM) is proposed in this paper. Time-frequency features are extracted by leveraging the multi-resolution characteristics of the ST, deep feature mapping is performed through a customized CNN, and SVM is introduced to construct the maximum-margin classification hyperplane based on the structural risk minimization (SRM) principle. The experimental results illustrate that the method exhibits exceptional diagnostic accuracy under intense noise and small sample sizes. Randomized subset cross-validation confirms that this architecture effectively eliminates the interference of sampling randomness. Consequently, the ST-CNN-SVM model demonstrates high statistical stability.
Keywords
Introduction
Against the backdrop of deep integration between high-end equipment manufacturing and the industrial internet, the operational reliability of rotating machinery systems has become a bottleneck constraining their full lifecycle management. As the core components in mechanical systems responsible for bearing loads and transmitting motion, rolling bearings are highly susceptible to fatigue spalling, pitting, or wear due to prolonged exposure to high-speed rotation, heavy-load impacts, and complex alternating stresses. These conditions constitute the primary precursors to mechanical failure progression. 1 Failure to promptly diagnose and provide early warnings for bearing-related faults not only incurs high operational and maintenance costs but may also trigger catastrophic chain reactions such as wind turbine collapses or high-speed train derailments. 2 In practical industrial scenarios, extracting high-value fault features from massive amounts of noisy monitoring data presents the classic paradox of “data-rich but information-poor”. 3 The core challenge lies in the complexity of the signals: the impact components from early-stage failures are often low in energy and deeply buried within gear meshing frequencies and strong environmental background noise, 4 exhibiting significant non-stationary and nonlinear characteristics. Consequently, traditional time-frequency analysis methods struggle to capture effective information. 5
In the field of advanced signal processing, in order to overcome the limitations of traditional spectrum analysis in the time domain, researchers have conducted extensive exploration. Singh and Shaik 6 employed the ST to process motor signals, successfully capturing the transient characteristics of early, faint faults by leveraging its superior time-frequency clustering properties in the complex domain. In response to strong noise interference, Gao et al. 7 developed a parameter-optimized maximum correlated kurtosis deconvolution (MCKD) method, significantly enhancing the signal-to-noise ratio of composite fault impact components. However, despite the superior performance of these methods in specific scenarios, the resolution conflict in time-frequency characterization remains unresolved: traditional short-time Fourier transform (STFT) is constrained by the Heisenberg uncertainty principle, making it impossible to achieve both high temporal and high frequency resolution simultaneously. Even the small wave packet transform (SWPT) employed by Ben Abid et al. 8 possesses multiresolution capabilities, it lacks the advantages of the S-transform in terms of time-frequency concentration and adaptive adjustment. Thus, it is highly prone to losing transient impact features in environments with strong noise.
With the paradigm shift in deep learning, it has become a mainstream approach to convert one-dimensional vibration signals into two-dimensional spatiotemporal images and integrate them with CNN. Xie et al. 9 and Xu et al. 10 advanced the system's robustness under varying operating conditions through multi-sensor fusion and cross-modal networks. Recently, Li et al. 11 further demonstrated the effectiveness of graph signal processing by encoding time series as images using the Gramian Angular Field (GAF). Although two-dimensional processing enriches feature representation to a certain extent, the absence of data augmentation mechanisms remains a critical shortcoming that limits its highly reliable application. The current approaches often directly input the raw signal or its transformed form into deep networks, which causes the model to focus on learning background noise rather than the true nature of the fault. Despite advances made by Wang et al., 12 Zhao et al., 13 and Hu et al. 14 in small sample and transfer learning, the lack of targeted data augmentation techniques still hampers models' ability to effectively mitigate overfitting risks under extremely sparse data conditions.
In recent years, a trend towards physics-informed approaches has emerged in the pre-processing stage of fault diagnosis. For example, Qiao et al. 15 utilised digital twins to construct a physics-virtual closed-loop denoising framework, thereby enhancing the fidelity of time-frequency representations at source. However, the lack of precise physical prior knowledge in complex engineering practice makes the development of dynamic twin models extremely challenging. Diagnostic systems are often limited to being purely data-driven, relying solely on static mappings as input. In the face of unavoidable residual noise in static inputs, current frontier models—such as the digital twin framework proposed by Feng et al. 16 at the decision terminal—remain reliant on the Softmax layer. Due to the constraints of the ERM framework, this approach is highly prone to boundary blurring and overfitting when dealing with noise-masking features. In order to improve diagnostic performance within the constraints of this purely data-driven approach and the use of static feature inputs, current cutting-edge research is primarily focused on designing more advanced deep feature networks. Xu et al. 17 proposed the Time-Frequency Domain Deep Prototype (TFDDP) model, which utilises time-frequency consistency constraints to enable bearing fault diagnosis with limited samples. He et al. 18 developed the Time-Frequency Dual-Domain Contrastive Fusion (TFDDCF) framework, which significantly enhances the model's ability to represent features in non-stationary signals through the use of a Transformer architecture. Although these methods mitigate data dependency through advanced representation learning, their deep network-based decision mechanisms remain susceptible to overfitting due to the ERM when dealing with limited sample sizes. Unlike the aforementioned studies, which focus on feature representation approaches, this paper places greater emphasis on the robustness of decision mechanisms. By introducing SVM based on the SRM criterion, it aims to construct classification boundaries with greater generalisation ability under limited sample sizes.
In consideration of the aforementioned issues, the ST-CNN-SVM model proposed in this paper combines the multi-resolution and time-frequency-aware advantages of the ST, while introducing SVM to replace the traditional Softmax layer. By utilising the SRM criterion of SVM to construct a maximum-margin classification hyperplane, this method demonstrates enhanced decision robustness and generalisation capabilities in scenarios characterised by high noise levels and limited sample sizes. The specific implementation approach and corresponding contributions are as follows: (1) In order to overcome the resolution limitations of the STFT, the ST is introduced to convert one-dimensional time-series signals into two-dimensional time-frequency images. (2) In response to deep models' reliance on large-scale data, sliding window overlapping sampling techniques are employed to perform high-fidelity augmentation of raw vibration signals. The strategy mitigates the scarcity of samples at the source, effectively reducing the risk of overfitting under small sample conditions. (3) A lightweight CNN-SVM cascade architecture is proposed to address the decision boundary ambiguity of Softmax classifiers. The design leverages CNN for automatic extraction of deep abstract features and replaces the traditional Softmax layer with SVM, which excel at identifying maximum margin hyperplanes in high-dimensional spaces. Consequently, it significantly enhances the robustness and generalization accuracy of the diagnostic system.
The rest of this paper is organized as follows: Section 2 introduces the theoretical foundation of ST-CNN-SVM and explains the overall architecture and technical details of this intelligent diagnostic framework. Section 3 presents the experimental setup and provides a comprehensive comparative analysis and discussion of the diagnostic performance of the proposed method. Section 4 summarizes the work and concludes the paper.
Theoretical background and model construction
ST time-frequency analysis
The ST is an extension and combination of the STFT and the continuous wavelet transform (CWT). Similar to the CWT, the ST possesses multi-resolution properties, enabling it to adjust the width of the time window according to frequency. It thus effectively addresses the non-stationary characteristics present in rolling bearing fault signals.
For a continuous-time signal
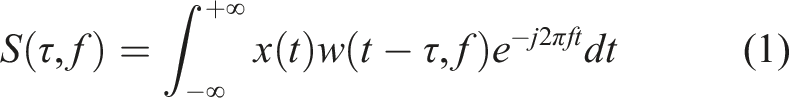
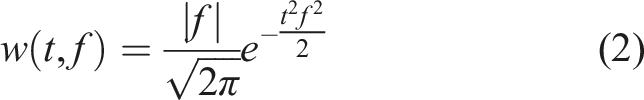
Substituting equation (2) into equation (1) yields the complete expression for the S-transform:
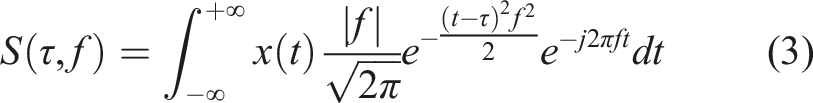
From equation (3), it can be seen that the standard deviation
In practical engineering applications, the acquired vibration signals are typically discrete sequences. Suppose
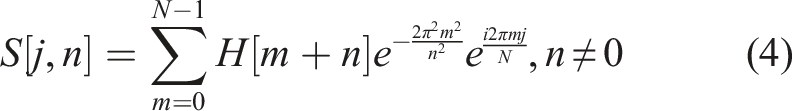
After processing with ST, the one-dimensional vibration signal is mapped onto a two-dimensional complex matrix
Convolutional neural network
Convolutional neural network is a type of deep feedforward neural network specifically designed to process data with grid-like structures. In this paper, CNN is employed to automatically extract highly dimensional fault features from a ST time-frequency map. Its core architecture primarily consists of convolutional layers, pooling layers, and fully connected layers.
Convolutional layer
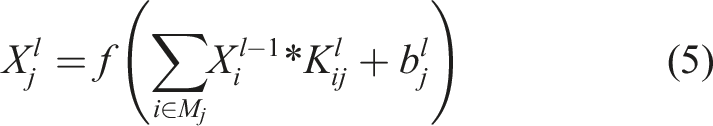
The convolution layer is the core component of CNN, which performs sliding convolution operations on input images through a group of trainable filters to extract local features. Let the input feature map of layer
To further overcome the vanishing gradient problem in deep networks and accelerate model convergence, Batch Normalization (BN) is introduced between convolutional layers and activation layers. The mechanism reduces internal covariate shifts by normalizing each batch of feature maps. Additionally, the rectified linear unit (ReLU) is selected as the activation function:

The ReLU activation function suppresses noise in the negative range while preserving features in the positive range.
Pooling layer
The pooling layer typically follows the convolutional layer, primarily serving to reduce the spatial dimensions of feature maps, decrease the number of network parameters, and impart a degree of translation invariance to the features. In this paper, the max pooling strategy is adopted, where the maximum value within the pooling window is taken as the output. For the

For feature maps at different depths, differentiated pooling window sizes are designed: the first pooling layer employs standard windows of size 2 × 2 for spatial dimension reduction, the second pooling layer utilizes asymmetric windows of size 2 × 1 to preserve texture information in specific temporal dimensions. 21 The maximum pooling method preserves the most prominent impact characteristics in fault signals, which is particularly crucial for bearing fault diagnosis. The Dropout technique is introduced after each pooling layer and specific fully connected layers to further enhance the model's generalization capability. Through randomly discarding a portion of neurons with a specific probability during training, it effectively disrupts the cooperative adaptation between neurons. Not only does this architectural design reduce the model's excessive reliance on specific local features, but it also significantly mitigates the risk of overfitting in deep networks when processing small sample fault data.
Fully connected layer
After undergoing multiple layers of convolutional and pooling operations, the two-dimensional feature map is flattened into a one-dimensional feature vector and input into a fully connected network composed of three cascaded layers. The fully connected layer maps distributed features to the sample label space by performing a weighted sum of the features. The output

In standard CNN models, the final fully connected layer is typically connected to a Softmax function for classification. However, considering that Softmax is based on cross-entropy loss, its generalization capability is limited in scenarios with small sample sizes and complex conditions. Therefore, in this paper, only the fully connected layers of the CNN are utilized as deep feature extractors. The extracted highly concentrated low-dimensional deep feature vectors are input into the subsequent SVM for final decision-making.
Support vector machine
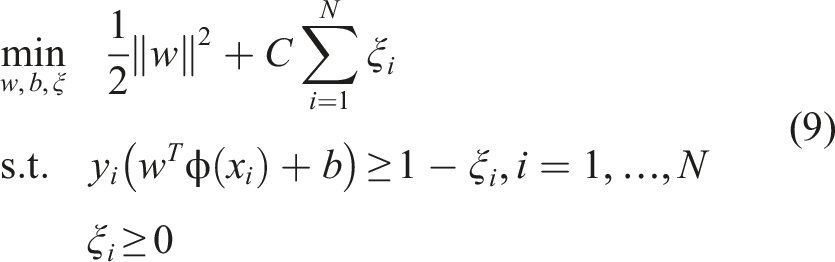
SVM is a supervised learning model based on statistical learning theory. 22 The core concept is to find an optimal hyperplane that maximizes the margin between samples of different classes in the feature space. While traditional neural networks pursue ERM, SVM adheres to the SRM principle. Significant reduction in model complexity is achieved without compromising classification precision. This structural optimization facilitates superior generalization performance in scenarios characterized by few shot datasets.
For a given training dataset

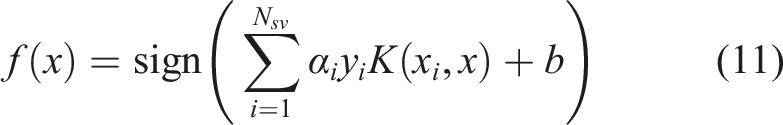
In standard CNN, the final Softmax layer is typically used to output classification probabilities. However, the Softmax model, based on the cross-entropy loss function, is prone to overfitting when training samples are insufficient. In the ST-CNN-SVM architecture proposed in this study, the powerful feature extraction capability of CNN is utilized as a feature learner. The feature vector
The proposed ST-CNN-SVM model
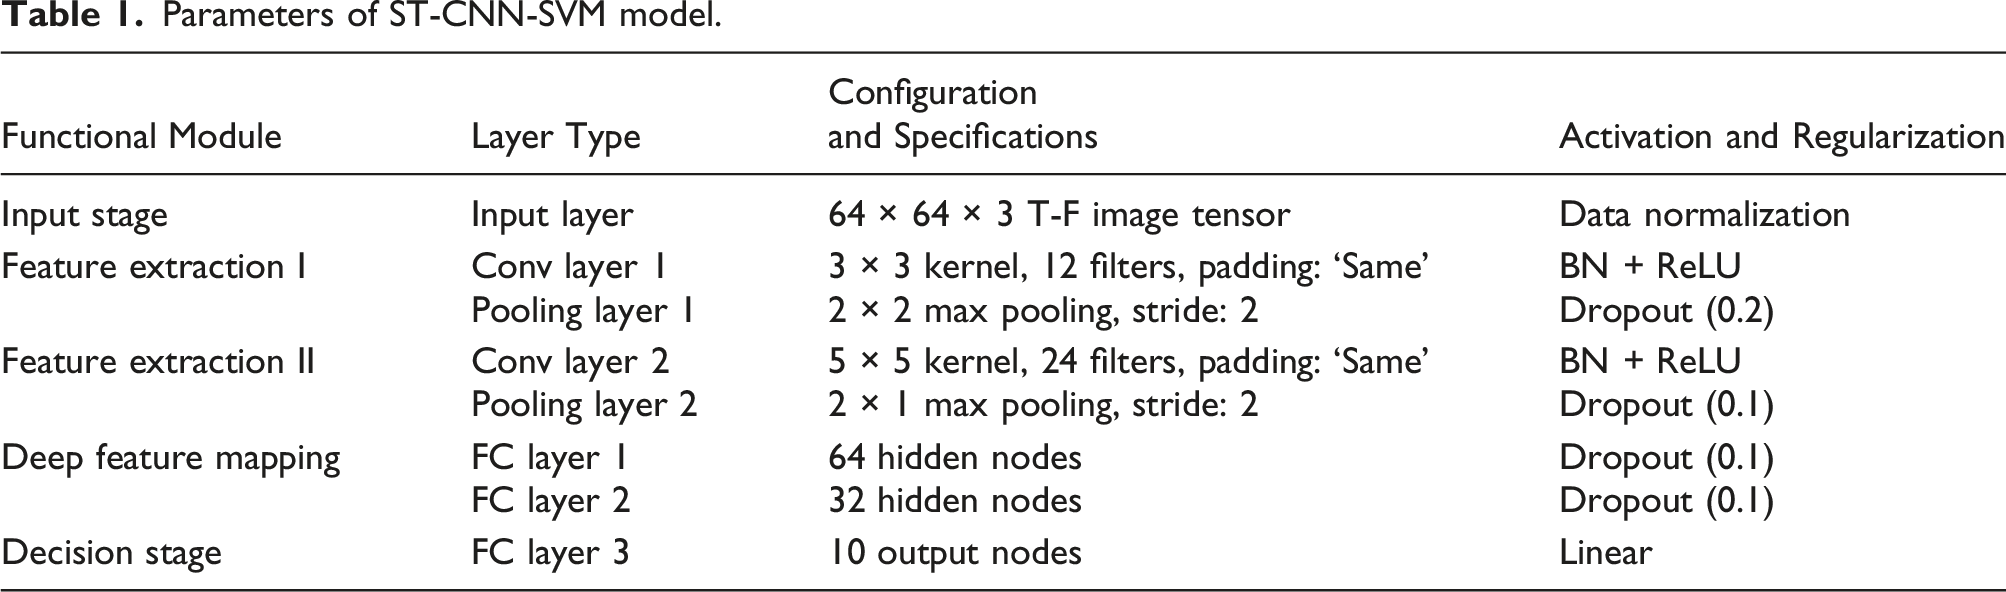
In response to the highly nonlinear and nonstationary characteristics exhibited by rolling bearings under complex variable operating conditions, as well as the inherent tendency of deep learning models to overfit under the small sample conditions, a hybrid ST-CNN-SVM diagnosis framework is proposed, integrating high-resolution time-frequency perception, deep semantic extraction, and maximum-margin decision-making into a unified architecture. As shown in Figure 1, these three cascaded modules are deeply integrated: the front-end features a high-resolution spatiotemporal reconstruction module that employs the ST to convert one-dimensional time-series signals into richly textured two-dimensional spatiotemporal spectra. A deep semantic encoding module is deployed at the mid-level, employing a customized lightweight CNN as a feature extractor designed to efficiently extract the most discriminative abstract semantics from high-dimensional graphs. The output terminal utilizes a maximum-margin decision module, where SVM is incorporated to replace the traditional Softmax layer. Under the SRM framework, a robust classification boundary is constructed to ensure stable fault discrimination. The detailed network topology and hyperparameter configuration of the ST-CNN-SVM diagnostic model are shown in Table 1. Overall architecture of the ST-CNN-SVM diagnostic model. Parameters of ST-CNN-SVM model.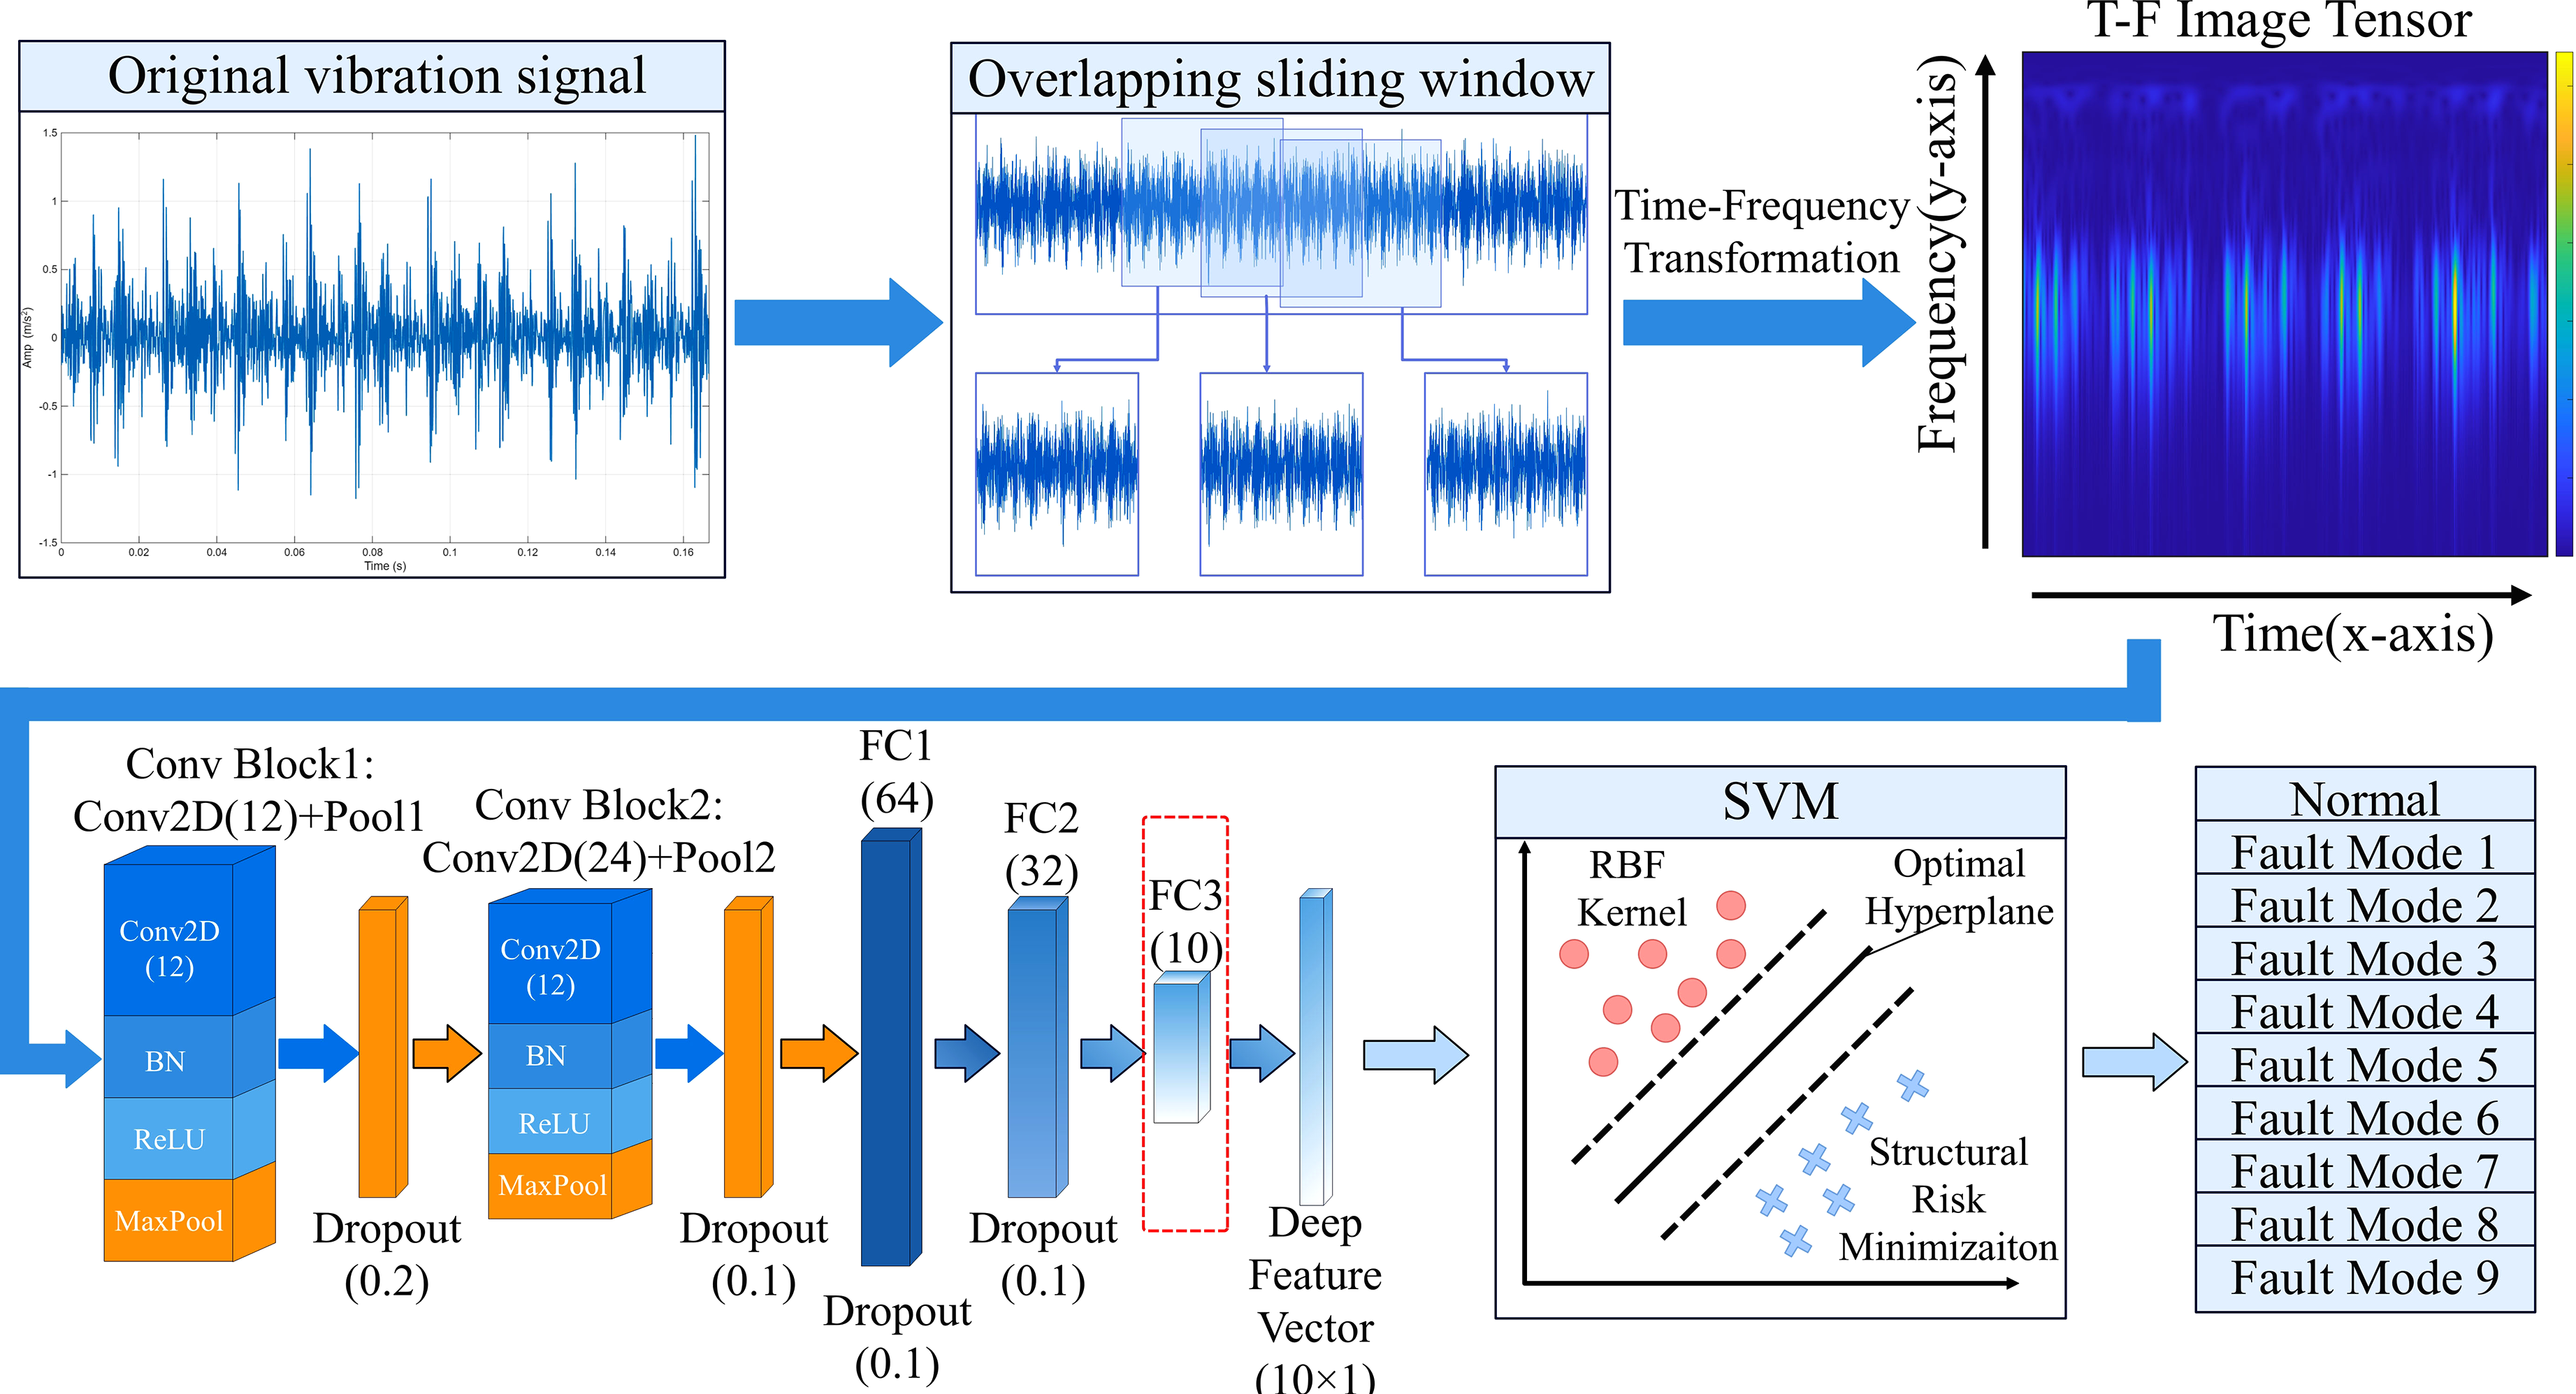
The specific steps are as follows: Step 1: Acquire raw one-dimensional vibration signals at different health states on the rolling bearing test bench. Then, overlapping sliding window techniques are employed to segment the original signal, achieving sample expansion while preserving the continuity of signal features. Step 2: Transform each signal segment into a two-dimensional time-frequency amplitude spectrum using the ST, then uniformly resize the images through bicubic interpolation. Step 3: Input the preprocessed spatiotemporal tensor into a customized lightweight CNN model. The model automatically extracts deep abstract semantic features from the spatiotemporal image through cascaded convolutional and pooling layers. After extracting the fully connected layer depth feature vectors, input them as predictors into the SVM module. The kernel parameters of the SVM are optimized using grid search and cross-validation strategies to construct the optimal classification hyperplane. Step 4: Input the reserved test set samples into the trained diagnostic model to validate the algorithm's effectiveness by evaluating the model's classification performance on unseen data.
Experimental validation and discussion of results
Dataset description and experimental setup
To evaluate the diagnostic performance of the ST-CNN-SVM model, a benchmark dataset provided by the Case Western Reserve University (CWRU) Bearing Data Center is utilized in this paper.
23
Due to its rigorous experimental design and high signal-to-noise ratio characteristics, these datasets are widely recognized in academia as the standard benchmarks for evaluating mechanical fault diagnosis algorithms.
24
Figure 2 shows the physical structure of the CWRU test bench used in this experiment. Layout of CWRU experimental platform.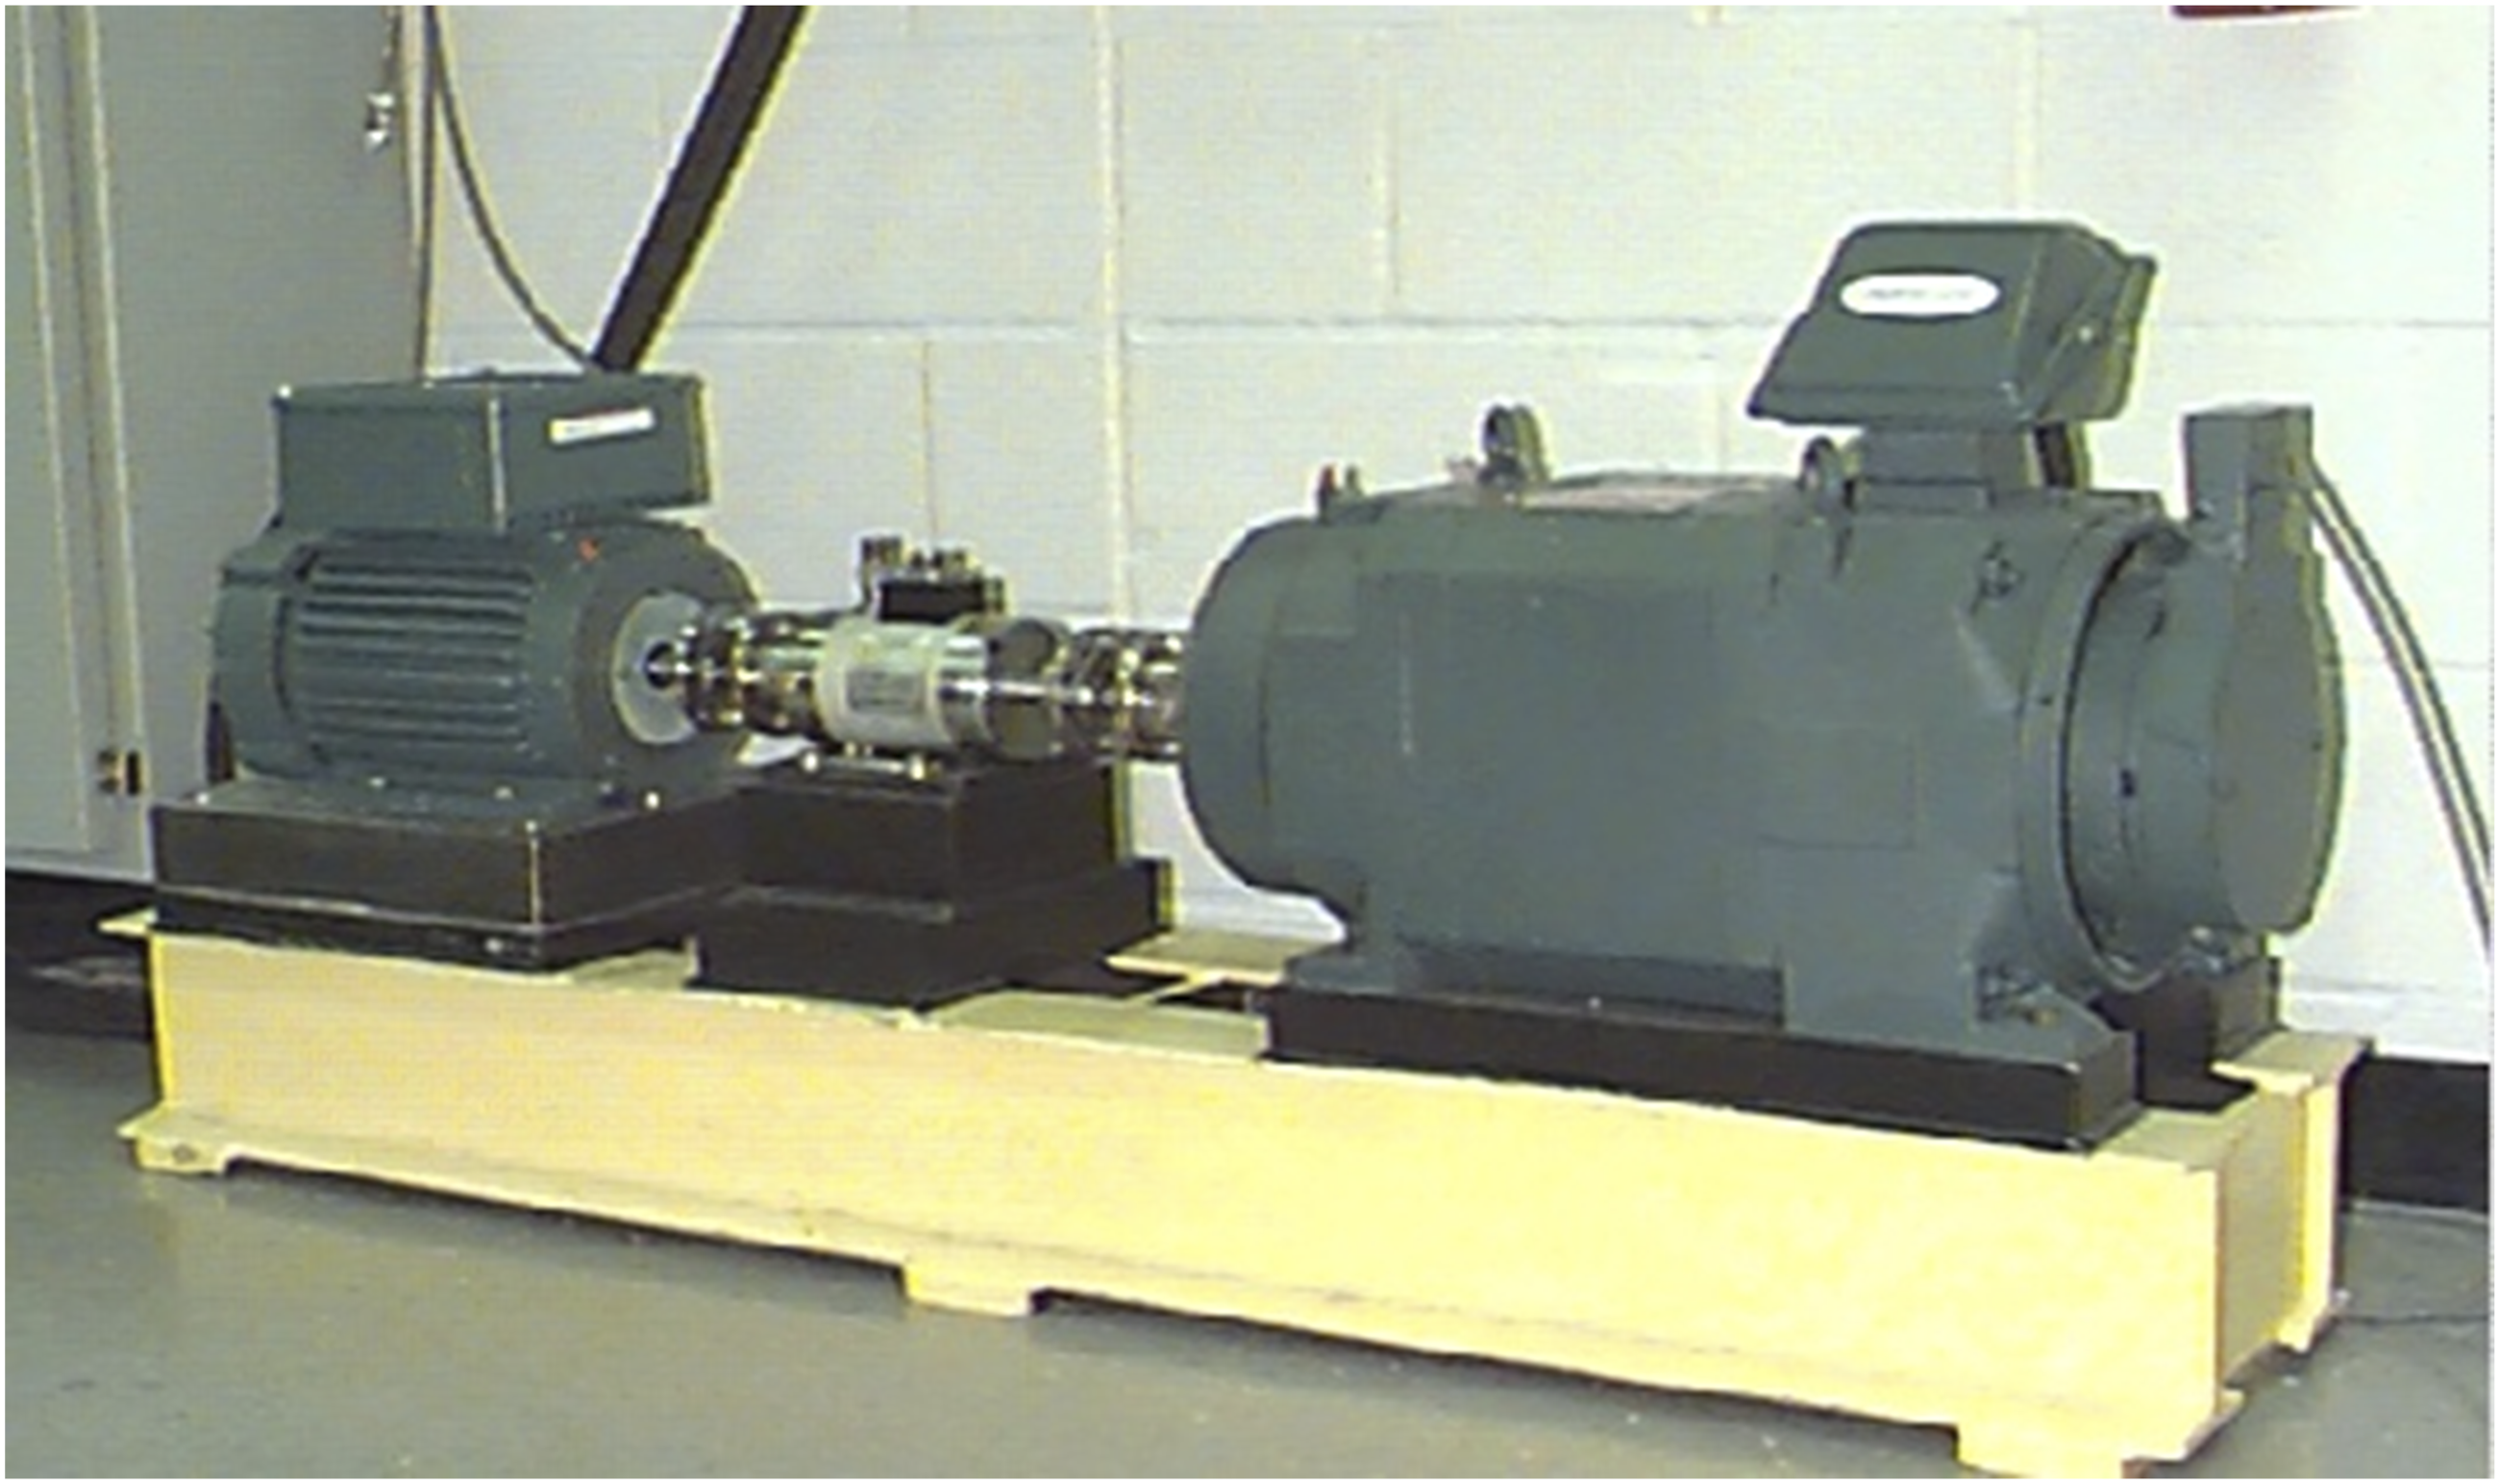
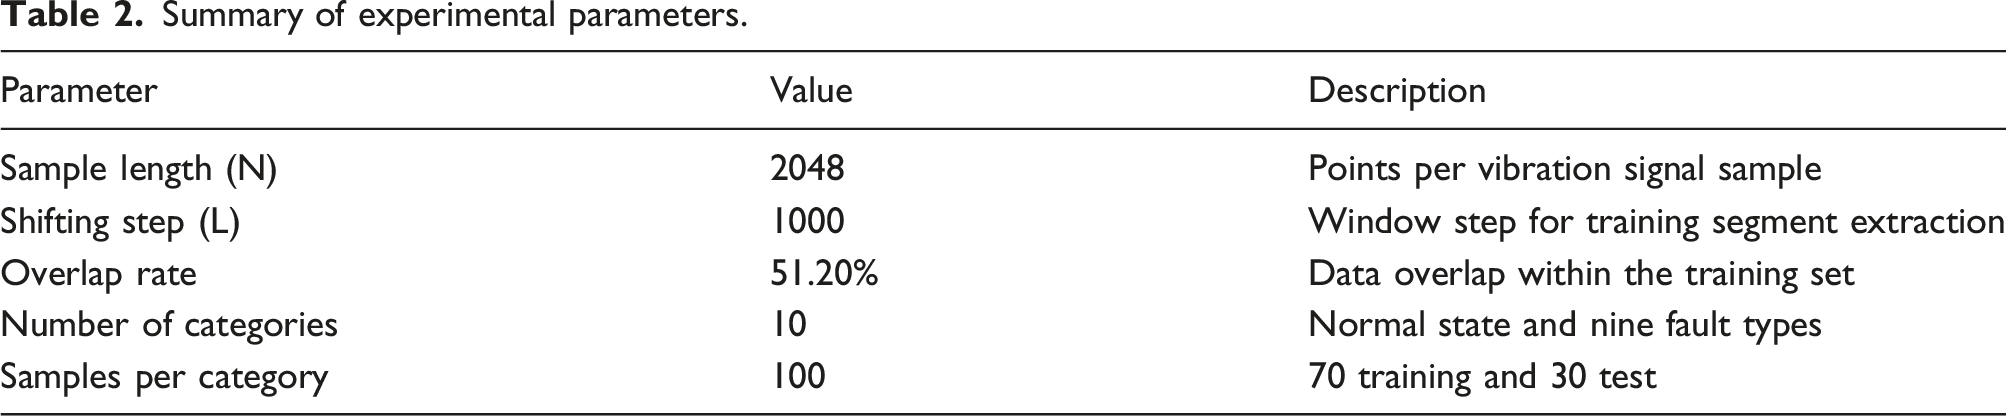
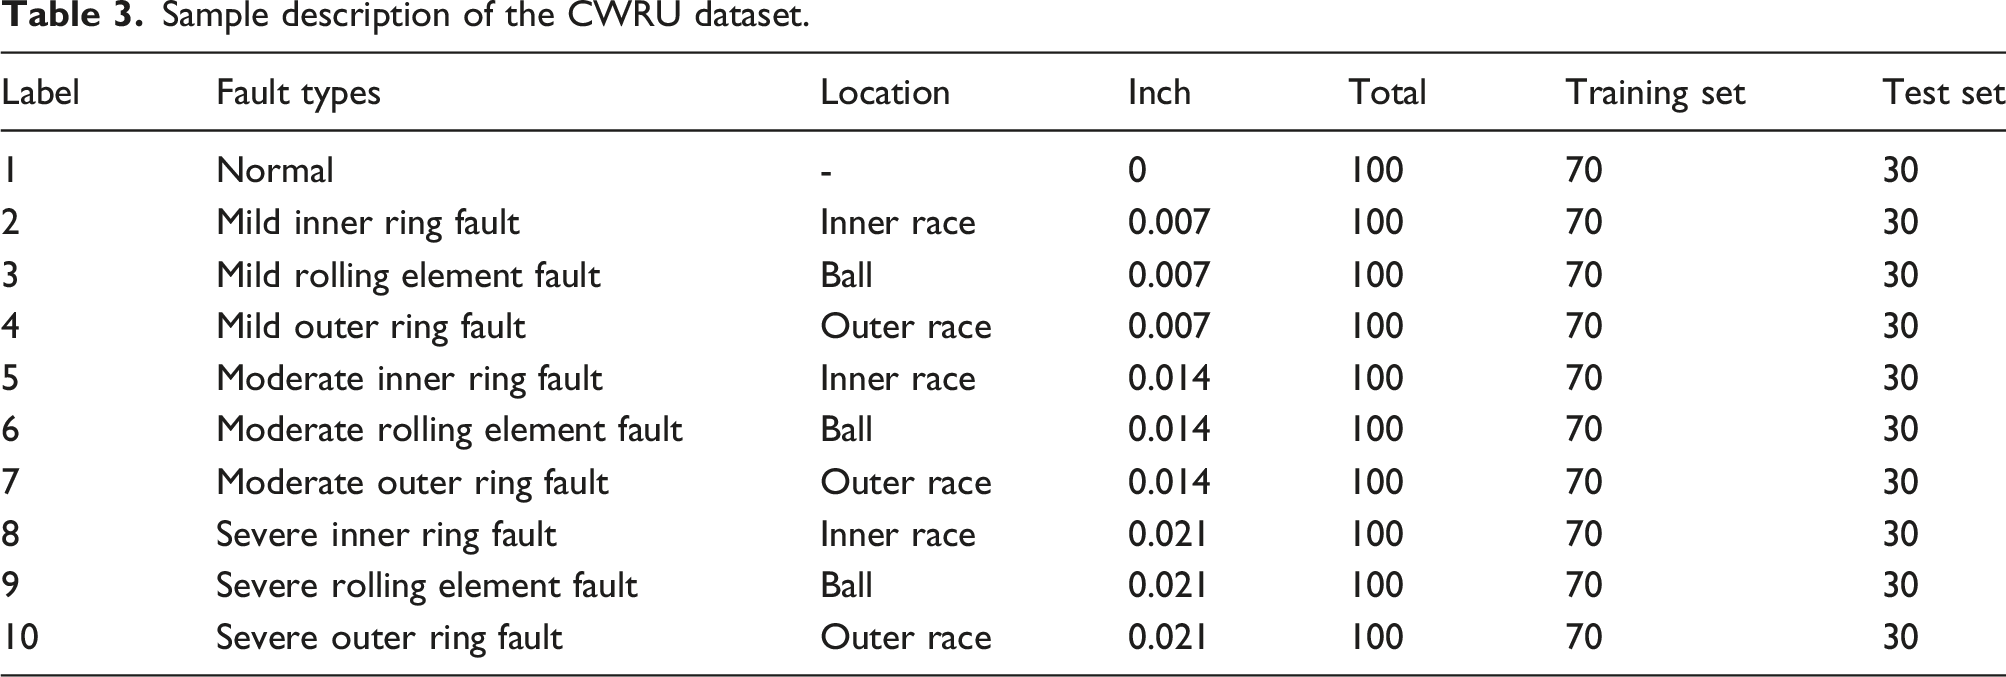
Experimental data is extracted from the drive-end bearing, with a fixed sampling frequency of 12 kHz. To comprehensively validate the model's robustness under complex industrial conditions, this study constructs a ten-class classification task encompassing one normal state and nine fault states. Damage is precisely induced via electrical discharge machining (EDM) technology, targeting three critical areas: the inner race, outer race, and rolling elements. Each damaged area features three distinct damage diameters—0.007, 0.014, and 0.021 inches—representing varying degrees of severity.
Summary of experimental parameters.
Sample description of the CWRU dataset.
Visual analysis of feature adaptive learning capabilities
To quantitatively deconstruct the feature evolution mechanism of the ST-CNN model during deep representation extraction, t-distributed stochastical neighbor embedding (t-SNE) is introduced to map high-dimensional feature space nonlinearly onto a two-dimensional manifold plane.
As shown in Figure 3, the original input vector exhibits typical feature overlap and nonlinear aliasing phenomena within the projection space. Due to the dual effects of strong industrial background noise and the non-stationary nature of vibration signals, the sample points representing 10 health states are highly coupled in geometric space, preventing the formation of an effective decision boundary. In particular, for different damage severities at the same damage site, the distribution of characteristics exhibits significant overlap. It indicates that the raw time-frequency data exhibits extremely high complexity and is linearly inseparable in the feature space. If directly input into shallow classifier, the robustness of the diagnostic system cannot be guaranteed. t-SNE Visualization of Raw Data.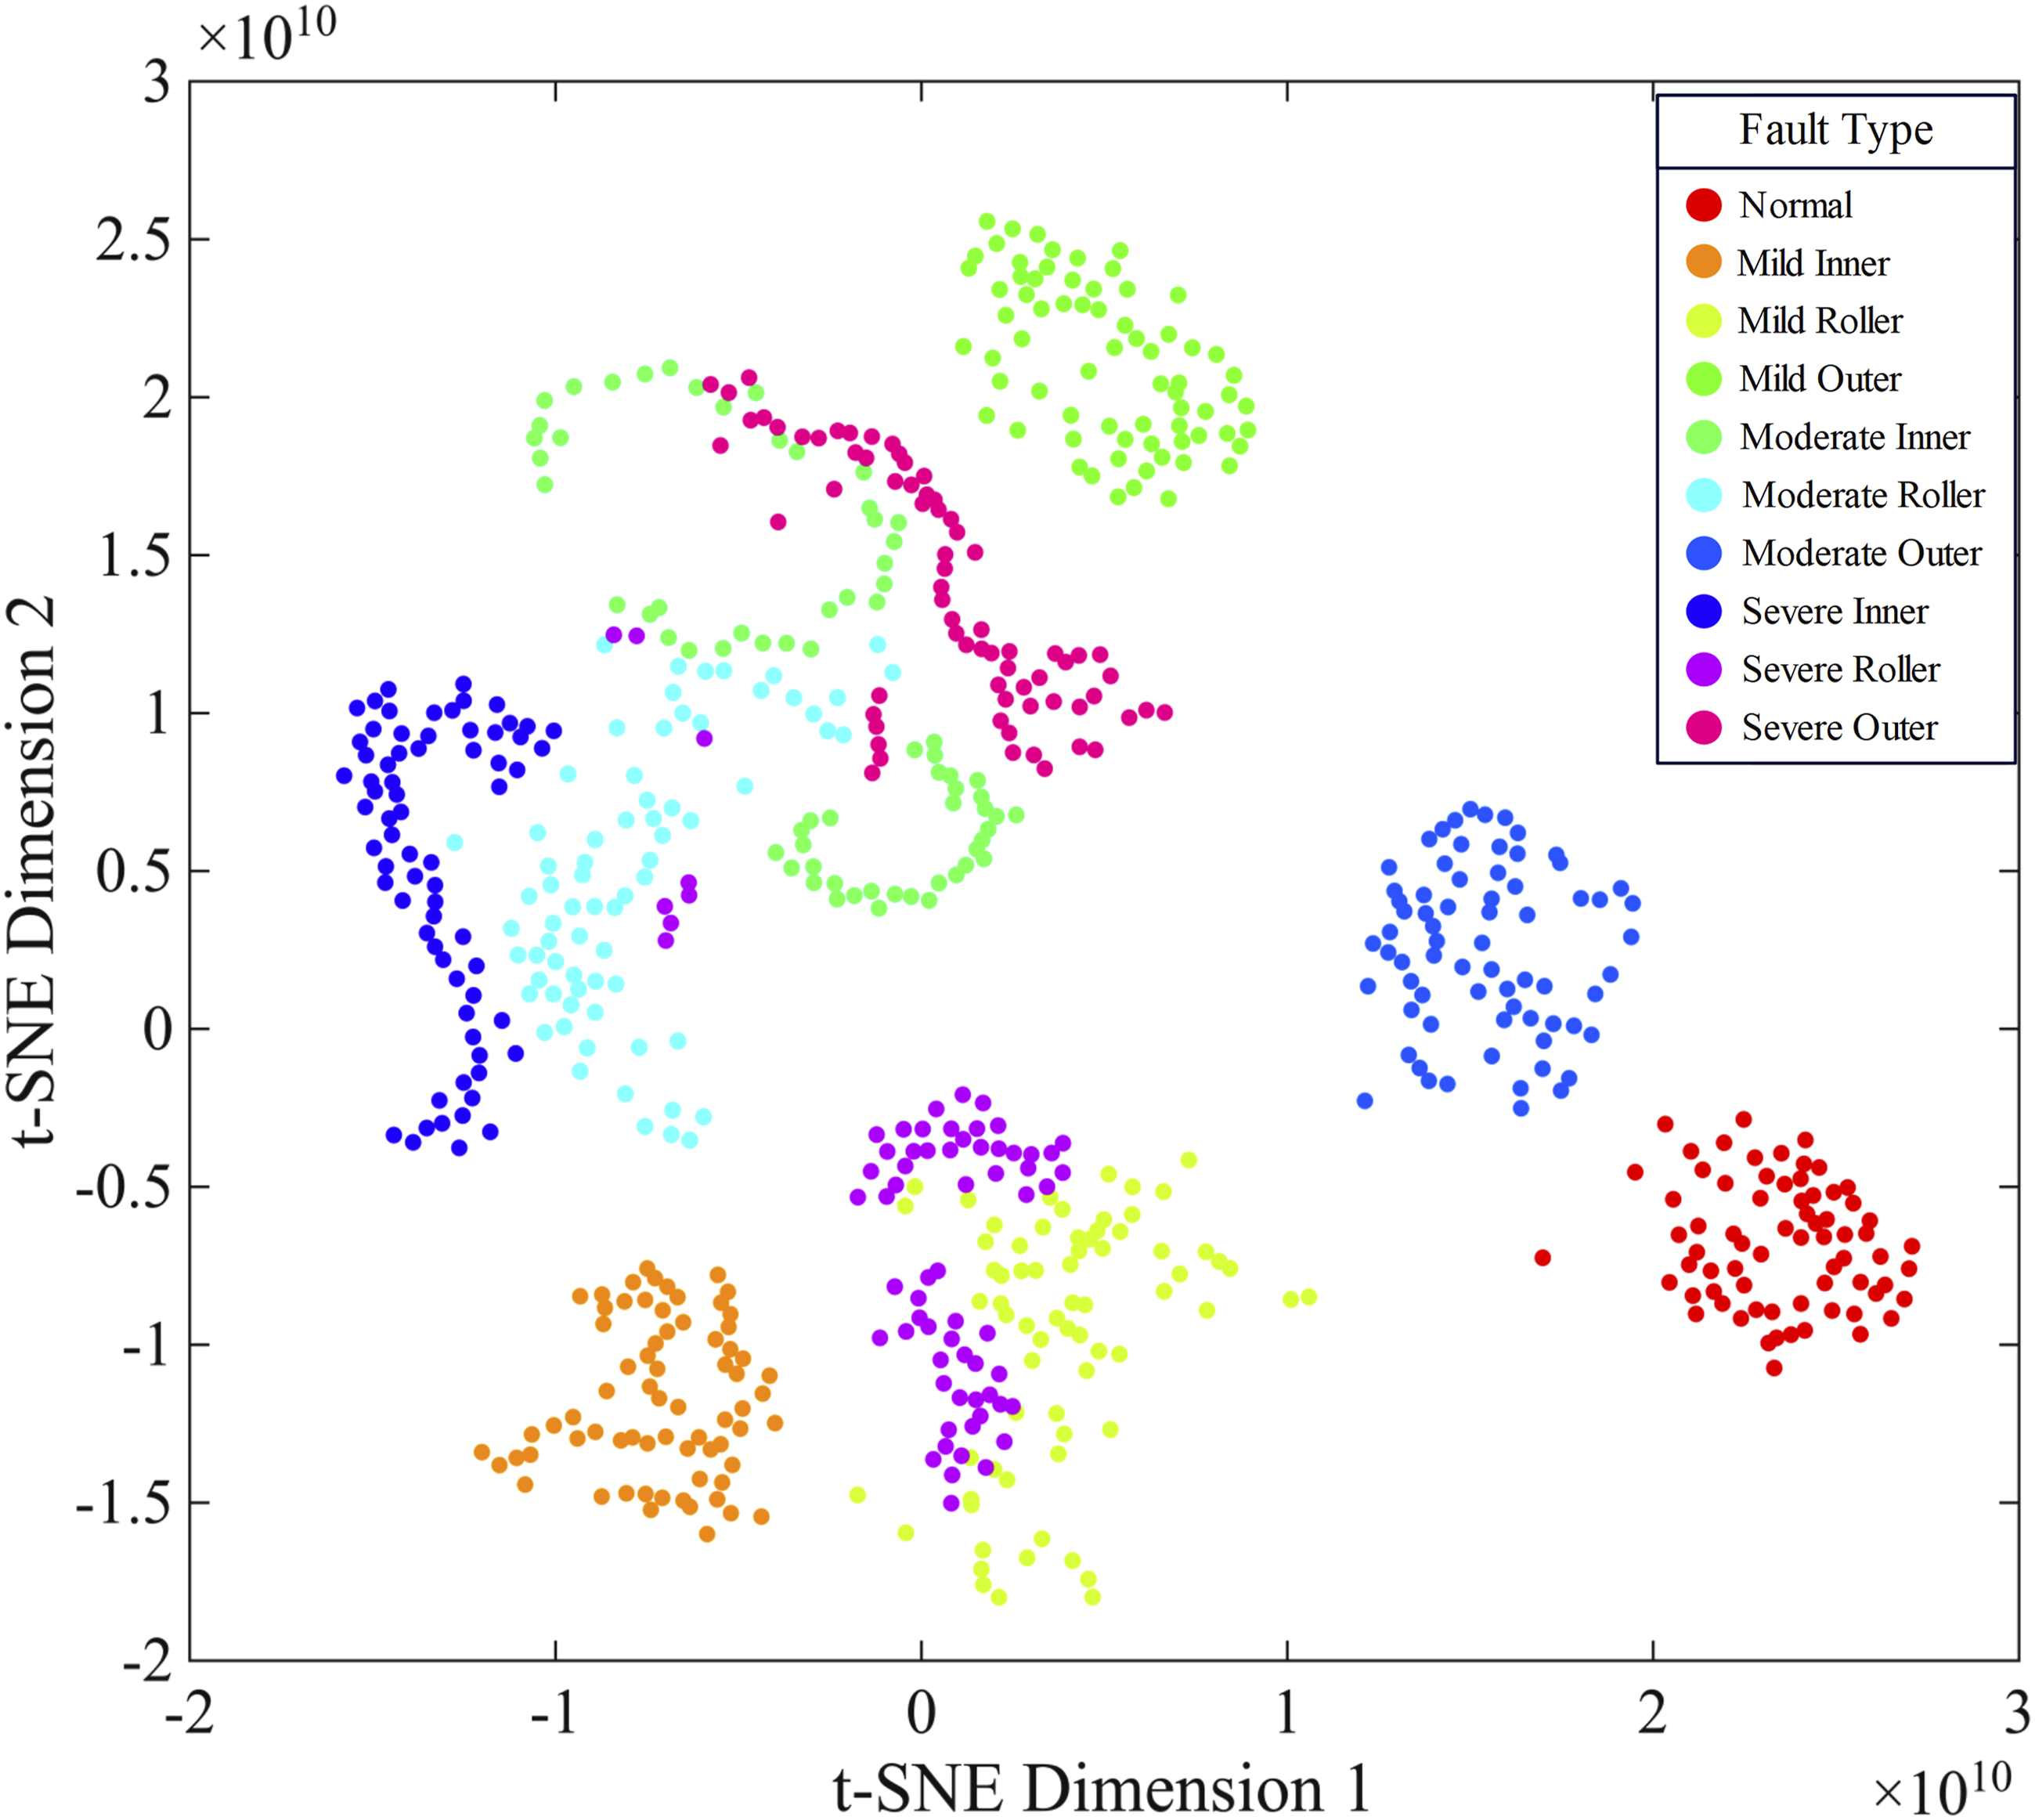
Sharply contrasting with the above, the feature topology undergoes significant reconstruction after undergoing layer-by-layer nonlinear mapping via ST-CNN. Redundant components irrelevant to fault discrimination are effectively filtered out under the drive of loss function constraints, as illustrated in Figure 4. Discriminative common features are subsequently extracted to facilitate an interpretable representation of mechanical health conditions. Sample points within the same category rapidly converge toward the cluster center, demonstrating exceptional intra-class compactness; simultaneously, significant inter-class separation emerges between different failure modes. Such a spatial transformation from highly coupled to manifold disentanglement empirically demonstrates the feature adaptation learning efficiency of ST-CNN. Through cascaded nonlinear transformations, the model successfully reshapes complex vibration signals into low-dimensional, linearly separable feature representations. Not only does this significantly reduce the computational complexity of classification tasks, but it also provides high-quality data priors for subsequent SVM models, guaranteeing the diagnostic system's generalization accuracy and recognition reliability under complex operating conditions. t-SNE Visualization of Extracted Features.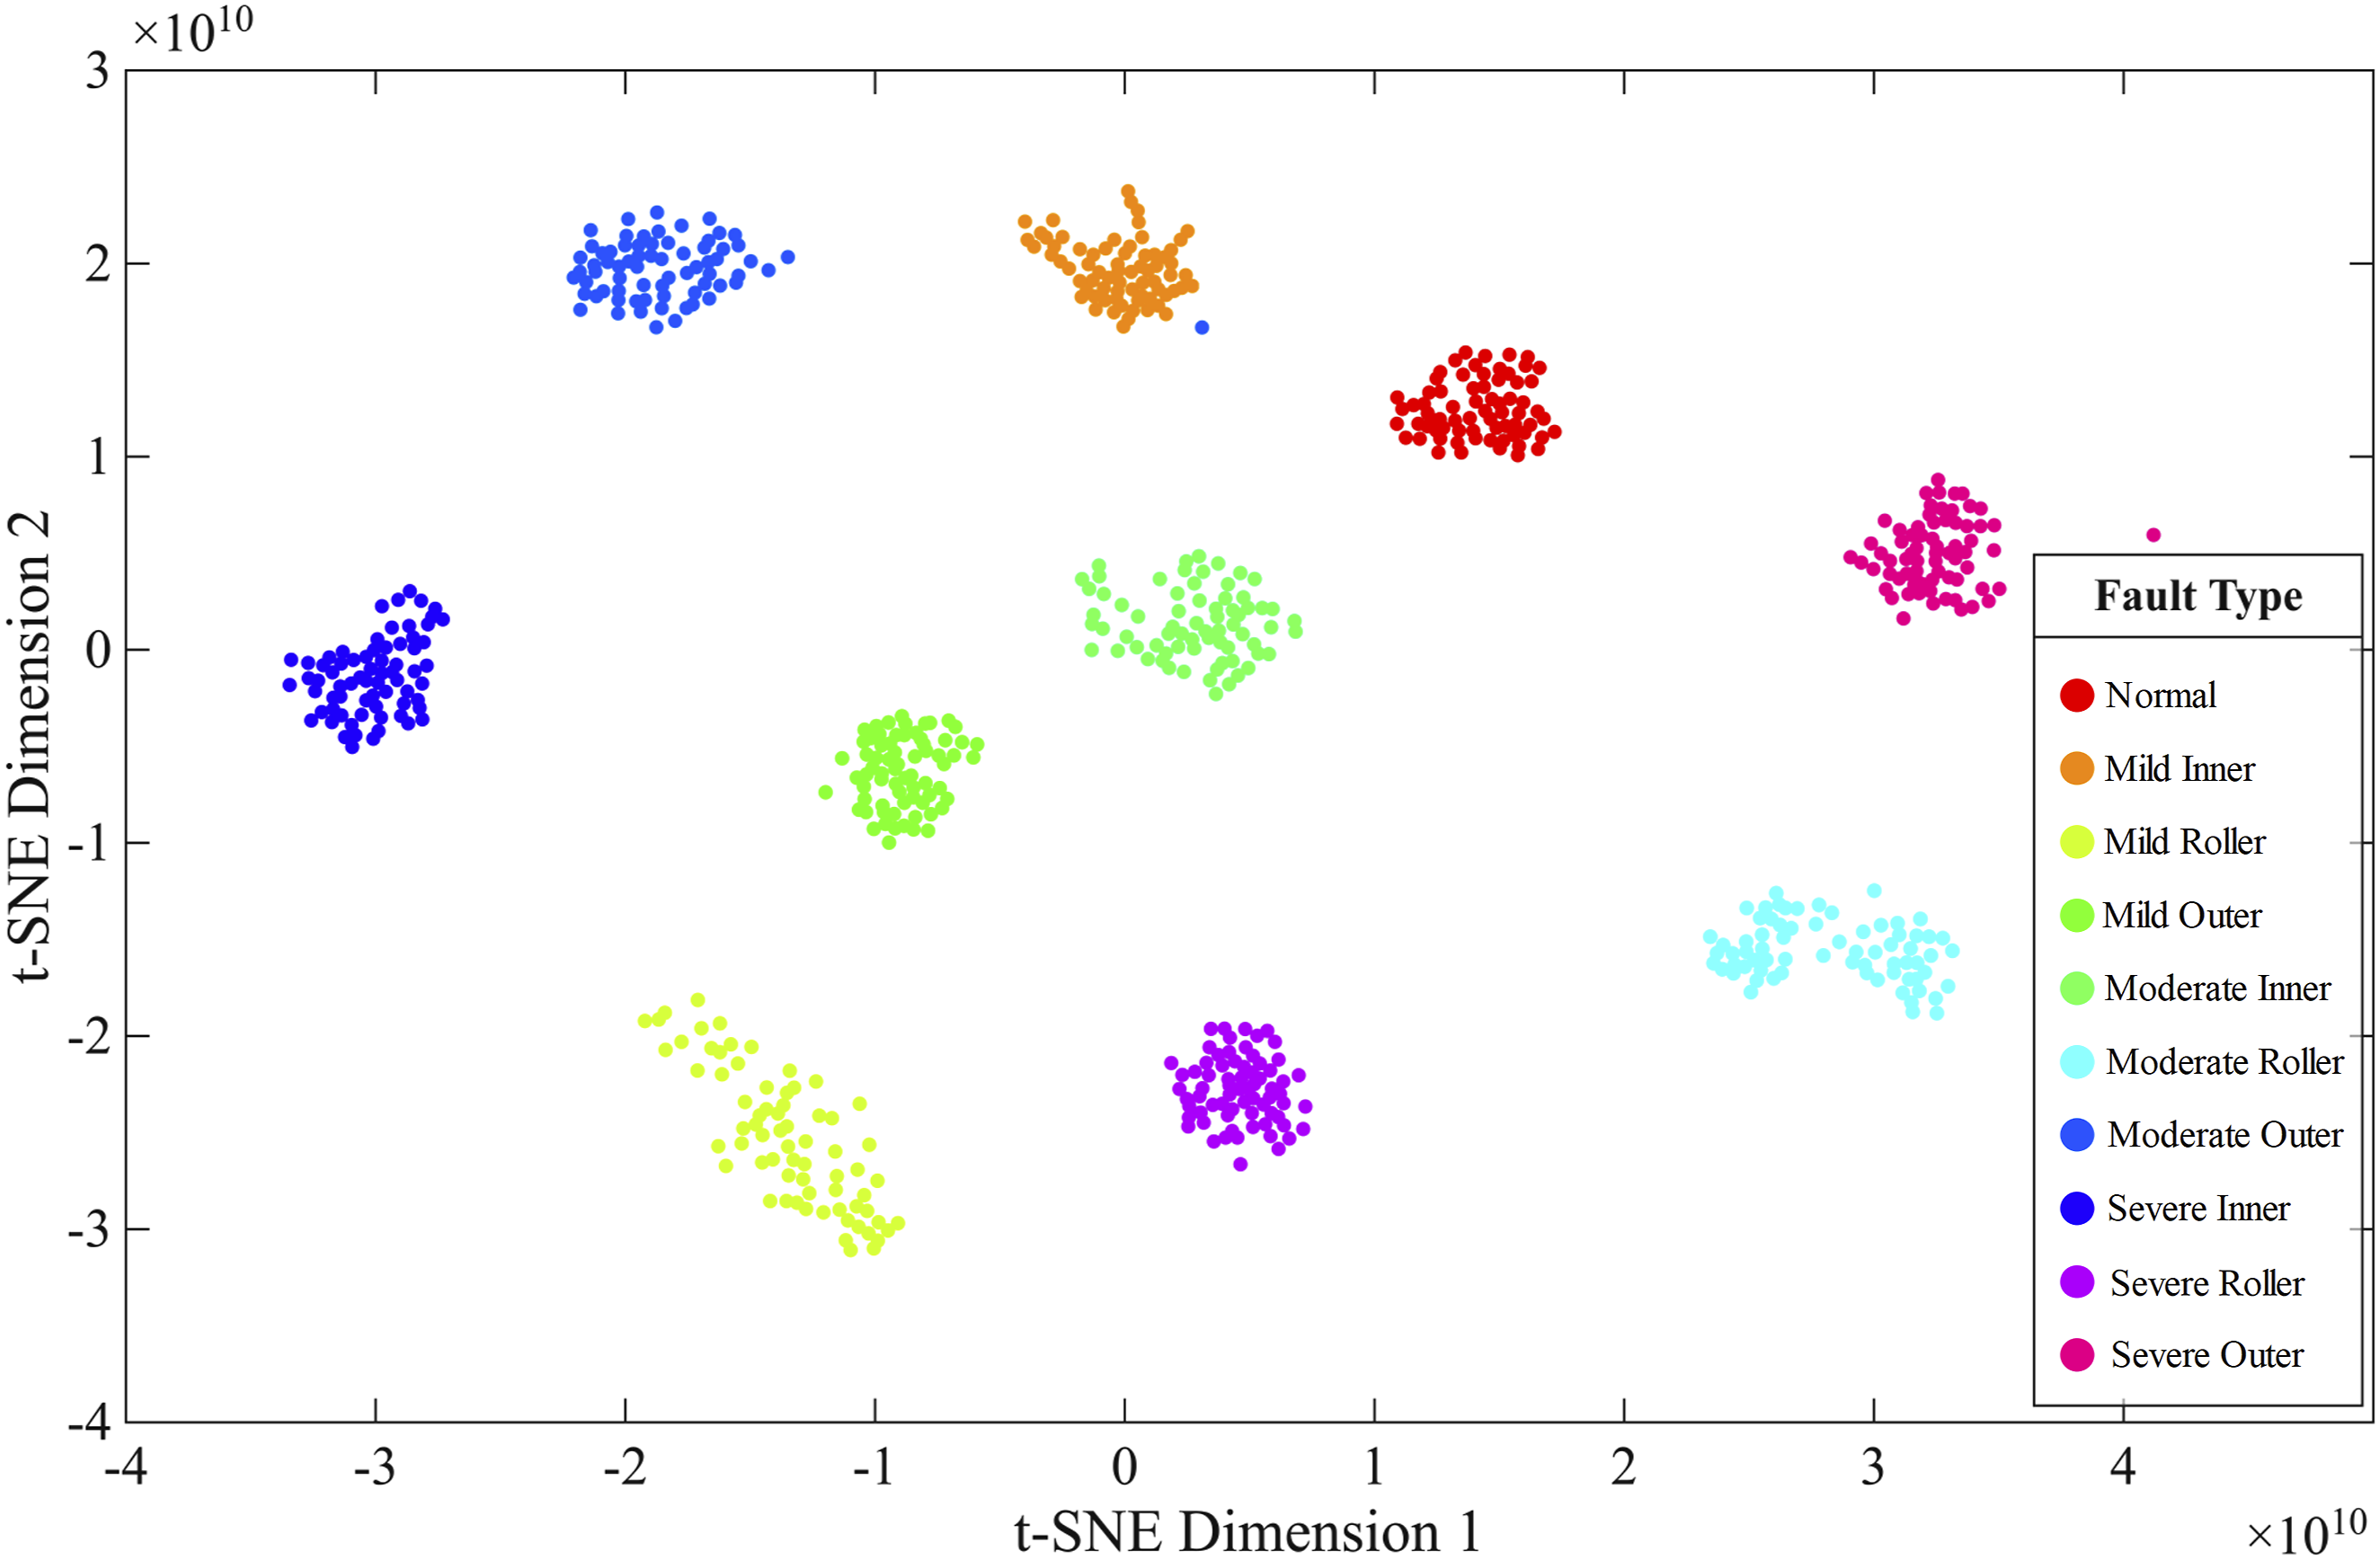
Diagnosis performance and comparative evaluation
To evaluate the reliability of the model under highly realistic industrial conditions simulating harsh operating environments, a Gaussian white noise signal with a signal-to-noise ratio of 20 dB is introduced into the test set. Experimental results illustrated in Figure 5 indicate that the proposed ST-CNN-SVM model maintains a classification accuracy of 99.33% under strong noise constraints. This diagnostic performance significantly exceeds the recognition rates of the K-nearest neighbor (KNN) and random forest (RF) models, which achieve only 96.33% and 95.33%, respectively. Accuracy comparison of different algorithms.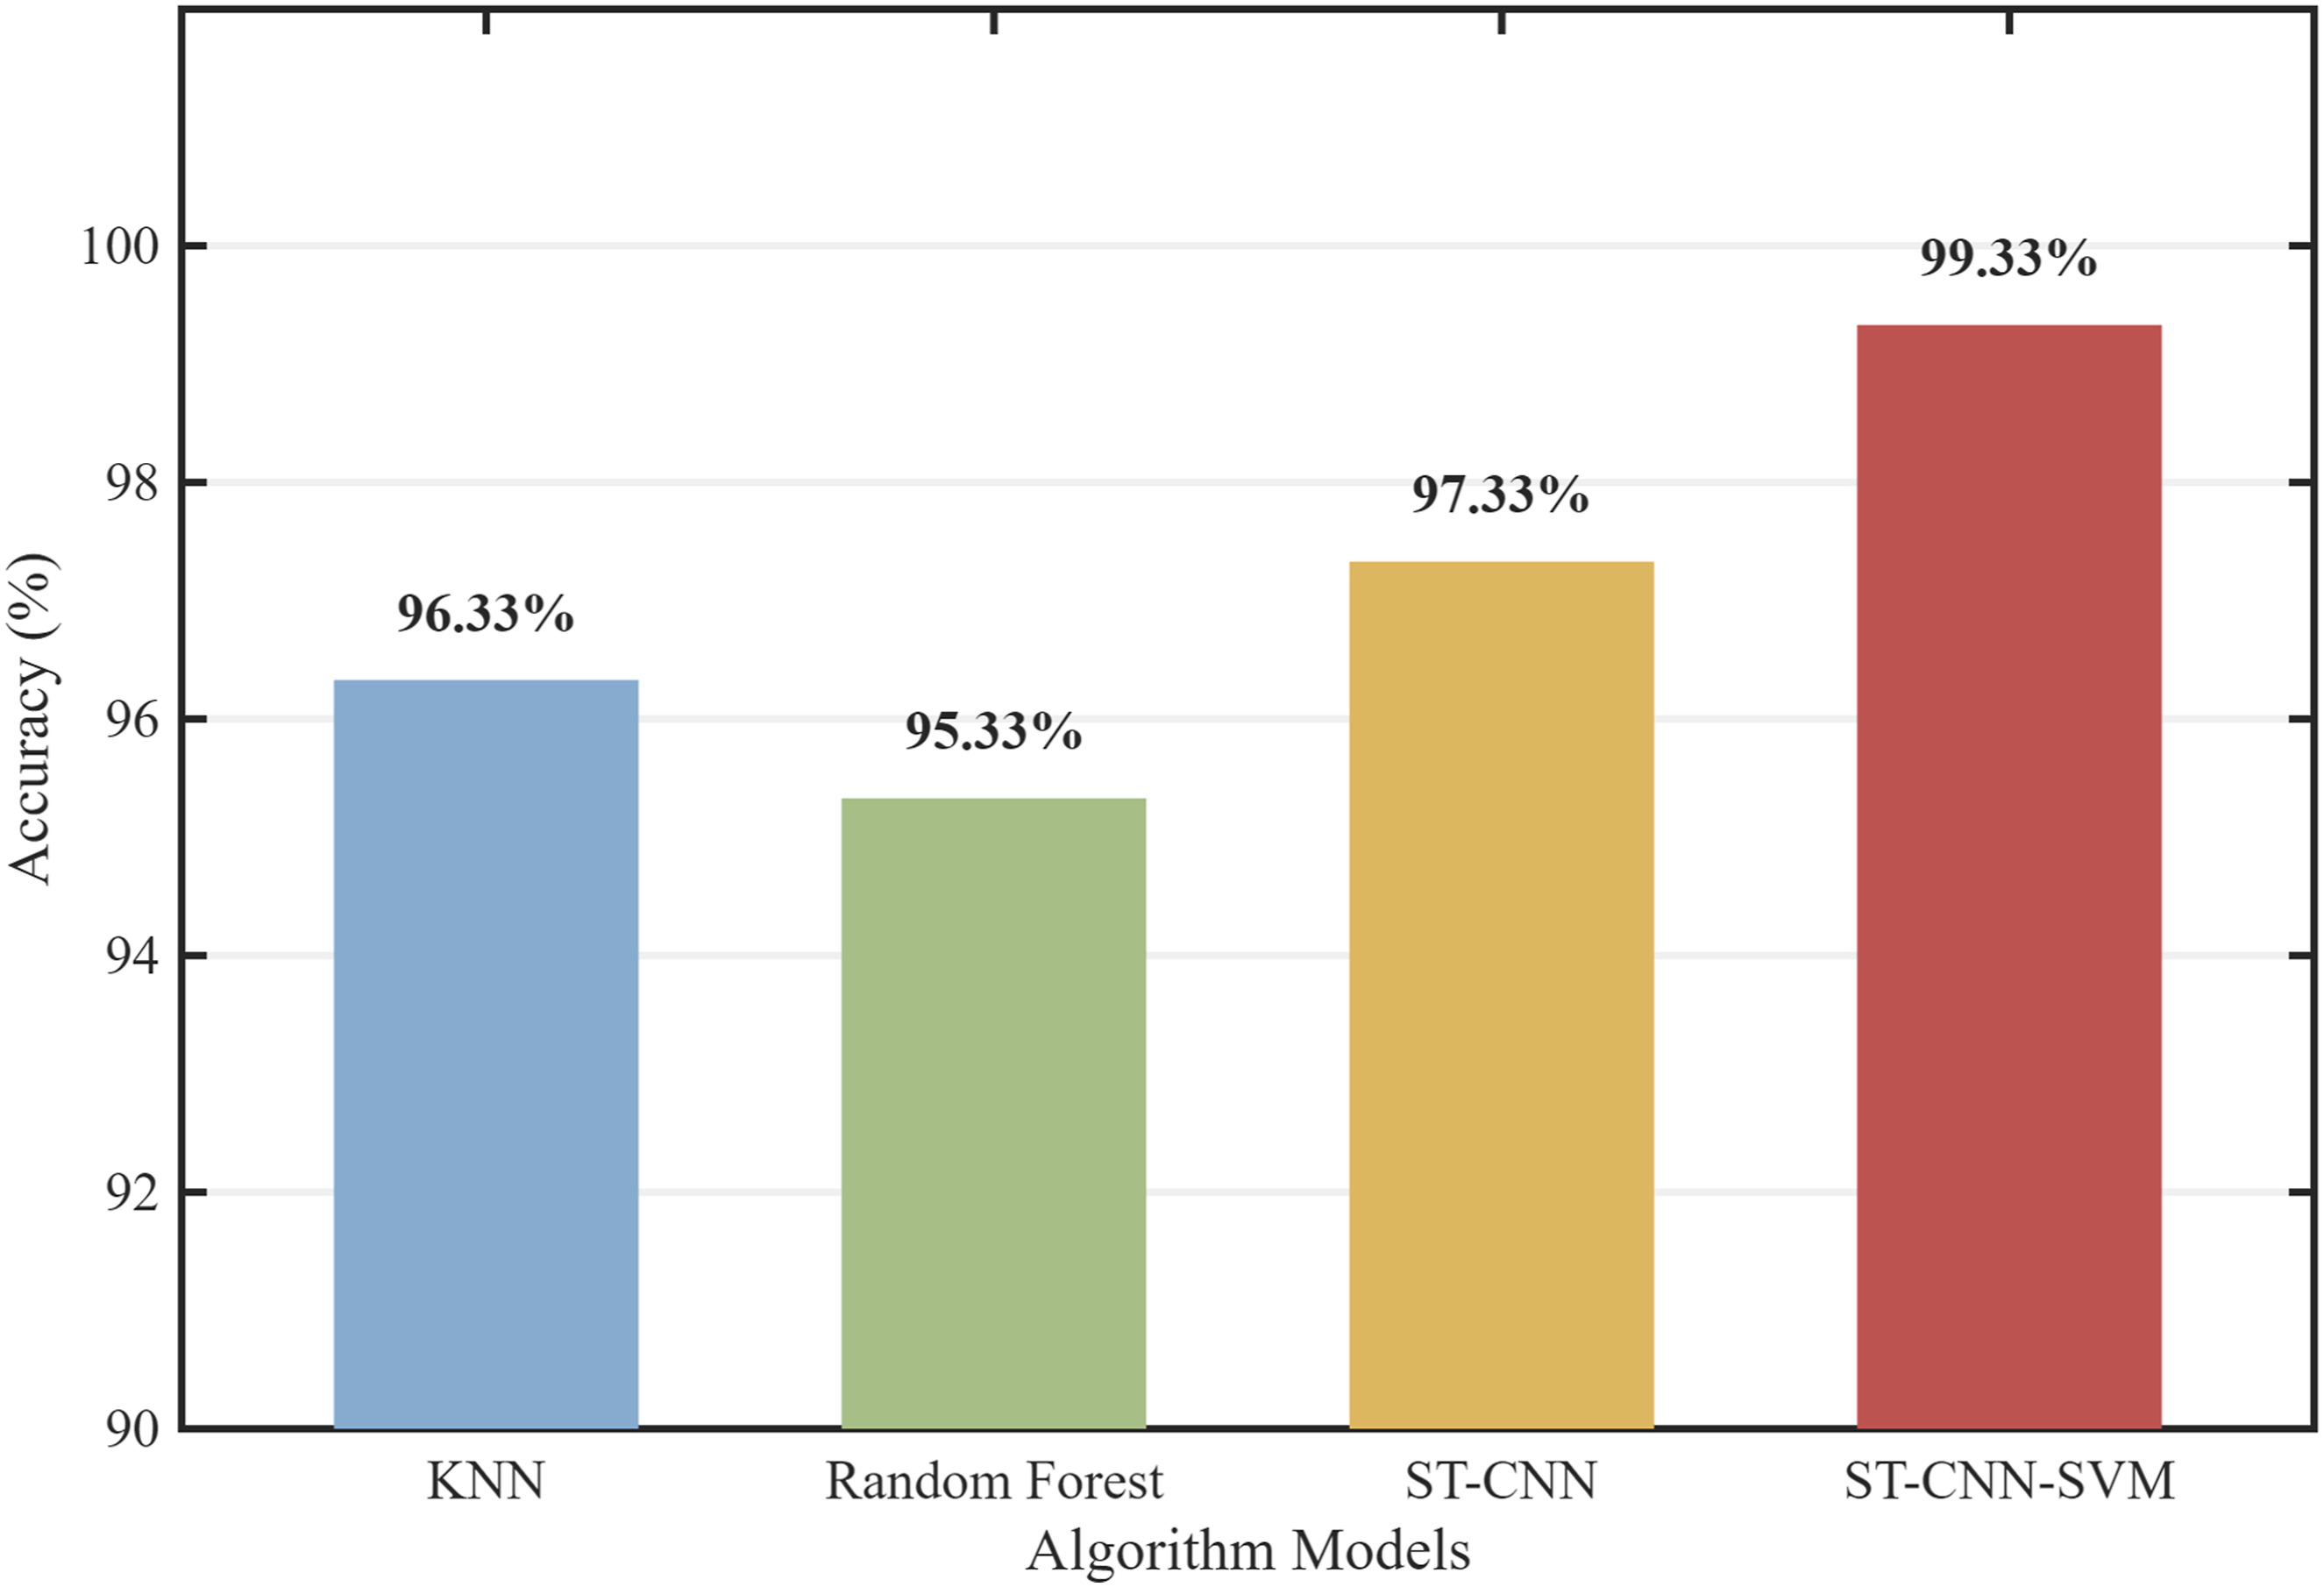
Fundamental causes of these performance discrepancies are rooted in the representation limitations of traditional shallow learning paradigms. Explicit reliance on one-dimensional time-domain statistics during feature extraction causes the original feature manifold to be easily submerged by noise contamination. Consequently, inter-class discriminability undergoes rapid attenuation when fault-specific signatures are masked by dominant background interference. In sharp contrast, deep synergy is established between the high-resolution time-frequency focusing of the ST and the multi-scale feature reconstruction capability of the CNN. Noise masking effects are effectively suppressed, which facilitates the precise capture of weak local fault signatures from complex background interference. This coordinated approach ensures that salient feature representations are maintained even in low-speed machinery applications characterized by heavy noise and nonstationary signals.
Based on the aforementioned baseline tests, and in order to further validate the decision robustness of ST-CNN-SVM under variable and unknown industrial disturbances, this study conducts multi-level noise gradient stress testing. Given the presence of broadband electromagnetic interference in real-world factory environments, this study randomly injects gradient Gaussian white noise ranging from 0 dB to 20 dB into the training set during the training phase. Conceptually, this strategy aligns closely with the recently emerging positive-incentive noise 25 paradigm in the field of AI fault diagnosis. This approach is not merely designed to counteract interference, but rather utilises the mechanism of positive-incentive noise to transform the injection of controlled noise into a regularisation technique during the training process. By combining this noise enhancement strategy with an SVM decision layer based on the SRM criterion, the model effectively mitigates the risk of overfitting that often arises when dealing with noise-free features. Following the regularisation of the feature space, the model is evaluated on an independent test set where the noise level gradually deteriorates from 20 dB to 0 dB.
As shown in Figure 6, the experimental results indicate that under mild interference, both the model proposed in this paper and ST-CNN achieve a high accuracy of 99%. However, when test conditions deteriorate sharply to 0 dB, the accuracy of the traditional RF model plummets, whereas ST-CNN-SVM maintains an outstanding diagnostic accuracy of 95.67%. These results fully validate the practical potential of this method in industrial applications, despite the dual challenges of small sample sizes and strong noise interference. Robustness comparison under different noise levels.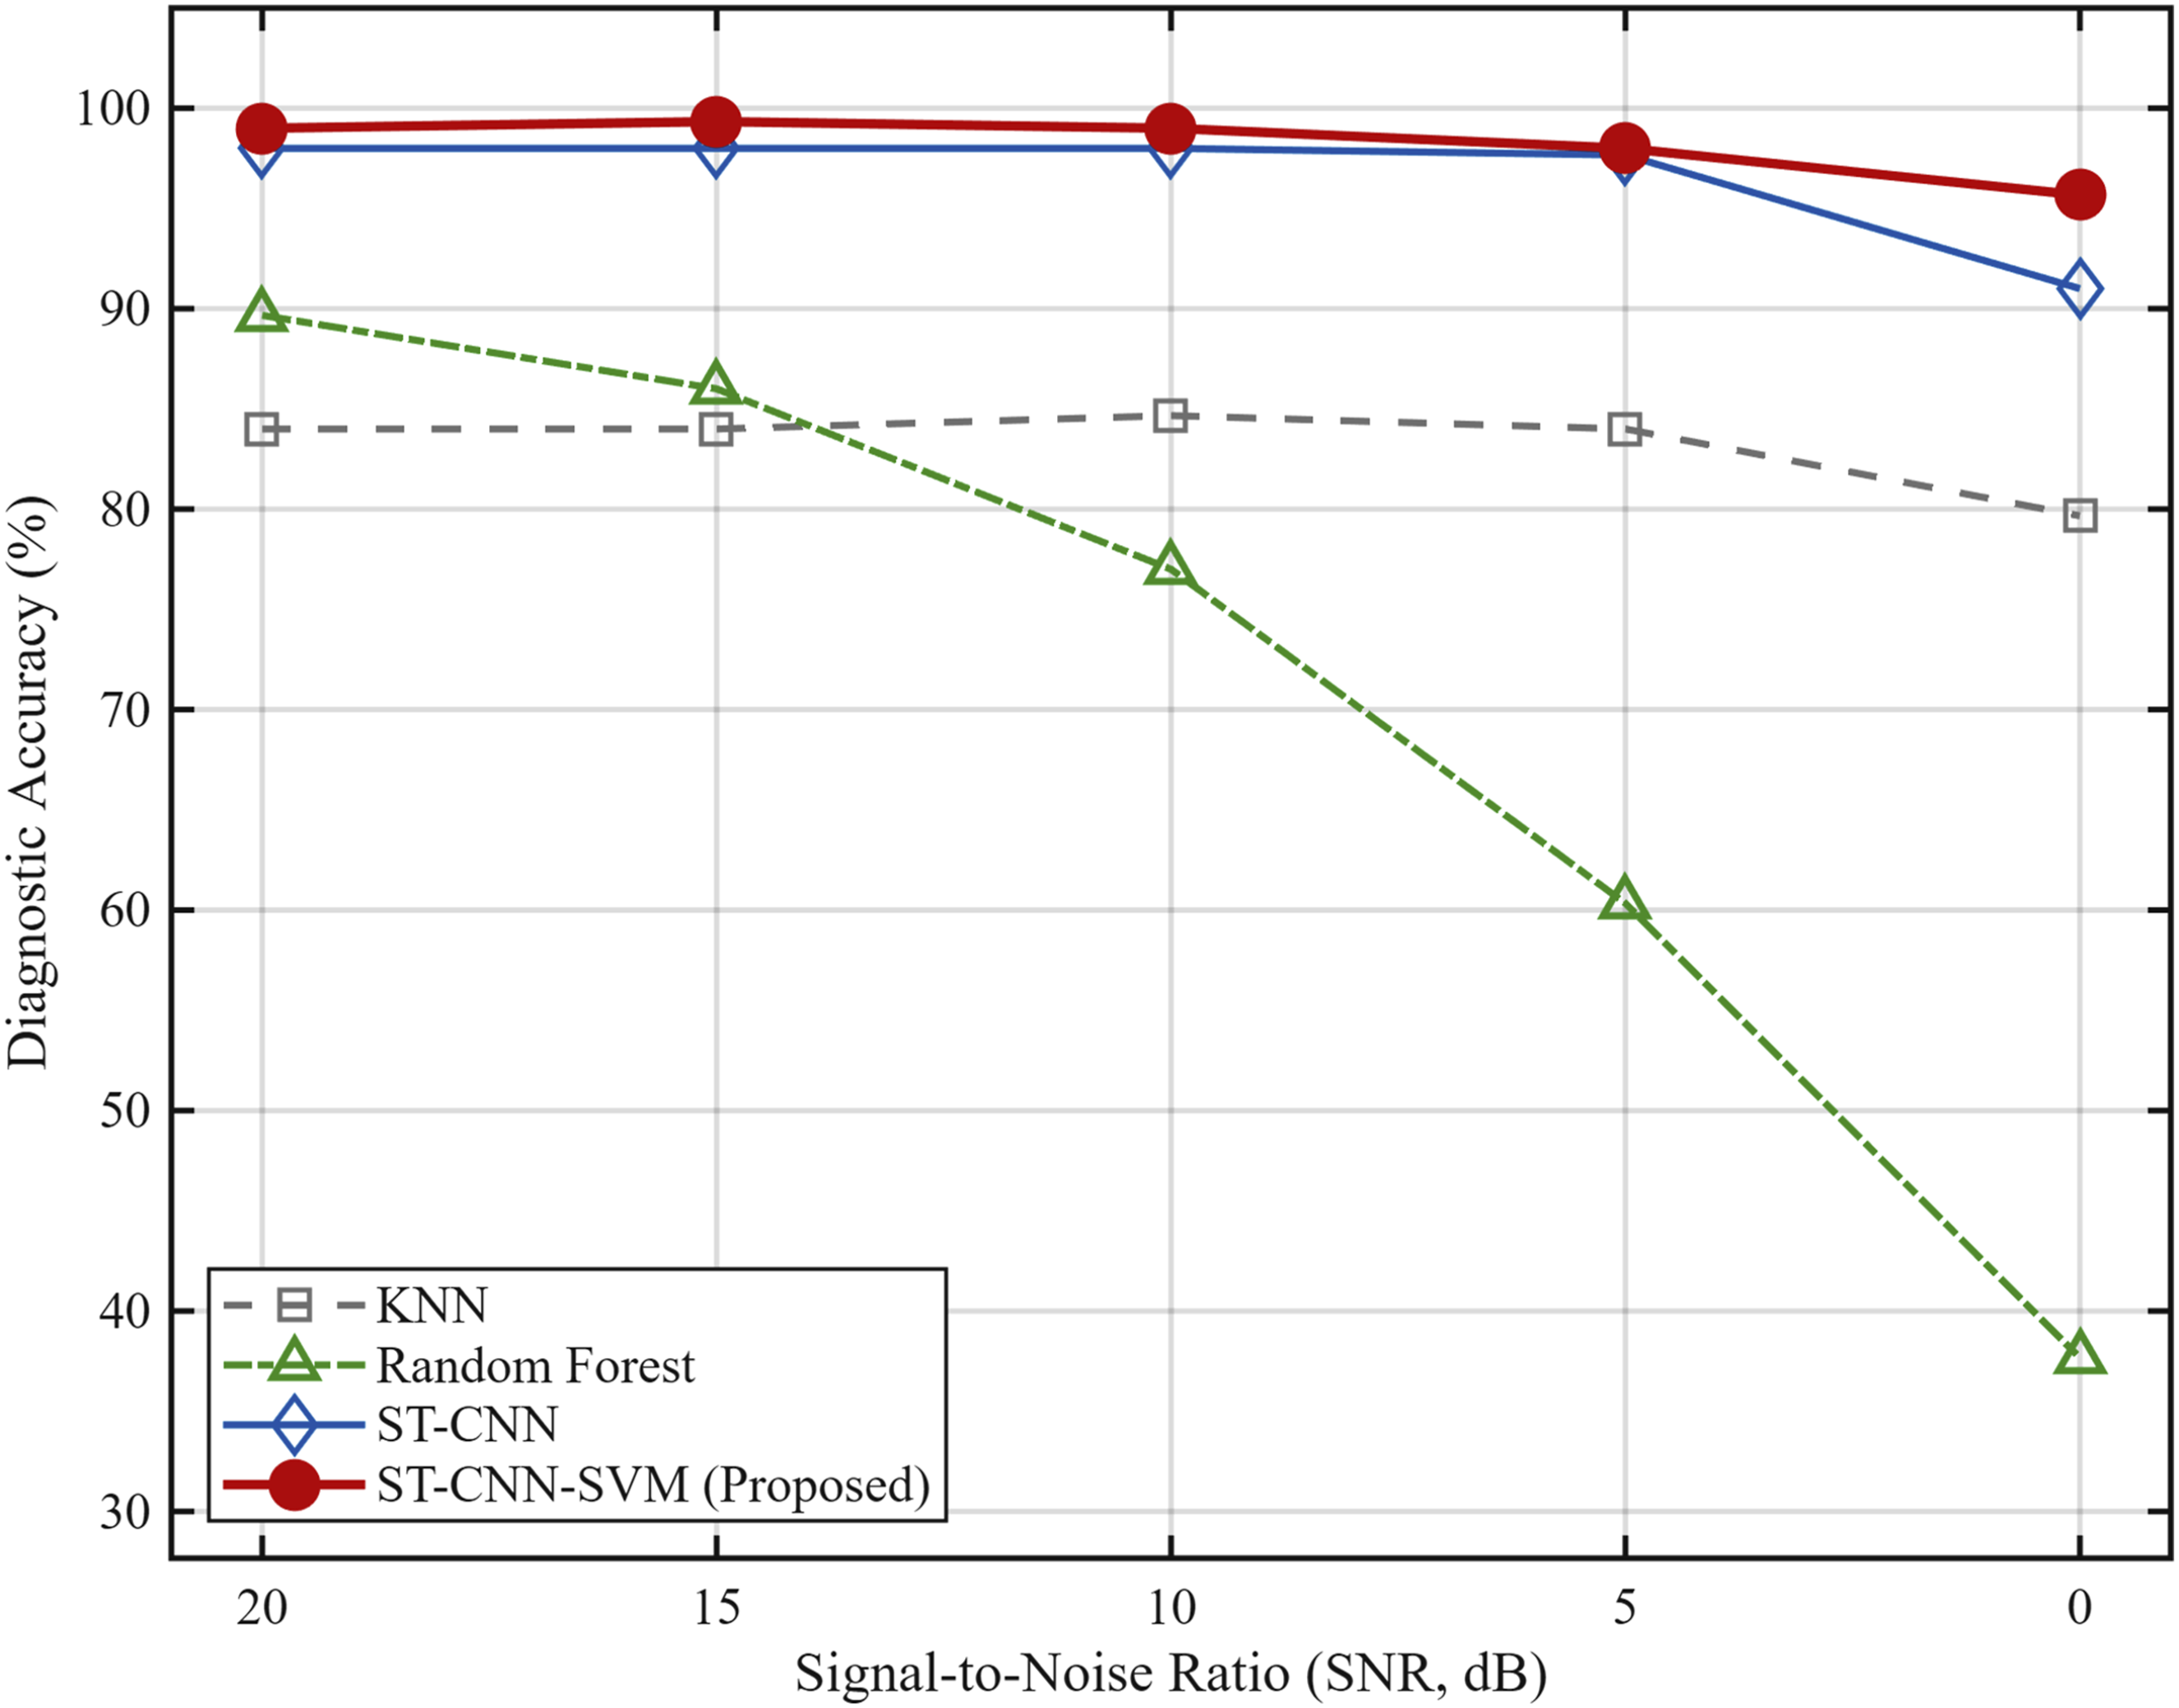
The ablation experiment results further confirm that introducing SVM as classifiers is a core element in enhancing the overall robustness of the model, with the resulting diagnostic gains significantly outperforming those of the traditional benchmark model driven by a Softmax layer. Fundamentally, the traditional Softmax layer is rooted in the ERM principle. Its parameter update process heavily relies on the cross-entropy loss across the entire dataset, which makes it highly prone to overfitting when handling ambiguous samples in regions with overlapping features. The SVM classifier integrated in this research strictly adheres to the framework of SRM. Through nonlinear kernel functions, it achieves high-dimensional mapping in the feature space, constructing the maximum margin hyperplane solely based on support vectors located at the decision boundary.
Subsequent to the establishment of noise robustness, performance boundaries of the model under ideal environments are further explored in this section. High-fidelity identification is achieved across nearly all fault categories, as demonstrated by the confusion matrix presented in Figure 7 under noise-free conditions. Total diagnostic accuracy reaches 99.00%, reflecting the capability of the framework to maintain precise discrimination when signal integrity is preserved in ideal environments. Confusion matrix for fault identification.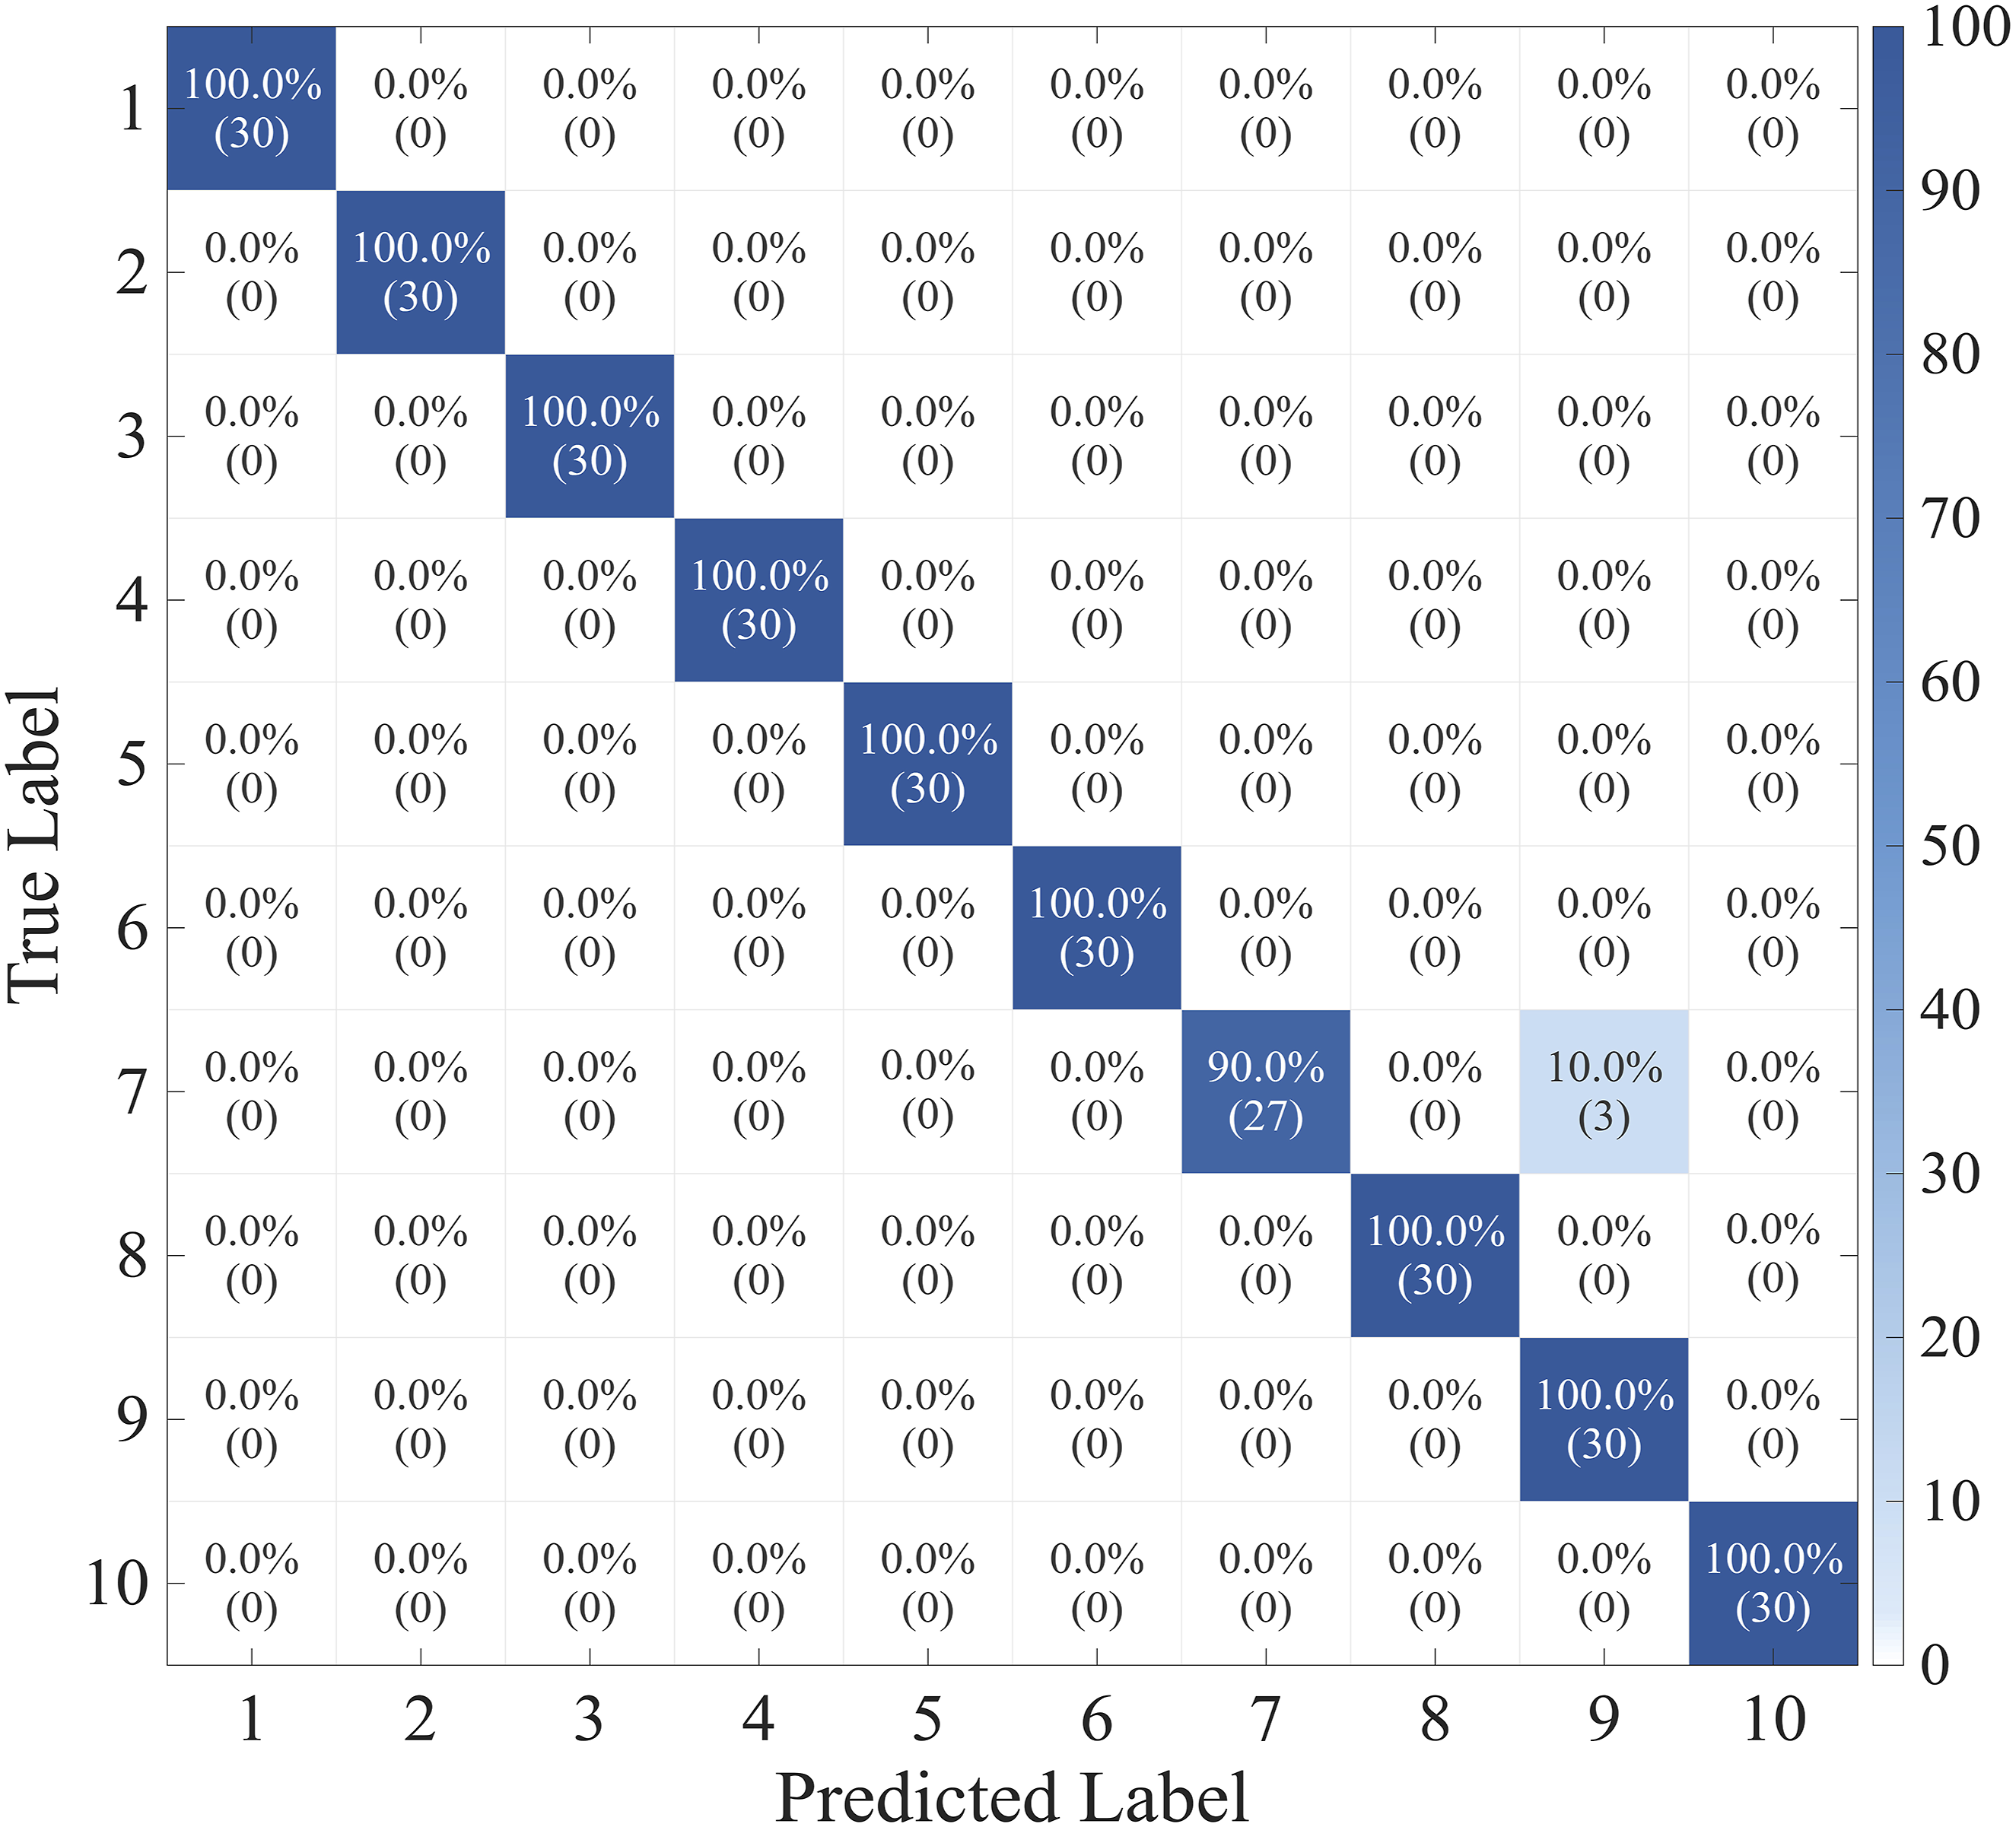
Although this model demonstrates excellent diagnostic accuracy, there remains a small degree of classification bias in Class 7 moderate outer-ring faults. From the perspective of dynamic response analysis, these biases are primarily attributable to the physical overlap of high-frequency resonance bands. The ST employs a frequency-dependent scaling operator, whereby the width of the Gaussian window function is inversely proportional to the frequency. When processing high-frequency resonance components excited by outer-circuit faults, this mechanism results in a reduction in frequency-domain resolution, causing the spectral representation to appear blurred. Under specific load conditions, impact pulses generated by moderate damage can excite structural resonances with similar spectral characteristics; however, limitations in resolution affect the clarity of features in the time-frequency plot, causing the convolutional neural network extractor to map different fault states onto overlapping regions within the feature space. This feature overlap at the representation level affects the performance of the decision-making layer. Although support vector machines employ RBF kernel functions to enhance the non-linear processing capabilities of the classification hyperplane, the model still struggles to establish precise decision boundaries in regions where feature distributions overlap. Furthermore, the fixed Gaussian window logic has limited ability to capture non-stationary features under variable speed or high-noise conditions, making it difficult for the decision layer to achieve completely accurate class discrimination. This is the primary reason for the reduced classification accuracy of the model under specific operating conditions.
Superior anti-interference characteristics are inherent in this decision mechanism based on sparse samples. Feature offsets induced by local noise are effectively suppressed, ensuring that robust generalization performance is achieved during the processing of nonlinear complex boundaries.
Ablation study on time-frequency representations
To verify the intrinsic contribution of the S-transform to the diagnostic architecture, this study conducts ablation experiments in a highly noisy environment with a signal-to-noise ratio of 5 dB, comparing two characterisation methods: the CWT and the Synchronous Squeeze Transform (SST). In accordance with the single-variable principle, all characterisation methods follow the same processing procedure. First, the fault characteristic frequency band ranging from 1000 Hz to 4500 Hz is extracted to eliminate background interference, and the images are downsampled to a uniform size of 64 × 64 × 3 pixels.
As shown in Figure 8, under the same back-end architecture, the S-transform-based scheme achieves an accuracy of 92.33%, which is significantly better than that of the CWT and the SST. Analysis indicates that, due to its fixed basis functions, the continuous wavelet transform is prone to energy dispersion in the presence of noise, leading to blurred features. More importantly, SST exhibits a significant decline in performance under these conditions. The reason for this is that, when phase information is severely contaminated by noise, the energy squeezing mechanism is prone to inducing an over-squeezing effect, reconstructing randomly distributed noise energy into pseudo-spectral lines with geometric continuity. This physical distortion, arising from the algorithm itself, provides convolutional neural networks with erroneous feature activation signals, thereby leading to a decline in classification accuracy. In contrast, the ST, through its frequency-adaptive windowing mechanism, accurately preserves the intrinsic envelope of fault pulses amidst noise. This comparative experiment provides clear evidence that the system's high-performance stems from the physical advantages of the S-transform during the time-frequency representation stage. Accuracy comparison at 5 dB SNR.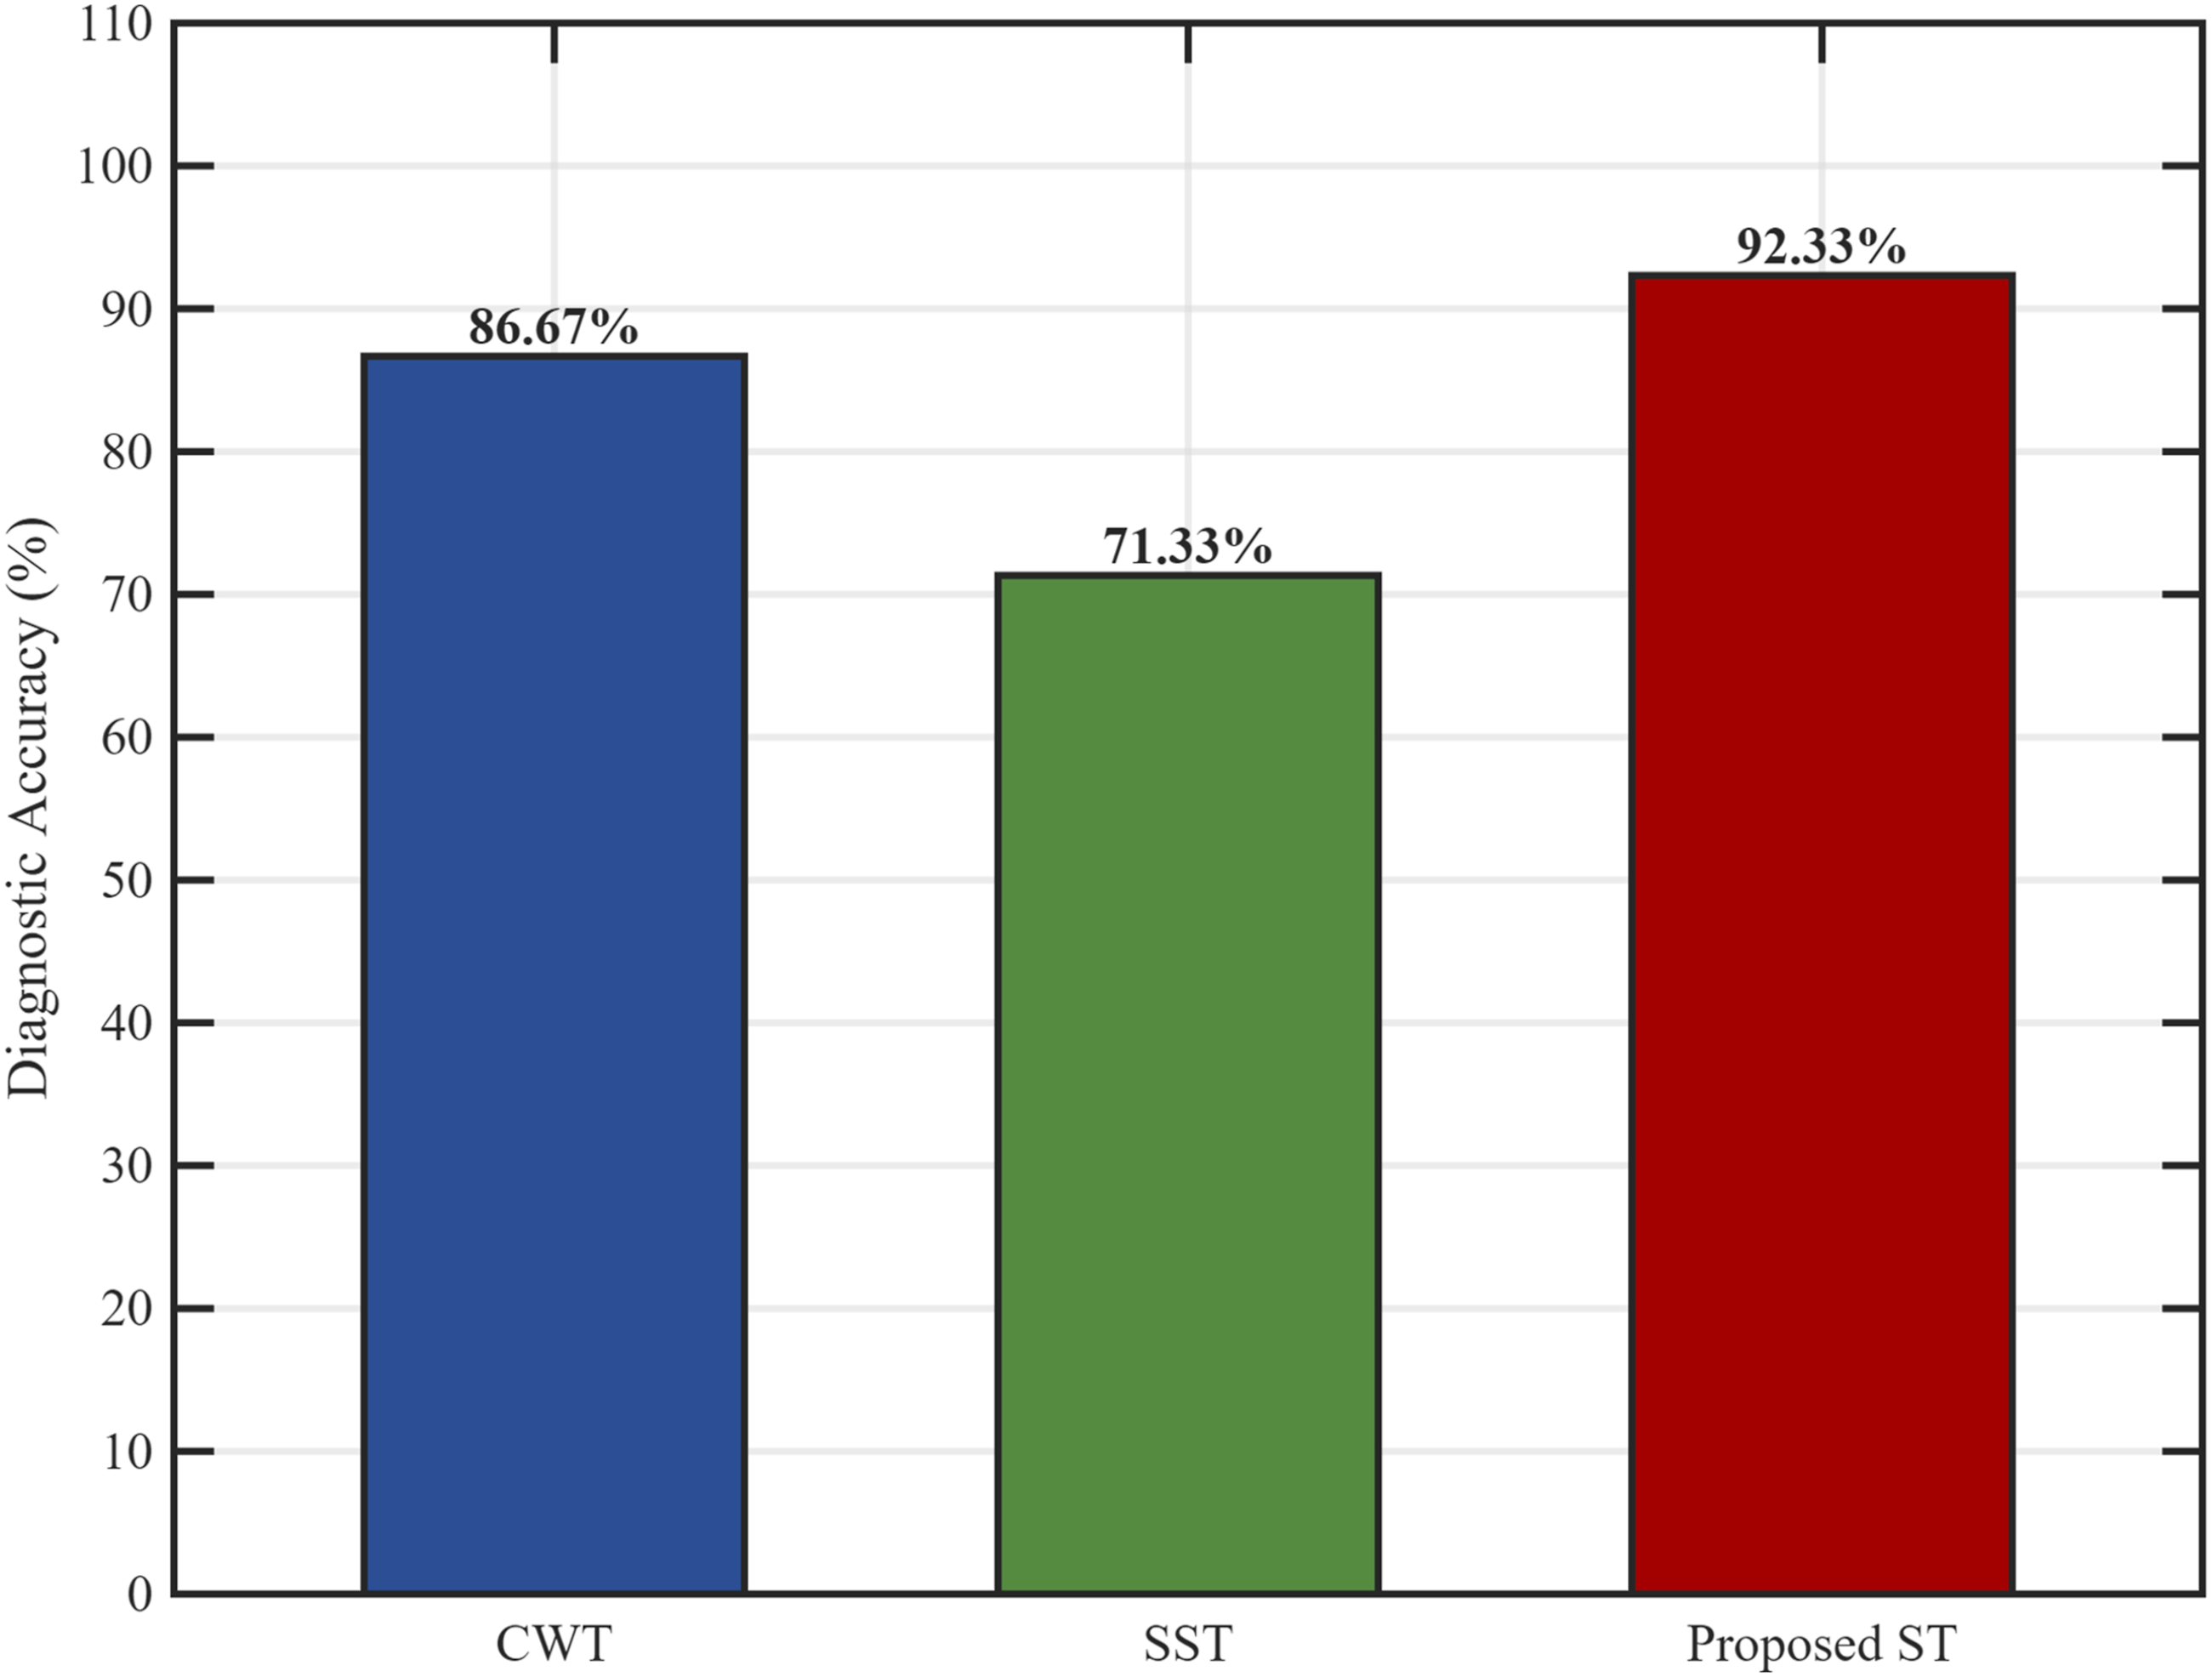
Robustness evaluation under small sample scenarios
In industrial settings, the collection of fault data is often hampered by high annotation costs and a scarcity of usable signal duration, resulting in a severe limitation on the volume of available training data. This study focuses on this small-sample scenario. Although the sample size has been expanded through overlapping sampling techniques, given the limited total volume of original signal sources, the model must still construct a robust decision boundary within a relatively small feature space. This scenario aligns with the practical engineering requirement for small-sample diagnostic capabilities. In this section, the performance trajectories of the benchmark CNN using a Softmax classifier and the ST-CNN-SVM proposed in this paper are compared by gradually increasing the training sample size for each fault category from 5 to 70.
As shown in Figure 9, the experiment recorded the average test accuracy of the two architectures at different training scales. Data indicates that when samples are extremely scarce, both types of models experience severe performance degradation, with accuracy rates hovering around 72.1%. It is noteworthy that under the extremely small data of 10 samples per category, CNN-Softmax achieved an 84.4% recognition rate, slightly outperforming the 82.8% recognition rate obtained by ST-CNN-SVM. However, as the sample size increased to 20 per category, ST-CNN-SVM demonstrated a more pronounced recovery in performance, with its accuracy rapidly climbing to 91.6%, achieving a 5.9 percentage point lead over CNN-Softmax. Performance analysis under small samples.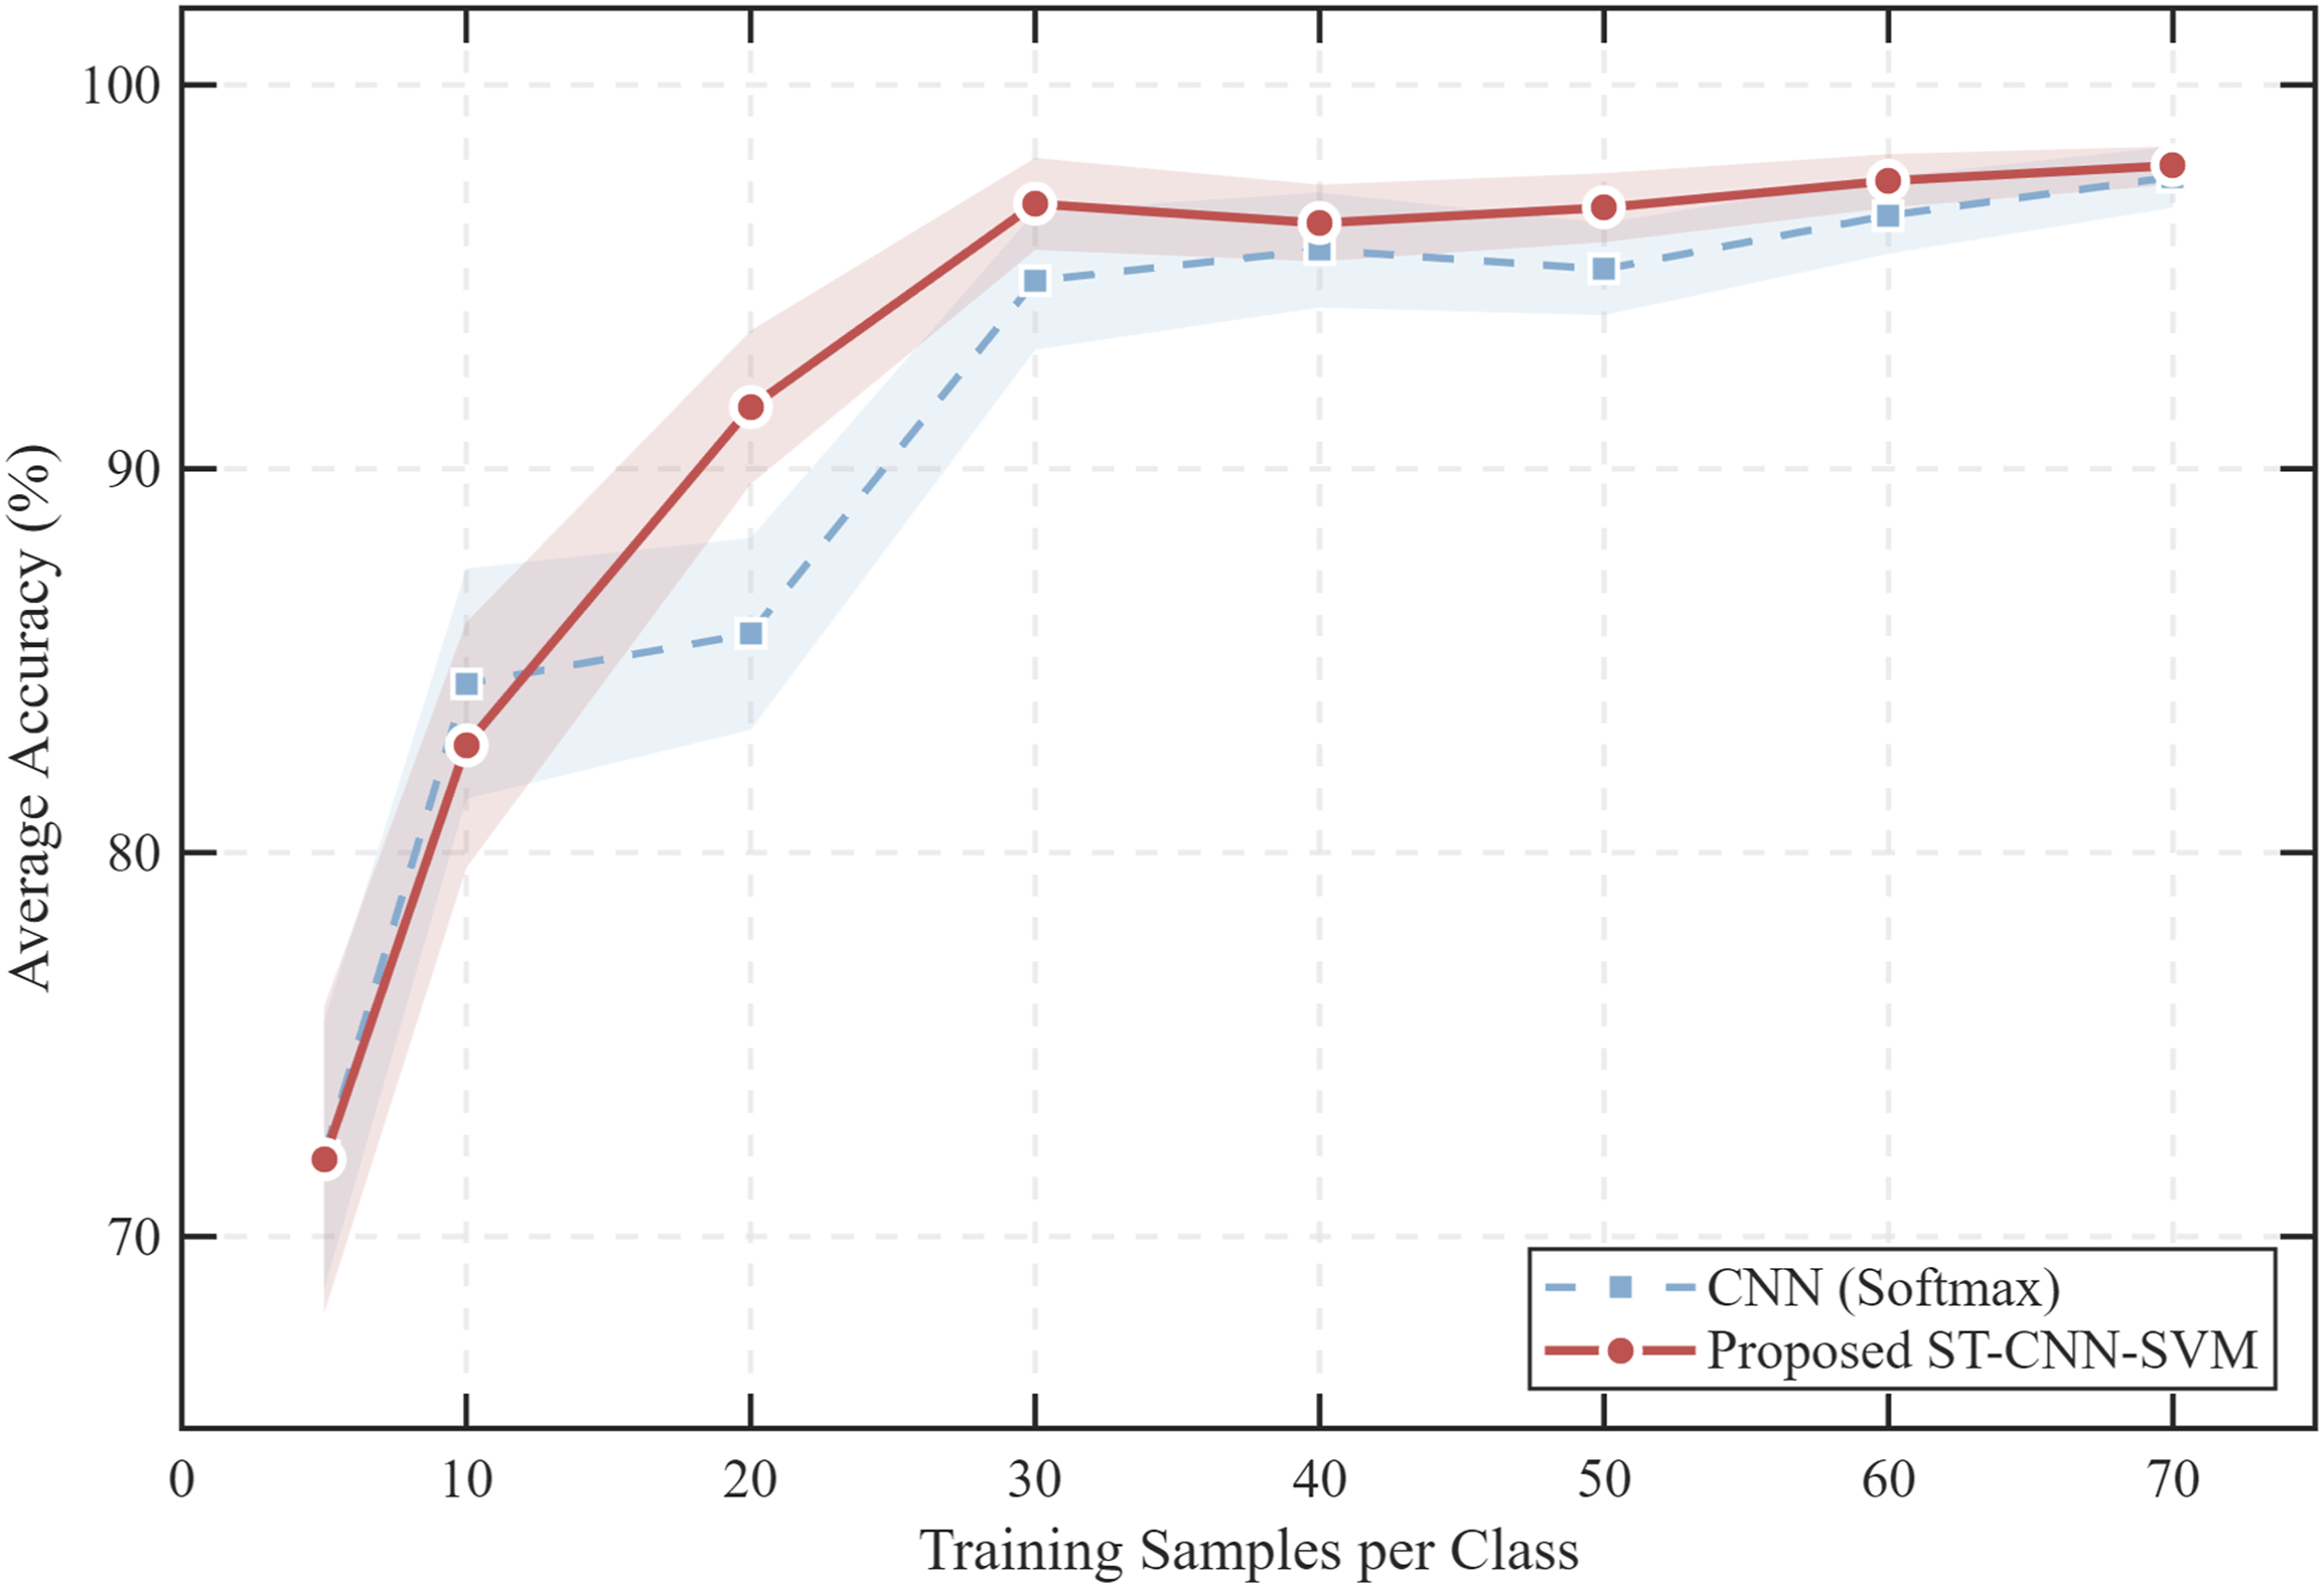
With the training scale further expanded, the performance gap between the two models stabilized within the range of 30 to 70 samples, with ST-CNN-SVM maintaining a consistent lead. Under the configuration of 30 samples per category, ST-CNN-SVM achieved an accuracy of 96.8%, while CNN-Softmax yielded a corresponding accuracy of 94.8%. When the sample size increased to 70 per category, the diagnostic accuracy of ST-CNN-SVM converged to 97.7%, slightly higher than 97.5% of CNN-Softmax.
Above performance evolution trends reflect the fundamental differences in decision logic within the feature space between the two algorithms. As an end-to-end architecture, CNN-Softmax relies heavily on sample diversity for weight optimization to suppress overfitting. Therefore, in the critical range where the sample size increases from 10 to 20, its improvement in generalization capability is less efficient than that of the hybrid architecture. In comparison, ST-CNN-SVM effectively integrates the feature representation capabilities of CNN with the SRM criterion. By seeking the maximum margin hyperplane in the deep feature space, its approach more efficiently utilizes a finite number of support vectors to construct a robust decision boundary. Experimental results confirm that in typical industrial scenarios involving small sample sizes of 20 to 50 samples per category, the proposed architecture achieves higher diagnostic reliability at lower training costs.
Statistical stability validation of prediction results
The sensitivity of a model to data partitioning methods is a key indicator for assessing its reliability in industrial monitoring data analysis. In order to validate the discriminative stability of the ST-CNN-SVM architecture across different data combinations and eliminate the interference of sample randomness on diagnostic results, a random subset cross-validation experiment is conducted on the original dataset in this section.
Through a global random shuffling algorithm, the original feature space is divided into four equally sized and mutually independent subsets: Group A to Group D. Such a partitioning method aims to simulate the impact of random sampling from different batches in industrial settings on the model's decision boundary.
As shown in Figure 10, the experimental results present the model's classification performance across various random subsets in the form of a transfer matrix. Quantitative analysis indicates that ST-CNN-SVM consistently achieved recognition accuracy above 97.6% across all 16 randomly combined test sets. Despite the training and test sets originating from entirely different random sampling batches, the model maintained exceptionally high consistency. Accuracy matrix for randomly shuffled subsets.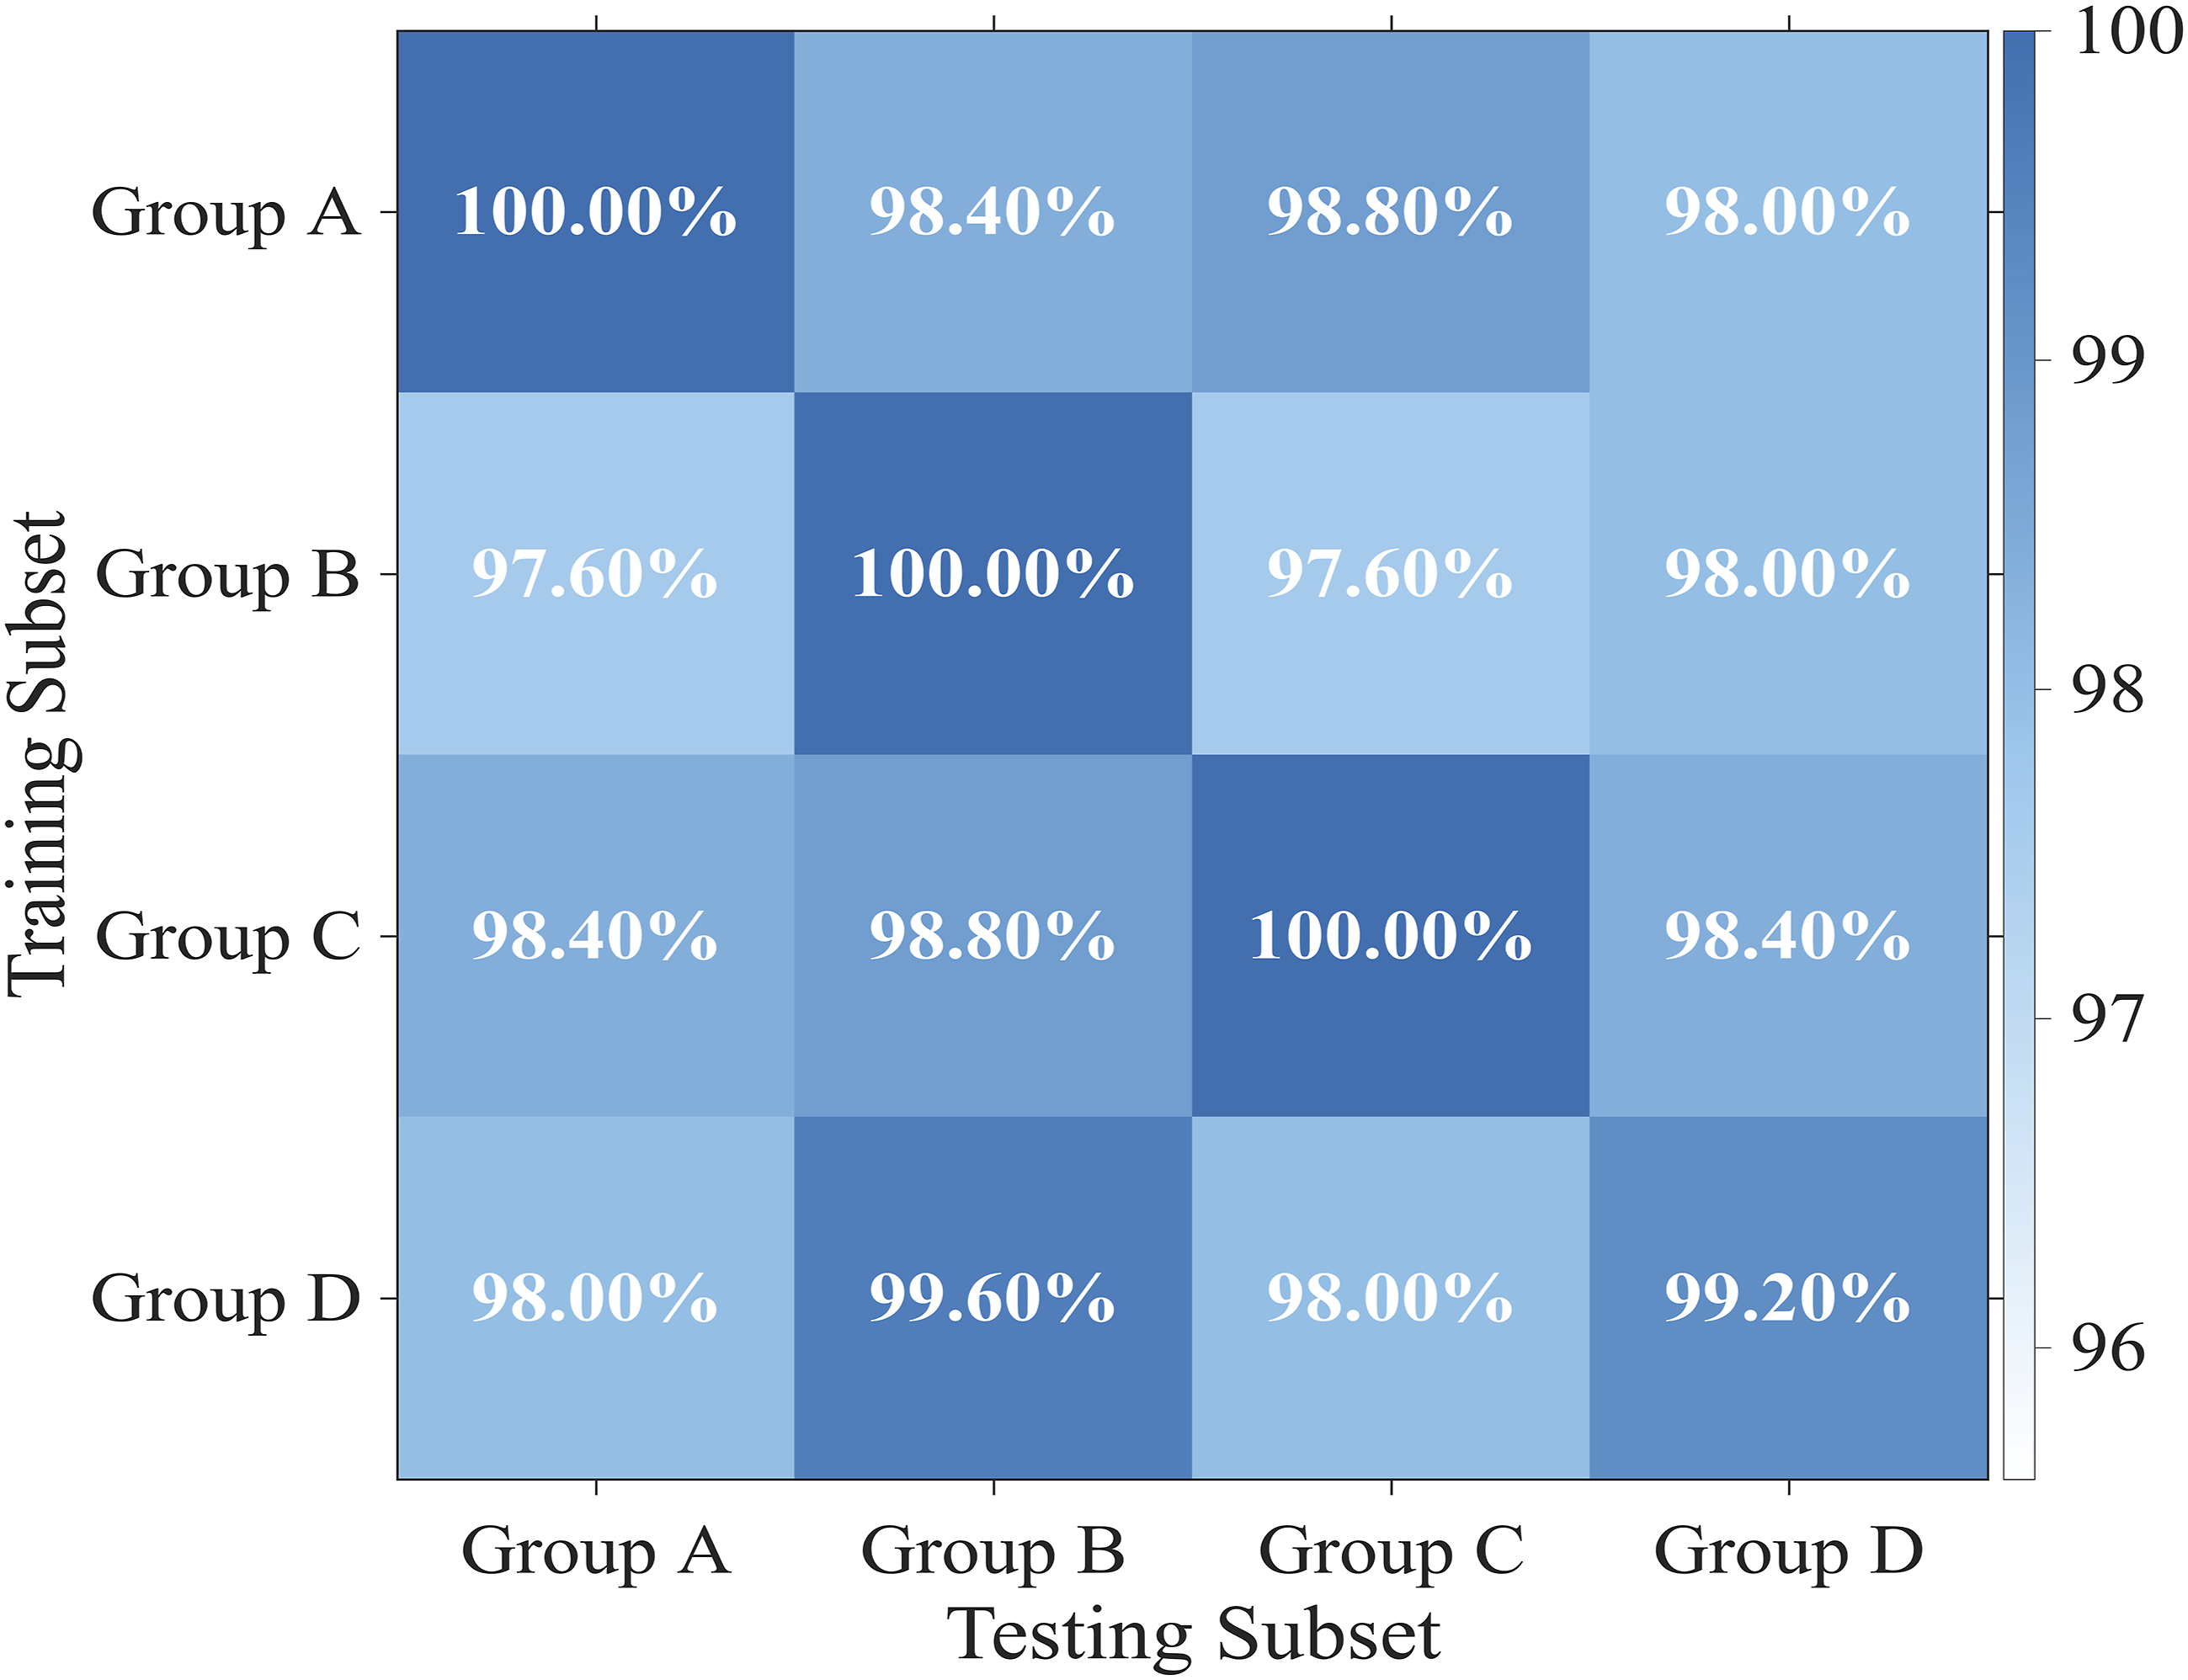
The results confirm that the ST-CNN-SVM model does not incidentally capture isolated features from local samples. Instead, its high-resolution time-frequency mapping via the ST, combined with the deep representation mechanism of CNN, successfully extracts fault-intrinsic impact features with high statistical representativeness. Furthermore, the introduction of the SVM classifier further enhances the model's robustness to the randomness of sample selection, thereby ensuring the smoothness and consistency of the classification boundary across different data subsets. The experiment fully demonstrated that this architecture exhibits exceptional repeatability and predictive stability when processing vibration data under identical operating conditions.
Quantitative evaluation of lightweight attributes
Comparison of computational efficiency and resource consumption at the edge.
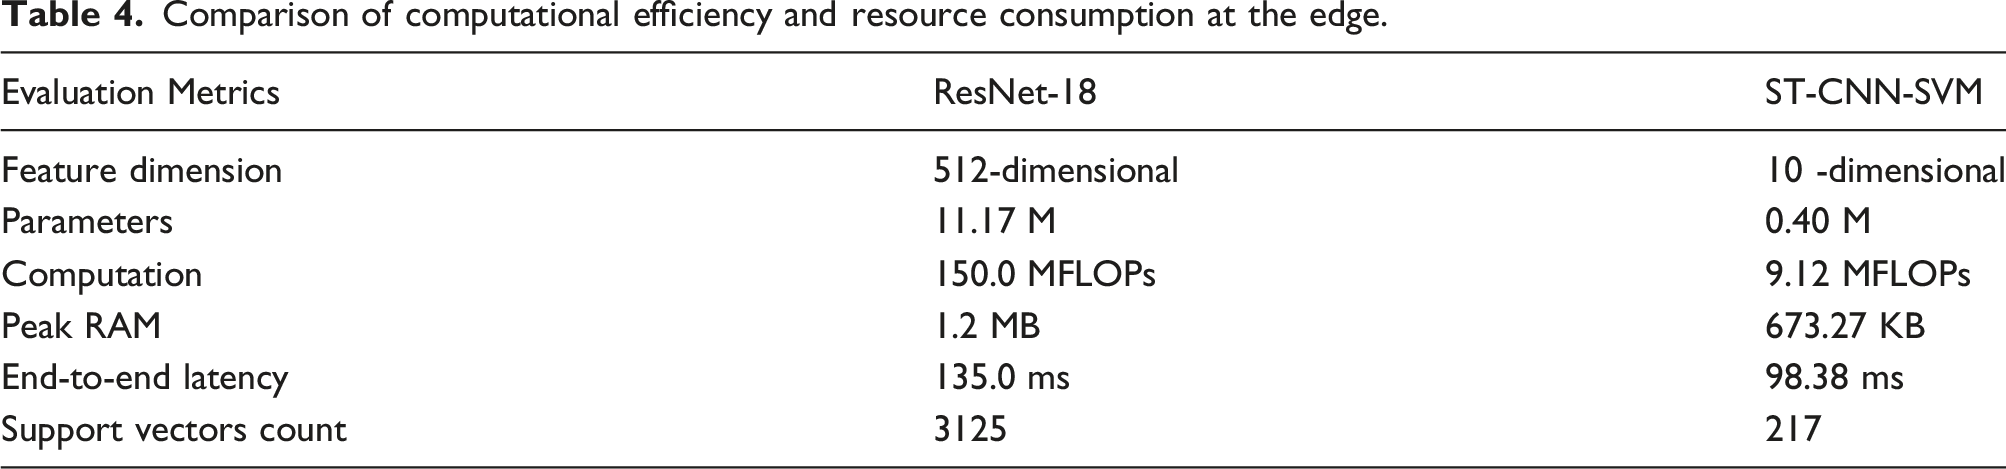
In the end-to-end latency evaluation, the S-transform pre-processing cost stands at 89.81 ms, with the total end-to-end system latency at 98.38 ms. Although this figure falls within the physical sampling period of 170.6 ms, the low latency margin of ResNet-18 increases the uncertainty of system operation. By reducing inference time, this framework provides a safety margin of approximately 42%. Furthermore, the architecture utilises feature space compression techniques to reduce computational redundancy. The 512-dimensional vectors output by ResNet-18 result in a significant increase in the number of support vectors, thereby increasing the inference latency of kernel operations. This study compresses features to 10 dimensions, enabling the model to make classification decisions using only 217 support vectors. This design facilitates the deployment of algorithms based on the structural risk minimisation criterion in resource-constrained environments.
Conclusion
In response to the dual challenges of extracting subtle fault features in rolling bearings under complex operating conditions and the high computational demands of deep learning models, a lightweight intelligent diagnostic method integrating ST time-frequency mechanisms with a CNN-SVM architecture is proposed. This paper leverages the adaptive multiresolution advantages of the ST to overcome the resolution limitations of traditional time-frequency analysis. Through reconstructing one-dimensional signals into high-fidelity time-frequency images, it significantly enhances the detection of transient impact features against strong noise backgrounds. Simultaneously, implementing a CNN-SVM cascading strategy replaces Softmax with the SVM's principle of SRM, constructing an optimal classification hyperplane in the deep feature space to effectively overcome the challenge of small sample generalization. Experimental results demonstrate that even under the constraint of 20 dB strong noise, the ST-CNN-SVM model maintains a high recognition accuracy of 99.33%. Crucially, superior generalization capability and convergence efficiency are demonstrated by ST-CNN-SVM in comparison with standard CNN, particularly within industrial small sample scenarios involving only 20 to 50 samples per category. Random subset cross-validation further demonstrates the method's exceptional statistical robustness and predictive consistency.
Furthermore, although this study validates the model's performance under broadband noise, the frequency resolution suffers when processing high-frequency resonance components, as the width of the Gaussian window function in the S-transform is inversely proportional to frequency. Under non-stationary operating conditions, such as variable speed, this physical limitation can easily lead to the spatial overlap of features associated with different fault categories, thereby causing identification errors. At present, this architecture remains limited to treating time-frequency plots as static inputs, and has not yet established a feedback mechanism between physical prior information and the feature extraction process. In our future work, we will explore generalised time-frequency analysis methods capable of adaptive window adjustment, and integrate these deeply with physics-driven digital twin technology. By establishing a closed-loop noise reduction and feature enhancement paradigm that facilitates interaction between virtual and physical domains, we aim to actively guide the thorough purification of complex pulse interference, thereby comprehensively enhancing the operational adaptability and physical credibility of this architecture.
Footnotes
Author contributions
The author is the sole contributor to all aspects of this research, including the methodology, data processing, and drafting of the manuscript.
Declaration of conflicting interests
The author declared no potential conflicts of interest with respect to the research, authorship, and/or publication of this article.
Funding
The author received no financial support for the research, authorship, and/or publication of this article.
Declaration on AI and AI-assisted technologies
The author confirms that no Artificial Intelligence (AI) or AI-assisted technologies were used to generate content or core text for this manuscript.
Ethical considerations
The datasets used in this study are publicly available and do not involve any human or animal subjects. Therefore, ethical committee approval and informed consent were not required.