
Abstract
This article presents the outcomes of an assessment of expected costs and benefits of future renewable energy use in the European Union by 2020 and beyond. A binding European Union-wide renewable energy systems target of achieving at least 27% renewable energy systems share in gross final energy demand by 2030 was adopted by the Council of the European Union in October 2014. This has to be seen as an important first step in defining the framework for renewable energy systems post-2020. Other steps, like a clear concept for and an agreement on the effort sharing across Member States have to follow. For doing so, clarity on associated costs and benefits of the future renewable energy systems expansion across European Union Member States appears highly beneficial. The aim of this article is to contribute to the renewable energy systems policy debate, providing an indication of costs and benefits resulting from increased renewable energy systems deployment within the European Union in the 2020 and 2030 frameworks. Within the discussion of costs and benefits, we follow a standardized concept that takes into account the diversity of policies in force and depicts the cost and benefits of renewable energy systems deployment at different levels, avoiding double counting or mixing up of effects. The outcomes of the analysis presented here remain, however, incomplete, focussing on certain indicators and on a related cross-country comparison rather than presenting a complete overview on expected impacts of future renewable energy systems deployment within the European Union.
Introduction
Policy context
The first decade of the new millennium was characterised by the successful deployment of renewable energy systems (RES) across European Union (EU) Member States. At EU level, the overall RES share in gross final energy consumption increased by more than two thirds, i.e. from 7.5% in 2000 to 12.5% in 2010. 1 The impressive structural changes in Europe's energy supply are the result of a combination of strong national policies and the general focus on RES created by the EU Renewable Energy Directives in the electricity and transport sectors towards 2010 (2001/77/EC 2 and 2003/30/EC 3 ).
The pathway for renewables towards 2020 was set and accepted by the European Council, the European Commission, and the European Parliament in April 2009. The related policy package, in particular, the EU Directive on the support of energy from renewable sources (2009/28/EC), 4 subsequently named RES Directive, comprises the establishment of binding RES targets for each Member State. The calculation of the particular targets is based on an equal RES share increase modulated by the respective Member State's GDP per capita. a This provides a clear framework and vision for renewable technologies in the short- to mid-term.
Despite the successful development of the RES sector, over the last decade, substantial challenges still lie ahead. The EU Energy Roadmap 2050, 5 published by the European Commission in 2011, gave first signals of renewable energy development pathways beyond the year 2020 and identified renewables as a ‘no-regrets’ option. Later on, in 2014, a binding EU-wide RES target of achieving at least 27% RES share in gross final energy demand in 2030 was adopted. 6 This has to be seen as an important first step in defining the framework for RES post-2020. Other steps, like a clear concept for and an agreement on the effort sharing across Member States have to follow. To do so, clarity on associated costs and benefits of the future RES expansion across EU Member States is highly beneficial.
Scope and structure of this article
The aim of this article is to contribute to the RES policy debate, providing an indication of costs and benefits resulting from increased RES deployment within the EU in the 2020 and 2030 frameworks. Within the discussion of costs and benefits, we follow a standardized concept that takes into account the diversity of policies in force and depicts the cost and benefits of RES deployment at different levels, avoiding double counting or mixing up of effects. The outcomes of the analysis presented here focus only on certain indicators and on a related cross-country comparison of certain costs and benefits rather than presenting a complete overview on expected impacts of future RES deployment within the EU.
The structure of this article is as follows: In the next section, we provide an overview of the state-of-the-art in assessing costs and benefits of RES use. For this purpose, a literature review is undertaken, presented in the remaining of ‘Introduction’ section. Subsequently, in ‘Methodological aspects’ section, we outline the methodology for assessing costs and benefits of RES use in a general manner, and offer insights and background information on the approach taken within this model-based forward-looking analysis. ‘Results of the model-based prospective assessment’ section is dedicated to presenting and discussing the outcomes. Finally, conclusions and policy recommendations are derived in ‘Conclusions’ section.
Literature review
The increasing deployment and the setting of specific targets allow renewable energies to become a mainstream option for electricity supply, but RES have experienced a significant growth in other energy sectors as well. These developments have strong impacts on the energy system, the market and the whole economy. To capture impacts correctly a clear concept and framework is needed. Several recent studies contribute to the development of such a framework as briefly outlined below.
In a general manner, a detailed and comprehensive illustration and overview of potential effects of wind power (as one key RES representative) on society is performed by JRC. 7 Although the study does not contain a detailed methodology or assessment, it serves as a good framework and basis. Based on preceding works of Breitschopf et al., 8 IRENA and CEM 9 suggested splitting the effects of RES use into four main categories: macroeconomic, distributional, system related and additional effects. In accordance with the above, Breitschopf and Held 10 go one step further: they present guidelines for assessing costs and benefits of RES use and framed useful approaches. The classification and guidelines serve as a basis for our quantitative assessment as presented in this article. In the next section, we summarise key elements of our approach. In accordance with the general classification of impacts into distinct categories, we summarise key literature below.
The impact of RES use on costs and benefits at the energy system level is systematically assessed in Breitschopf et al. 11 and Breitschopf and Held. 10 Both apply a distinction between direct and indirect generation costs of RES use, whereby the latter refer to the integration of RES into the energy system. Hirth et al. 12 defines these integration costs as additional costs of RES deployment due to balancing of electricity, profiling generation capacities and grid enforcements or extensions. These costs accrue because for variable renewables like wind, solar PV and also hydropower the produced electricity is temporarily variable and uncertain, depending on meteorological conditions at a given site. The authors also point out that the market value of RES electricity differs from the average price for electricity.
A closer look at the energy market is taken by Krozer 13 where distributional effects among distinct actors are of key relevance. The author analyses the impact of RES use on consumer prices in the EU through a comparison of observed electricity prices and simulated prices. His findings suggest that deploying RES appears beneficial to final consumers. The impact of RES on market electricity prices is confirmed by other studies such as Sensfuß et al., 14 Tveten et al. 15 or Cludius et al. 16 They all report an impact of RES-based power generation systems on the merit order of the power market. Thus, the change in the merit order in general leads to a decrease of the wholesale market price. This price impact together with special levy and exemption schemes entail distributional effects at the consumer level.
Several studies assess impacts of RES deployment on national economies. Two distinct relevant approaches are applied: On the one hand, studies dealing with gross impacts focus on employment effects that are caused directly by construction, manufacturing and installation of RES, whilst they partly ignore effects on upstream industries and others. Examples of this type of assessment are IRENA and CEM, 9 and Santamaría and Azqueta. 17 Assessments of net impacts fall under the second category: These studies have broadened the analytical scope and include effects in the upstream sectors as well as in sectors beyond the RES sectors. Lehr et al. 18 and Duscha et al. 19 are two examples of such analyses undertaken at European level. To assess the overall macroeconomic impact properly, all negative and positive direct, indirect and induced effects of RES deployment have to be included (Breitschopf et al. 20 ). While direct and indirect effects occur in the RES sector and its upstream industries, further effects are induced due to changes in production cost, income, and hence in consumption.
Methodological aspects
General approach
To properly assess impacts of RES deployment the system boundaries must be clearly defined as should the research question and time horizon. One further question is the dimension of the effect, i.e. whether we focus on economic effects only or whether environmental, technological and social effects should also be considered.
Allocating costs either to a RE-based technology system or to a fossil fuel-based system as well as allocating costs to heat and power is not always clear-cut. Therefore, the analysed technologies and systems (heat, electricity) should be (clearly) specified. Furthermore, the geographic area that is covered by the analysis is crucial as well as whether sectoral or overall economic effects are considered. When looking at the impacts of RES deployment or RES policies, three main types of effects can be identified (see Figure 1), occurring at three different levels.
Categories of main effects related to RES deployment.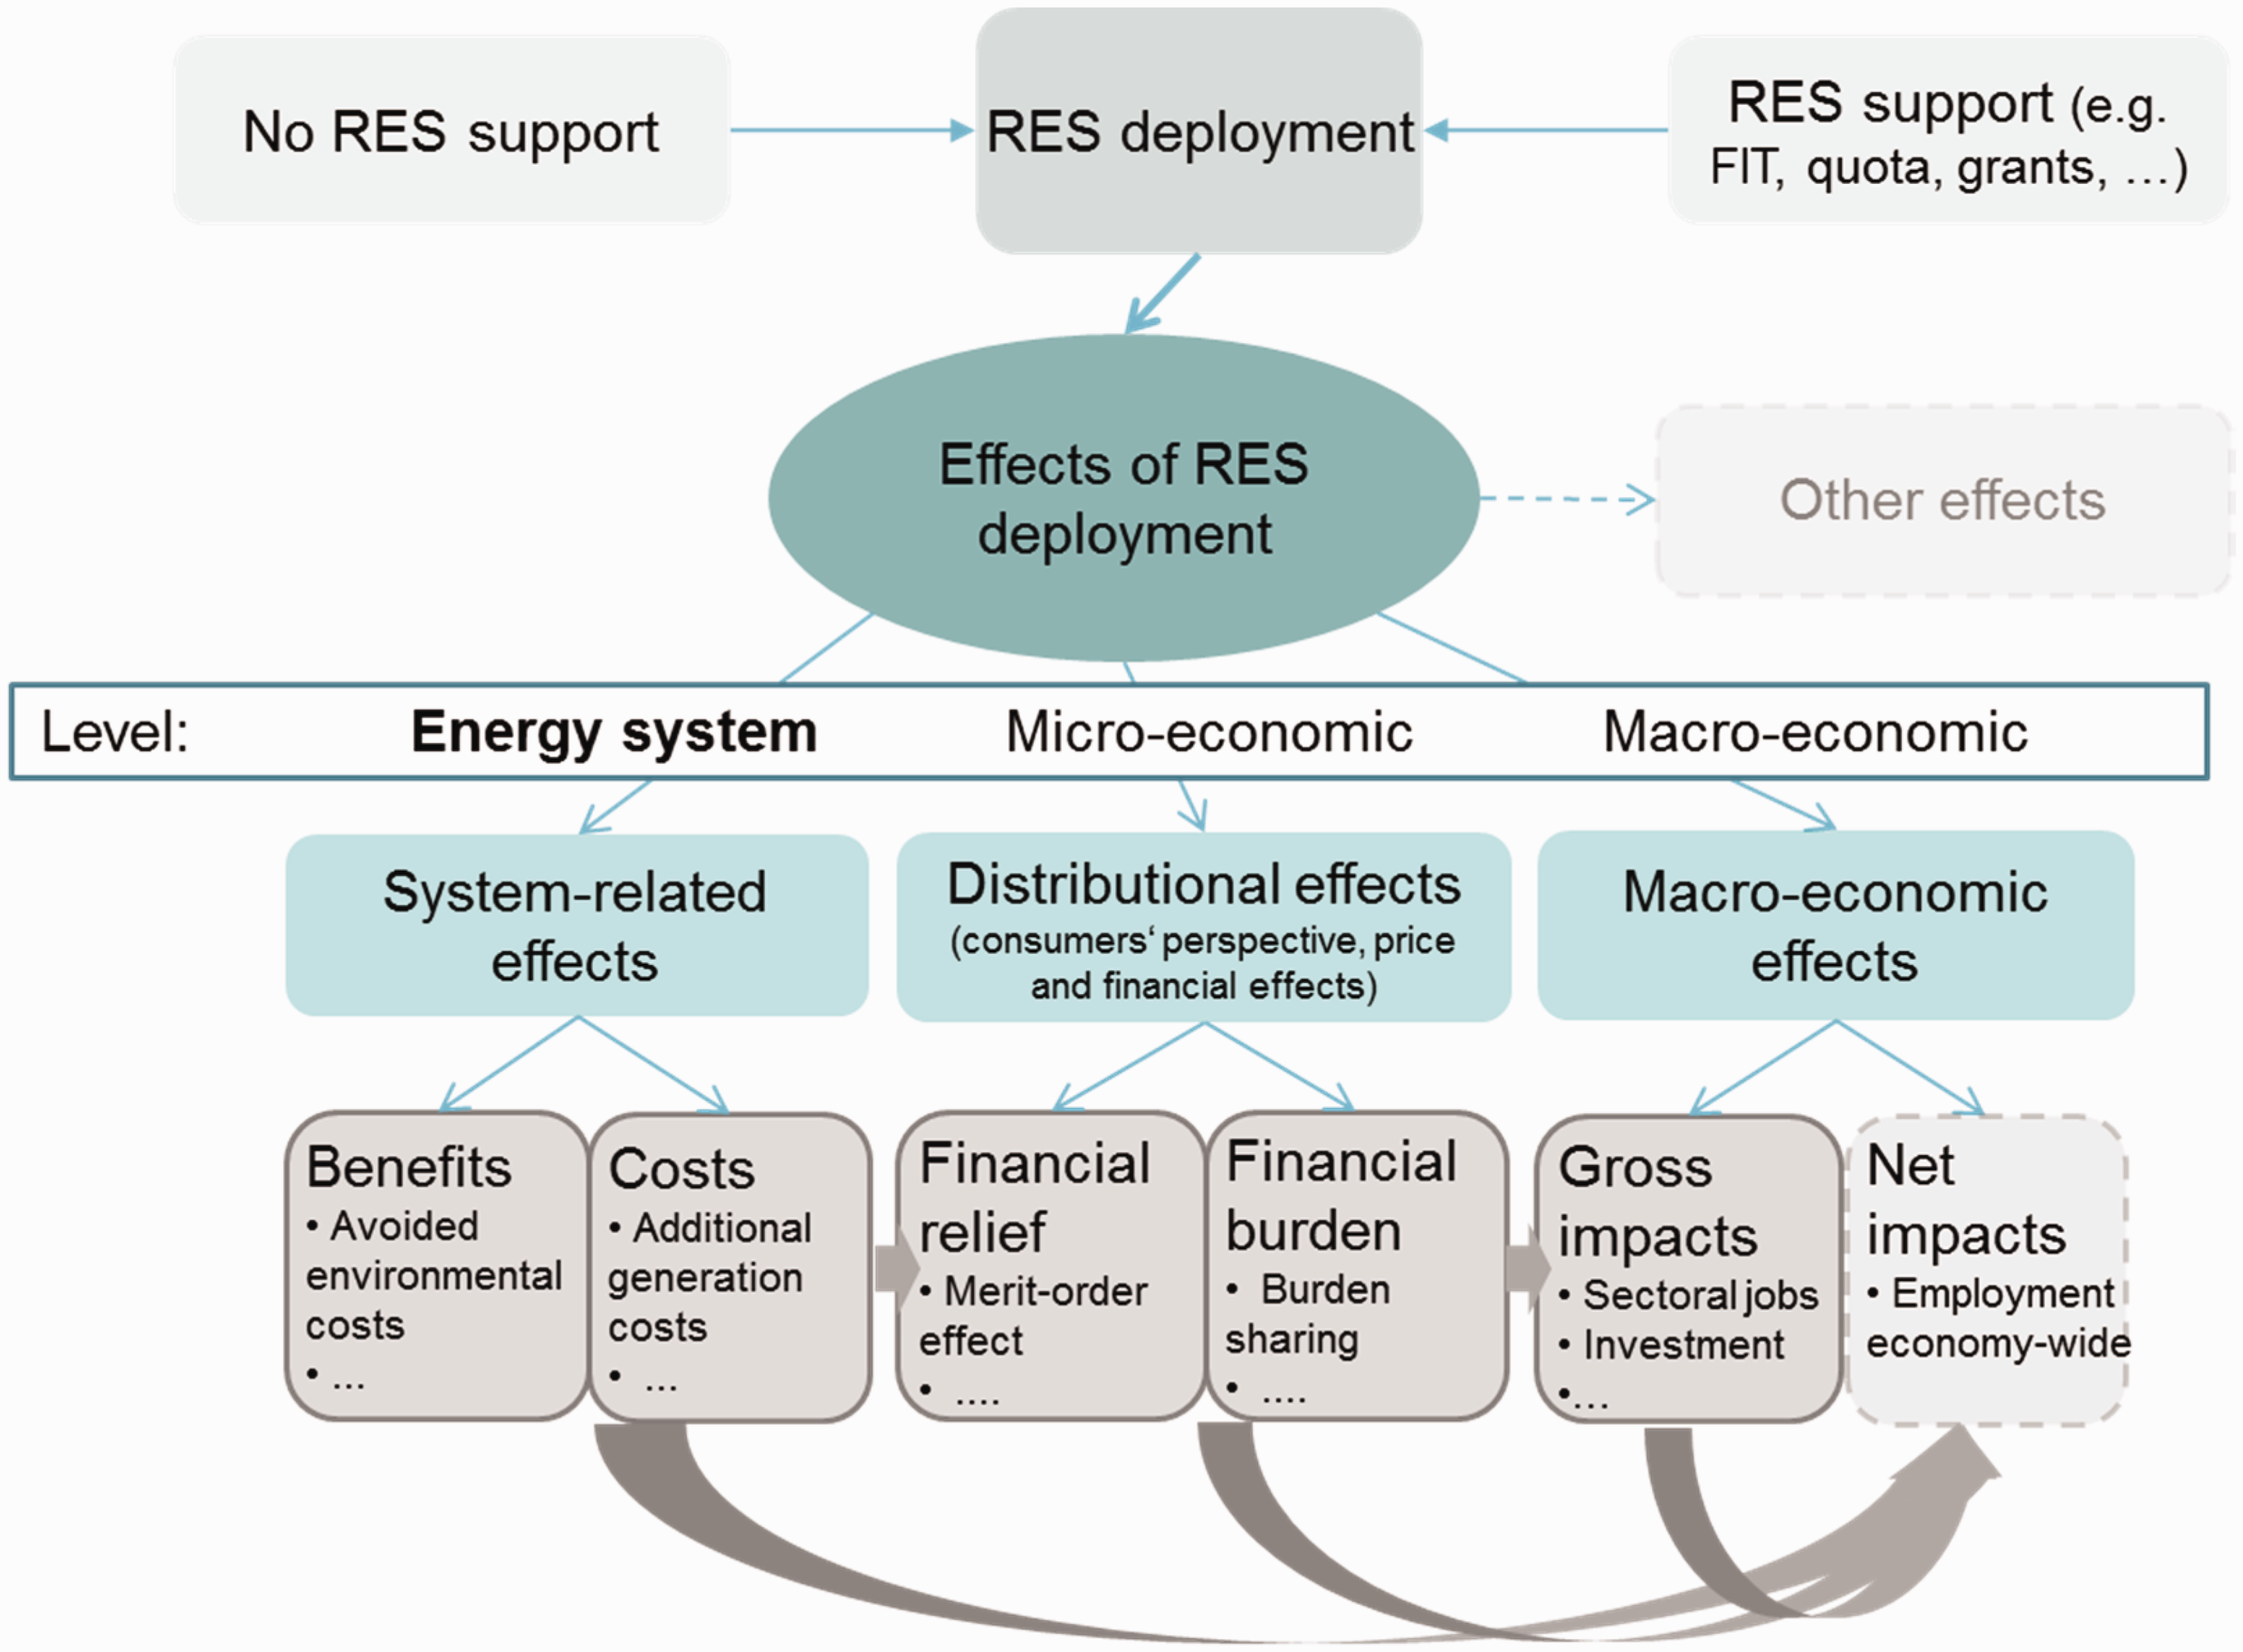
System-related effects encompass all benefits and direct and indirect costs of RES deployment. While direct costs are directly related to electricity or heat generation, indirect costs are caused by integrating RES into the existing generation system. Benefits from RE-use arise for example as a result of avoided GHG emissions and air pollutants. The main characteristics of system-related costs and benefits are that they represent additional costs or benefits of a RE-based generation system compared to a reference system based on nuclear and fossil fuels. Furthermore, system-related effects reflect the costs of input factors based on market prices (labour, capital, natural resources). Moreover, capital expenditures are taken into account in the analysis – whereas these expenditures are necessary investments such that they do not fall only into the cost or benefit category but are displayed as a third neutral category. b
Distributional effects focus on costs that accrue for selected economic agents or groups from a micro-economic perspective. They show to what extent the different economic agents have to bear the additional costs or benefits from the additional positive effects – who pays for RES deployment and who receives the resulting revenues from this deployment.
Macro-economic effects are measured at the macro-level and comprise gross and net effects in an economy. Gross effects refer to the RES sector, i.e. they show the effects in all industries that are directly related to RE. To get the real net effects (net employment, GDP) of RES deployment – net of all costs – for the overall economy (all sectors), all positive and negative effects of RES deployment should be included in the analysis.
Method of approach for the model-based prospective assessment
By use of a specialised energy system model (Green-X), a quantitative assessment was conducted to show pathways of possible RES developments up to 2030, indicating RES deployment at country, at sector and at technology level that can be expected under distinct policy concepts. Below we give an overview of the approach taken, including a brief recap of the model, of key input parameters and of the scenario definition.
The policy assessment tool: The Green-X model c
TU Wien's Green-X is a specialised energy system model focussing on renewable energy technologies, which offers:
a thorough assessment of impacts stemming from various forms of energy policy interventions, offering a detailed representation of key characteristics of different energy policy instruments as input to modelling, complemented by a detailed assessment of their impacts; and a detailed description of renewable energy technologies, characterised by their resource potentials and related technology and feedstock cost, in Europe and in the analysed neighbouring countries.
Green-X aims at indicating consequences of RES policy choices in a real-world energy policy context. The model allows for conducting in-depth analyses of future RES developments and corresponding costs, expenditures and benefits arising from the preconditioned policy choices on country, sector and technology levels on a yearly basis, in the time span up to 2050. d
Overview on key parameters
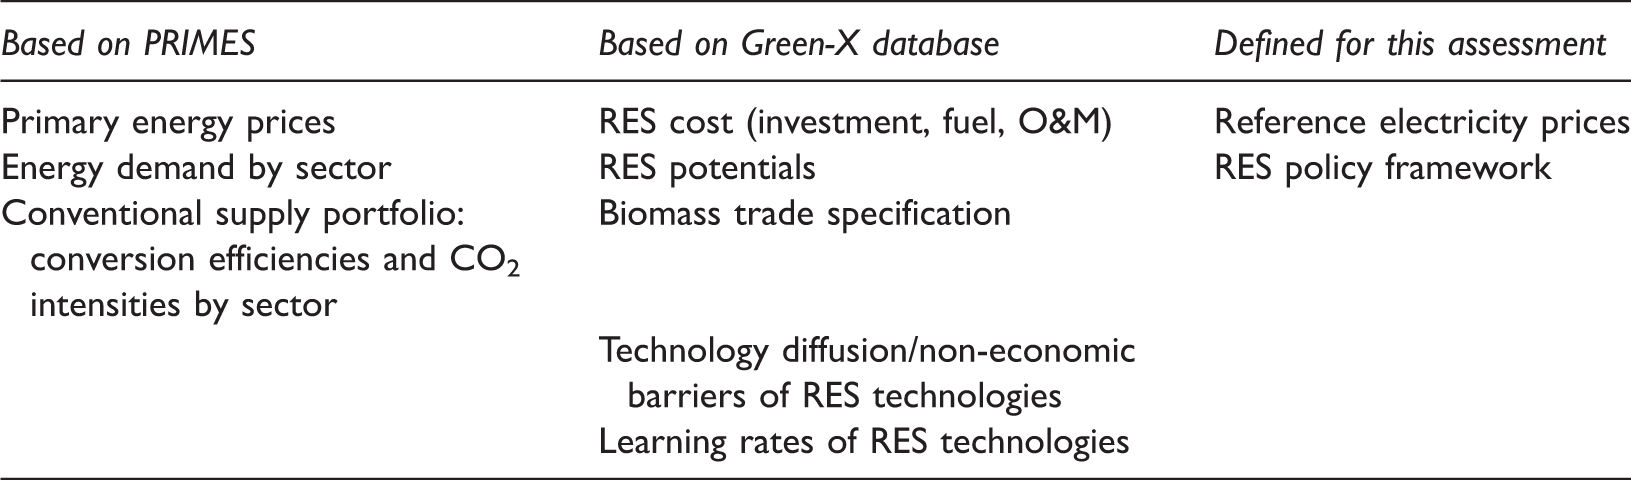
To ensure maximum consistency with existing EU scenarios and projections, various input parameters of the renewable scenarios conducted with Green-X are derived from PRIMES modelling. More precisely, the PRIMES scenario used is the PRIMES reference scenario as of 2013. 21 The main data source for RE-specific parameters is the Green-X database – this concerns e.g. information on the status quo of RES deployment, future RES potentials and related costs as well as other country-specific parameters concerning non-economic barriers that limit an accelerated uptake of RES use. Moreover, the policy framework for renewables is specifically defined for this assessment. The PRIMES reference scenario serves as basis for several other key parameters, including the expected development of international energy prices, country- and sector-specific energy demands. From PRIMES modelling, we also derive assumptions on the conventional supply portfolio, comprising fuel mix, conversion efficiencies and carbon intensities by EU country.
Main input sources for scenario parameters in the model-based assessment.
Below we exemplify the assumptions for future energy and carbon price developments, since they are relevant parameters for the economic assessment of costs and benefits of RES use. Other input parameters and details on the Green-X database on potentials and costs can be found in Resch et al. 22
Fossil fuel and carbon prices
The country- and sector-specific reference energy prices used in this analysis are based on the primary energy price assumptions applied in the latest PRIMES reference scenario that has also served as a basis for the Impact Assessment accompanying the Communication from the European Commission ‘A policy framework for climate and energy in the period from 2020 to 2030’ (COM(2014) 15 final).
23
As shown in Figure 2, generally only one price trend is considered, i.e. a default case of moderate energy prices, which reflects the price trends of the PRIMES reference case. Compared with the energy prices as observed in previous years, when, for example, the oil price had reached levels well above 80 €/boe (corresponding to 49 €/MWh), all the price assumptions appear comparatively low, even for the later years up to 2050. This perception may have changed throughout this year (2015), however, during which energy prices experienced a significant decline.
Primary energy price assumptions in €/MWh.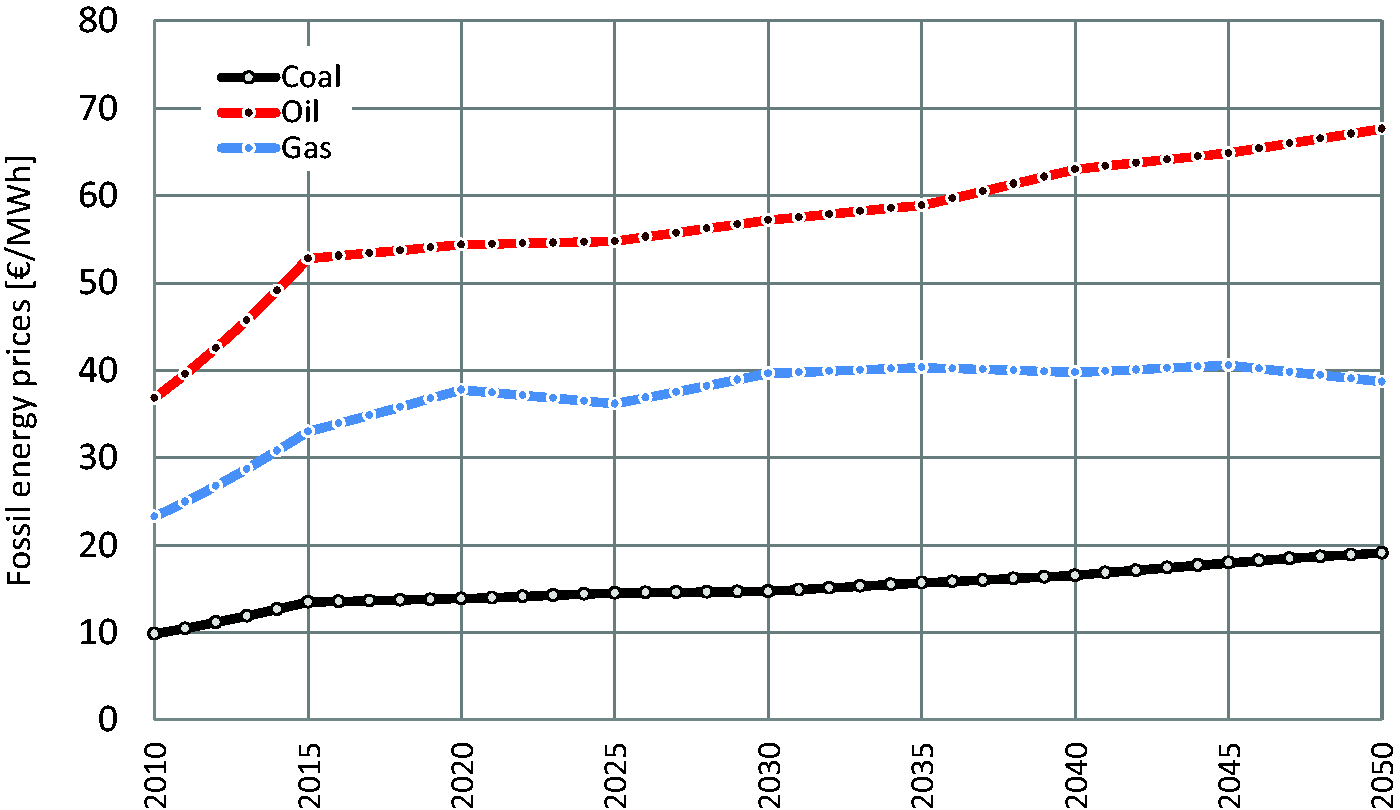
The CO2 price trends are also based on recent PRIMES modelling (see Figure 3). Actual market prices for EU allowances have fluctuated between 6 and 30 €/t since 2005 but remained at a low level, with averages around 7 €/t in the first quarter of 2012. In the model, it is assumed that CO2 prices are directly passed through to electricity prices as well as to prices for grid-connected heat supply.
CO2 price assumptions in €2010/ton.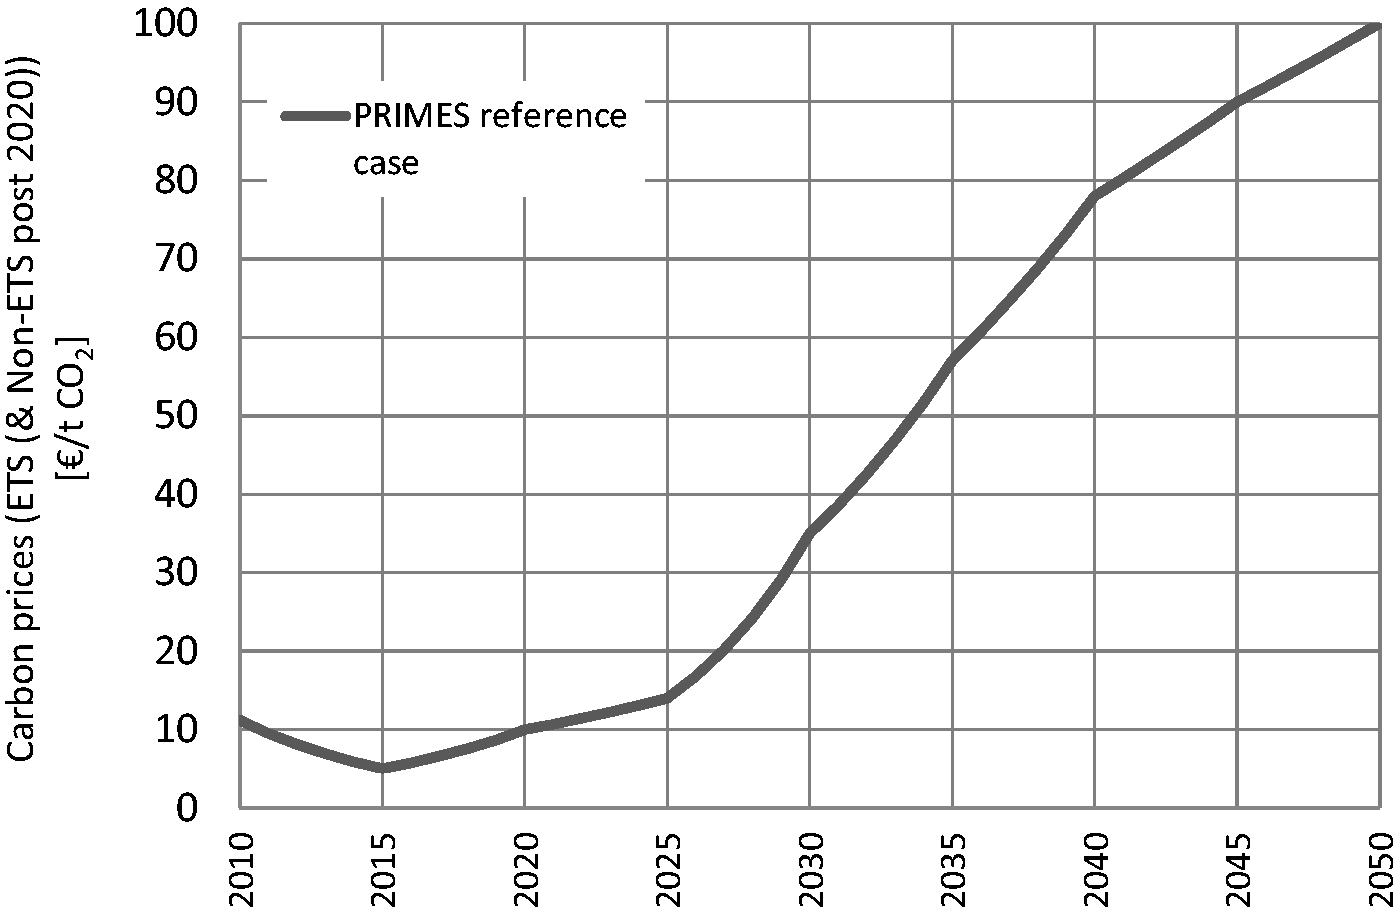
Scenario definition: Overview on assessed cases
The model-based assessment of future RES deployment has two focal points in time:
In the 2020 context, a focus is put on the cross-country assessment of costs and benefits associated with RES expansion. Thus, since the policy framework for 2020 is well defined by the RES Directive, the need for and impact of RES cooperation for achieving binding national 2020 RES targets is analysed. In the 2030 context, scenarios aim to provide a quantitative basis for discussing possible RES developments and related impacts on costs and benefits in the light of the new Council agreement on 27% RES by 2030.
While framework conditions remain identical – i.e. scenarios build on the energy demand and price projections provided by the latest PRIMES reference case
21
– the cases assessed are tailored to topical needs. Figure 4 provides a brief overview on all assessed cases and the scenario definition is introduced in further detail by distinct focal point below.
Overview on assessed cases.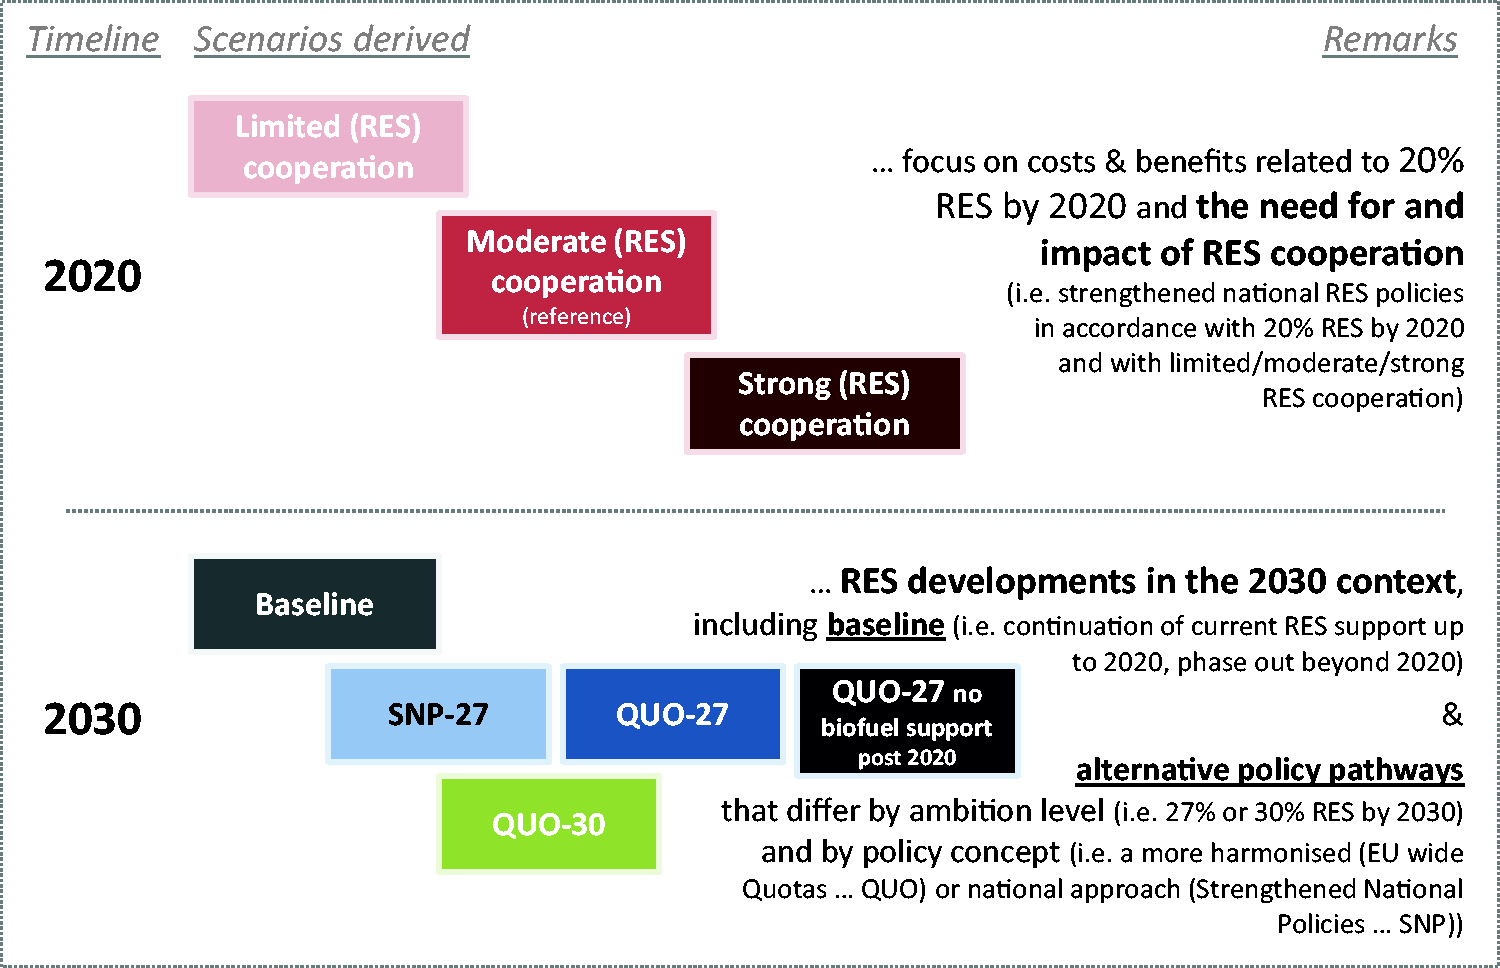
Assessment of RES cooperation in the 2020 context
Three distinct scenarios have been derived, originally aiming to identify the need for and impacts of RES cooperation. Common to all cases is the assumption of the continuation of national RES policies until 2020. More precisely, the assumption is made that these policies will be further optimised in the future with regard to their effectiveness and efficiency to meet 2020 RES targets (as set by the RES Directive 2009/28/EC) both at EU level and at the national level. Thus, all cases can be classified as ‘strengthened national (RES) policies’, considering improved financial support as well as the mitigation of non-economic barriers that hinder an enhanced RES deployment. e
To identify possible cost-saving potentials that come along with a stronger use of cooperation mechanisms, three different variants of national RES support and RES cooperation have been assessed. Thus, assessed scenarios range from ‘limited RES cooperation’ where Member States primarily aim for a pure domestic RES target fulfilment, to ‘strong RES cooperation’ where an efficient and effective RES target achievement is envisaged at EU level rather than fulfilling each national RES target purely domestically.
Outlook to 2030: RES developments under baseline conditions and according to alternative policy pathways
Different scenarios have been defined for the deployment and support of RES technologies in the EU in the 2030 context. Obviously, the RES policy pathway for the years up to 2020 appears well defined given the EU RES directive 2009/28/EC and the corresponding national 2020 RES targets and accompanying National Renewable Energy Action Plans for the period up to 2020. Exploring RES development beyond 2020, however, means entering terrain characterized by a higher level of uncertainty – both with respect to the policy pathway and with regard to the potentials and costs of applicable RES technology options. Thus, the scenarios defined for this assessment aim to provide a first reflection of the decision on the 2030 energy and climate framework taken at the Council meeting in October 2014, where Member States agreed on a binding EU target of at least 27% RES by 2030. 6 Figure 4 summarises the general settings of all scenarios assessed, indicating the policy concept and the ambition level with respect to renewable energy for 2030.
The scenarios analysed combine two different characteristics: different ambition levels for RES deployment in 2030, in particular, and different support policies for renewables from 2020 onwards. With respect to the underlying policy concepts, the following assumptions are made for the assessed alternative policy paths:
In the ‘Strengthened National Policies (SNP)’ scenario (which relates to a target of 27% RES by 2030), a continuation of the current policy framework with national RES targets (for 2030 and beyond) is assumed. Each country uses national support schemes in the electricity sector to meet its own target, complemented by RES cooperation, if necessary. The support provided is generally technology-specific, taking into account differences between the various RES technologies, in terms of market maturity and costs. In the scenarios referring to the use of a quota system (QUO-27 and QUO-30), an EU-wide harmonised support scheme is assumed for the electricity sector, such that the marginal technology to meet the EU RES-target sets the price for the overall portfolio of RES technologies in the electricity sector. The policy costs occurring in the quota system can be calculated as the certificate price multiplied by the RES generation under the quota system. Each type of consumer across the EU then pays the same (virtual) surcharge per unit of electricity consumed.
As a further sensitivity variant for the 27% RES target by 2030, we assessed the impact of having no dedicated support for biofuels post-2020. As reference for all alternative policy scenarios, a baseline case is derived, assuming that RES policies are applied as currently implemented (without any adaptation) until 2020, while for the post-2020 timeframe a gradual phase-out of RES support is presumed. Moreover, in the baseline case, it is assumed that non-economic barriers remain.
Results of the model-based prospective assessment
Costs and benefits of RES up to 2020
Focal points of the assessment were both the period up to 2020, which is shown in the following, and the upcoming decade up to 2030. For the period up to 2020, different intensities of cooperation between the Member States were analysed, all in accordance with the EU target of 20% RES by 2020 and related Member State targets set out by the RES Directive (2009/28/EC). 4
Overall, it can be stated that not all Member States will reach their 2020 target via their own domestic RES deployment alone. This means that volumes of RES would have to be exchanged (virtually) to a certain extent between Member States. While Resch et al.
22
show the detailed flows, this article solely focuses on the resulting costs and benefits for Member States. Figure 5 shows indicators on yearly average costs and benefits of new RES installations for the years 2011 to 2020. Specifically, a range is displayed for support expenditures, additional generation costs, capital expenditures and benefits resulting from avoided expenses for CO2 emission allowances. This range depicts values from different scenarios (limited, medium and strong cooperation scenarios among EU Member States) during the assessed period of time.
Indicators on yearly average expenditures or costs and benefits of new RES installations (2011–2020) at EU level for all assessed cases, expressed in absolute terms (billion €).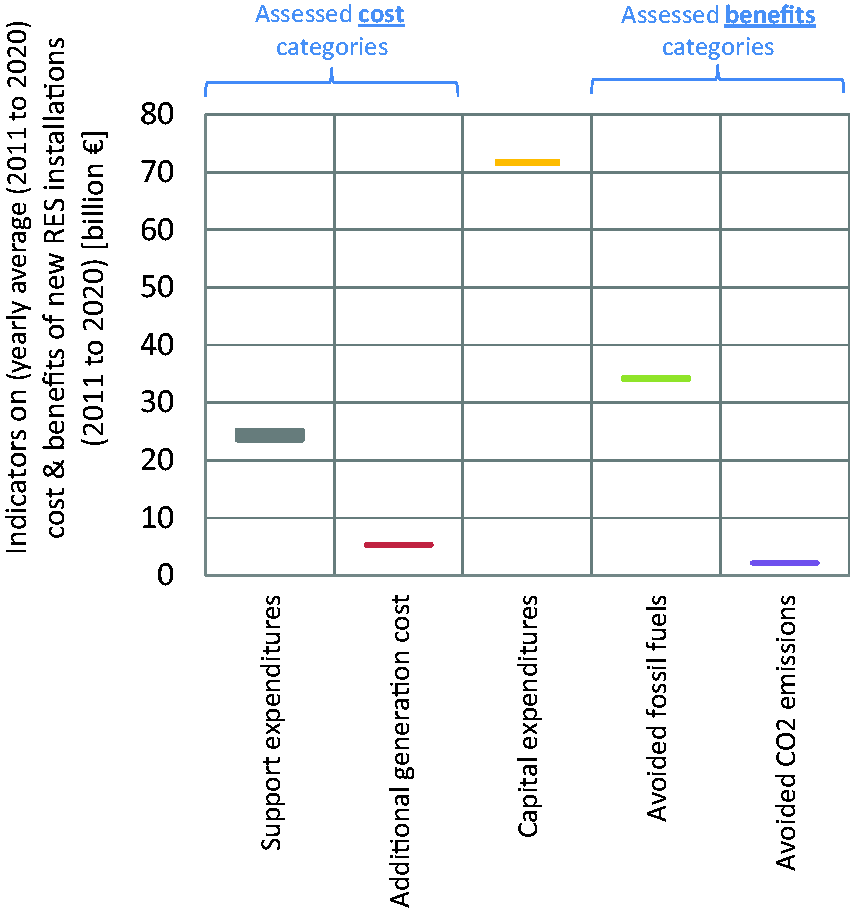
Concretely, it can be seen that the largest bandwidth occurs with support expenditures. The maximum expenditures on average for this period are €25.2 billion at EU level, whereas in the case of stronger cooperation across the EU, this value falls to €23.5 billion. The other categories do not exhibit such substantial variance. Specifically, additional generation costs are roughly at €3.8 billion per year, whereas capital expenditures are significantly higher at between €71 and 72 billion. f
Benefits in terms of avoided fossil fuels are in the range of €34 billion annually. The monetary expression of CO2 emission avoidance, or more precisely avoided expenses for CO2 emission allowances, can be quantified to around €2.2 billion per year. g In the following subsection, these cost–benefit categories are displayed at Member State level to give an overview of the distributional effects.
Insights into different cost–benefit categories at Member State level
To put the effects outlined subsequently into perspective, Figure 6 depicts the respective Member States' GDP per capita. This way, absolute effects such as those shown in Figure 5 for the EU28 level can also be expressed in terms of relative values at country level (cf. Figure 10).
Range of average yearly values of benefits for new RES installations (2011–2020). GDP per capita (1000 €/capita) (on average (2011–2020)) of the 28 EU Member States.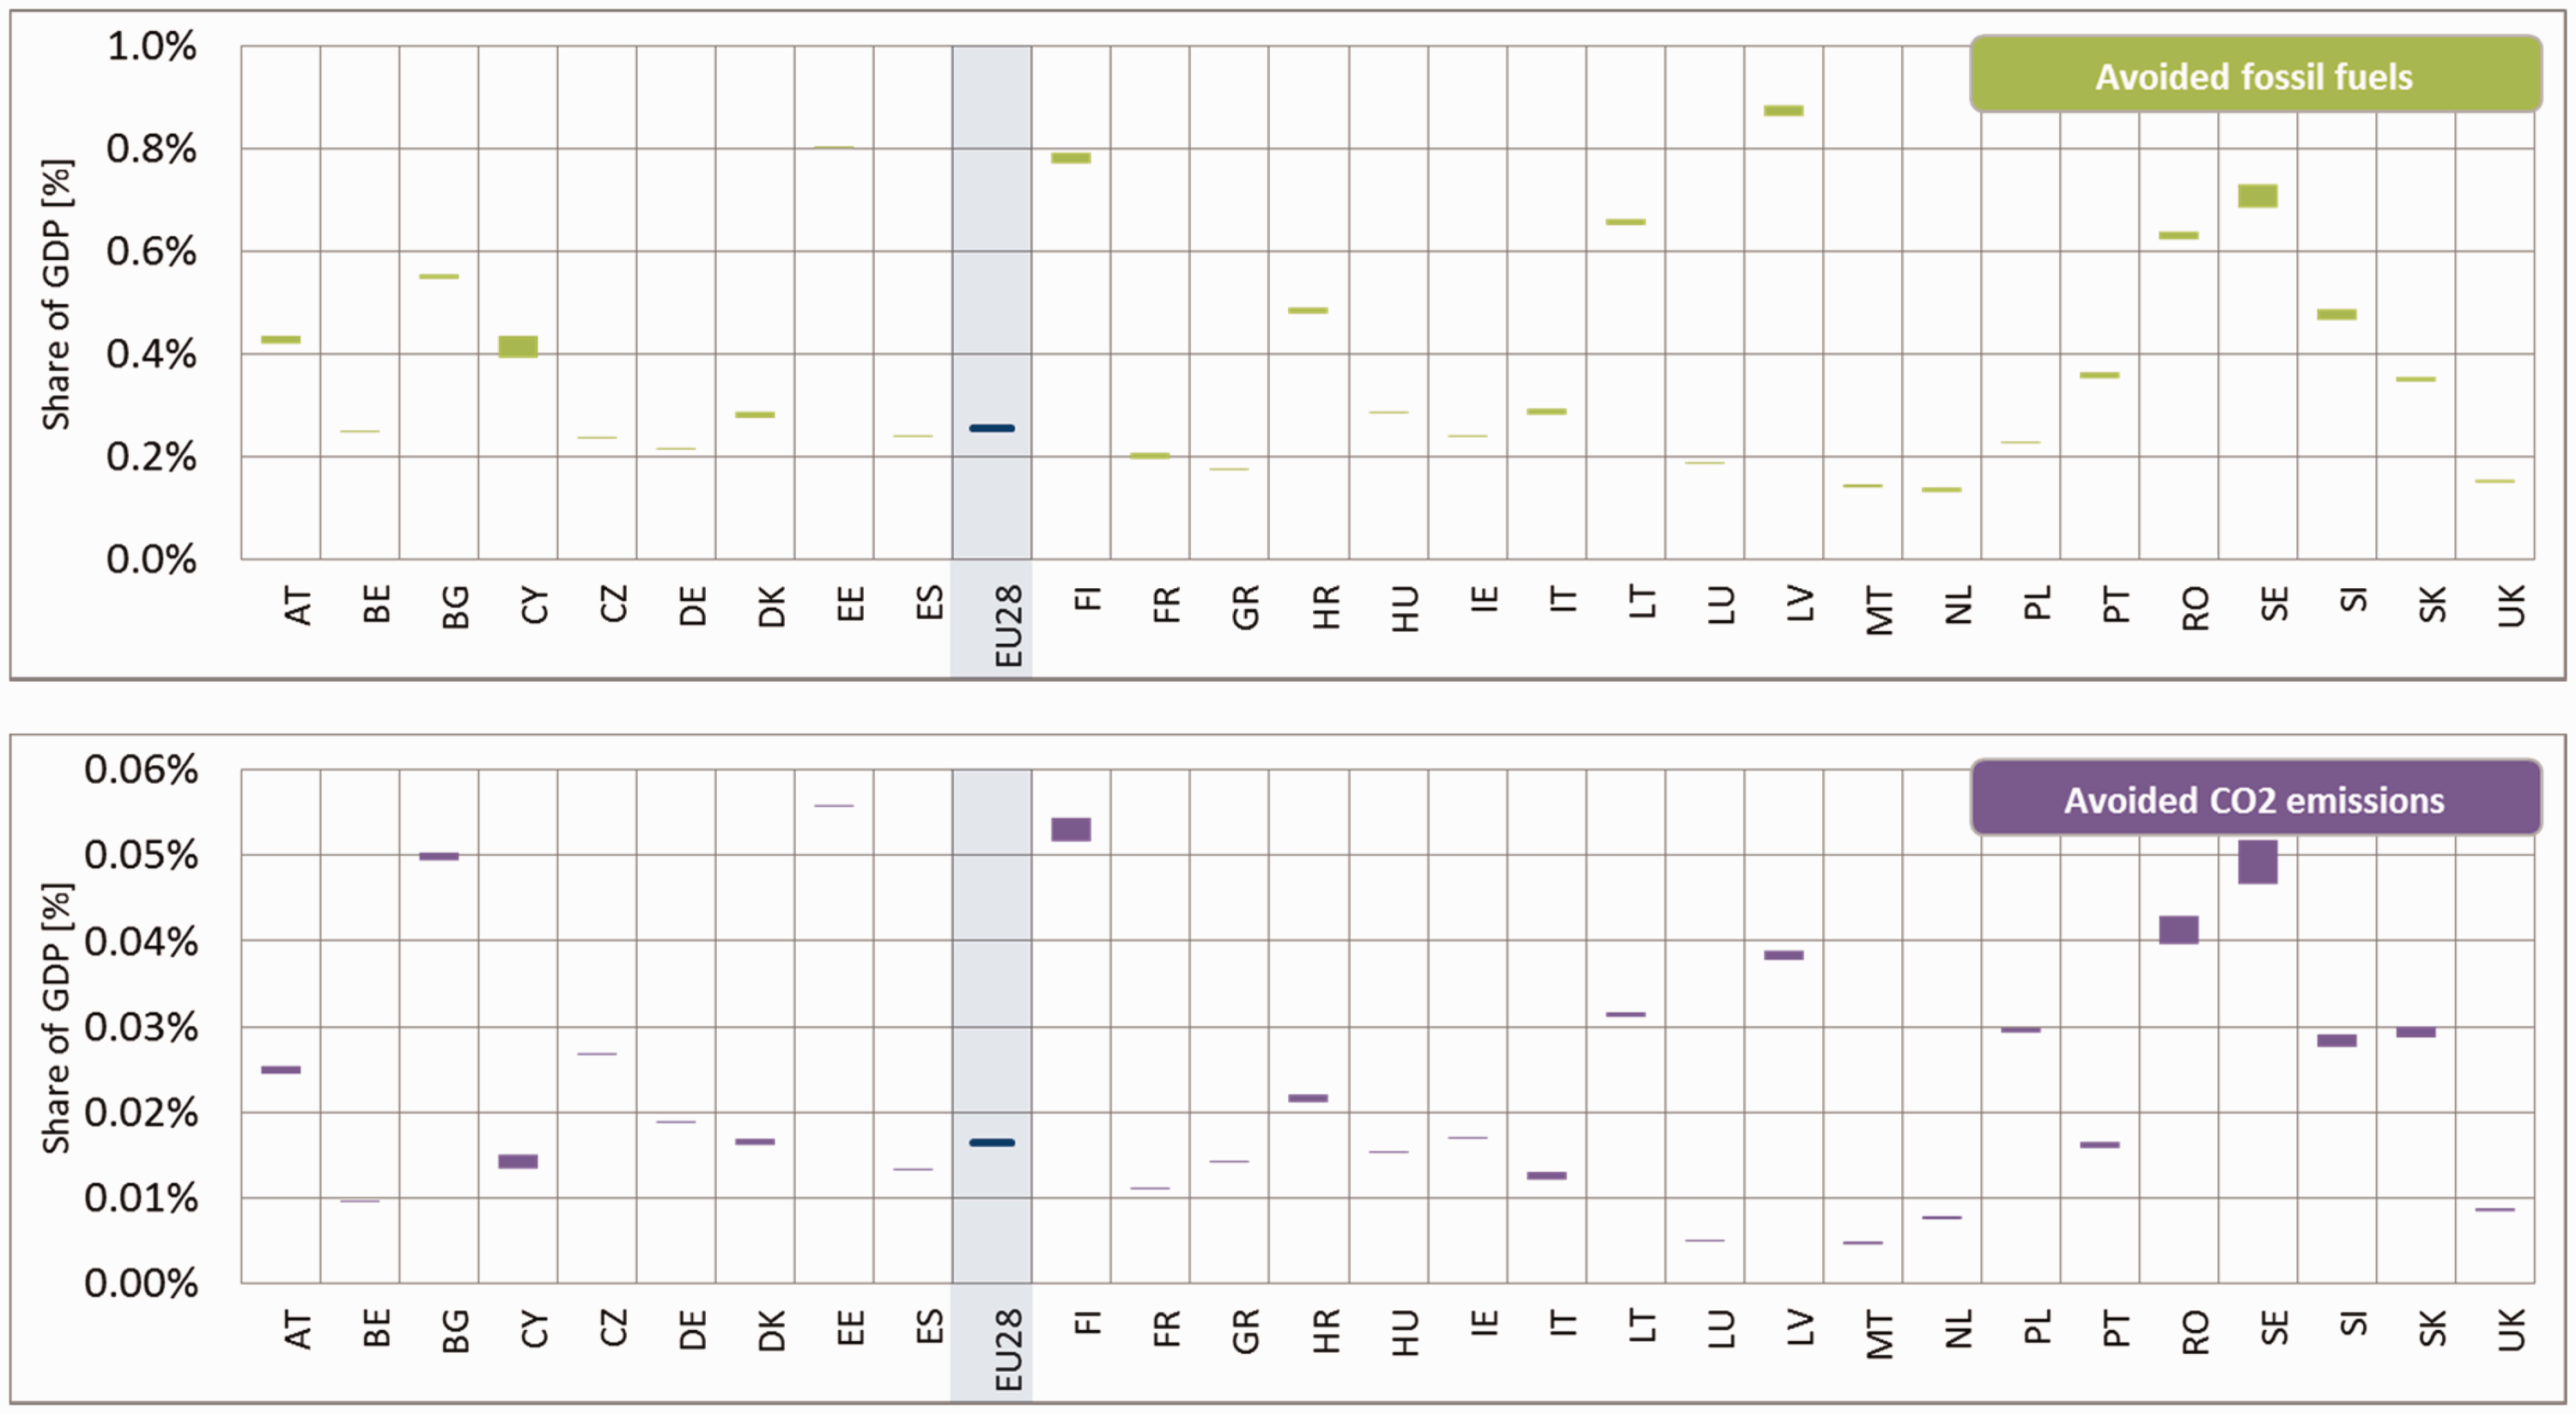
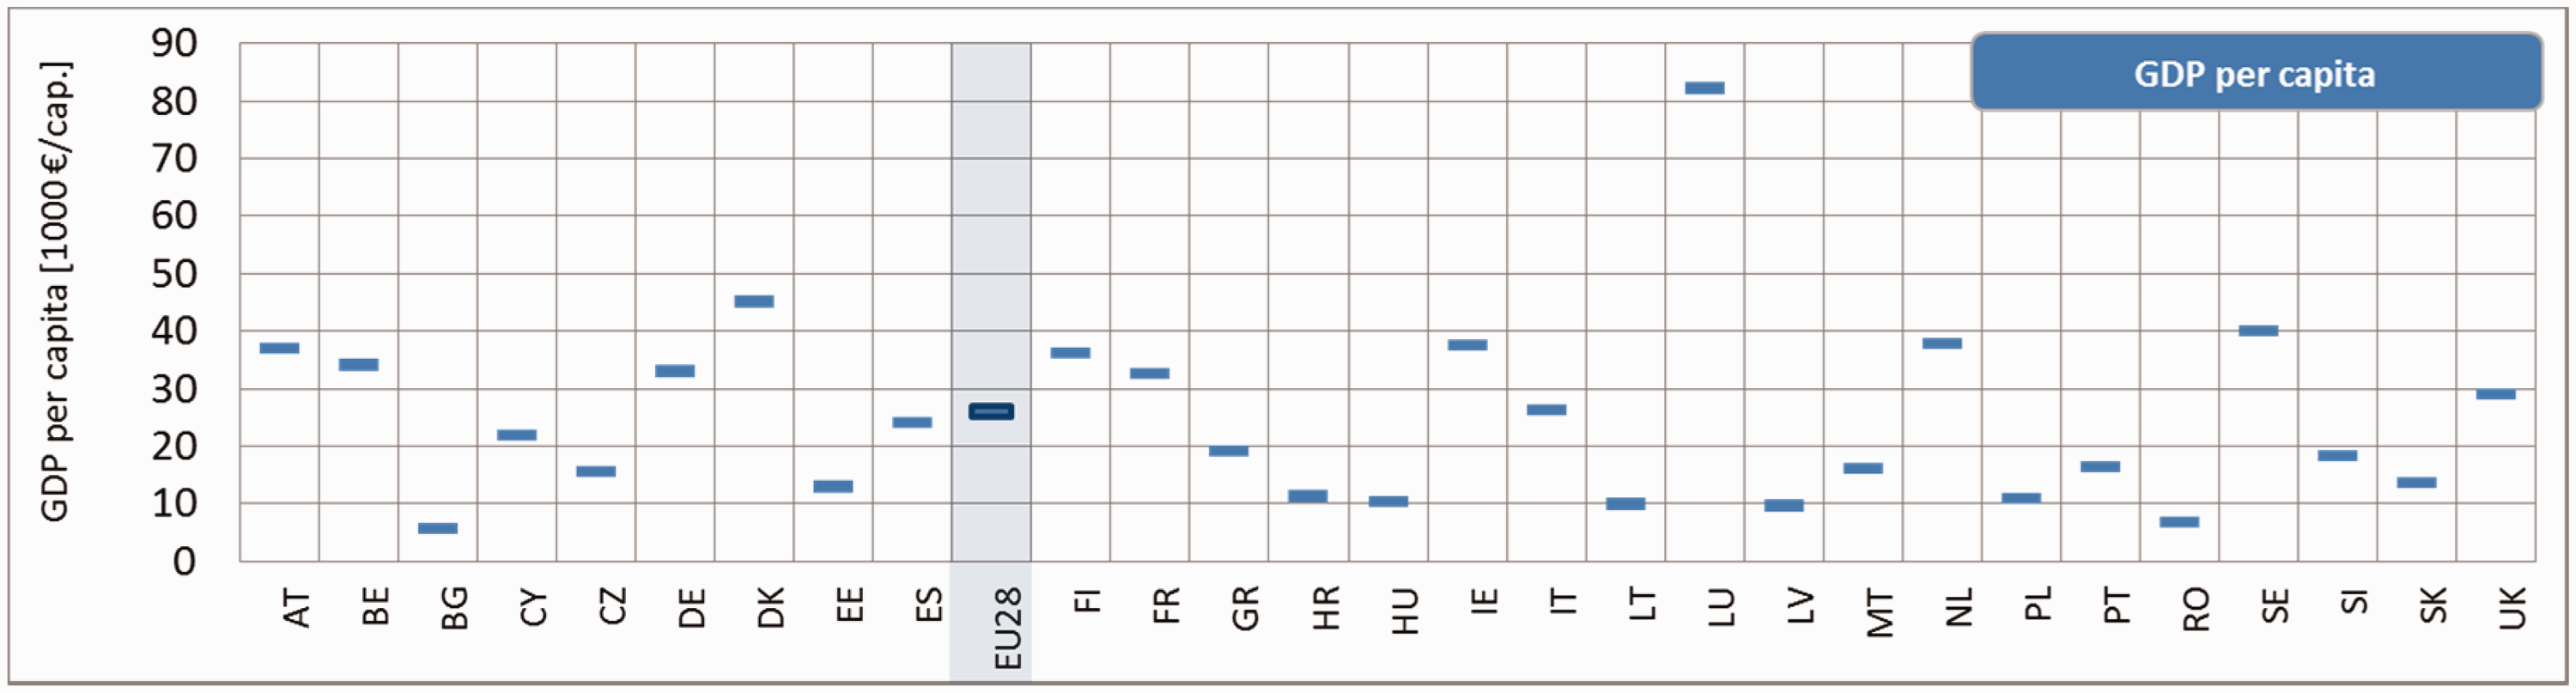
Figure 7 shows how the 2020 generation that stems from new RES installations of this decade (i.e. 2011–2020) is to be valued at Member State level, for comparative reasons expressed as RE share in the respective Member State's gross final energy demand.
h
Note that all subsequent indicators refer to this expansion.
Deployment by 2020 of new RES (installed in the period of 2011–2020).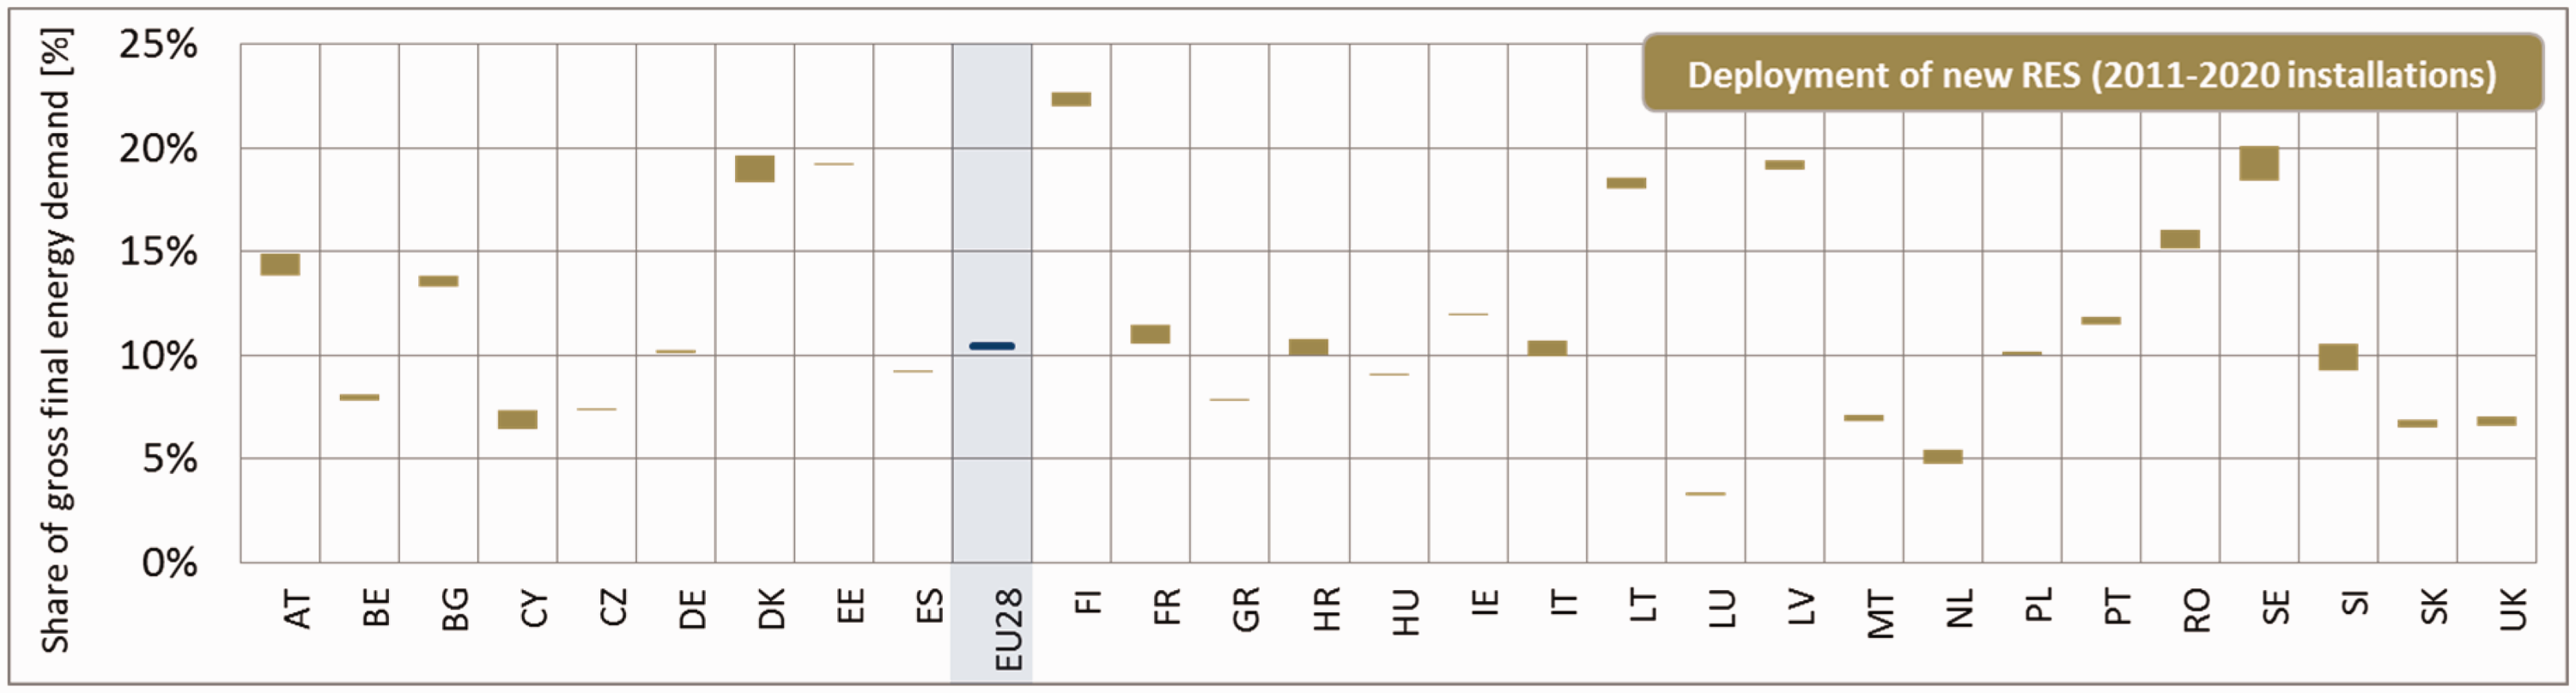
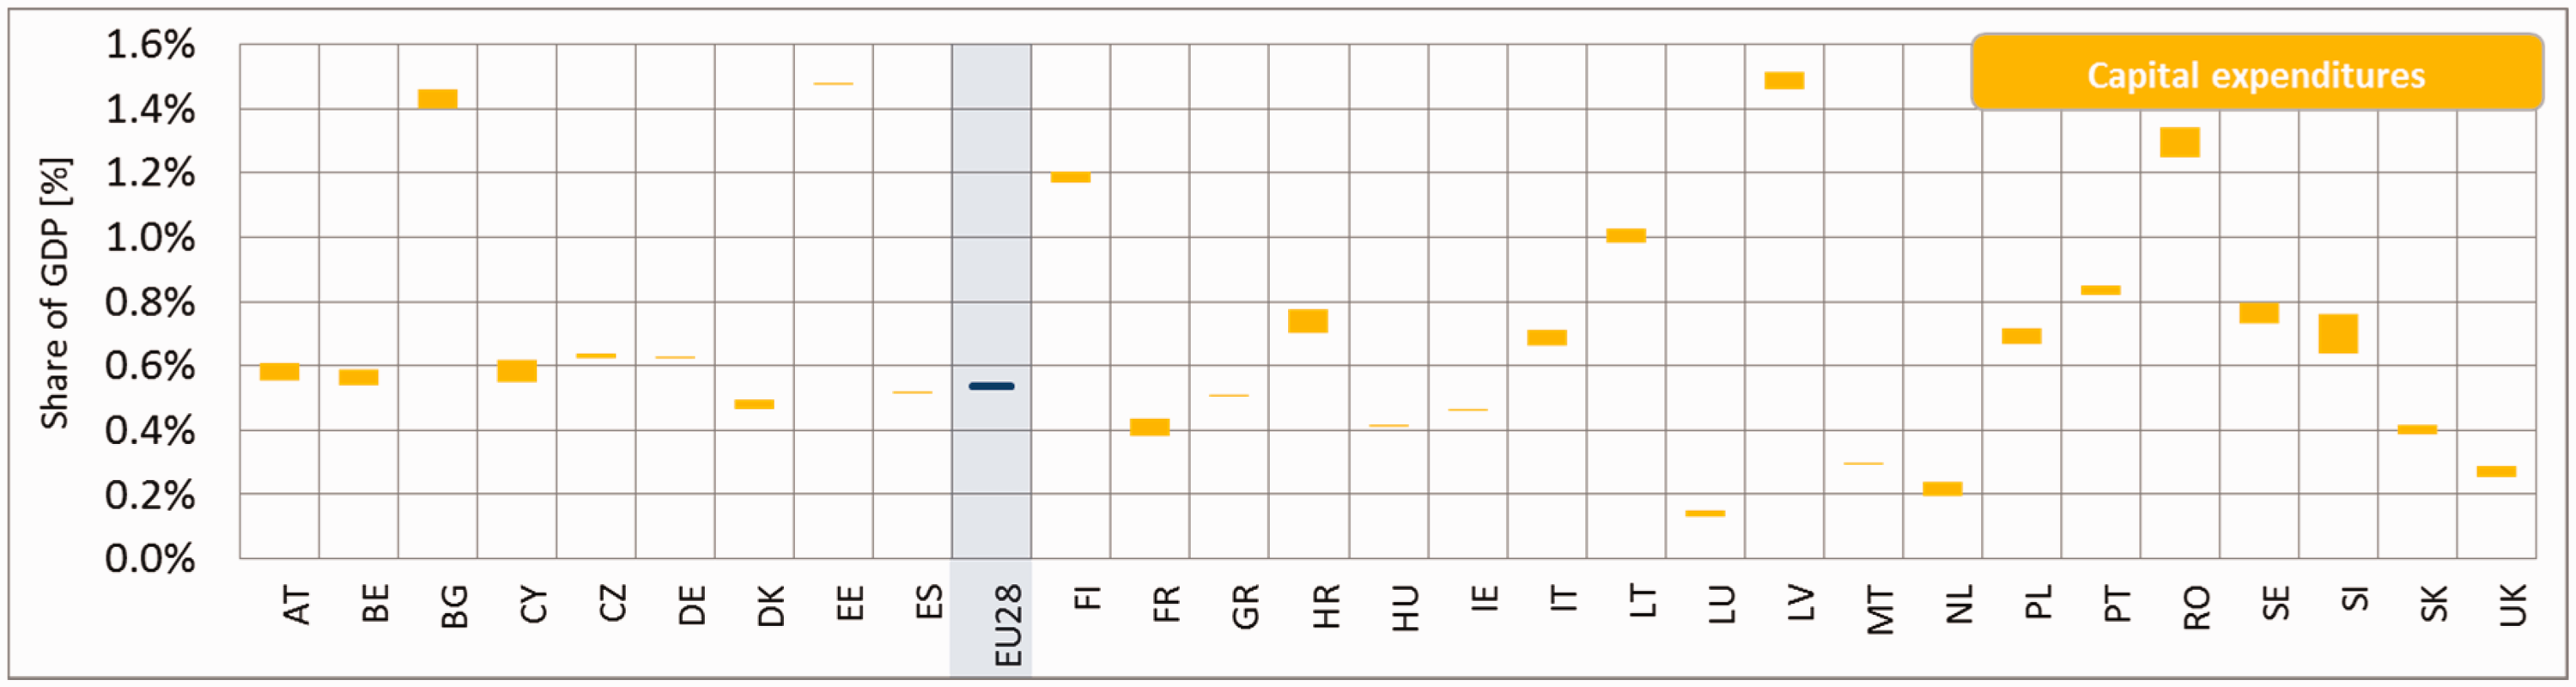
Figures 8 to 10 show how costs, namely support expenditures and additional generation costs as well as benefits from avoided fossil fuels and CO2 emissions are distributed over the Member States. The distribution of capital expenditures is also shown in a similar fashion. Capex are counted as a neutral category, being neither costs nor benefits, as they do imply expenditures but also induce macro-economic added value. To better visualise the importance of the amount for the respective Member State, the values are displayed as shares of the states' GDP. Again a range is shown over the different cooperation scenarios analysed.
Range of average yearly values of costs for new RES installations (2011–2020). Range of average yearly values of capital expenditures for new RES installations (2011–2020).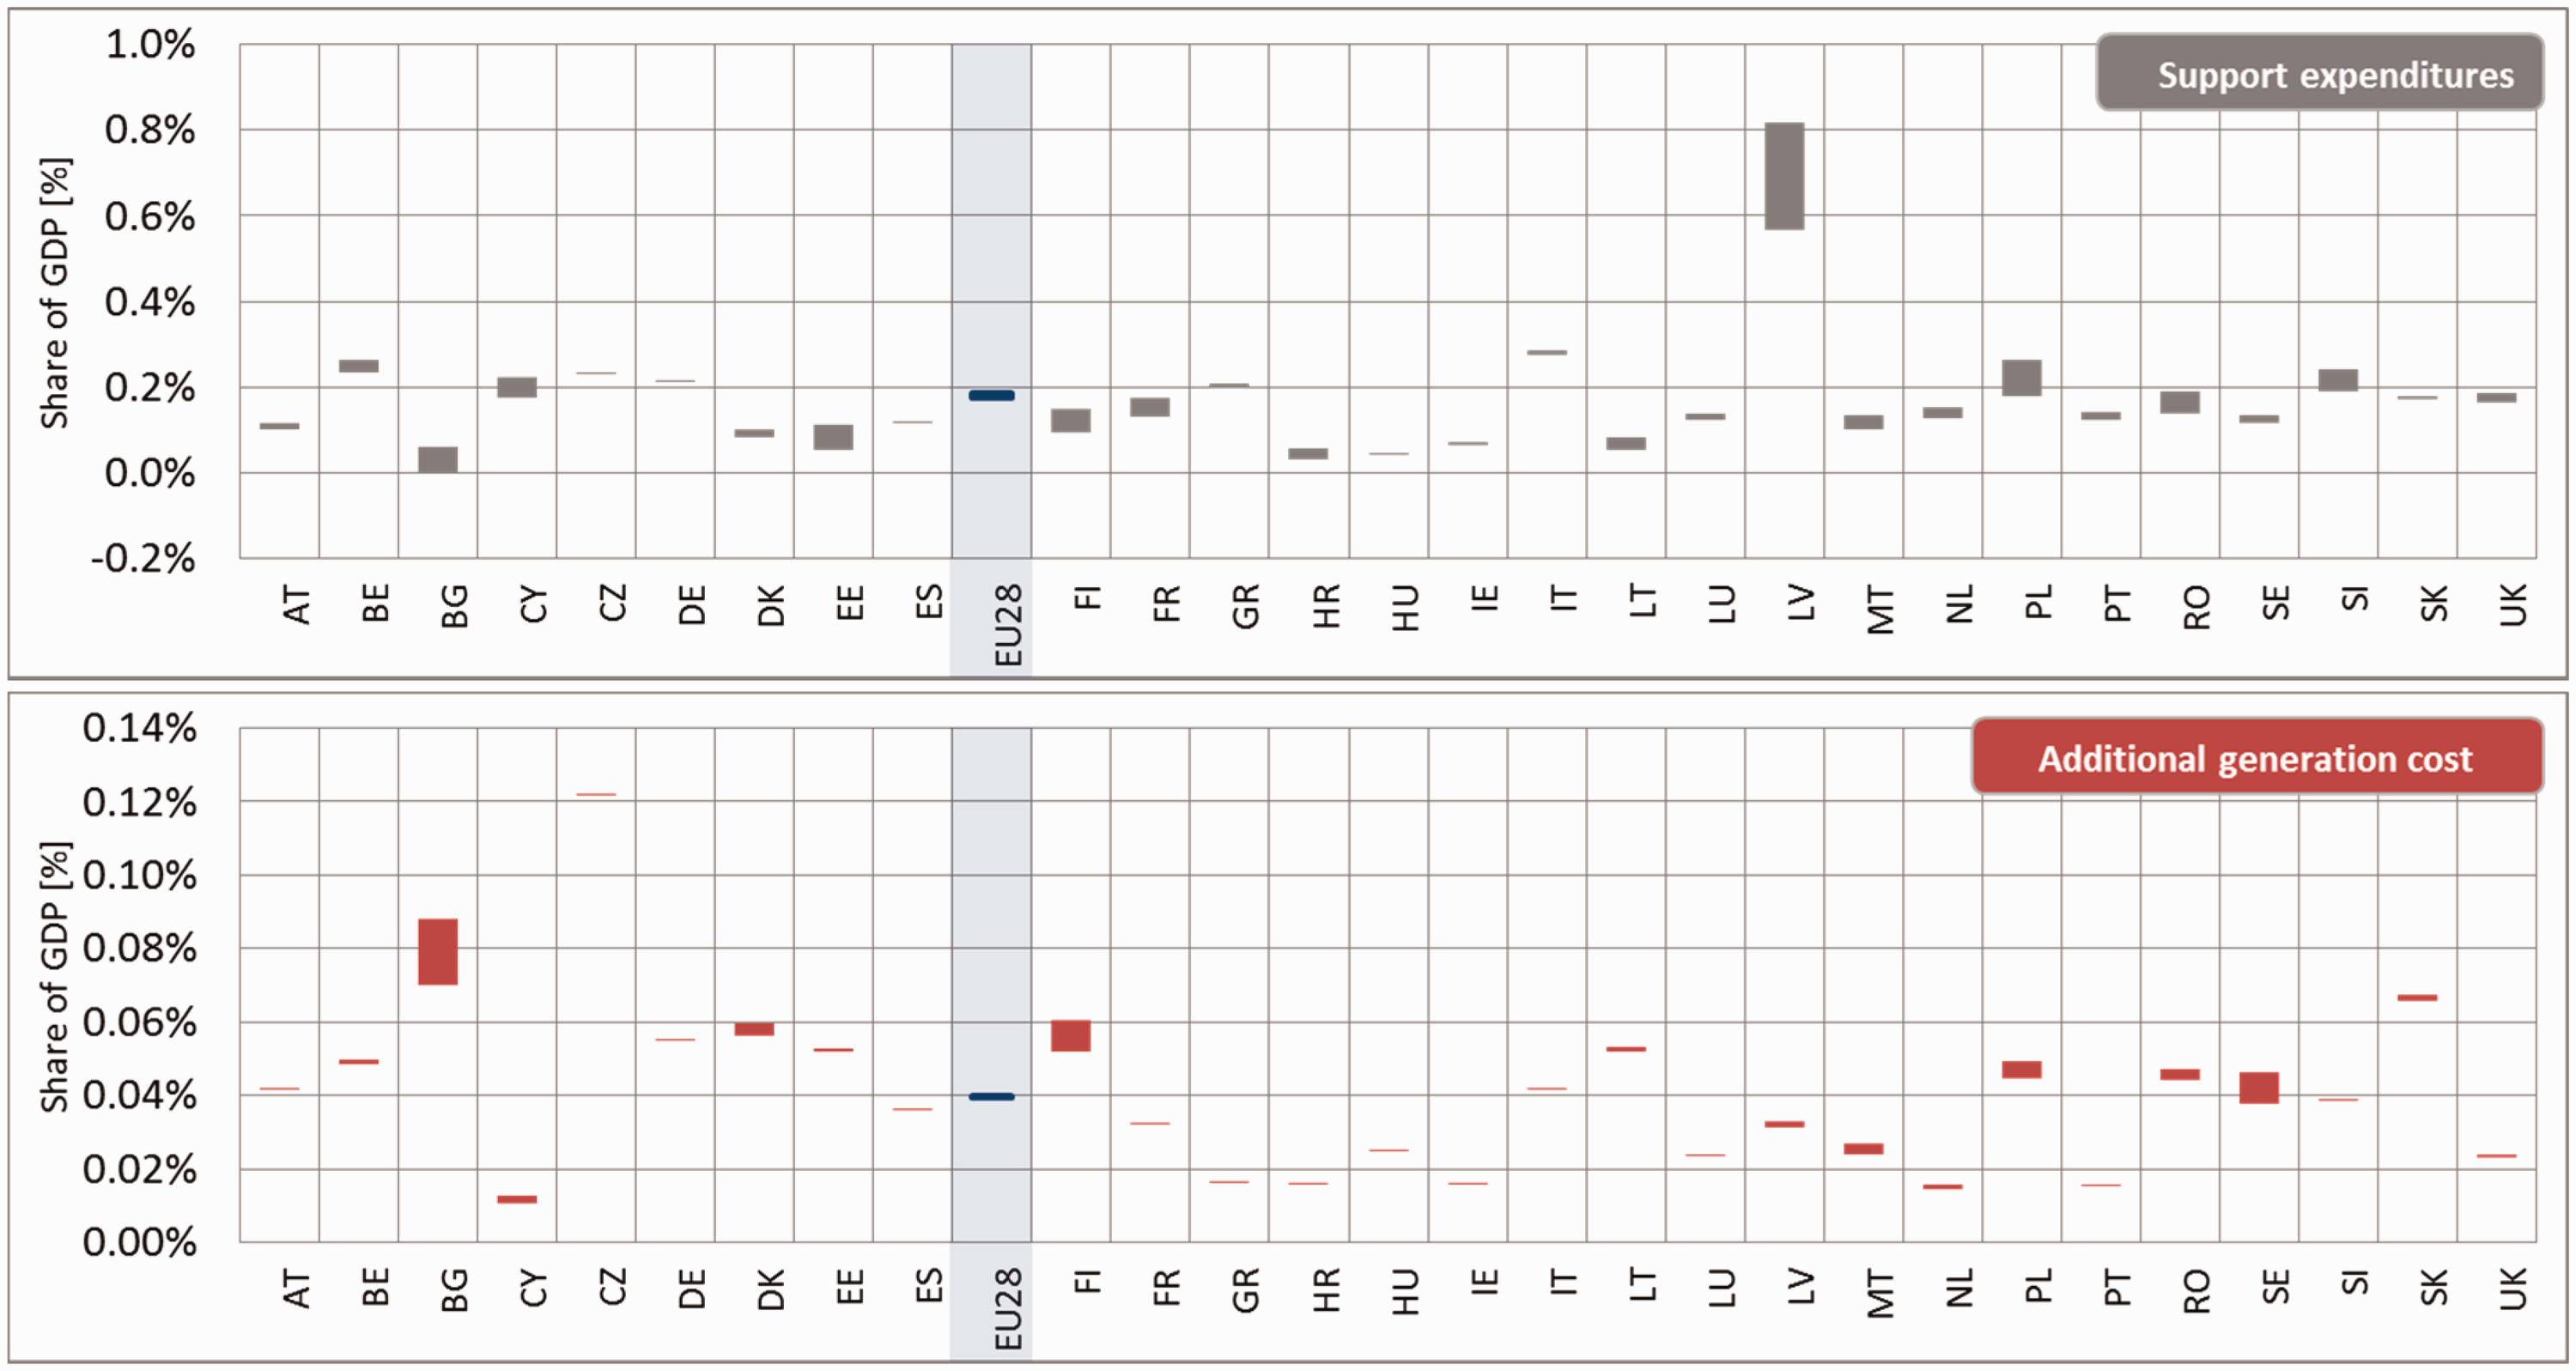
Looking into support expenditures, one can see that spreads as well as shares vary over the different Member States. The highest share and at the same time biggest variation can be seen in Latvia, where between roughly 0.6 and 0.8% of the GDP would be needed in terms of support expenditures to achieve the 2020 goals. As can be seen in Figure 6, this is largely due to the fact that the Latvian GDP per capita is comparatively low whereas the required deployment of new RES is comparatively large (cf. Figure 7). More generally, especially the lower income Member States partly face comparatively high expenditures. Most of the other Member States range in the area of 0.1 to 0.2% of their GDP in this cost category. These values can be quite diverging when looking at the respective absolute values of GDP. While, e.g. Cyprus and Sweden exhibit the same relative share in support costs, Sweden's GDP per capita is nearly double that of Cyprus. This benchmark has to be kept in mind when interpreting all relative values depicted in the following. The EU average lies close to 0.2% of GDP.
Additional generation costs have a more diverse distribution in the share of GDP of the Member States. Whereas the share is comparatively small in all countries, the Czech Republic exhibits the highest share in the given range, with around 0.12%. It is followed by Slovakia, Finland and Denmark which all have shares of around 0.06% of their GDP. Countries with very low shares (below 0.02%) include, e.g. Cyprus, Greece and the Netherlands. The EU average lies at 0.04%.
The next category, capital expenditures taken on by the respective Member States, shows even more variation over the different states and at a much higher level – up to almost 1.6% of GDP for some states such as Latvia and Bulgaria. Outliers with quite low shares of their GDP (around 0.2%) in terms of capex are the United Kingdom, the Netherlands and Luxembourg. The average value over all 28 EU Member States lies around 0.54% of GDP. The shares for Austria, Belgium, Cyprus, Germany, Greece and Spain, among others, are close to this EU average value.
Looking into benefits from new RES installations, avoided fossil fuels is the first category that has been assessed. Member States that benefit the most in relative terms are Finland, Sweden and Latvia, saving around 0.8, 0.7 and 0.9% of their GDP. Countries that exhibit lower savings are the United Kingdom, the Netherlands and Malta, all three below 0.2% of GDP. The EU average lies at 0.26% of GDP.
Finally, savings can be quantified for the avoided CO2 emissions in the different scenarios assessed. Again variation is quite large in the EU, whereas the share of GDP is significantly smaller than that for avoided fossil fuels. Countries benefitting the most are Estonia, Sweden, Finland and Bulgaria – i.e. savings are for these countries equal to or higher than 0.05% of their respective GDP. The EU average lies at 0.017% of the GDP in this case. An important point concerning savings in fossil fuels and avoided CO2 emissions is that countries substituting more of their conventional power plants benefit relatively more in these categories.
A trend among Member States shows that Eastern European and Baltic states generally face higher support expenditures but also benefit more in terms of avoided fossil fuels and CO2 emissions. Countries that are already well on track with their target achievement do not exhibit high GDP shares for either costs or benefits.
Outlook to 2030
This section illustrates the outcomes of the model-based assessment of future RES deployment up to 2030 within the EU and regarding the Member States according to different RES policy pathways. More precisely, the outcomes of Green-X modelling related to capital, O&M and fuel expenditures of RES as well as to additional generation costs, support expenditures and savings related to fossil fuel (imports) are presented in this section. The results are complemented by a short qualitative discussion based on key indicators.
Figure 11 summarises the assessed costs, expenditures and benefits arising from future RES deployment in the focal period 2021 to 2030. More precisely, these graphs show the additional investment needs, O&M and (biomass) fuel expenditures and the resulting costs – i.e. additional generation cost, and support expenditures for the selected cases (all on average per year throughout the assessed period). All values are deviations from the baseline scenario, i.e. discontinuing support policies for RES after 2020 (meaning that a gradual phase-out in accordance with PRIMES reference scenario is presumed), which would lead to a Europe-wide RES share of 21.1% in 2030 according to Green-X modelling results. Moreover, they indicate the accompanying benefits in terms of supply security (avoided fossil fuels expressed in monetary terms – with impact on a country's trade balance) and climate protection (avoided CO2 emissions – expressed in monetary terms as avoided expenses for emission allowances).
Indicators on yearly average cost, expenditures and benefits of RES at EU 28 level in the decade 2021 to 2030, for all assessed cases, expressed in absolute monetary terms (billion €).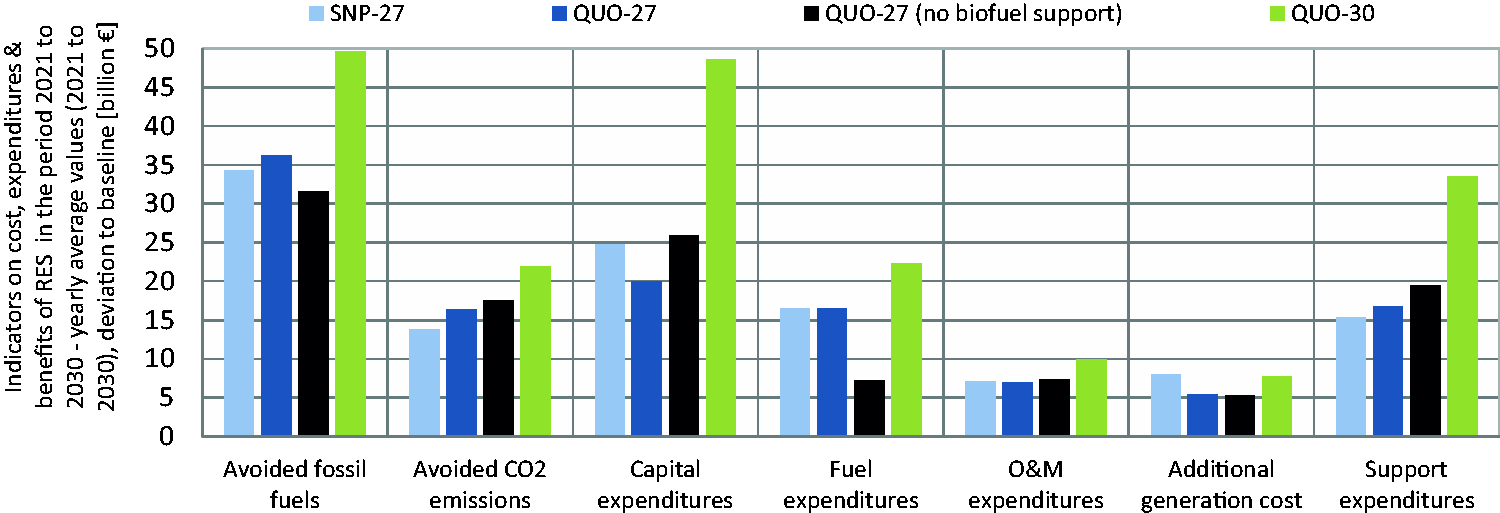
Some key observations can be made from Figure 11:
Not so surprisingly, scenarios that reach a 27% target lead to overall costs in a comparable order of magnitude. It can also be observed that a 27% quota generally leads to lower capital expenditures as well as lower additional generation costs compared with the case of national policies. However, these savings can hardly be passed on to consumers due to the ‘one size fits all’ approach inherent to all technology neutral policy instruments.
i
Moving from a 27% to a 30% target comes at a cost; in this case, average additional generation costs increase by about 50% to about 7.5 billion €per year to ‘achieve’ the last three percentage points of RES deployment. These extra costs, however, are also mirrored by increasing benefits. In all scenarios, average yearly capital expenditures are surpassed by the monetary value of avoided fossil fuels. Thus, fuel cost savings of conventional plants alone are sufficient to finance the support expenditures necessary for new RES installations. System-related benefits in terms of avoided fossil fuels and avoided CO2 emissions have a stronger effect in those states that substitute more of their fossil generation, so depending on where new RES installations are deployed, CO2 emission avoidance will develop differently. Furthermore, when interpreting the numbers, it has to be kept in mind that all scenarios assume a reference trend with respect to energy demand development. Clearly, efficiency improvements could make a 30% target more easily achievable.
Conclusions
As shown in the introductory section of this article, it is a challenging task to appropriately assess costs and benefits resulting from an increased use of renewables, to efficiently support energy policy strategies. 24 The analysis performed with the Green-X model served to better understand especially the system-related dimension and leads to the following conclusions:
Costs and benefits of RES deployment in the 2020 context
The European Commission guidance for the design of renewables support schemes highlights maximising the benefits from intra-European trade in renewable energy through cooperation mechanisms as a key measure to ensure that Europe's energy market can function efficiently. The quantitative results derived show that costs and benefits of fulfilling RES targets are rather unevenly distributed among EU Member States. Therefore, stronger cooperation between countries will be of mutual benefit.
Considerable variation among Member States can be observed in the different cost and benefit categories. Concretely, system-related benefits in terms of avoided fossil fuels and avoided CO2 emissions are visible in all Member States, but have a larger effect for those countries who substitute more of their fossil generation, not least for (virtually or physically) exporting RES under an increased RES cooperation scenario. Support costs, which fall under the term of distributional effects, vary across the different Member States and assessed scenarios. This variation is however in comparison with other cost or benefit categories small, and on EU average support expenditures amount to a share of 0.2% of GDP. Capital expenditures are quite high overall and make up a substantial share of GDP for some Member States, whereas the rise in generation costs is relatively small at an average of 0.04% of EU-wide GDP.
Prospects for RES beyond 2020
The binding EU-wide RES target of achieving at least 27% as RES share in gross final energy demand, adopted recently by the Council, has to be seen as an important first step in defining the framework for RES post-2020. Other steps, like a clear concept for and an agreement on the effort sharing across Member States have to follow.
The agreed target of 27% RES appears feasible to achieve but not without a financial burden for the EU and at country level. Alternative policy scenarios related to 27% RES by 2030 lead to moderate increases in system costs and support expenditures at EU-28 level, compared with baseline conditions (where a phase-out of RES support beyond 2020 is presumed). At the same time, generation costs do not increase substantially with a high ambition target for RES deployment.
With a higher ambition for the target set at EU level, system-related benefits would in turn increase, i.e. significantly more fossil fuels and CO2 emissions would be avoided. In addition, the increase in renewables would come along with increased benefits related to Europe's trade balance, due to significantly decreased demand for fossil fuels and their imports from abroad.
A clear and guiding framework and the removal of currently prevailing non-economic barriers is a key necessity to keep the cost burden low and to balance costs with accompanying benefits. More than 27% RES by 2030 appears feasible but requires additional efforts to be made.
Footnotes
Acknowledgements
This article builds on an analysis conducted in the Intelligent Energy Europe (IEE) project ‘DIA-CORE – Policy dialogue on the assessment and convergence of RES policies in EU Member States’. The DIA-CORE project is a collaborative action of several European research institutions, policy consultants and one industry representative, establishing a policy dialogue on the assessment and convergence of RES policy in EU Member States. This initiative could be established thanks to the financial and intellectual support offered by the Intelligent Energy Europe (IEE) Programme of the European Commission, operated by the Executive Agency for Small and Medium Enterprises. For more details on the DIA-CORE project, see ![]() .
.
Declaration of conflicting interests
The author(s) declared no potential conflicts of interest with respect to the research, authorship, and/or publication of this article.
Funding
The author(s) received no financial support for the research, authorship, and/or publication of this article.