
Abstract
This paper presents the wind energy potential at Kudat Malaysia by considering the Levelized cost of energy (LCOE) model for combined wind turbine capacities. The combination of small- and utility-scale wind turbines is the key to the success of the operation of a wind park in the lower wind speed region. In a combination approach, the small-scale wind turbines provide the power required by the utility-scale wind turbines to start the blade rotation. For this reason, the particular closed-form equation was modified to determine the LCOE of a wind park with combined turbine capacities. The modified LCOE model can be used as a basis for setting tariff rates or define the economic feasibility of wind energy projects with combined wind turbine capacities.
Introduction
The intense demand for electricity in Malaysia is contributed by commercial and domestic sectors, which are growing proportionally with the Gross Domestic Product (GDP). The generation of electricity has shown an increase from 1,58,672 GWh in 2016 to 1,62,184 GWh in 2017. 1 The country is going to need even more energy as it strives to move towards a high-income economy. The natural gas and coal will continue to feature strongly in Malaysia’s energy mix in the power sector, with coal making up a more significant share based on the rising gas prices. However, due to the non-renewable nature of gas and coal, the resources are depleting at an alarming rate. Also, the generation of energy from these non-renewable resources could emit greenhouse gases into the atmosphere, which is the principal cause of global warming.
At the global level, various solutions have been suggested and carried out to decrease the dependence on gas and coal to generate electricity. 2 One of the solutions is the 2 °C scenario (2DS), which aims to limit the rise of the global temperature to 2 °C only, instead of 6 °C if no preventive measures are being taken by 2035. 3 The solution can be realized by promoting renewable energies as a replacement for gas and coal. By generating energy using natural and non-depleting resources such as wind and solar power, the emission of Greenhouse Gases (GHG) released from the utilization of gas and coal can be reduced. The Malaysian government has started to explore and exploit the use of renewable energy as a resource to generate electricity through many strategies such as by introducing the Feed-in Tariff scheme, Net Metering, and developing the national renewable energy policy.
Throughout the world, around 70% of it is estimated to fall in the low wind speed zone and is believed to be able to generate electricity if there are a proper technique and robust wind technology. 4 Most countries in Southeast Asia, including Malaysia, are situated in the low wind speed region; therefore, the advancement of the wind technology that suits low wind speed scenarios is needed to maximize the production of electricity from wind turbines. The progress of technology nowadays sees the utilization of direct-drive turbines 5 and the increase of rotor diameter size and the rated power of wind turbines. 6 The technology is becoming more efficient, potent, amplified energy production, and practical for power producers, especially in sites with low wind speed. 7 The advantages of direct-drive technology are that it has a simple configuration, less failure risk, and increased reliability with excellent potential for weight reduction of the turbine. 8 The gear-based wind turbine connects the shaft to the gearbox on the generator. Some blades rotate the shaft. However, lots of bearings and wheels in the wind turbine gearbox will experience high stress because of wind turbulence. This problem with the gearbox causes an increase in the maintenance cost of the wind turbine and decreases the energy benefit. Other than that, the recent enlargement of the rotor diameter of wind turbines can capture more wind speed and increase the capacity factor of a wind turbine. 9 Rotor is an important component of a wind turbine that comprises a shaft attached to the blades. 10 mentioned that the three-blade rotor is generally chosen in commercial- and utility-scale wind parks.
The recent advancement of wind turbine technologies lends credence to the potential of low wind speed regions such as Malaysia to generate electricity at the desired amount of energy. This claim is also supported by the success of small- to utility-scale wind energy projects built in neighbouring countries such as Vietnam, Thailand, and Philippines. Thailand has embarked on a project to develop a wind park, which is Southeast Asia’s largest, with a generating capacity of 103.5 MWh and costing THB 6.5 billion (USD 186 million). 11 The wind park started operating in November 2012. 11
The wind energy potential has been explored in many different ways. One of common method is Wind Atlas, as reported in. 12 In the Wind Atlas method, the mesoscale model uses data from a global archive, which is known as reanalysis data for producing regional wind climatology. Moreover, the statistical analysis was presented in some reports by averaging and visualizing the time series data to estimate wind energy potential as presented by.13–16 The other methods are the Turbine-Site Matching Index (TSMI), 17 Wind turbine rank method, 18 and Capacity Factor.19,20 The most popular method in defining the potential of wind energy at specific sites are the Levelized Cost of Energy (LCOE). 21 In the literature, the analysis of wind energy potential in Malaysia was based on wind data conditions, 22 capacity factor, 23 and LCOE. 24 However, the previous studies only considered the single capacity of the wind turbine in defining the energy potential. Whereas, as stated by, 4 the combination of small-scale and utility-scale wind turbine is the best way to increase the efficiency of wind parks in low wind areas. Although many methodologies have been reported to define the potential for wind energy, neither one has evaluated the energy potential study by taking into account the combined wind turbine capacities in a wind park.
There several works of literature that discussed the application of the Levelized Cost of Energy (LCOE) equation for renewable energies. The simplified formula was utilized by 25 to generate favorable tariff rates for marine renewable energy in Malaysia. Moreover, the LCOE was used to evaluate and compare the tidal, wave, and offshore wind energy technology. 26 Also, the equation used to investigate the profitability of Building Integrated Photovoltaic (BIPV) system in the Malaysian Government Building. 27 It is suggested the incorporation of salvage value in the LCOE equation, 27 as the power producer should earn some investment return from the salvage value of the project. Besides, the effect of debt and depreciation also suggested to include in the LCOE closed-form equation 28.
This paper aims to determine the wind energy potential and identify the LCOE for the wind-based energy producer in Malaysia. The determination of LCOE for the different size of wind turbine capacity would assist the Malaysian energy policymakers who are interested in supporting the wind energy projects. Besides that, the closed-form LCOE determination model can be applied by other countries, besides being a part of the toolbox for any renewable energy policymaker. The model considered specific parameters assumption based on the condition and practice in Malaysia. However, the parameter should be altered to fit the situation and requirement before being applied in other countries.
The following criteria were considered for the determination of LCOE for the onshore wind energy in Malaysia:
The higher initial cost for wind energy in Malaysia as the market is still not matured. The wind turbines and their components should be transported from other countries, and this would increase the Capital expenditure (CAPEX) value. The model should include the benefit of capital allowance At the higher initial cost, it is likely to require less equity, longer debt maturity, lower debt interest rate, and secured a long-term agreement.
Methodology
Selected site
A site in Kudat, namely Bak-bak, as presented in Figure 1, was selected as the case study site. The center coordinates of Bak-bak are N 6° 56’ 46.9’’, E 116° 49’ 43.5’’. Kudat is a town in Sabah that is situated in the East of Malaysia. From the West, Kudat faces the South China Sea, and it is facing the Sulu Sea in the east direction. As reported by numerous scholars, Kudat is a well-known region that has promising wind energy potential in Malaysia.23,29 Bak-bak is chosen as a case study site as it has a commercial land that can be used for any new development. Besides that, the distance to the wind measurement site (coordinates 7° 1’ 45.33” N, 116° 44’ 47.98” E) is only 10 km, and the interpolated data from the measured site is suitable to be used to estimate annual energy. The site also located near to the transmission grid line, and the site is considered as an open area with low roughness length and obstacles. Three generic wind parks with different sizes of wind turbines were simulated: (i) the wind park with small scale wind turbines; (ii) the wind park with utility-scale wind turbines; and (iii) the wind park with the combined scale of wind turbines.
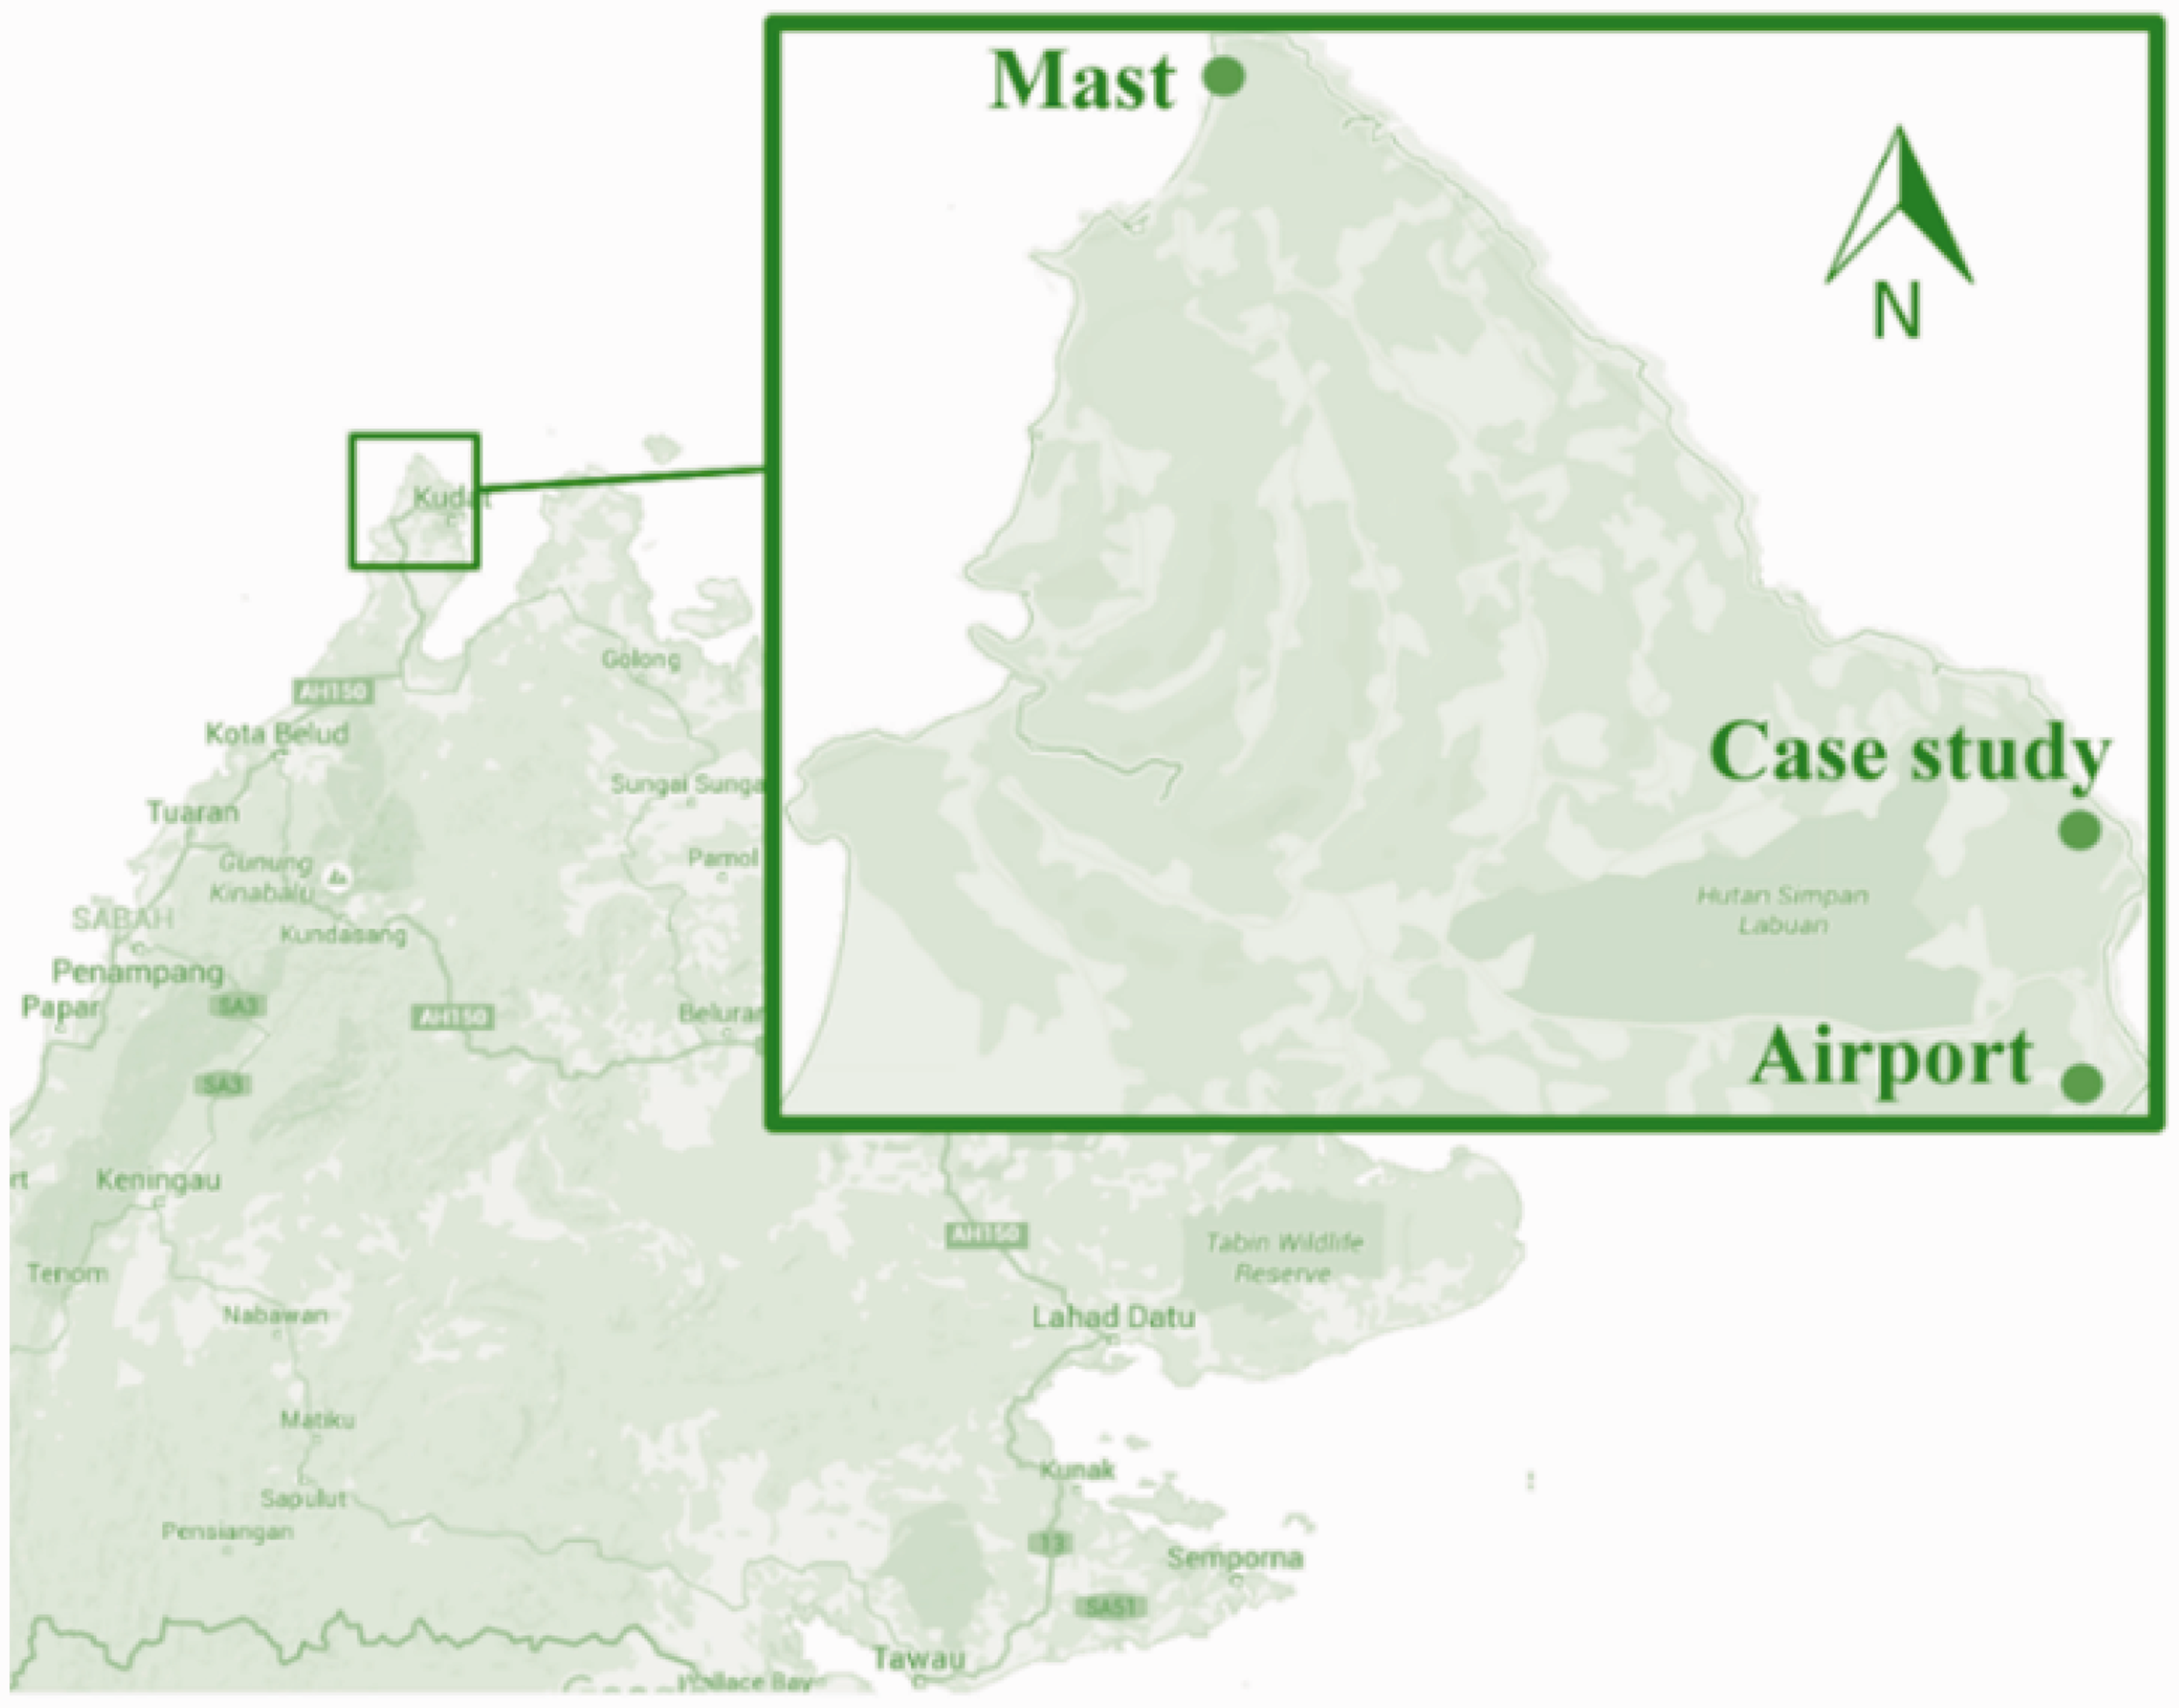
Map of Sabah and selected case study.
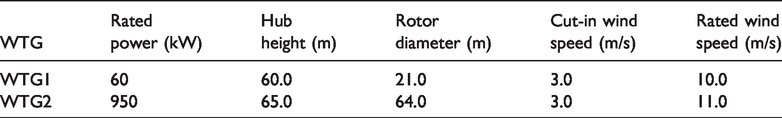
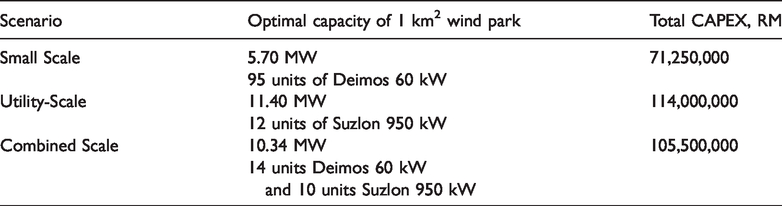
Two models of wind turbines with different rated power was selected as presented in Table 1. The optimal number of wind turbines is determined by locating the wind turbines (WTGs) based on the specific distance between the turbines. The wind turbine layout is designed by facing the upwind wind turbines towards the predominant wind direction. The number of wind turbines should only be counted within the inclusion zone; if there is any WTG in the exclusion zone, those WTGs would be omitted. The number of wind turbines and the total park capacity decrease with the increase in WTG distances. The WTG distance should be reduced if the developers want to build a large total park capacity. However, the less WTG distance would lead to higher wake losses on the downwind wind turbines. The 60 kW for small scale and 950 kW for utility-scale wind turbines were selected for the simulation. Figure 2 shows the illustration for the location of wind turbines for wind parks with three different sizes. The optimal number of wind turbines was defined using WindPRO tools based on the 5RD wind turbine distances.
The specifications of the selected wind turbines.
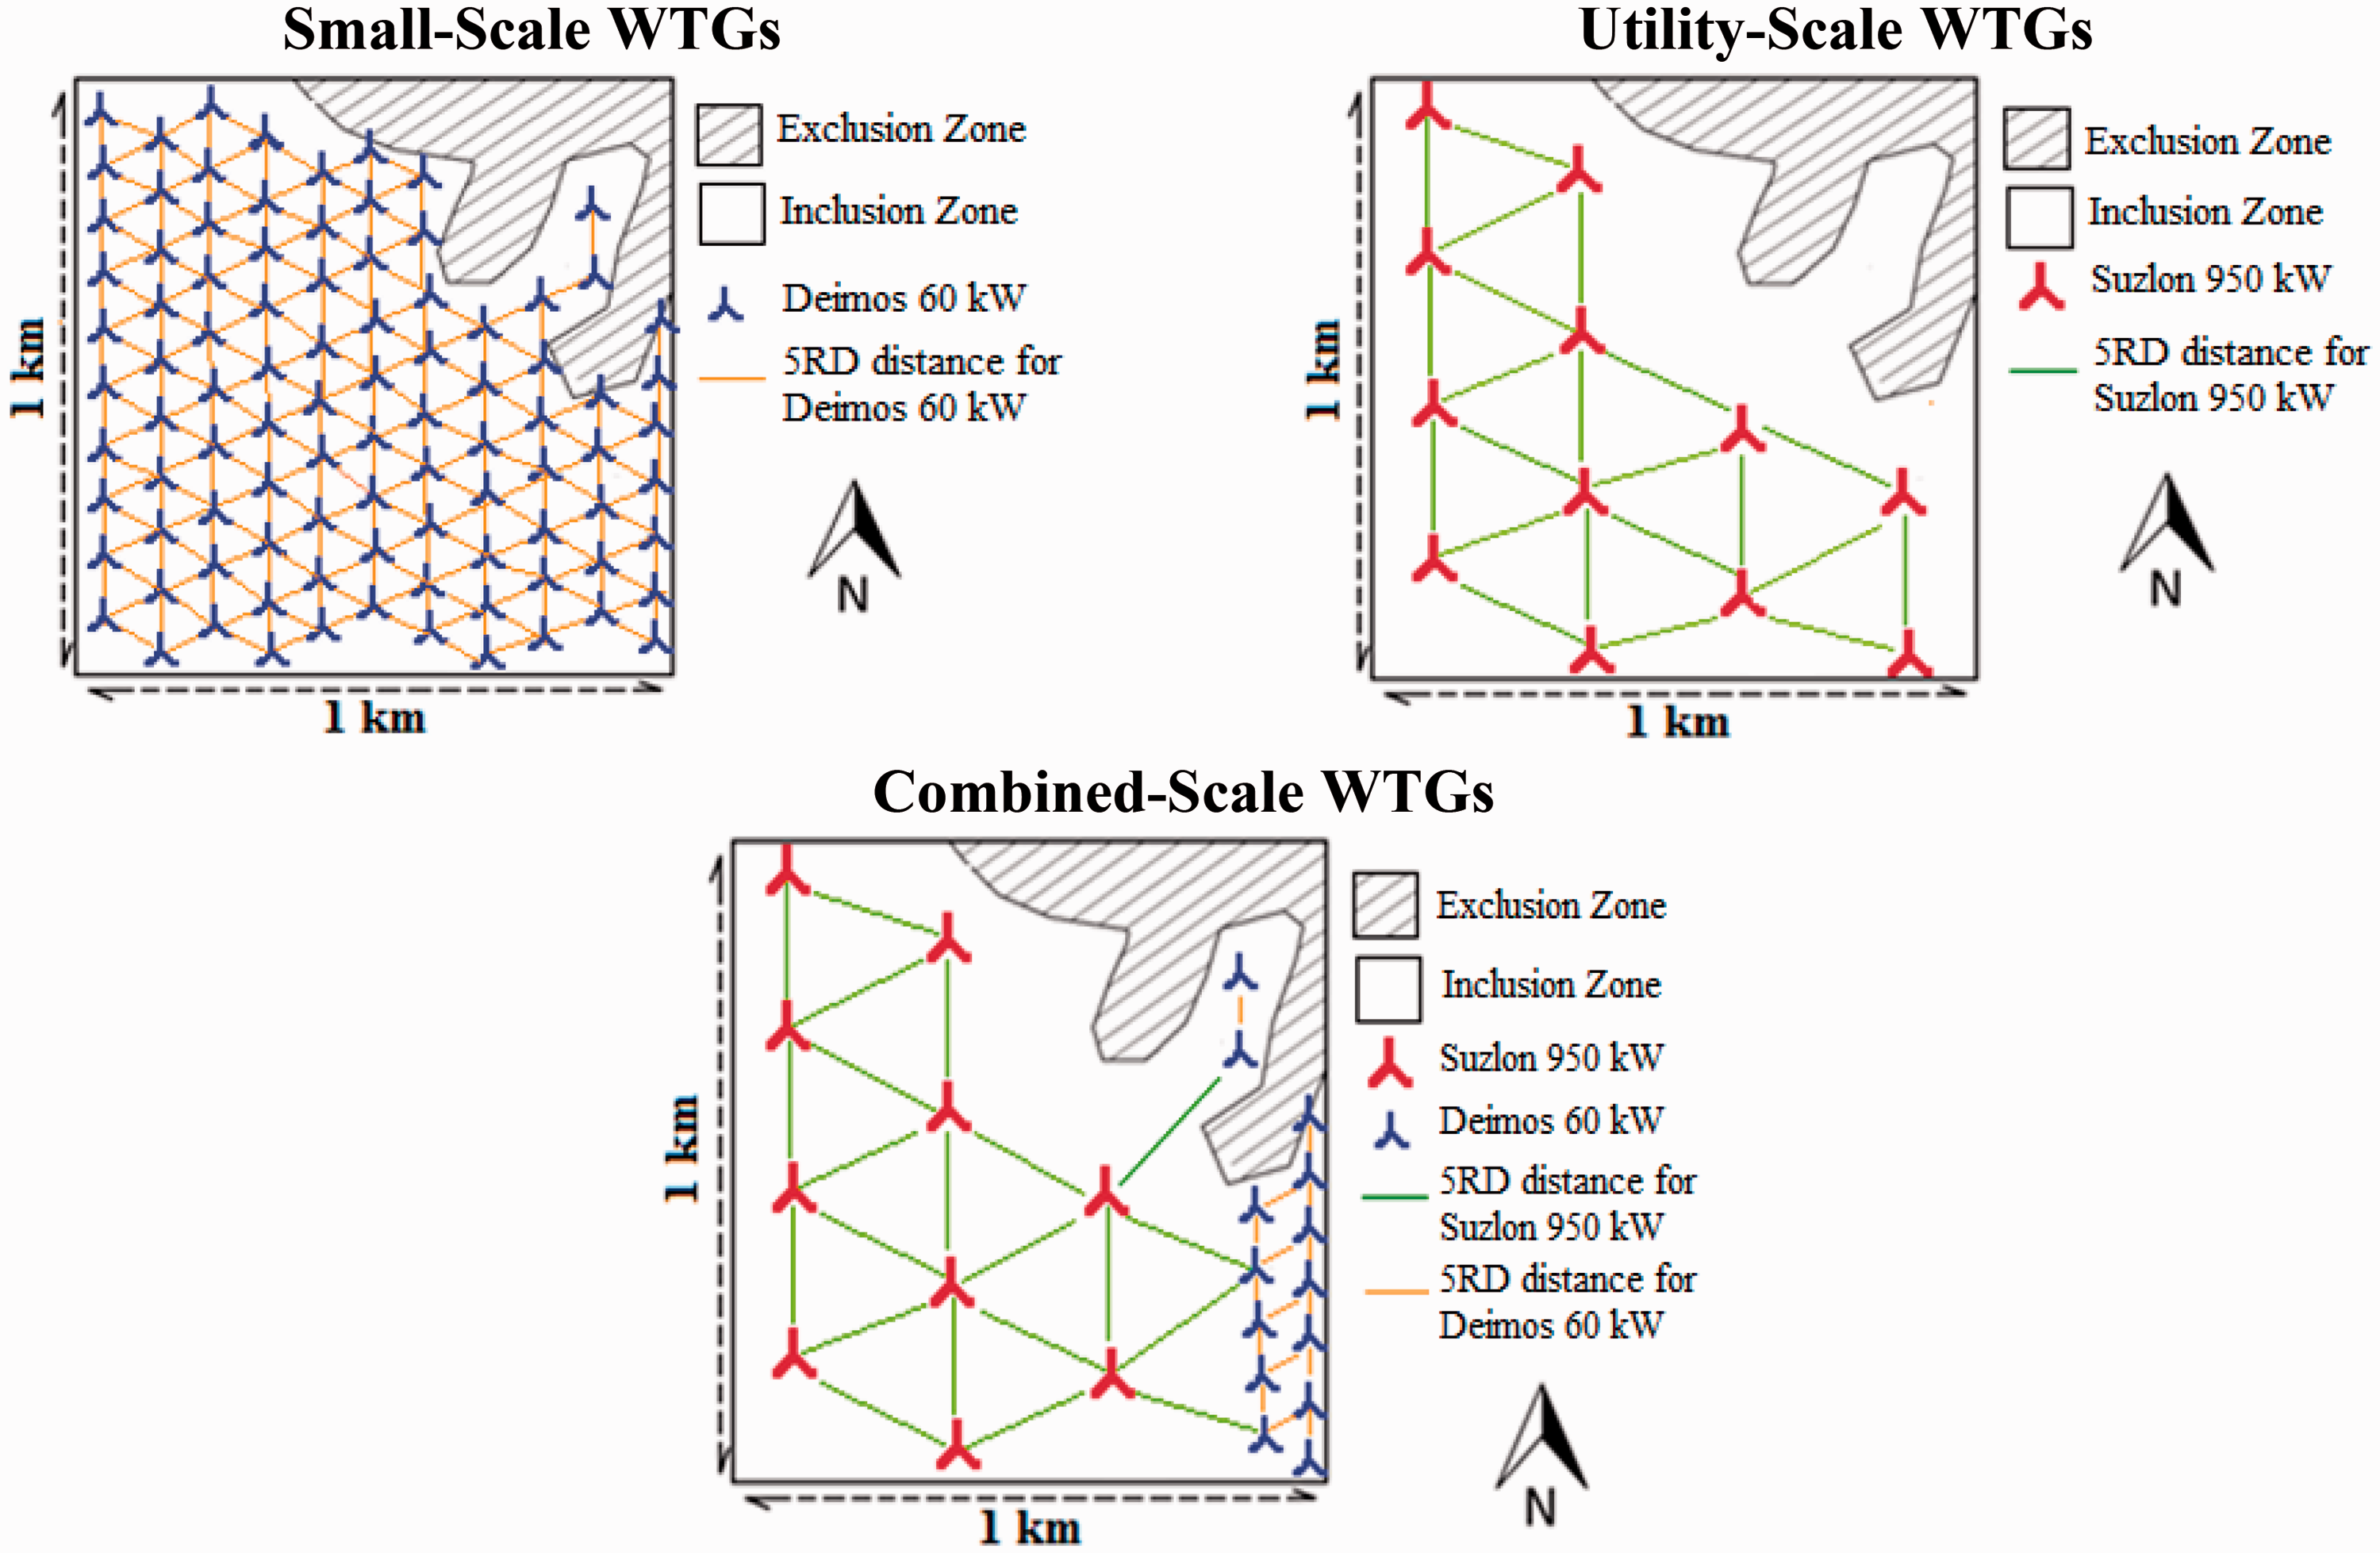
The illustration for the location of wind turbines for 1 km2 wind parks with three different capacities.
Levelized cost of energy
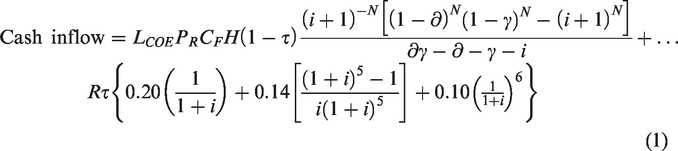
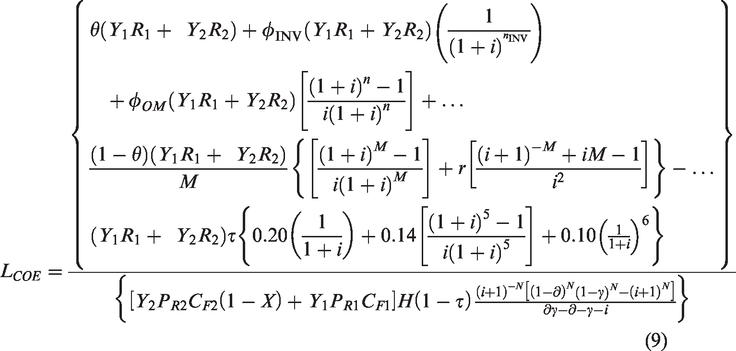
The cash inflow components include the income from energy produced and the capital allowance. The capital allowance for RE in Malaysia comprises of the initial allowance and annual allowance. The percentage of the initial allowance is fixed as 20%, and the annual allowance is 14% for five years. The capital allowance for year 6 is 10% to make a total of 100% over the period. Consequently, the component of cash inflow can be presented as the following:
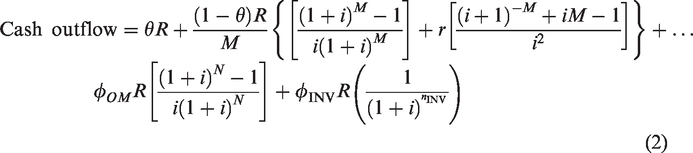
The component of cash outflow includes the share equity of total cost, discounted operation and maintenance cost, loan repayment, and the inverter replacement cost. The component of cash outflow can be presented as the following:
Therefore, the net present value (NPV) for the project over Renewable Energy Power Purchase Agreement (REPPA) periods can be calculated as the following:
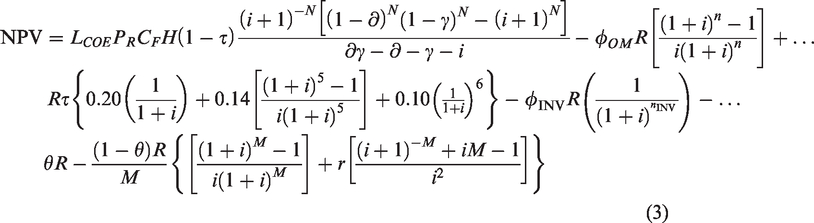
If the NPV is positive, this means that the investment is economically viable. Therefore, if we set the NPV to zero and solve LCOE, we can obtain the LCOE, the breakeven point for the investor in which they get the rate of return in the project.

The equation (5) is simplified as the following:

Therefore, the modified equation for project income is as the following:
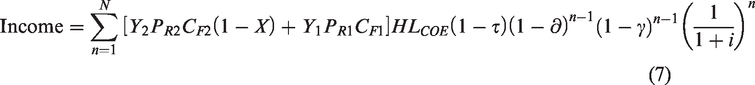
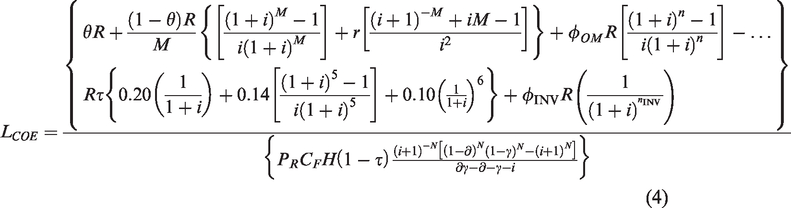
The equation (7) is then simplified as the following:
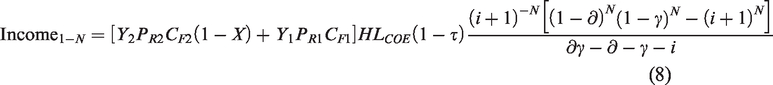
Therefore, the following is the formula to determine the LCOE for combined capacity:
Where, N is the REPPA periods; PR is the rated power of wind turbine; LCOE is the LCOE; CF is the capacity factors;
2.3 Justification of parameters assumption for Malaysia
The LCOE for Malaysia rely on three sources of information: (i) prior academic research and case study reports on the economics of wind energy; (ii) the national policy documentation; and (iii) a series of communication conducted with the industry experts at the Renewable Energy Workshop in the year 2015 in Selangor, Malaysia, and Asia Pacific Economic Cooperation (APEC) Seminar for Best Practice on Wind Energy in the year 2016 in Hanoi, Vietnam.
Generally, the value of the assumed parameter would change annually based on the uncertainty of the local and global economic factors. Thus, it is essential to overcome the unpredictable changes in the assumed parameters to ensure that the projected cash flow is still valid throughout the turbine lifetime period. Appropriate parameter value assumptions and predictions can solve this problem.
Investment cost
The investment cost is the total cost of a wind project, which includes the wind turbine system, installation, and maintenance cost. The turbine has the highest percentage of initial investment cost for the onshore wind project, which is around 71% of the total cost. The remaining cost is used for construction-related expenses, which is only 29% of the total cost as there is no additional cost for the foundation of the wind turbine tower. Most of the onshore wind energy projects were located near the grid transmission line, and they use less cost for the new transmission line installation.
Malaysia has not yet developed any commercial wind park; therefore, there are no official data of investment cost being reported in any form of publications. Accordingly, in this paper, the invoices provided by the manufacturers will be used as a reference in the cost assumption. The size of the wind turbines is grouped into two: the small scale wind turbine (≤100 kW rated power) and utility-scale wind turbine (>100 kW rated power). 30 Therefore, the assumed CAPEX of small scale wind turbines for Malaysia is 12,500 RM/kW, while the utility size wind turbine is 10,000 RM/kW. The estimated CAPEX is validated with the reported data of CAPEX in Asia, 31 and the neighboring countries have the estimated value in the range of those reported data. The total cost for every different scenario of wind turbine capacity was presented in Table 2.
The Total CAPEX for every different scenario of wind turbines scales in 1 km2 wind park.
The annual operating and maintenance cost (OPEX) is 2% per year. The replacement cost for the inverters was separated from the OPEX as the percentage of inverter replacement cost is higher compared to the annual OPEX. The inverter has to be replaced after 10.5 years compared to the other system components, which are expected to last for 21 years. The cost of electrical infrastructure is 9% from the CAPEX. 32 Thus, it is expected that the inverter replacement cost is 4.5% from the CAPEX, which takes up 50% of the cost for electrical infrastructure.
Degression rate
Degression is related to the annual reduction of wind turbine capital cost. Degression should be included in the LCOE model as the rates should be timely adjusted in accordance with the technology advancements.
In order to estimate the degression rates, the history and recent trend of declining cost should be taken into consideration. The initial capital cost of wind energy projects would usually decrease annually. The capital cost in the United States is lower from the year 2001 to 2004, which is 65% lower than the cost in the 1980s. 33 A similar trend was also reported in Denmark, where the capital cost declined around 55% in 2003 compared to the early 1980s. 34 The average annual degression for both works of literature is about 2% to 3%. However, the average of annual degression in the United Kingdom is lower than in the previous years, where the values are between 0.5% to 1.5%. 35 The forecast for the onshore wind park costs in the United Kingdom from the year 2011 to 2020 showed the degression in a total of 12%, and it is 23% lower from the year 2011 to 2040. The report by the International Renewable Energy Agency (IRENA) is supported by a report by 36 on the statement that by the year 2030, the cost reductions falling is around 1% per year. However, Germany has an early reduction that is below 1% and the degression percentage of onshore wind energy is 0.4%. However, the facility for renewable energy is not matured in Malaysia; therefore, 1% is the best assumption for wind energy in the country.
The parameters of debt repayment
It is common practice for the investor to apply for the loan from finance agencies to cover the higher initial capital cost of a wind energy project. Project developers would obtain the capital for the initial cost through the combination of debt (a loan) and equity investment (ownership). Usually, the bank will not give the full 100% loan, and the only loan 80%, as confirmed by the Malaysian Minister of Housing and Local Government. The loan is also similar for the average of the share of equity for seven selected countries, such as Denmark, Germany, Netherland, Spain, Sweden, Switzerland, and the United States. 37
In Malaysia, the value of debt interest could be up to 18% without collateral or 12% with collateral, as stated in the Moneylenders Act 1951.38 However, the minister has the power to decide the acceptable bank interest rate. The value of risk-free rate is 5%. 39 The debt is assumed to be discrete from the other loans that a power producer may have.
Discount rate
The discount rate is used in a discounted cash flow analysis to compute the net present value. In order to compute the Levelized cost of energy for wind energy,
31
gave a 7.5% discount rate for OECD countries and China and the rest of the world is only given 10%. The Organization for Economic Cooperation and Development (OECD) is a unique forum where the governments of 35 countries work together to promote economic growth, prosperity, and sustainable development.
40
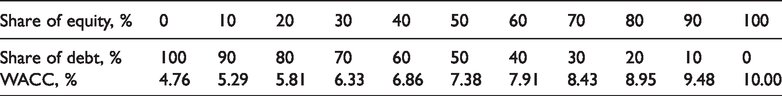
Malaysia is a non-OECD country; thus, 10% is the discount rate for the LCOE calculation. However, the value of 10% does not consider the effect of debt. This study has estimated the discount rate using the weighted average cost of capital (WACC) method. The WACC is a blend of the cost of equity and the after-tax cost of debt, and the following is the equation:

Where, θ is the percentage for the share of equity, (1-θ) is the percentage for the share of debt, ce is the cost of equity, cd is the cost of debt, and τ is the corporate tax. The cost of equity, ce is the minimum rate that a company desired to earn when investing in any project. It is also referred as the company’s required rate of return or target rate. The average wind energy is around 10% to 12%. The value of 10% is used in the estimated unleveraged discounting rates that are utilized for the LCOE calculation in the recent RE report. 31 The pre-tax cost of debt, cd, is the sum of the risk-free rate, r, and the default spread, rs; where, cd = r + rs. The value of risk-free rate is 5%, 39 while the default spread for Malaysia is 1.35%. 41 Thus, the amount of pre-tax cost of debt is 6.35%. Table 3 shows that the value of after-tax WACC is different for the different share of equity and debt.
The WACC for the different share of equity and debt.
Result and discussion
Data analysis
The quality of the wind speed in Malaysia is influenced by two major monsoon seasons, namely the northeast (October to March) and southwest (April to September) monsoons.42,43 Normally, the strong wind occurs during the northeast monsoon season (raining season) as it is accompanied by heavy rain. The wind turbine is expected to generate a high amount of electricity during this season. The wind speed also depends on the geographical characteristics of the site, as not all sites are feasible to construct wind turbines. Further investigation should be done to identify the best location before deciding on investing in the wind energy project.
Theoretically, the monsoon seasons occurred due to the tilt of the earth and solar radiation, which led to the difference of land-ocean temperature. 44 During northeast monsoon, the atmospheric temperature and pressure drop due to the less solar radiation at the Northern Hemisphere. The anticyclones develop at Siberia, and the cold northeasterly air reaches China before heading towards the Southeast Asian countries. 42 The wind speed is high and accompanied by heavy rainfall during the northeast monsoon season compared to the Southwest monsoon.
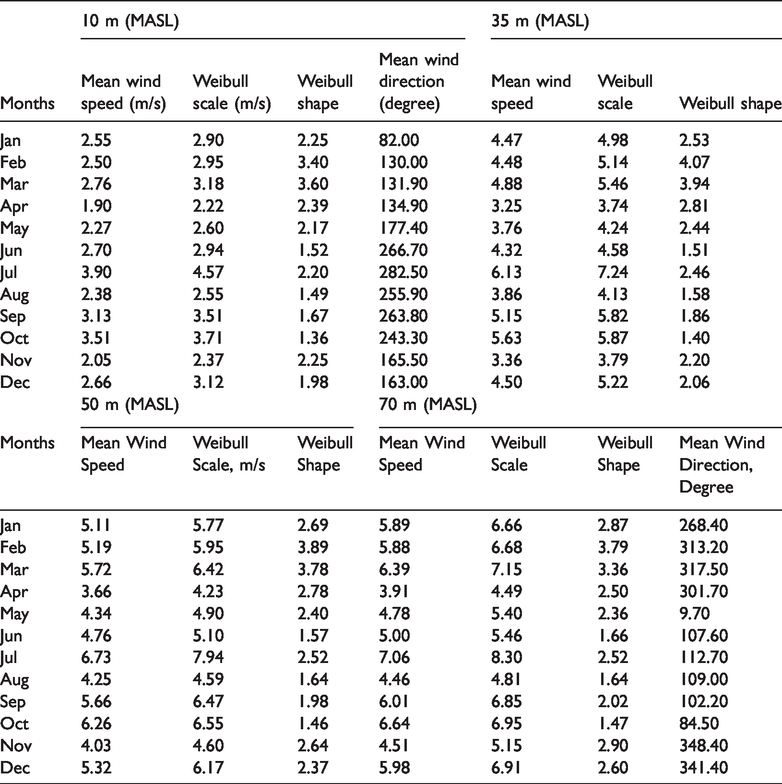
Table 4 shows the monthly averaged wind speed at every site, where the wind speed is recorded higher from October to March. All of the sites at Peninsular Malaysia have a similar pattern where the wind speed would higher during the Northeast monsoon season compared to Southwest monsoon. 23 For the site at Sabah, the pattern of monthly mean wind speed was inconsistent. In Kudat, July is the month with the highest wind speed. The wind speed value in Kudat is influenced by the typhoons which cross the ocean in the northern part of Sabah, where the typhoon approached from the Philippines and nearby countries. 42
Monthly averaged data at different height.
The wind resources map is essential to overview the artificial value of the wind speed by observing the different colors on the map (see Figure 3). The wind resources map was created based on the flow modeling of the wind speed that considers the obstacles, elevation, and roughness length. Usually, the wind speed is at high elevation and weak at high obstacles and roughness length. The following are the factors that affected the result of the wind resource map:
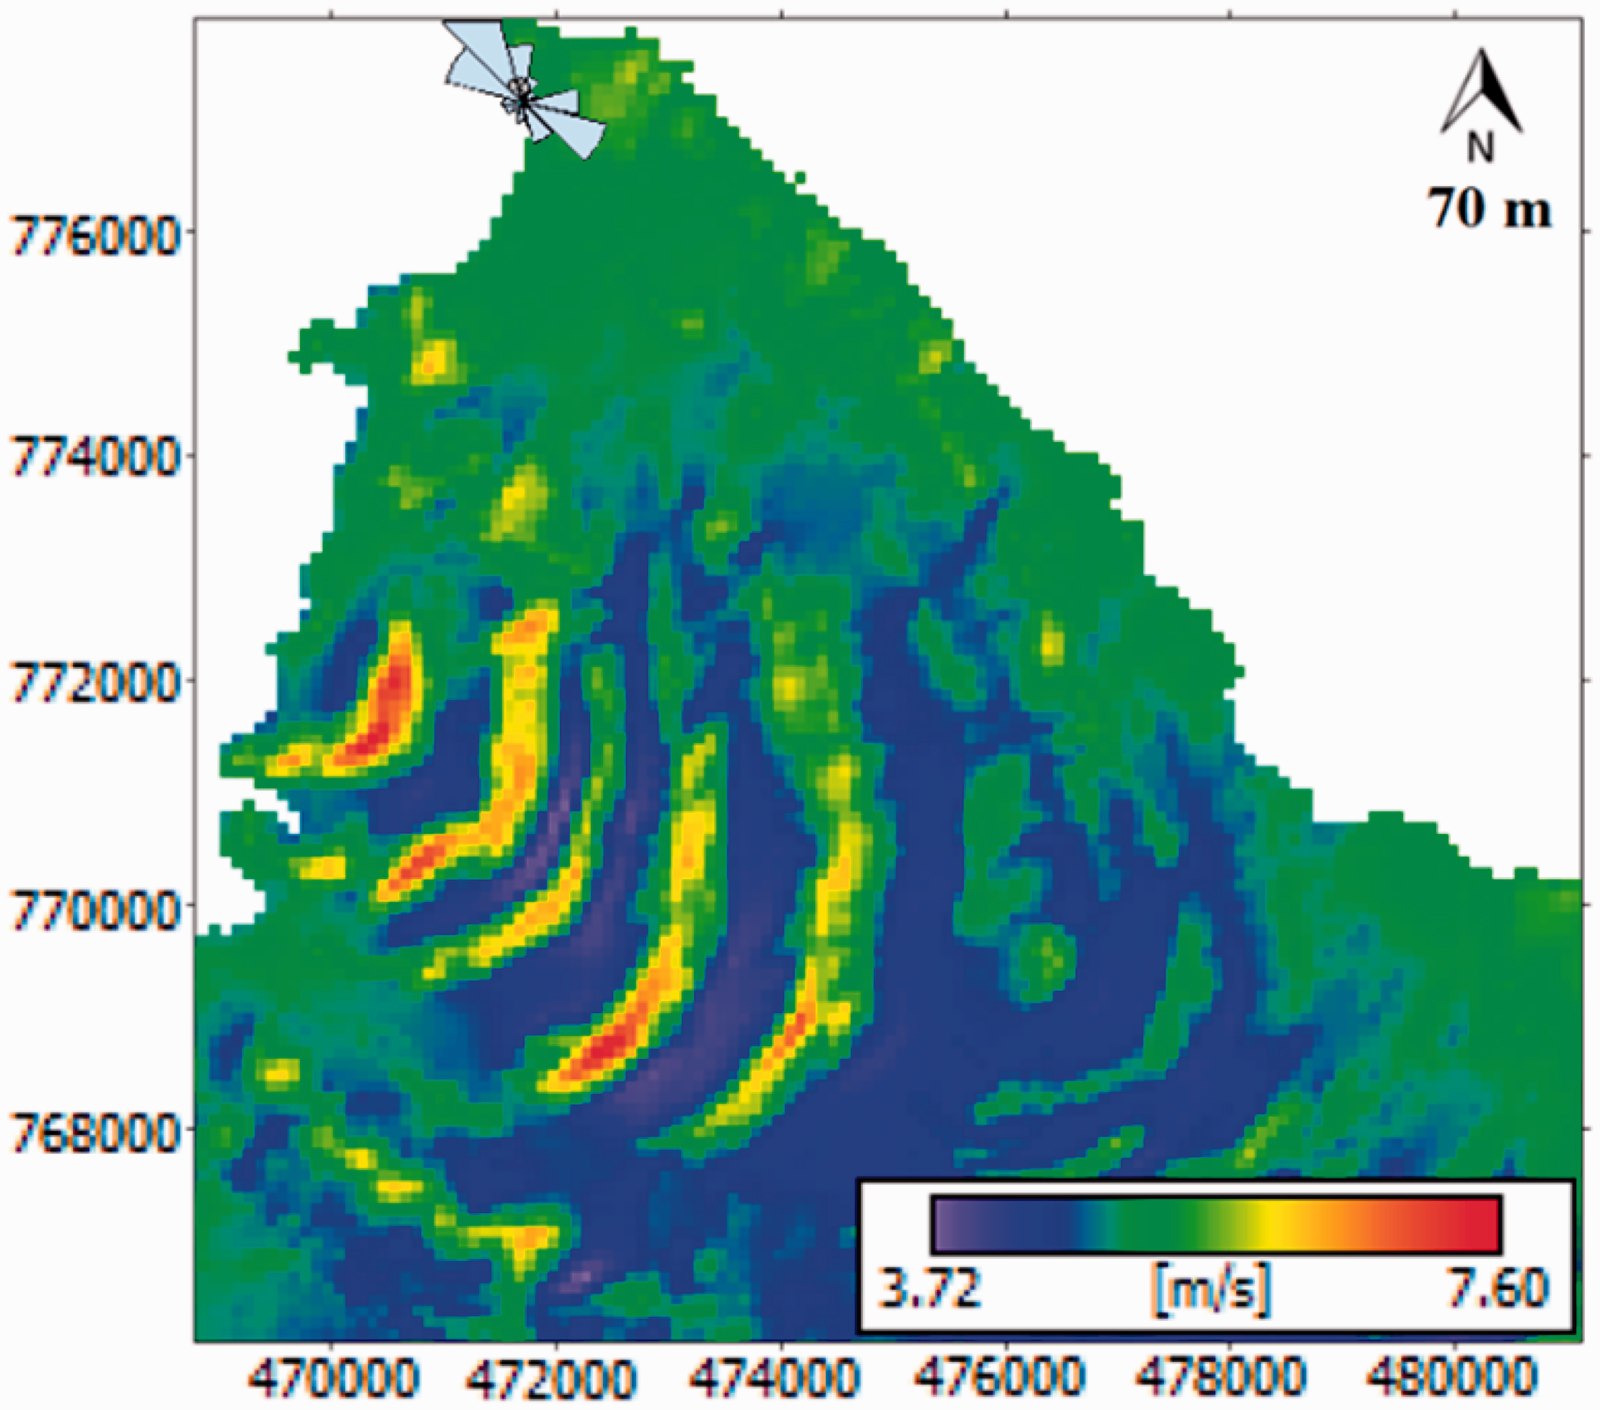
The wind resource map for Kudat, Sabah.
The elevation of the site.
The roughness length and class.
The obstacles that exist at the site and nearby.
The wind direction of the reference masts.
The height of reference wind speed data.
The wind resource map at maximum height (m.a.g.l) was created for Kudat. The colors are arranged from purple (lowest value), followed by blue, green, yellow, orange, and red (highest value). The color red appears at high elevation, while the color green (moderate value) is situated at the coastal sites and some areas where there are fewer obstacles and roughness length, as well as open and flat regions that have no friction to the wind flow. Purple and blue have the lowest levels of wind speed on the map, where the existence of a higher value for the obstacles and roughness length is most probably situated in the residential area, city, or forest.
The errors on the developed maps were influenced by the extensive flow separation, the degree of turning in each sector, and the map size. 45 As a result of some simplifications being made in the numerical models within WAsP, the program can produce somewhat inaccurate results when it is used outside the recommended operational envelope. 46 When a site has a complex, rugged terrain, or very complex atmospheric conditions, the accuracy of WAsP can be unreliable. 46
The accuracy of the developed maps was determined by comparing the generated horizontal wind data with the concurrent wind data from the nearby meteorological station. Both data should have the same coordinate to make sure that there was no bias comparison being made. Indasi et al. (2016) also conducted a similar study using the mean difference to identify the accuracy of the WAsP model. 47 This study has obtained good predictions for the wind resource map in Kudat with only a 10% discrepancy. The WAsP numerical model would create a higher uncertainty over the flow of wind speed over rugged terrain. 45
LCOE determination
The LCOE was determined based on three different scenarios; (i) the wind park with small scale wind turbines (non-combined capacity), (ii) the wind park with utility-scale wind turbines (non-combined capacity) and, (iii) the wind park with the combined scale of wind turbines. The LCOE for non-combined wind turbine capacity was determined using equation (4) and the value was not influenced by the number of wind turbines. It was because in equation (4), the CF parameter is the sum of total wind turbine capacity factors in wind park.
The equation (9) would be used to calculate the LCOE for a wind park with combined wind turbine scale, where LCOE ‘s value was influenced by the number of wind turbines for both turbine scales. This is because the CF and CAPEX for different turbine scales are merged into the equation (9). Therefore, for a wind park with the combined scale of wind turbines, the value of LCOE would be differentiated based on the ratio between the numbers of small-scale to the number of utility-scale wind turbines. Besides, the park with two units of small-scale WTG and one unit of utility-scale WTG (ratio is equal to 2), the LCOE is 0.7706 RM/kWh. Thus, the similar value of LCOE is also used for every wind park with the ratio is equal to 2, such as for a wind park with 20 units of small-scale wind turbines and 10 units of utility-scale wind turbines. Figure 4 presents the variation of LCOE depending on the number of wind turbines for both scales. Figure 5 shows the LCOE for different ratio from 0 to 100, where the maximum number of wind turbines (100 units) for both scales were utilized to generate the graph. The value of LCOE rise with the increasing ratio value, where the number of the small scales wind turbine is more than the utility-scale. This is due to the higher CAPEX for small-scale wind turbine, in contrast to utility-scale. The more numbers of small-scale wind turbines will lead to the increment of the expenditure cost in the project cash flow.
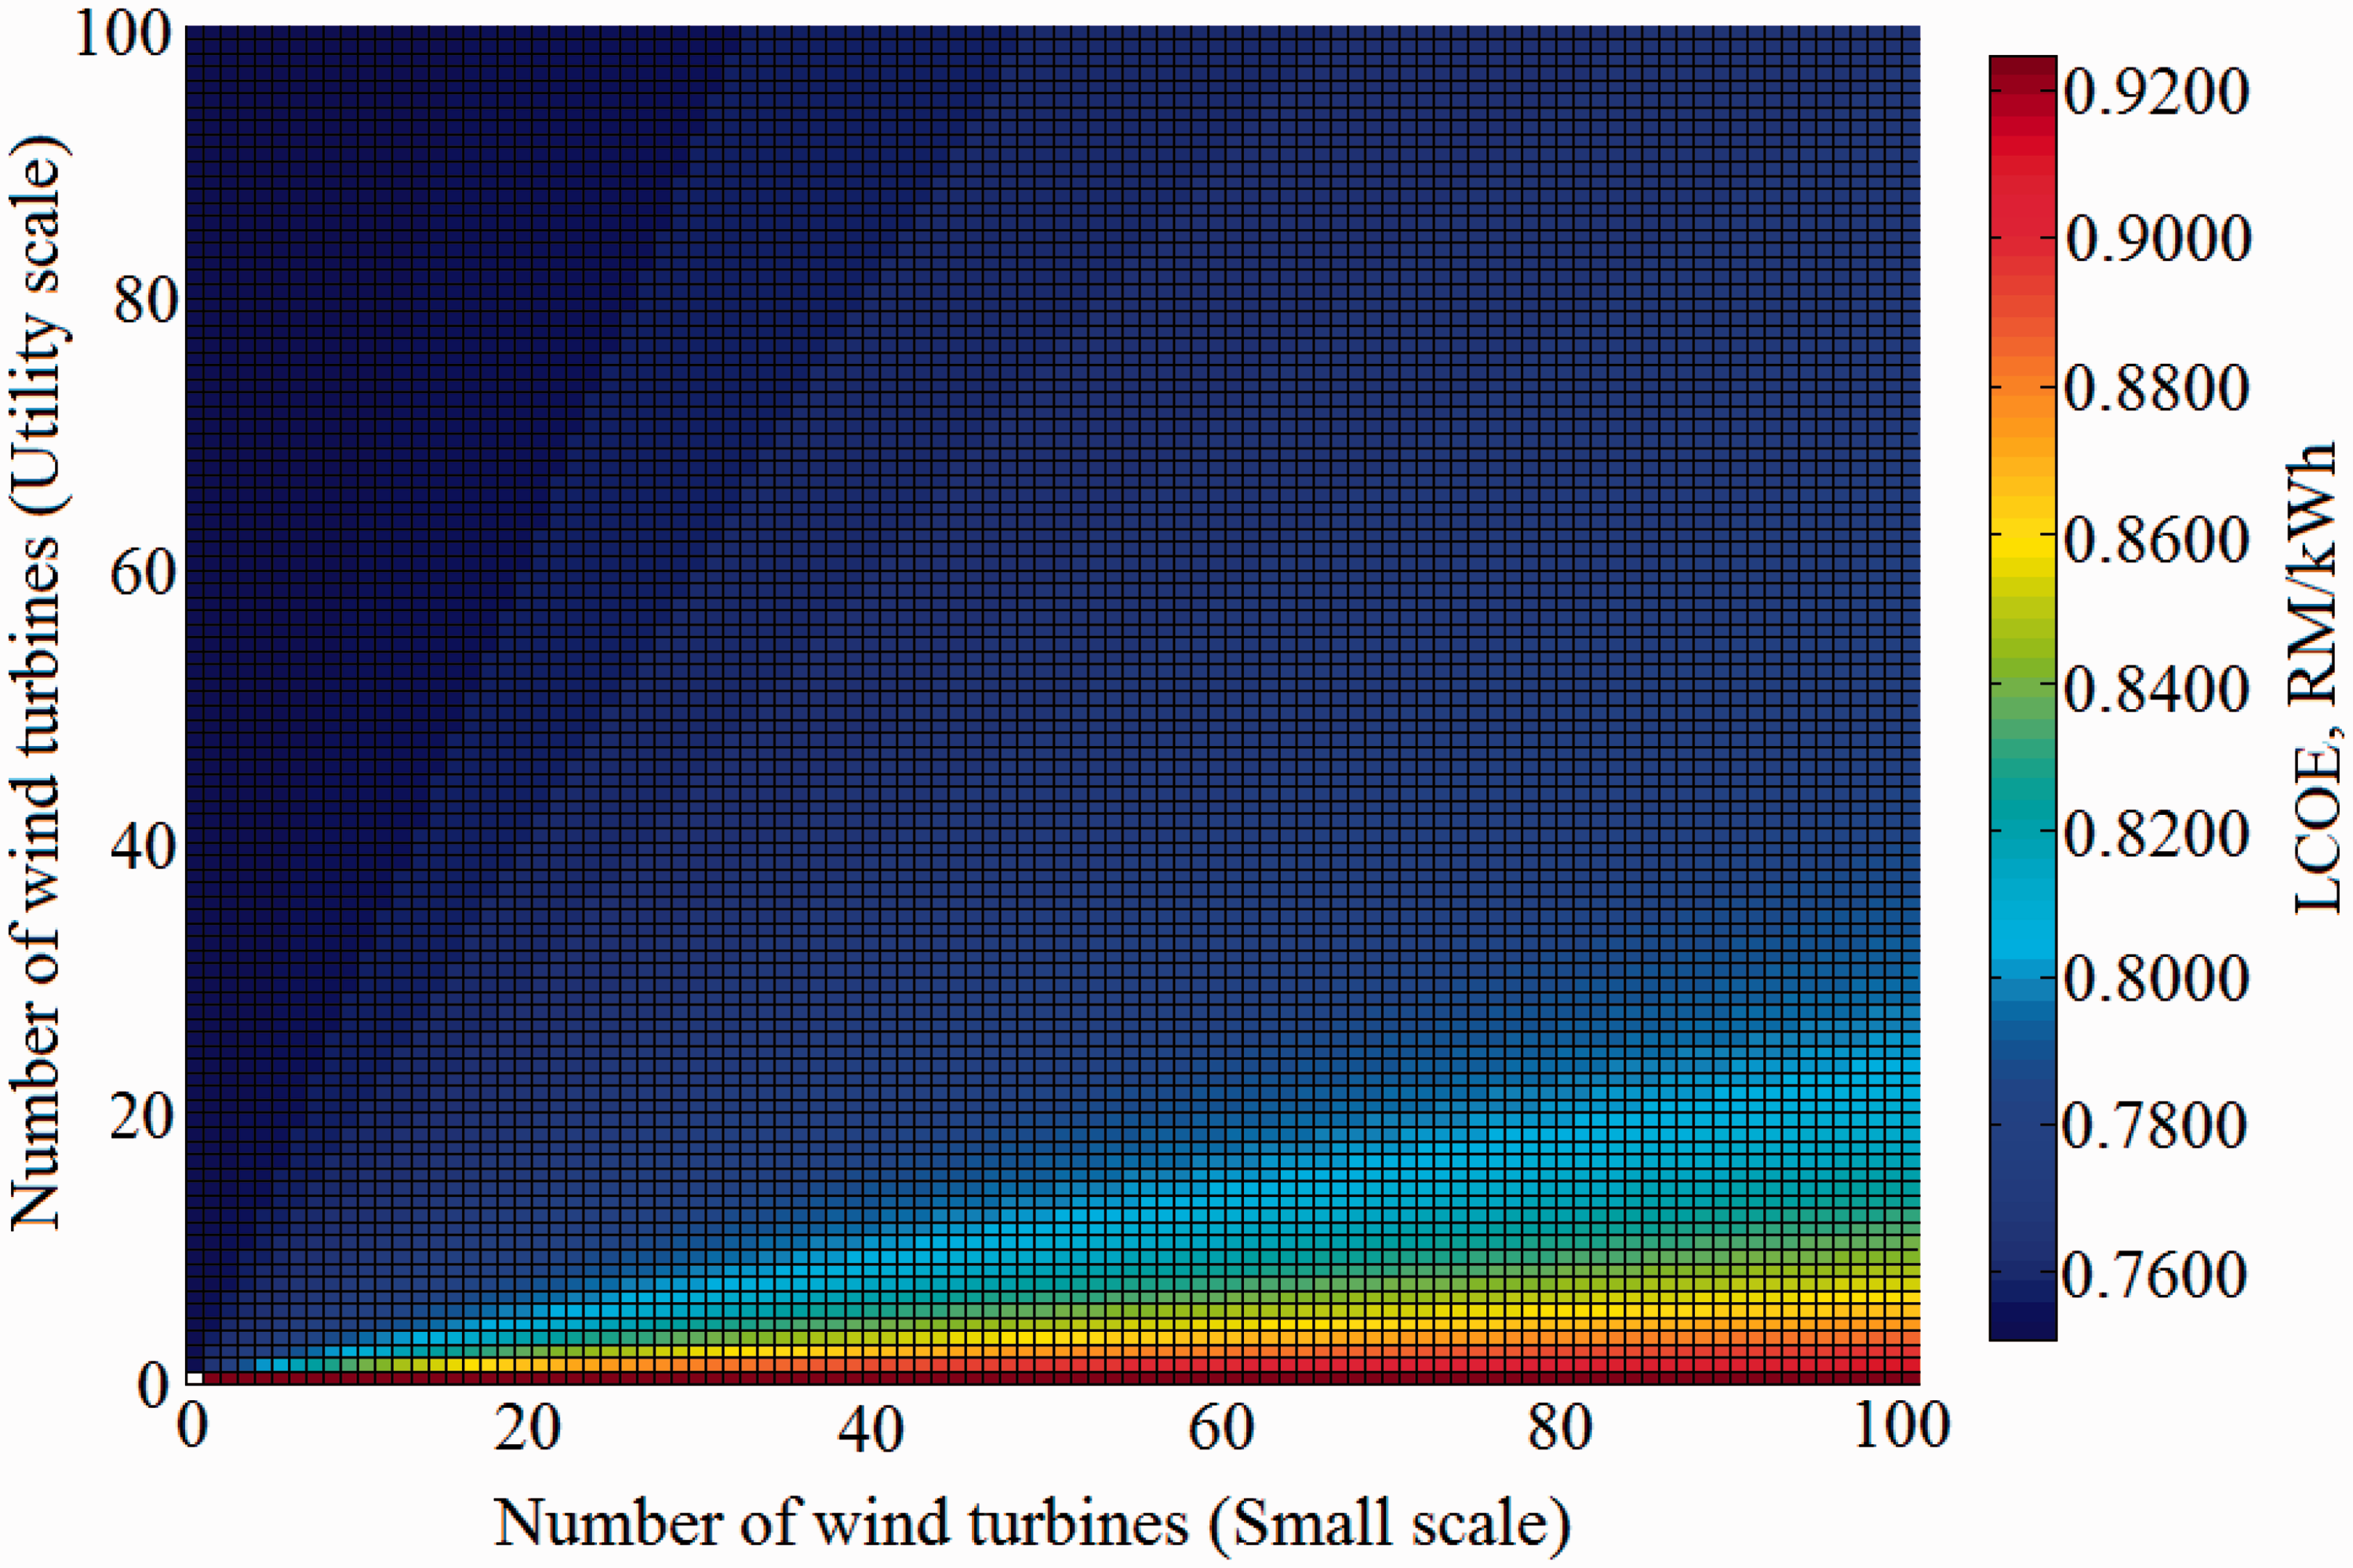
The variations of LCOE based on the combination of numbers of wind turbines.
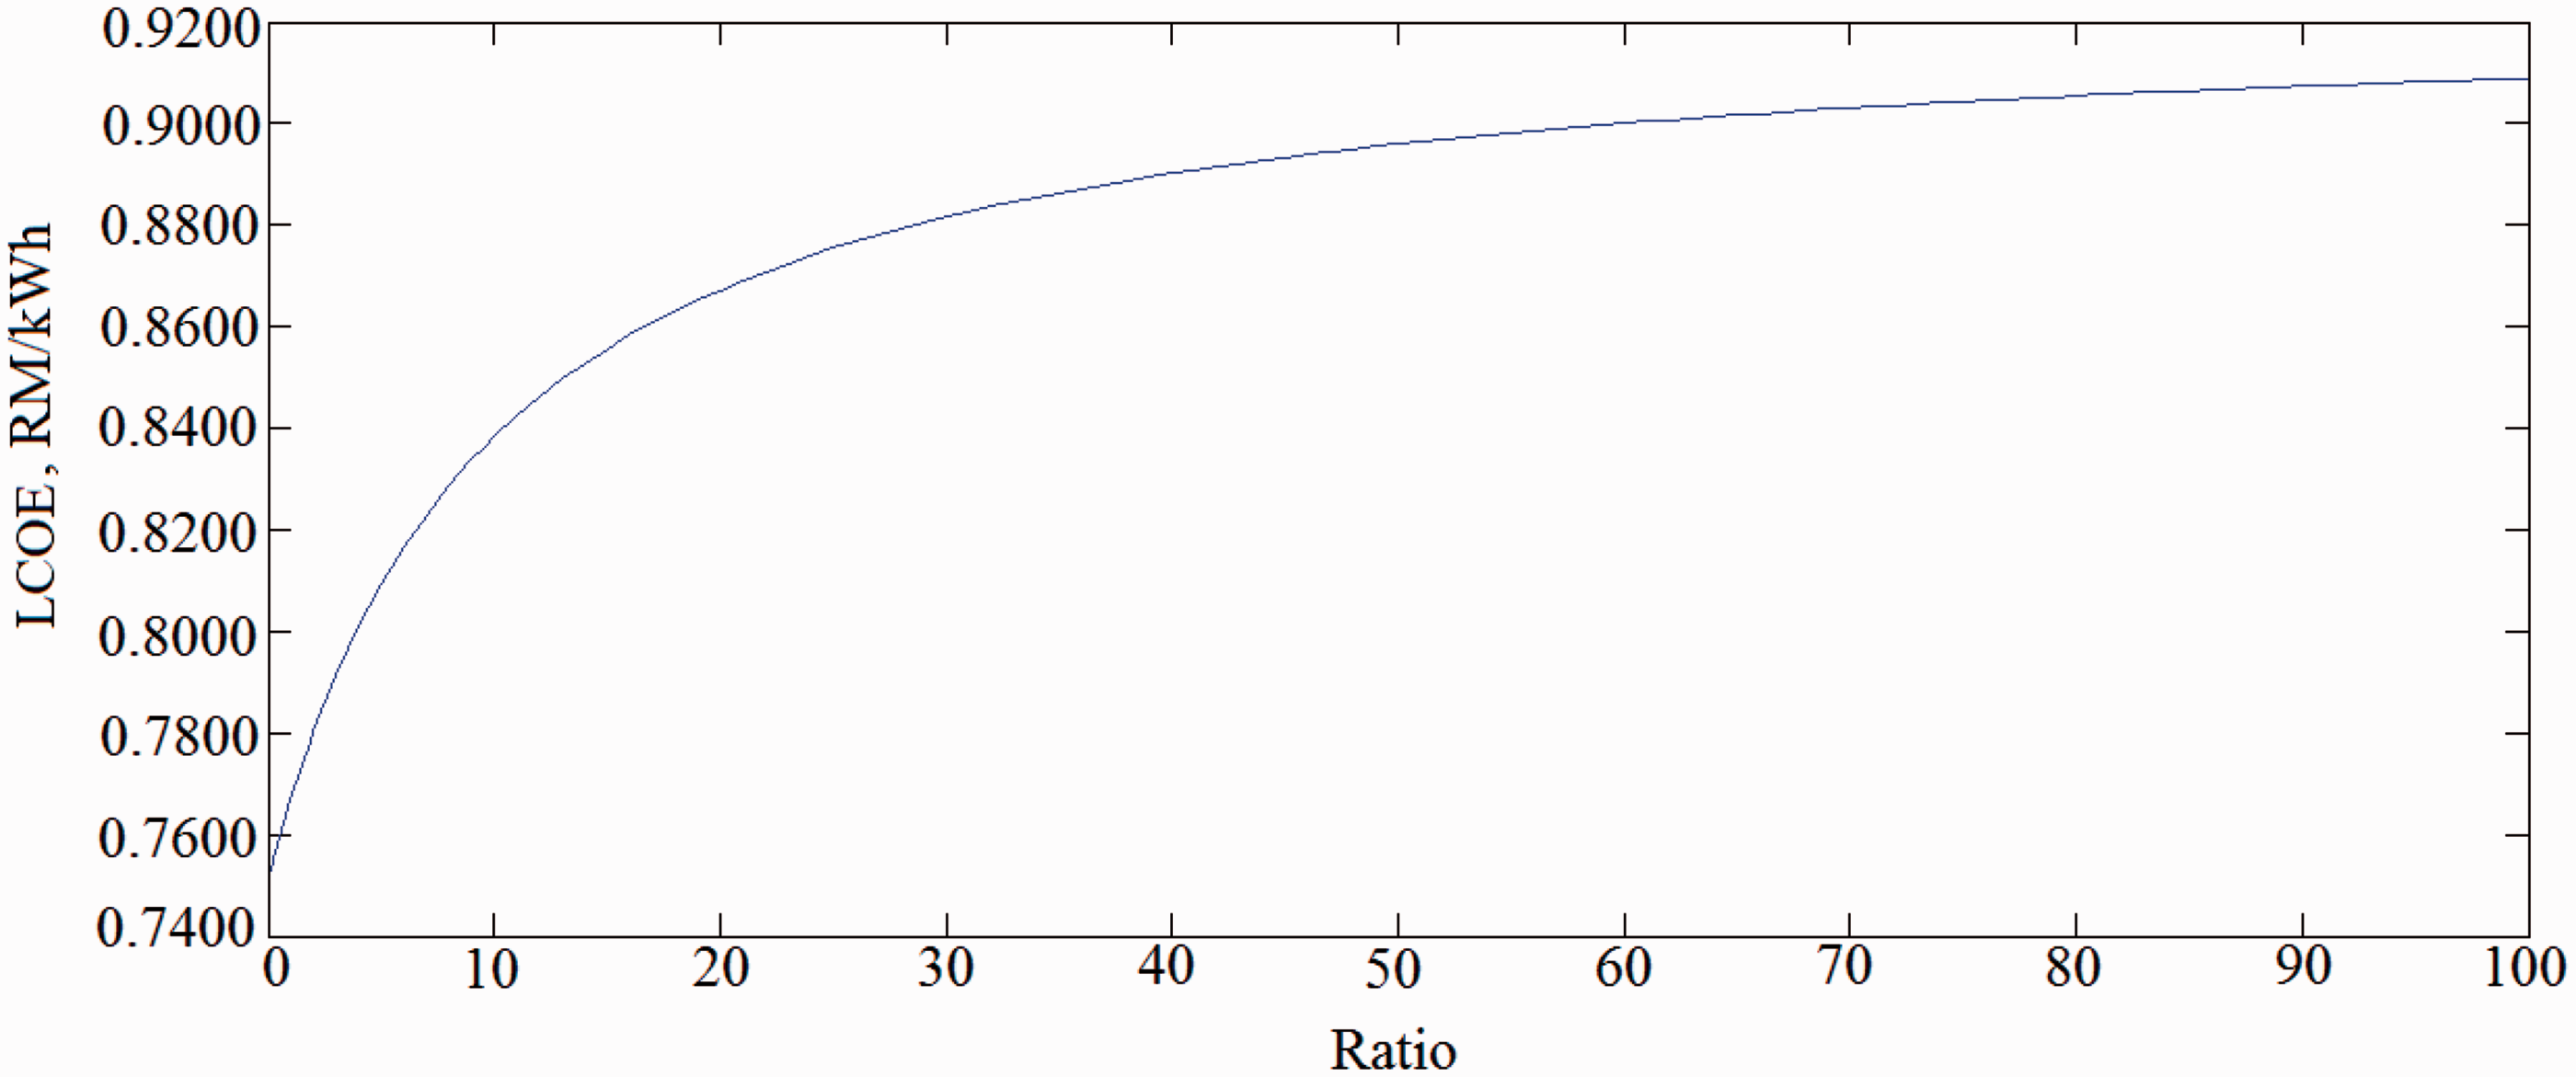
The LCOE for combined scale wind turbines differentiated based on the ratio.
The impact of capital allowance to the level of LCOE was presented in Table 5. The excluding of capital allowance in the LCOE calculation would increase the value of LCOE up to 22.36%, similar for all scenarios.
The LCOE at different wind park scenarios (CF = 20%).
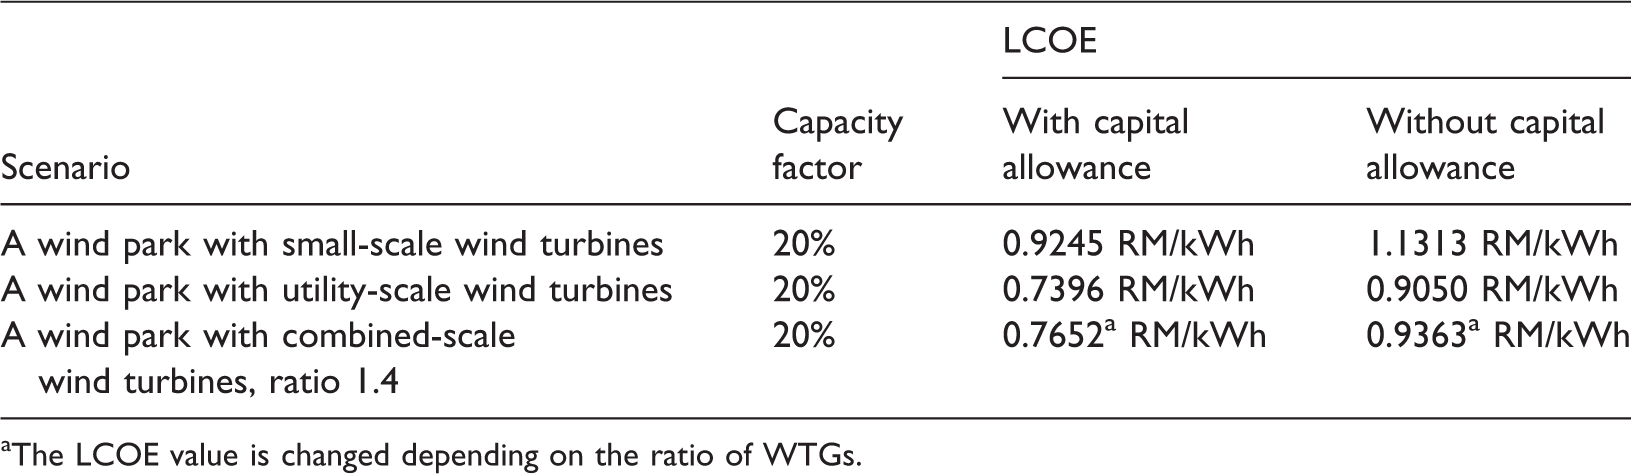
aThe LCOE value is changed depending on the ratio of WTGs.
Table 6 shows the optimal number of wind turbines, energy production, and capacity factors for the generic wind parks. The net capacity factors for a wind park with small and utility-scale wind turbines are 27.70% and 21.72%, respectively. The net CF values for a wind park with combined scale wind turbines were separated for both sizes of wind turbines, which are 32.32% for 14 units of small-scale WTGs and 24.47% for 10 unit of utility-scale WTGs.
The energy production and capacity factors for the different scale of wind park.
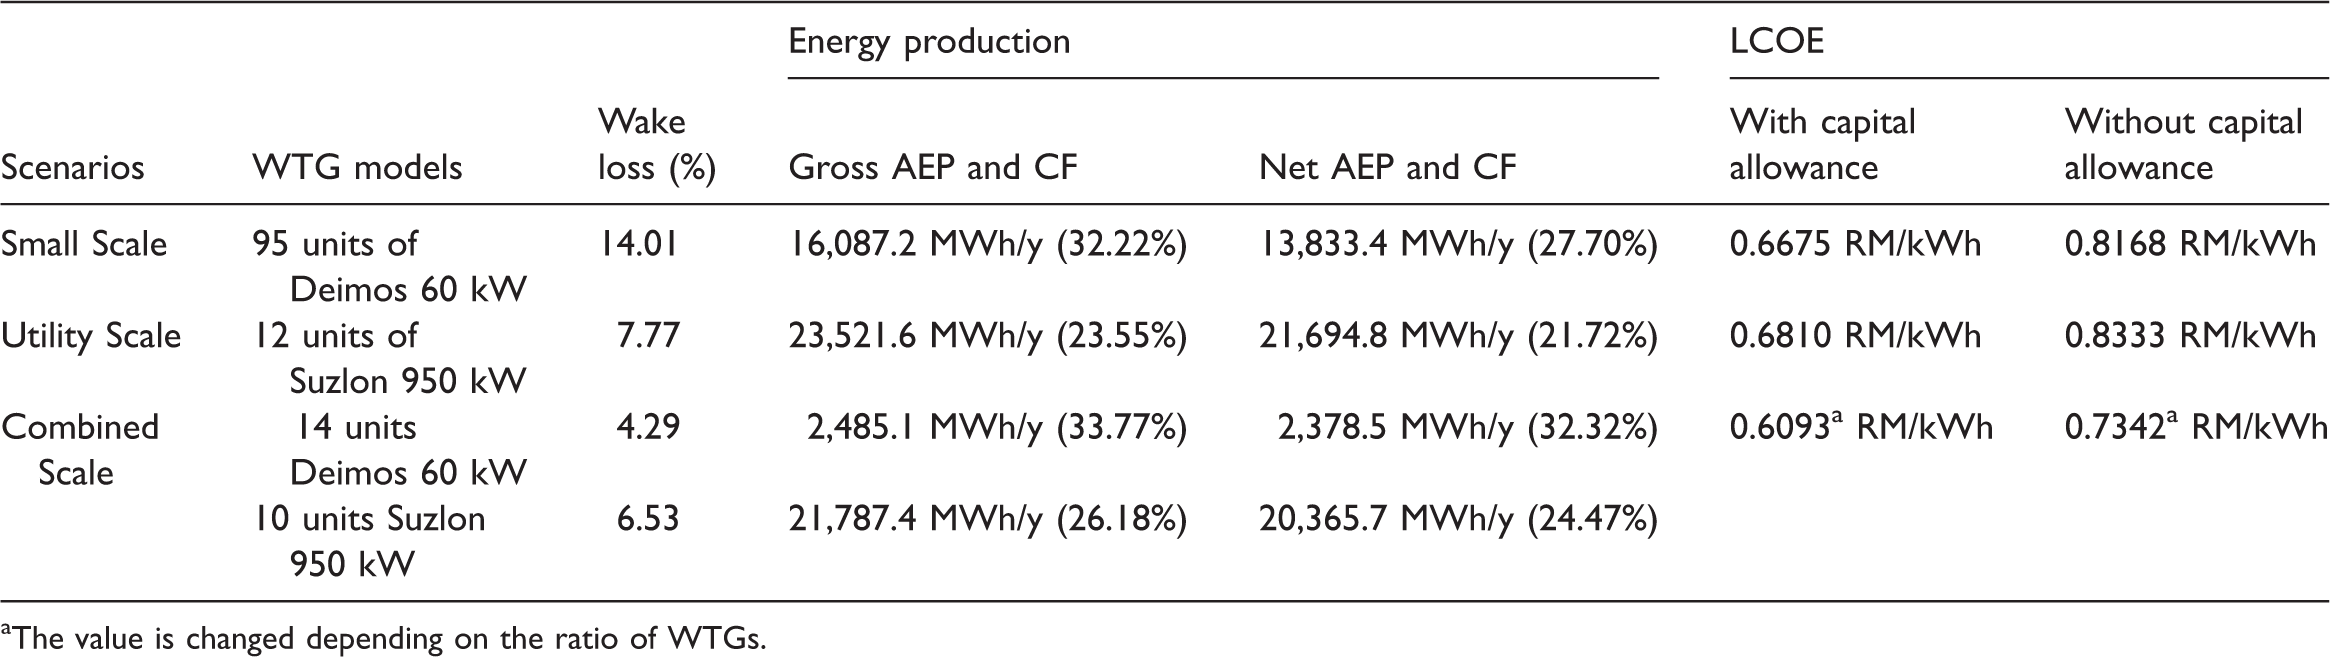
aThe value is changed depending on the ratio of WTGs.
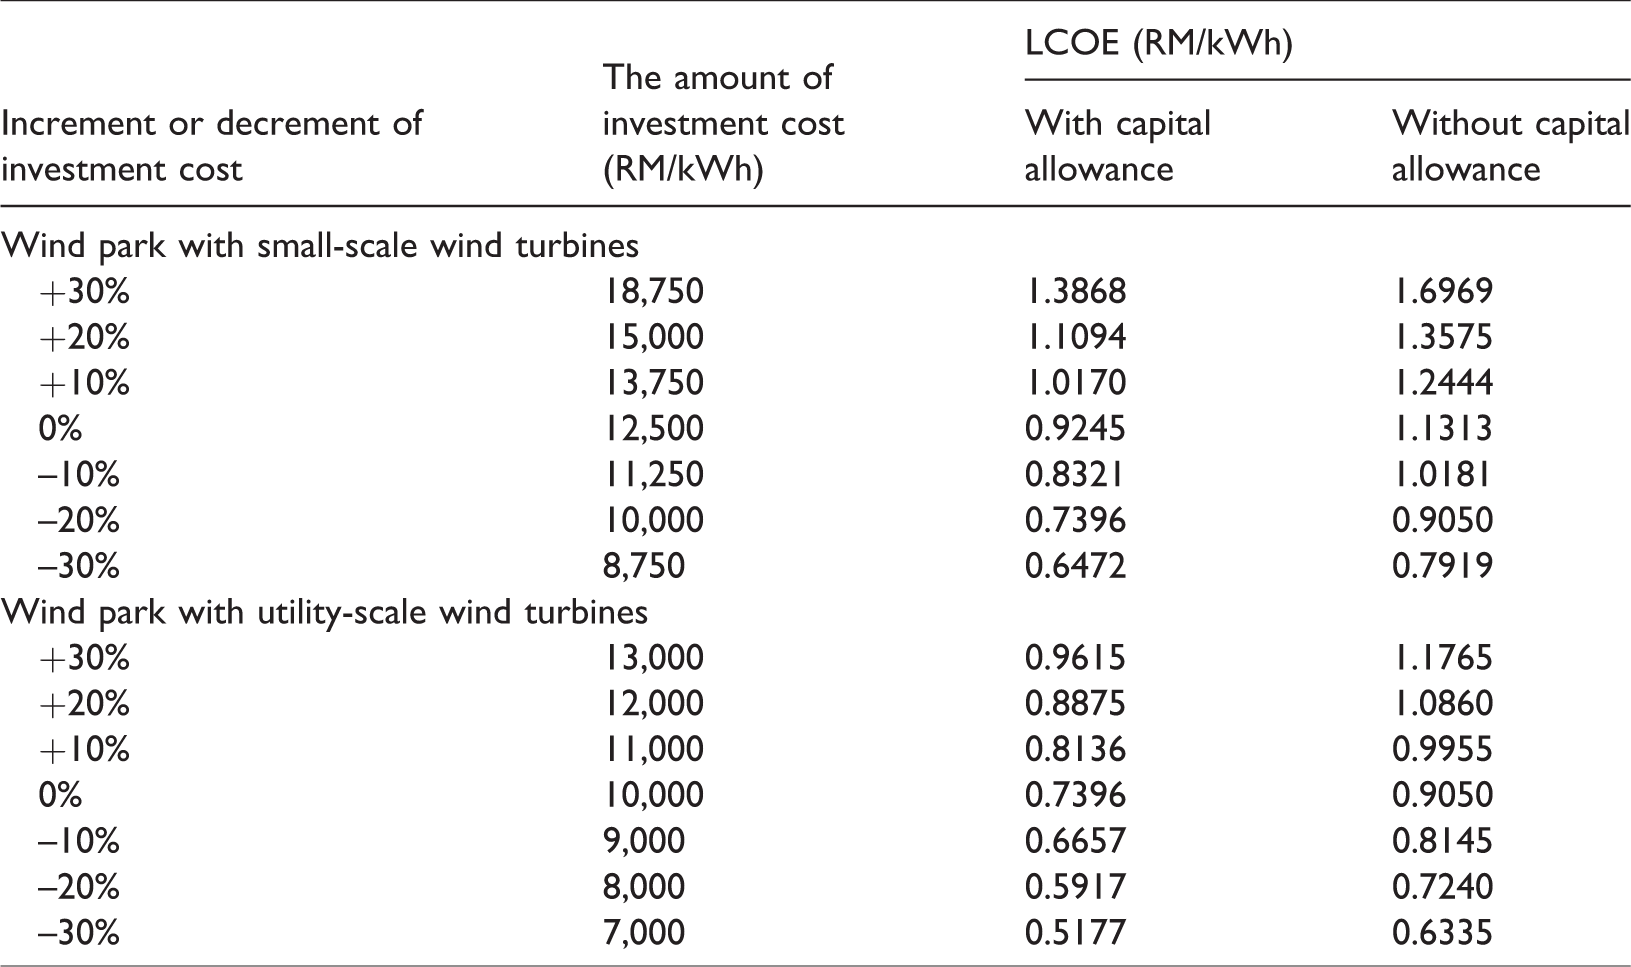
The impact of investment cost on the LCOE
One of the most critical factors in the LCOE closed-form equation is the initial capital cost, as it is the main contributor in the cash-out flow. By referring to the base case (12,500 RM/kWh for small scale wind turbine and 10,000 RM/kWh for utility-scale wind turbine), the sensitivity analysis was up to ±30%. The ±30% is utilized as it would generate the initial investment cost in meeting the range of investment cost that is reported for the wind energy in global, Asia, and Malaysia’s neighboring countries. Table 7 shows that the baseline LCOE increases in accordance with the increment of investment cost. Thus, the LCOE is expected to decrease annually due to the annual degression of wind turbine cost.
The impact of investment cost on the LCOE.
The impact of debt on the LCOE
The relative values of the debt interest rate and the nominal discounting rate will affect the relationship between debt fraction and LCOE. Figure 6 gave an example for a standard loan; when the loan interest rate is lower than the nominal discounting rate (5.81%), the LCOE will decrease with the increment of debt fraction. This happened because of the amount of debts that were discounted throughout the years until loan maturity. The discounted amount of debt would decrease and summed with the non-discounted amount of equity. Then, the total amount would be less than the original amount of initial capital cost with 100% equity.
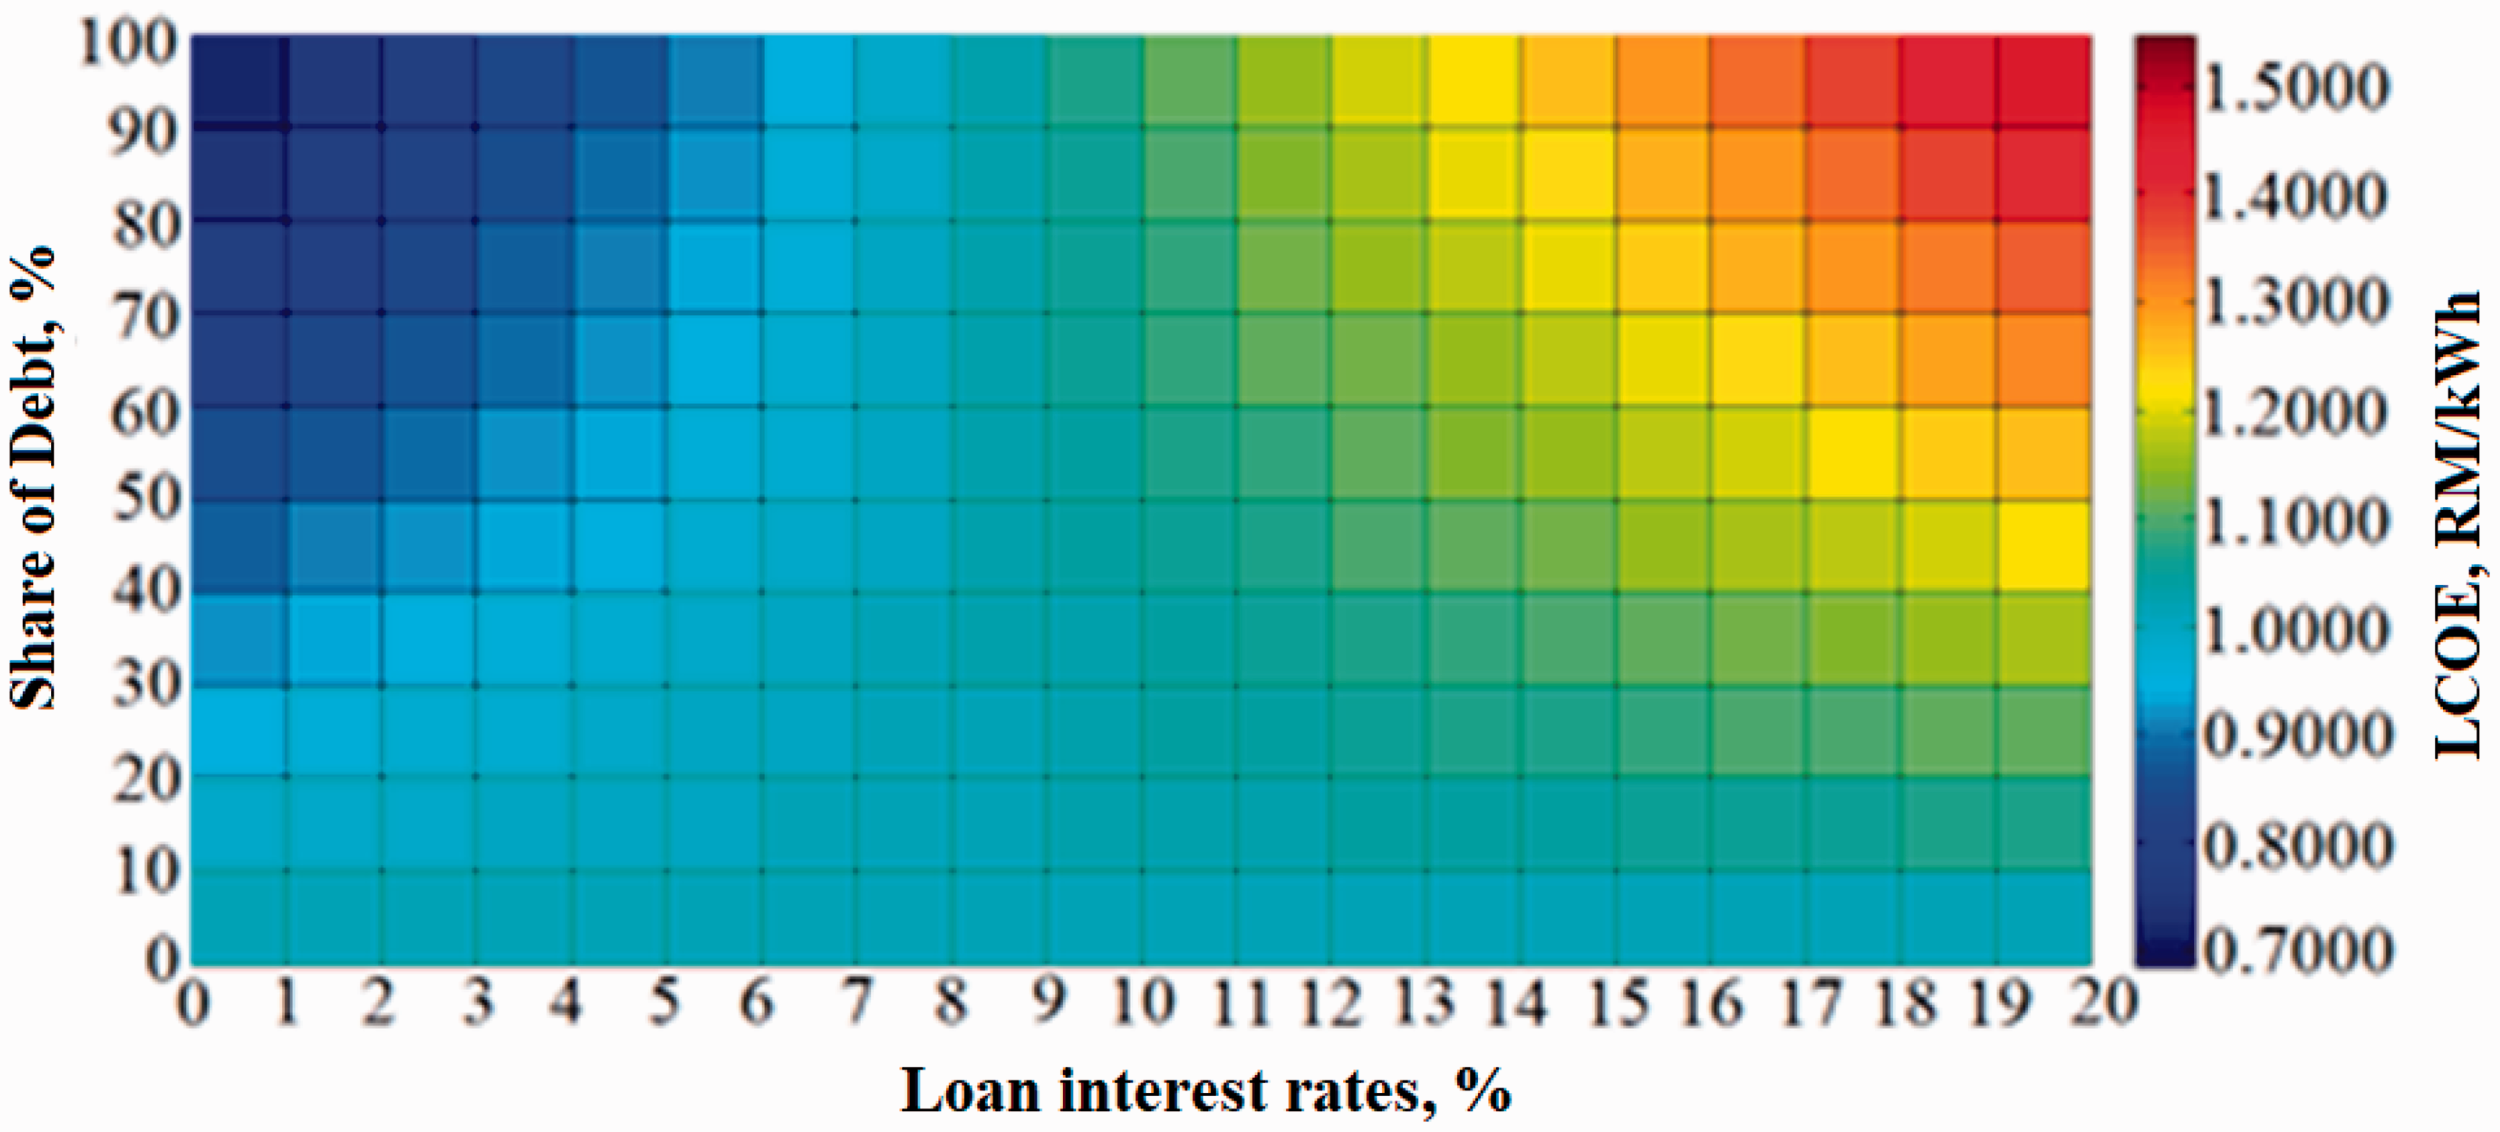
The changes of trend for LCOE when the loan interest rates are higher than the discounting rates.
In other conditions where the loan interest rate is higher than the nominal discounting rate, the LCOE would increase with the increment of debt fraction. This is a reasonable as the debt interest rate would increase the value of cash outflow and LCOE. The increment of the discounting rates would be reducing the present value of cash outflow, while the increment of loan interest rates would be increasing the present value of the cash outflow. The existence of both variables in the loan repayment equation was the reason for the up and down trends as showed in Figure 6.
The impact of capacity factor and discounting rates
The significant risk that would affect any wind energy project is its eligibility in terms of energy production and economic aspect. 48 The nature of wind energy itself is intermittent, and Malaysia is located in a low wind speed region that would worry the potential investor on the risk. The proper design of policy should be able to reduce the eligibility risk. Eligibility risk refers to the risk that a particular project may be deemed as ineligible after the occurrence of significant cash outlays during the project’s development. 49 In order to reduce or eliminate this risk, the government should give some time for conditional determination of eligibility before beginning the wind park construction and operation. Also, clear policy guidelines and rules can reduce the confusion on which types of projects are eligible. Therefore, the floor capacity factor should be introduced and implemented, where 20% is the best minimum capacity factor for the renewable energy project. Figure 7 shows the sensitivity analysis for the impact of CF with the level of LCOE. The LCOE was determined based on the baseline capacity factor; thus, CF has a significant effect on the level of LCOE. The LCOE would increase with the decreasing value of CF. So, for applying the LCOE model to determine the electric tariff, the best baseline CF should be carefully chosen.
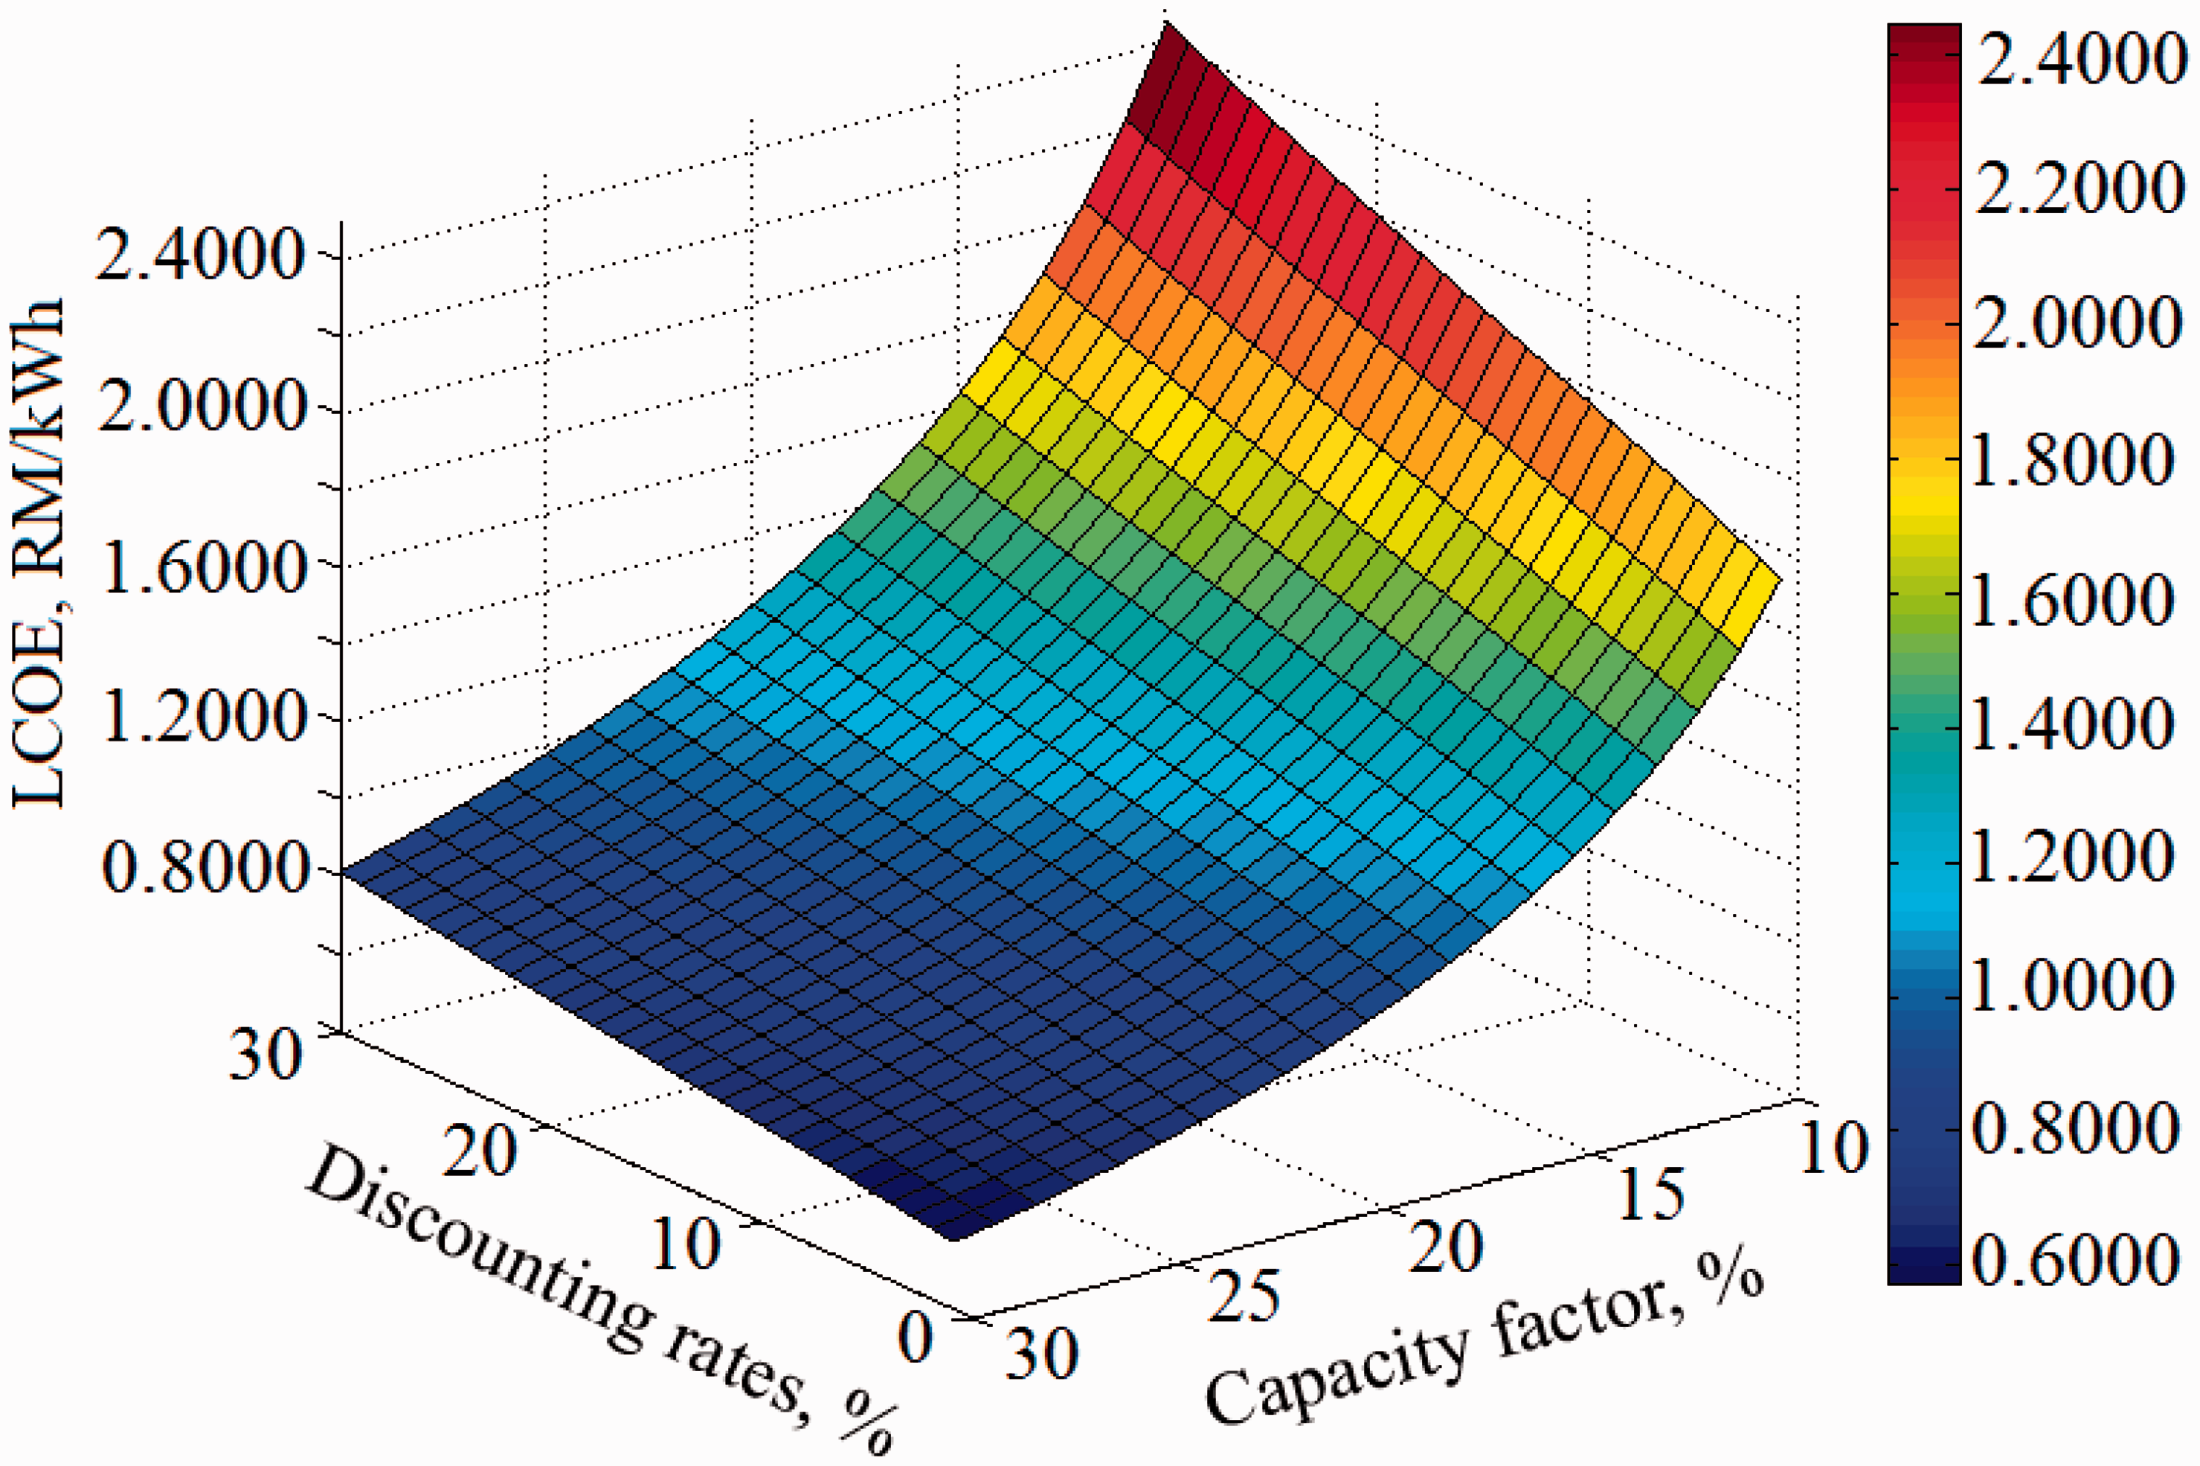
The sensitivity analysis of the discounting rates and baseline capacity factor with the value of LCOE.
Conclusions
Onshore wind energy is one of the newly-highlighted resources for generating electricity in Malaysia since the target of renewable energy in the national energy mix has yet to be achieved.
In this paper, the wind map was developed to define the potential of other sites by using the WAsP flow model. Based on the developed wind map, it was expected that the coastal and highland regions would show the highest value of wind speed. However, since the development of an on-grid wind energy project is not profitable for highland sites due to higher initial investment costs, the focus went to coastal locations only.
A modified closed-form equation of LCOE was developed, and the performance was analyzed. The LCOE would increase with the increase in the values of the initial capital cost (CAPEX), operation and maintenance cost (OPEX), debt interest rates, corporate tax rates, and discount rates. In addition, the LCOE also increases with the decrease of the capacity factor and maturity period of the loan. To reduce the LCOE of wind turbine in low wind speed region, the government could provide a low-interest loan program that can significantly reduce the cost of project supply to support the wind energy project in the country.
Based on the assumed economic parameters and inclusion of the capital allowance, the LCOE at CF is equal to 20% for a wind park with small-scale wind turbines was 0.9245 RM/kWh and for utility-scale wind turbines was 0.7396 RM/kWh. For combined-scale wind turbines, the LCOE would be differentiated based on the ratio between the unit numbers of the small-scale to utility-scale wind turbines. The same ratio would generate similar LCOE, in the case where the ratio is 1.4, the LCOE was 0.7652 RM/kWh. The ratio of WTGs should be reduced to lessen the LCOE for combined capacity of wind turbines.
Footnotes
Declaration of conflicting interests
The authors declared no potential conflicts of interest with respect to the research, authorship, and/or publication of this article.
Funding
The authors received no financial support for the research, authorship, and/or publication of this article.