
Abstract
This article extend the body of knowledge in the environmental sustainability literature by exploring the spillover effect across the United States’ carbon emissions from sectoral energy consumption: from the commercial sector (CEM), transport sector (TEM), industrial sector (IEM), residential sector (REM), electric power sector (EEM). From this perspective, this study accounted for world pandemic uncertainty index (WPU) in retrospect of global episodes (coronavirus pandemic), crude oil price (WTI), and disposable income per capita (DIC). To this end, the novel spillover methodology of Diebold and Yilmaz is employed in the context of the United State for the period January 1996-February 2020. Our Study shows that total spillover effect from the forecast error variance decomposition (FEVD) is 51.1%, while the rest 48.9% of the forecast variance is attributed to the idiosyncratic shocks. Furthermore, a significant contribution of 113.9% spillover effect from uncertainty due to pandemics to TME, IEM, REM, EEM, CEM, DIC, and WTI. Our study adds to the spillover index and computed the net spillover index between the outlined variables that shows the variance between the contribution of spillover to and from the spillover dynamics. Importantly, the study found that WTI, DIC, IEM, EEM, and CEM received a net spillover shock of 63.80%, 25.90%, 48.80%, 26.10%, and 53.3% from the total spillover index. However, WPU, TEM and REM are a net transmitter of spillover effect of 111.7%, 56.90%, and 48.50% respectively. These outcomes are instructive as decision-makers, stakeholders, and players in the energy sector and oil/energy market are required to pay more focus on sectors that are a net transmitter of spillover shocks such as the world pandemic uncertainty and as well those that are net receivers.
List of abbreviations/nomenclature
CEM-commercial sector
TEM-transport sector
IEM-industrial sector
REM-residential sector
EEM-electric power sector
WPU-uncertainty index
DIC-income per capita
WTI-West Texas Intermediate
FEVD-forecast error variance decomposition
DY-Diebold and Yilmaz
GFC-financial crises
EIA-Energy Information Administration
GHG-greenhouse gas
CO-carbon monoxide
CO2-carbon dioxide
GDP-gross domestic product
Introduction
The outbreak of the novel coronavirus (nCOVID-19) could share semblance with the previous pandemics in human history. However, the newness of the COVID-19 disease remained a challenge to health experts (virologists, health researchers, among others), governments, and international governmental agencies, thus further fomenting health, social, environmental and economic hardships. Although the ravaging novel COVID-19 pandemic has so far constituted a severe health and socioeconomic emergencies, evidence from human history also showed the severity of the previous pandemics.1 Moreover, with the global record of almost 33 million infections and 990,586 deaths as reported by the Johns Hopkins University and Medicine2 on 26 September 2020, the economic impact of the COVID-19 pandemic has jeopardized the once optimistic economic outlook of 2020. So far, COVID-19 has created a varying degree of uncertainty, thus leaving most governments with the trade-off options of either implementing strict measures (such as ‘lockdown’, maintaining ‘social distancing’, travel restriction/suspension) or partial restrictions to minimize economic damages.
In spite of the global market uncertainty and possible loss of millions of United States dollars (USD) to the COVID-19 pandemic, the expectedly lower pollutant emissions due to restricted sectoral activities (including transportation sectors, energy sectors, financial sectors and institutions, and the industrial sectors) is a relief to the ecosystem. In specific, 8% decline in the global emissions in the first four months of 2020 is a reflection of familiar experience that is associated with the leading world carbon dioxide (CO2) emitters: China declined by 315 million tonnes of CO2 (from 3563 to 3248), the United States dec1ined by 138 million tonnes of CO2 (from 1753 to 1615), European Union (EU)-27 and United Kingdom declined by 145 million tonnes of CO2 (from 1153 to 1008), India declined by 65 million tonnes of CO2 (from 896 to 831), and a decline of 24 million tonnes of CO2 (from 560 to 538) by Russia.3 In the case of the United States where the West Texas Intermediate (WTI) (future) crude oil price plunged below (zero) 0 USD on 20 April 2020,4 the energy-driven sectors in the country remained vulnerable to the spillover effect of the pandemic-induced uncertainty. Evidently, Bakas and Triantafyllou5 found that there is a negative impact of economic policy uncertainty during pandemic on the volatility of crude oil markets and other commodity markets. Similarly, consistent studies have linked socio-economic challenges with the rampaging effect of the COVID-19 pandemic in the United States and other part of the world.6–8 However, Balsalobre-Lorente et al.9 examined the impact of COVID-19 pandemic from the dimension of economic and social isolation of the Chinese economy. Importantly, the study posited that the Chinese economy is not strongly responsive to pollutant-driven economic growth, thus making the supposed Chinese isolated economy less damaging to the economy of the country.
Considering that a higher greenhouse gas (GHG) emissions is normally associated with the transportation, electricity, industrial, and the commercial-residential sectors of the United States’ economy,10 a significant spillover effect resulting from the pandemic-induced uncertainty is expected. Thus, the current study objectively examined the spillover effect in the United States’ CO2 emissions across sectors (transportation, industrial, residential, commercial, and electricity and power), the WTI crude oil price, and the pandemic uncertainty. By using the Diebold and Yilmaz11 to illustrate the spillover effect between the carbon emissions, WTI oil price and pandemic uncertainty, this study expectedly presents a novel contribution from at least two perspectives. A sectoral decomposition of carbon emissions alongside the crude oil price is examined from the perspective of spillover effect as a contribution to the literature on environmental sustainability. In addition, illustrating the spillover effect from pandemic uncertainty to both the crude oil price and CO2 emissions is the first in the literature, thus emphasizing the strong connectivity between the rampaging pandemic and the sector-related factors. The study also add in terms of scope by examine the US as a case study. On the methodological front, the Diebold and Yilmaz method is selected based on its uniqueness over other volatility model in the literature, on the premise of its ability to capture both secular and cyclical movement over full-sample period. This study is timely and worthwhile as the US show dynamic energy episodes. Thus, the current study is billed to expand the recent and related studies on COVID-19 pandemic.12,13
Progressing further, an outline of the other sections of this study is presented accordingly: the next section detailed the method employed in the study while the result of the investigation is outline in the Empirical results interpretation section. Lastly, the conclusion and policy directive are described in the Conclusion and policy implications section.
Data and method
Diebold–Yilmaz11 methodology framework
The present study is constructed on the novel spillover method of Diebold and Yilmaz to quantify spillover effect between carbon emissions from energy consumption on a sectoral basis from the commercial sector, transport sector, industrial sector, residential sector, electric power sector. This study also accommodated for world pandemic uncertainty index in context of global episodes, crude oil price, and disposable income per capita. The study data are on monthly basis from January 1996 to February 2020, for Real disposable income: FRED (Income that people get from wages and salaries, Social Security and other government benefits, dividends and interest, business ownership, and other sources. These statistics can offer clues to Americans' financial health and future consumer spending) Chained 2012 Dollars, Seasonally Adjusted Annual Rate. Carbon emissions: EIA (Million Metric Tons of Carbon Dioxide), WTI: FRED (Spot Crude Oil Price: West Texas Intermediate (WTI), Dollars per Barrel, Monthly, Not Seasonally Adjusted) and WPU formulated by accumulating number of times uncertainty mention within a close range to the word pandemic in the Economist Intelligence Unit (EIU) country reports.a
This study as earlier mentioned is built on the novel Diebold and Yilmaz (DY, hereafter) to capture all spillover effect between this study outlined variables under consideration. The DY methodology is peculiar in terms of its less computational requirements relative to other known volatility models, which aid in quantifying economic/financial characterization across different events and episodes of the full sample. The DY index is built on the vector autoregressive (VAR) model and variance decomposition setting. The earlier version of DY in 2009 is sensitive to ordering of variables by Cholesky factorization. All aforementioned are ameliorated in the DY 2012 version that is time invariant to ordering after the study of (see Koop et al.,14 Pesaran and Shin15). The DY method is built on a stationary VAR (p) process. The VAR (p) process is constructed as;

Where,
Empirical results interpretation
This section advances with the preliminary interpretation of the outlined variables under review. The need for preliminary investigation is needed to know how the data fare. Table 1 presents the basic summary statistics and Pearson correlation analysis to analyze the pairwise relationship between the outlined variables. Disposable income per capita shows the highest average followed by electric and industrial energy sector while world pandemic uncertainty is ranked with the lowest means over the full sampled period. The suggest that the economy of the US has an average of 37524$/monthly which is quit revealing as shown by our study. All the examined variables shows positive skewedness with the exception of energy from the transportation sector that is negative skewed. Furthermore, in terms of peakness of dataset all variables are light tail with kurtosis less than 3. For the pairwise correlation between the outlined variables, a significant relationship exist between all variables. For instance, we observe a positive significant relationship between disposable income per capita and world pandemic index (r = 0.366) which is indicative to government administrators and policymakers of the US. This position is also resonated in Figure 1 between disposable income per capita and world pandemic uncertainty. We observe a positive trend between disposable income per capita with exception of sharp decline in mid-2008 to early 2009 in the graphical plot. The plausible reason is attributed to the global financial crises (GFC) period while on the other hand, world pandemic uncertainty fluctuates somewhat. Thus, suggesting a threat to available income level for citizenry in terms of high economic uncertainty like the pandemic prone times. Additionally Figure 1 shows high volatility between all sectorial energy consumption over the full sample period investigated as measured by their variance. Worthy of mentioned here is that all variables are adequately adjusted for seasonally to circumvent for spurious analysis and policy inferences accordingly.c
Pearson correlation and descriptive statistics.
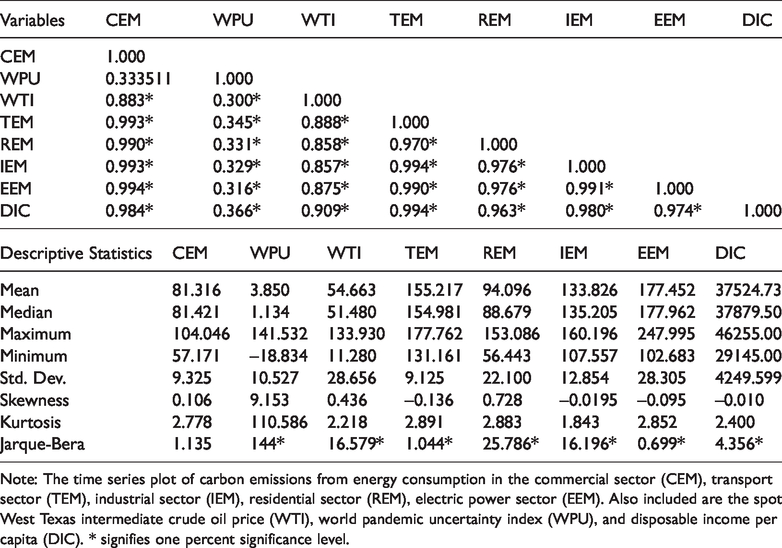
Note: The time series plot of carbon emissions from energy consumption in the commercial sector (CEM), transport sector (TEM), industrial sector (IEM), residential sector (REM), electric power sector (EEM). Also included are the spot West Texas intermediate crude oil price (WTI), world pandemic uncertainty index (WPU), and disposable income per capita (DIC). * signifies one percent significance level.
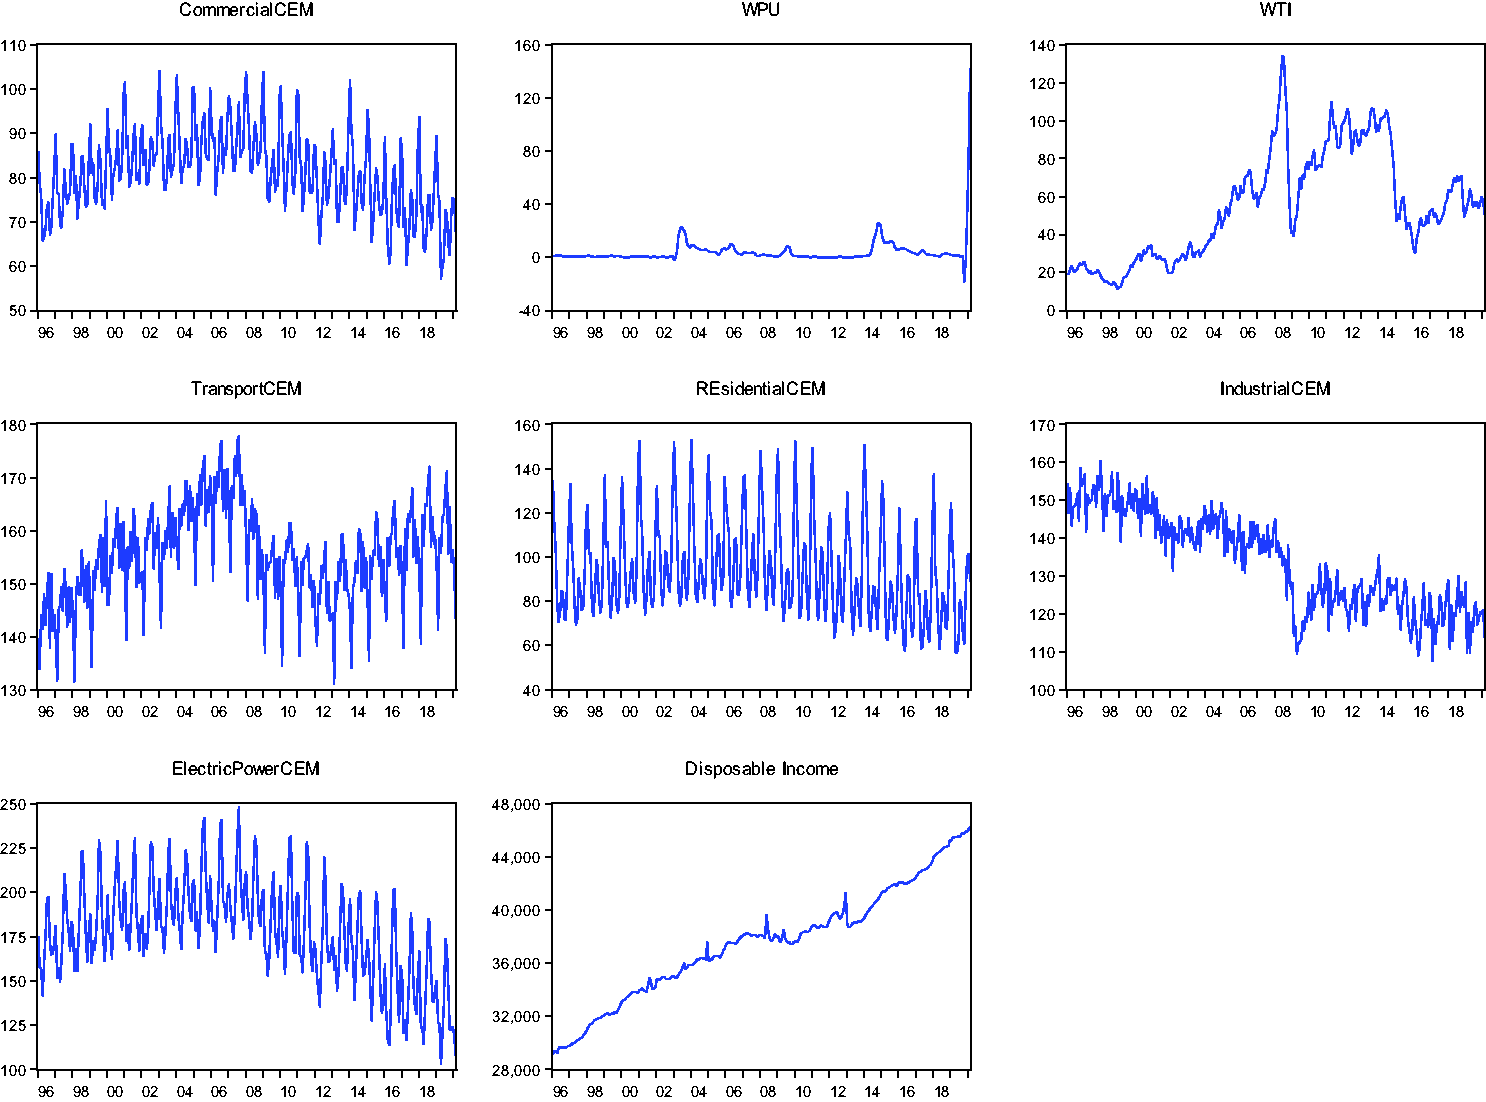
The time series plot of carbon emissions from energy consumption in the commercial sector (CEM), transport sector (TEM), industrial sector (IEM), residential sector (REM), electric power sector (EEM). Also included are the spot West Texas intermediate crude oil price (WTI), world pandemic uncertainty index (WPU), and disposable income per capita (DIC).
Subsequently, we proceed to build the DY results with a 10-step (
Empirical results from the interconnected spillover analysis in Table 2 shows over 50% spillover effect over the full sampled forecast horizon precisely 51.1%. This suggest that a slightly above average interconnectedness between the variables under review and the macroeconomic indicator (per capita disposable income). On the other hand, the over 48.9% of the total forecast variance is left to the idiosyncratic shocks. This finding is consistent with the study see (interalia Balcilar and Bekun17). The spillover in Table 2 presents a twin side results of both “contribution to others” computed by addition of off-diagonal column while for “contribution from others” is the sum off the rows accordingly. The both directional analysis can either be to and from the total forecast. It is worthy of mention here that all values of the table captures the individual spillover effect except the main diagonal. The DY analysis is somewhat similar to the input-output tables where variables examined its shock impact can identify transmitters and absorbers of shock over samples period
Spillover table.
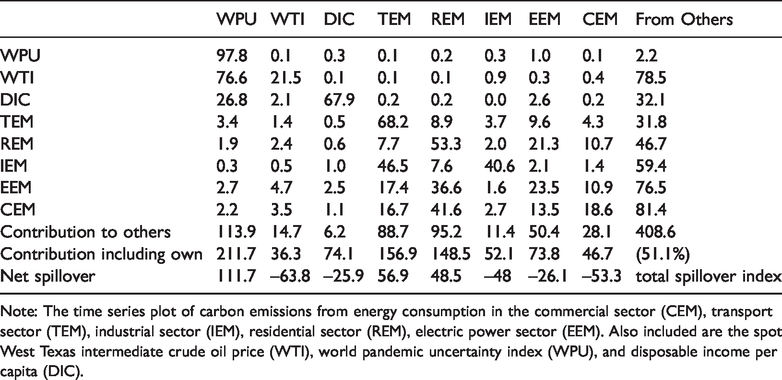
Note: The time series plot of carbon emissions from energy consumption in the commercial sector (CEM), transport sector (TEM), industrial sector (IEM), residential sector (REM), electric power sector (EEM). Also included are the spot West Texas intermediate crude oil price (WTI), world pandemic uncertainty index (WPU), and disposable income per capita (DIC).
Investigation into the individual directional spillovers from its row in Table 2 shows that industrial energy sector reports the highest spillover to the forecast error variance decomposition (FEVD) with magnitude of 0.3% closely accompanied by residential energy sector with 0.2%. World pandemic uncertainty index exhibits the highest contribution to the FEVD in terms of emissions to various sectorial emissions. Residual emissions followed with industrial sector are less responsive. The plausible explanation is given to the less industrial activities and closure of factories in period of severe pandemic attack like the SARs period. Furthermore, spillover contribution from others presents pollutant emissions from commercial sector on the FEVD followed by electric power sector
Furthermore, according to the spillover interconnectedness Table 2 shows that Crude oil (WTI), disposable income per capita, industrial energy and commercial sector are net receivers of spillover shocks while on the other hand, world pandemic uncertainty index, residential sector and transportation are considered new givers of spillover effect over the sampled horizon. This outcome is insightful for policy directive in the energy market. For instance, world pandemic uncertainty index contributes over 113% spillover shocks to other indicators examined as the net giver of the spillover shocks will be transmitted to other energy-emission sources. Our study adds to the spillover index and computed the net spillover index between the outlined variables that shows the variance between the contribution of spillover to and from the spillover dynamics. The net spillover reveals more insights and interesting outcome for the United State as WTI contributes 63.80%, DIC 25.90%, IEM 48.80%, EEM 26.10%, and CEM 53.3% to the total spillover index as net receiver of spillover shocks while on the other hand, WPU, TEM and REM are a net transmitter of spillover effect with WPU contributing 111.7%, TEM 56.90% and REM 48.50%. These outcomes are instructive as decision-makers, stakeholders, and players in the energy sector and oil/energy market are required to pay more focus on sectors that are a net transmitter of spillover shocks to other sectors like world pandemic uncertainty and emissions from the transport sector that spillover to others like crude oil price and other net receivers. Thus, from policy standpoint the need to insulate against global pandemic uncertainty, which is pertinent especially given the huge spillover from, sectors like industrial and commercial sector. Additionally, crude oil (WTI) also shows not to be absorber of spillover. This explains the recent oil glut of global oil prices crashing to zero.
An insight into the spillover analysis illustrate the average spillover effect over the sampled period. The DY analysis is flawed with its in ability to capture secular and cyclical movement in spillover. Thus, the rolling widow analysis comes handy as it expresses the time –varying analysis. The current study uses over 200 month sub-sample to quantify economic episodes/events from Figure 2 shows strong interconnectedness between the examined sectorial emission from industrial, transport, electric, residential and commercial with disposable income per capita and crude oil prices for the US. Table 2 shows a sharp decline in 2013–17 that resonates the global pandemic of bird and Ebola outbreak respectively which ha d it toll on sectoral energy emission dynamic s of the US.
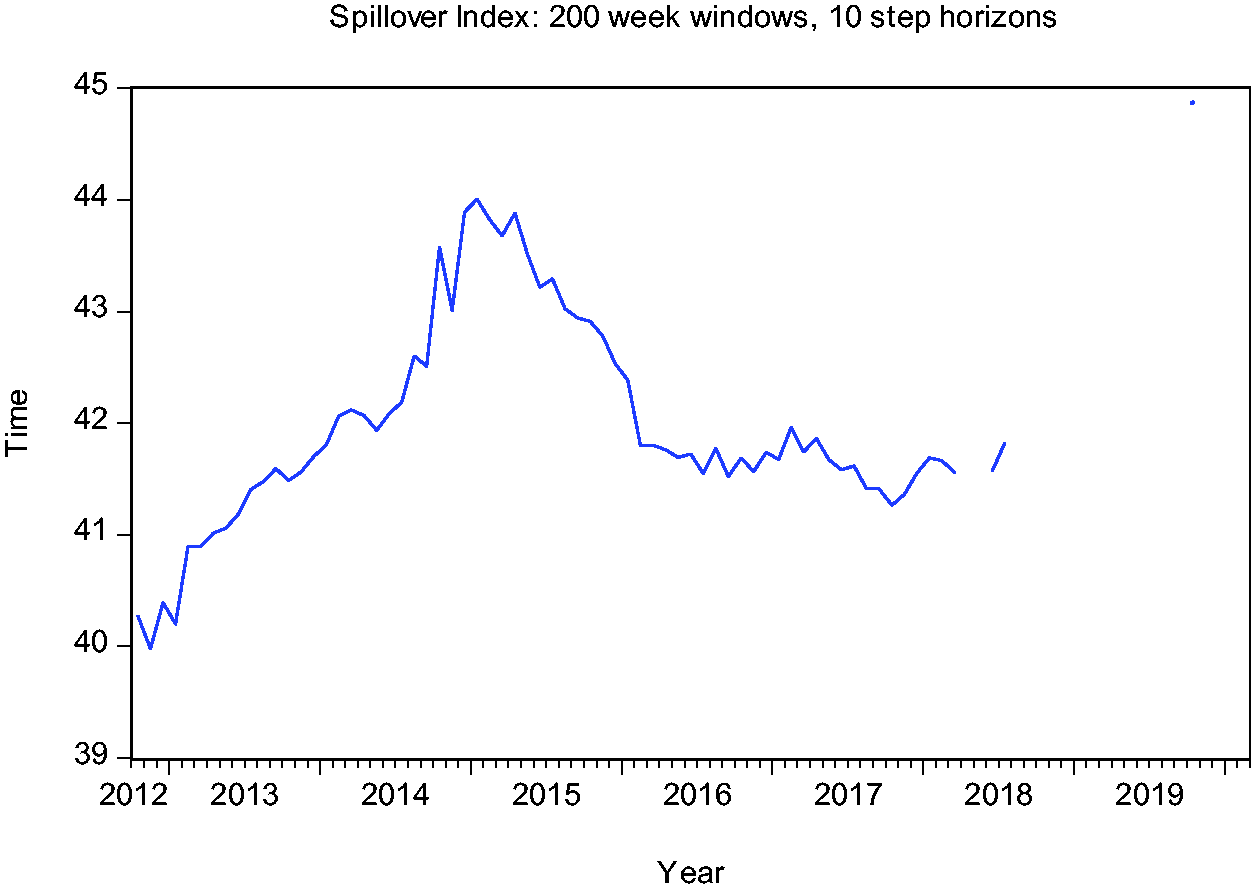
Rolling window with 200 week windows and 10 steps horizons.
Conclusion and policy implications
Using Diebold and Yilmaz approach and monthly realized data for sectoral emissions from energy consumption mainly from the commercial sector (CEM), transport sector (TEM), industrial sector (IEM), residential sector (REM), electric power sector (EEM) for the US, the spillover effect is investigated. To achieve this desire, the West Texas Intermediate crude oil price and disposable income per capita were incorporated such that the interconnectedness between these variables while accounting for during the episodes of uncertainty measured by world pandemics for the case of the United States. The Diebold and Yilmaz spillover index offered four unique indices namely (i) total spillover effect (ii) Pairwise spillover effect (iii) directional spillover effect and (iv) Net spillover effect. Furthermore, to view all cyclical and secular episodes, the rolling window analysis presents a robust analysis, which the current study offered. Importantly, the result found that the uncertainty due to world pandemic contributes over 113% spillover and a net spillover shocks to other examined indicators and a total spillover index of 51.1%. Furthermore, this study adds the net spillover index that shows both net absorbers and net receivers of spillover shocks among the outlined variables. Importantly, we observe that WTI received the largest net spillover shock of 63.80%, while DIC, IEM, EEM, and CEM received a respective spillover shock of 25.90%, 48.80%, 26.10%, and 53.3% from the total spillover index. On the other hand, WPU, TEM and REM are a net transmitter of spillover effect with WPU contributing (largest share) of 111.7%, TEM contributing 56.90% and REM contributing 48.50%. These outcomes are instructive as decision-makers, stakeholders, and players in the energy sector and oil/energy market are required to pay more focus on sectors that are a net transmitter of spillover shocks to other sectors like world pandemic uncertainty and emissions from the transport sector that spillover to others like crude oil price and other net receivers.
From the policy perspective, measures should be taken by the United States government to minimize the vulnerability of the energy sectors especially the industrial, electric power and commercial sector to unforeseen natural event and global market volatility. In addition, palliative measures and other relief policies should be geared at cushioning the effect of externalities.
Footnotes
Acknowledgements
Author gratitude is extended to the prospective editor(s) and reviewers that will/have spared time to guide toward a successful publication.
Declaration of conflicting interests
The author(s) declared no potential conflicts of interest with respect to the research, authorship, and/or publication of this article.
Funding
The author(s) received no financial support for the research, authorship, and/or publication of this article.