
Abstract
The joint behavior of internal and external system brings out a high complexity of the carbon and oil price interactions, such as non-linearity and multi-frequency. This paper innovatively proposed a time-frequency mechanism between carbon and oil markets from the two aspects of internal system and external factors, and introduced a novelty partial wavelet analytics to explore their dynamic multi-scale interactions. We selected the European carbon and Brent oil futures prices data from March 2009 to December 2020, with the consideration of several necessary control variables from the external surroundings. Our findings point to a stable and strong in-phase relationship between the two markets, with oil leading at medium and lower frequencies. However, the mutual leading relationships are especially sensitive during abnormal political events and periods of financial recession and global emergency, which are observed at different periods for intermediate horizons. What is more, the interactions are more diversified and feebler at short-timescale. Under the vision of carbon neutrality, these evidences provide invaluable guidance for regulators to structure a more flexible adjusting mechanism for the risk control of carbon markets, and also help investors to hedge risk aimed at different time horizons.
Introduction
The economic development mode highly dependent on fossil fuels has led to increasing greenhouse gas emissions, which has become one of the causes of environmental problems such as global warming and extremely bad weather. When the novel corona-virus is sweeping across the world, natural disasters such as mountain fire in Australia, locust plague in Africa, flood in Indonesia, and avalanche in Iran have taken place one after another, which are closely related to climate change. 1 Even worse, the affairs of outburst public hygiene from COVID-19 have brought great impact on the world economy, which has been the most destructive after than the Global Financial Crisis of 2008. 2 However, even though in the face of increasing economic downward pressure and increasingly complex international political environment, carbon neutrality a has become a global voice. 3 Up to 8 November 2020, 126 countries have committed themselves to achieving carbon neutrality by the middle of the 21st century, such as Britain, the European Union, China, and Japan. 4 Most countries propose to shift energy supply from traditional fossil fuels to renewable energy to optimize the energy consumption structure, and strive to develop a carbon emission trading market to effectively control greenhouse gas emissions.
The carbon emission trading, being one of the measurements to be marketization, is proposed to deal with global climate and environmental problems. According to the State and Trends of Carbon 2,02,046 countries and 32 regions have implemented the carbon pricing mechanism of carbon-reduction trading and carbon taxes worldwide. The European Union Emissions Trading Scheme (EU ETS), representing the EU’s climate change policy, is one of the most comprehensive schemes. 5 The EU ETS has emerged as the largest international emission allowance market representing 84 per cent of the global carbon market value. 6 Moreover, the information efficiency of the EU carbon market is higher than that of China’s carbon markets. 7 As such, its trading price reflects the price trends in the global carbon market. However, as a matter of fact, in the face of multiple complex internal and external influencing factors, such as emission reduction regulations, energy prices and macroeconomic shocks, there exist violent fluctuations in the carbon price. The carbon price volatility does not only weaken the confidence of investors, but also increase the difficulty of implementing market stability policies, and fundamentally affects the development tendency of the global carbon market and the realization of carbon neutrality. Therefore, how to formulate a scientific and effective mechanism of carbon price management is a serious challenge for the carbon market.
Under the goal of carbon neutrality, the carbon trading system is to motivate enterprises to reduce fossil-fuel-based energy consumption and increase investment in clean, low-carbon technologies or adopt renewable energy. It thereby introduces a complex system of linking carbon prices and energy markets. Although new energies emerge with the development of science and technology, oil is still one of the most dominant energy sources in the world. The BP statistics show that oil market accounts for about 34% of global energy consumption in 2019. The International Energy Outlook 2016 (IEO2016) has also predicted that global crude oil consumption will rise from 45.5 million barrels per day in 2012 to 46.1 million barrels per day in 2040. As a kind of special energy source, oil has many attributes, including resource value, commodity value and financial implications. 8 The oil price is the important elements to influence the world economy 9 and could produce spillover effects to many international macroeconomic factors.10–12 Being the primary international financial products and energy-oriented products in the low-carbon economy, the shifts of oil price inevitably affect the development status and situation of the international carbon trading market. Chevallier 13 and Koch 14 have found that oil price volatility has emerged as a crucial factor causing substantial changes in emission prices. Compared to other energy variables, Byun and Cho 15 documented that oil prices have more information content about the following day’s carbon futures volatility and hence exhibit good forecasting performance. Conclusions of Ji et al. 16 also showed the pivotal role of crude oil price in the carbon-energy system.
In this paper, we put an emphasis on exploring the mechanisms of carbon-oil price interactions. Although the previous studies have investigated the correlations and causality between carbon and energy markets with traditional time series approach, there is lack of researches in these markets interaction mechanism from the point of time and frequency characteristics, which may attribute to the different participants within the system and the external factors. Generally speaking, there are various types of participants in the carbon and oil markets, including policymakers, regulated enterprises, financial institutions, hedgers or speculators. Also, there exist significant heterogeneities among these different market actors, which could lead to different behavioral cycle and result in the multi-scale feature of market price returns.17,18 In this context, it is no doubt that there is a strong practical need for mining interaction information at different time horizons for investors and regulators with heterogeneity. On the other hand, the external influencing factors, such as the stock market, non-energy commodity markets and interest rate market, are closely connected with both the energy market and carbon market. 19 Because these structured market data have the dual characteristics of time and frequency, consequently, a complex interaction between the carbon and oil markets will also consist in different time scales after controlling the external factors.
Considering the internal system and external factors, we firstly propose a theoretical framework for the mechanism of carbon-oil price interactions from an innovation time-frequency perspective. And then, we employ partial wavelet analytics to probe into the magnitude and direction of the nexus between carbon and oil markets in different time-scales. This wavelet method not only can offer significant advantages over decomposing the time series into time-frequency domain components and extracting the data features implicit in various frequency scales, 20 but also could eliminate the influence of external factors and obtain accurate results and efficient econometric inferences 1 from the interactions between carbon and oil markets. By doing so, this study expands the theory and methodology of researches on price management mechanism of carbon assets, and pertinently offers specific implications for the related market practitioners.
The reminder of the article is organized as follows. Literature review section provides a brief literature review on the nexus studies between carbon and oil markets. Theoretical framework section sets up the theoretical framework. Methodology section outlines the detailed methodology and formulation process. Empirical analysis section describes the dataset, reports and discusses the empirical results. Finally, the conclusions and implications are drawn in Conclusion and implications section.
Literature review
With the implementation of EU ETS, currently, there has been a wealth of literature considering the pricing mechanisms in the carbon market, particularly for the influencing factors of the carbon price, such as macroeconomic situations, energy prices, major events and weather conditions.21–24 Apart from the influence factor investigation, a number of scholars have shed light upon the volatility characteristics and risk measurement of the carbon price. And they found there are highly non-stationary, nonlinear, multi-scaled features and time-varying jump behavior of carbon prices.25–28 Additionally, scholars have also paid a lot of attention to the interactions between carbon market and other markets, such as stock market, energy market and commodity market.13,14,16,19,29,30 More particularly, the interactions between the carbon market and crude oil market have become an increasing issue within the field of energy and environment research, which presents the following characteristics.
As shown in Table 1, previous studies on the interactions between carbon and oil markets yielded mixed and often conflicting results, due to different research objects, frequency of data, sample periods and model specifications. Generally, the main research contents can be divided into two categories: correlation and causality.
Overview of the previous studies on the interactions between carbon and oil markets.
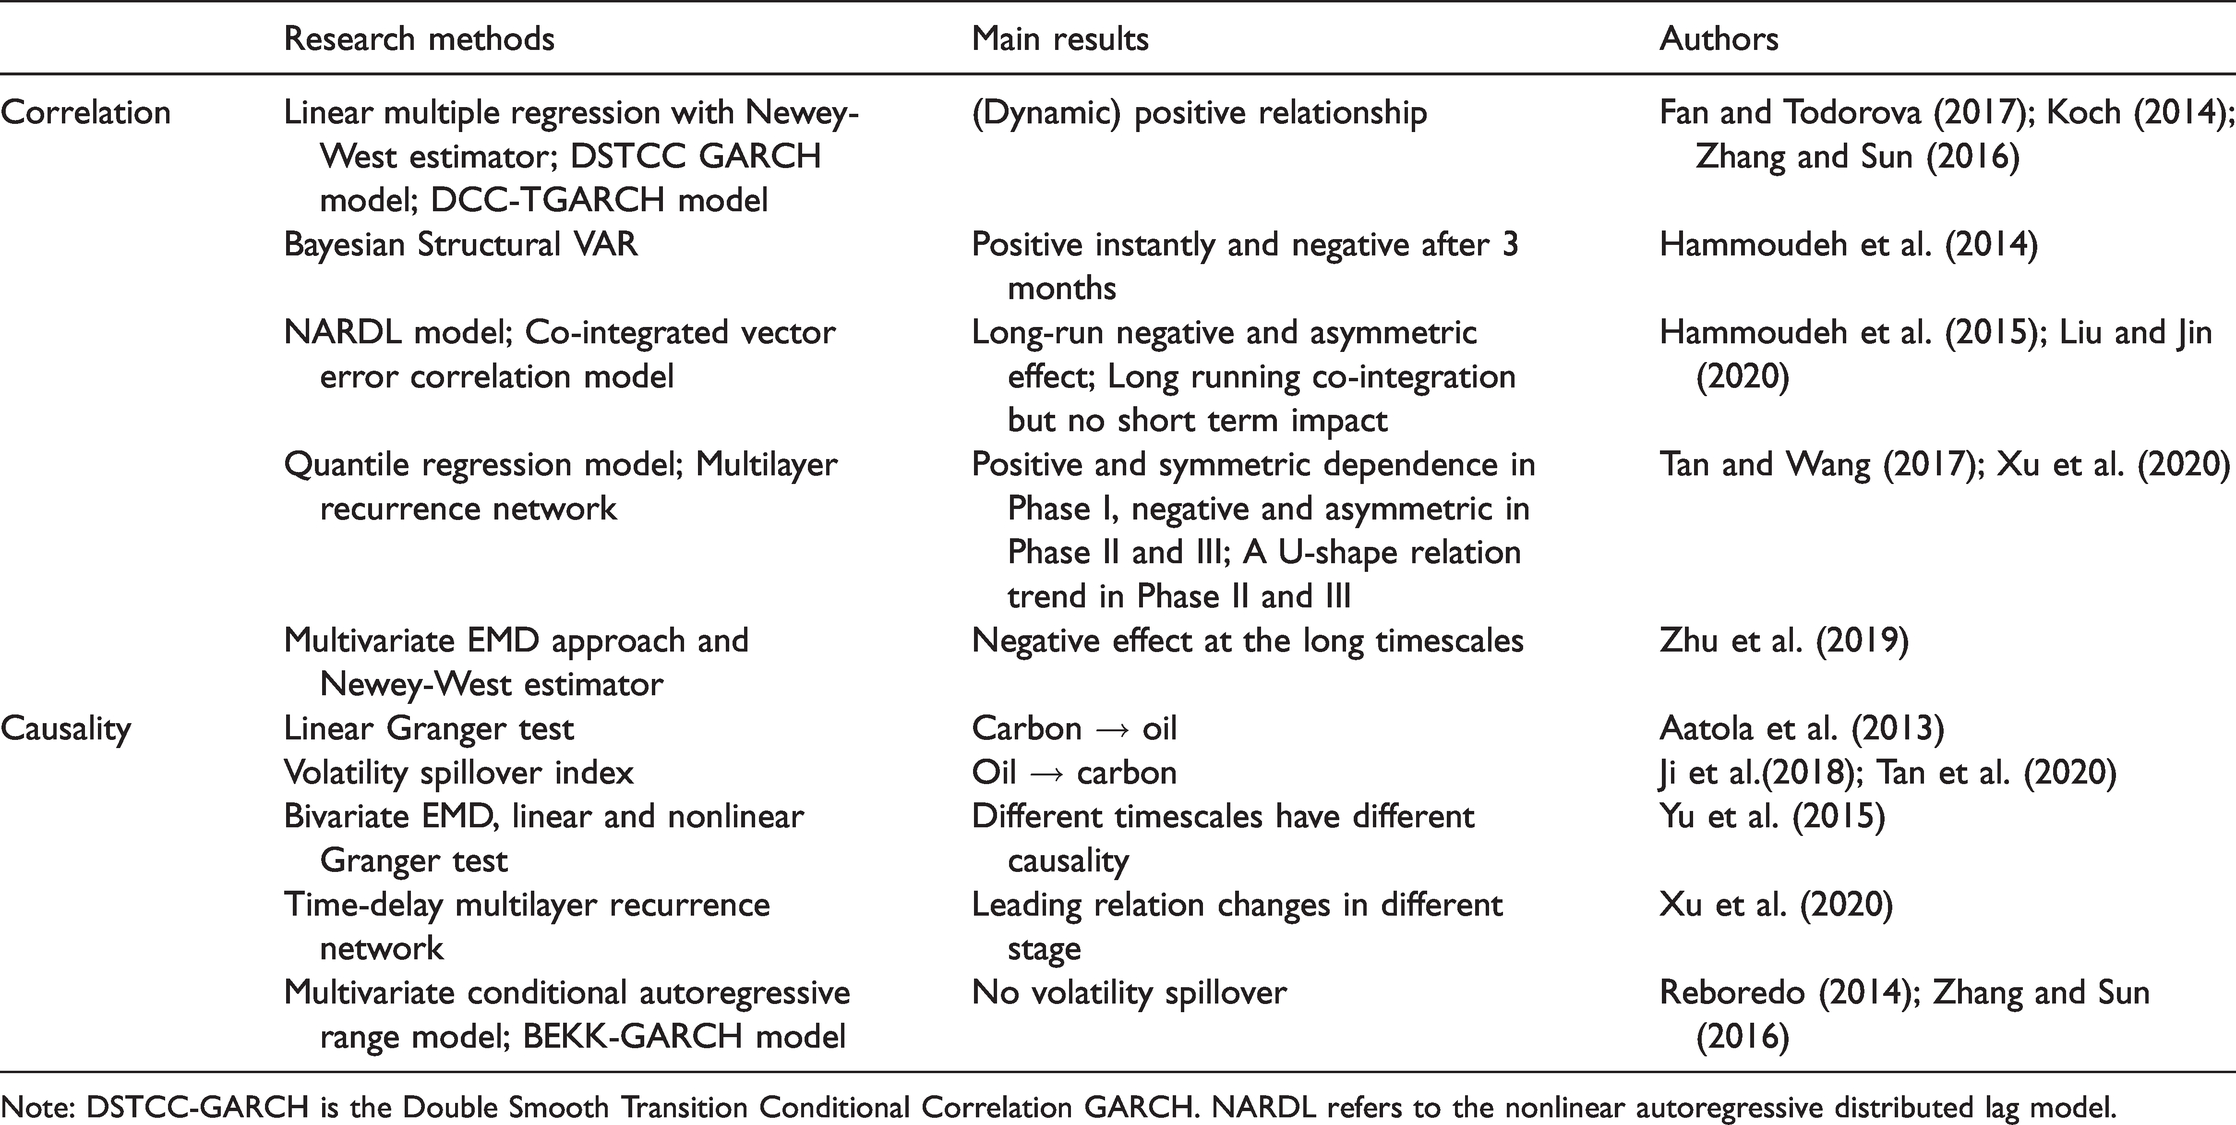
Note: DSTCC-GARCH is the Double Smooth Transition Conditional Correlation GARCH. NARDL refers to the nonlinear autoregressive distributed lag model.
In respect of correlation research, most of the literature applied statistical econometric models which can merely obtain the results in the time domain. Koch 14 and Fan and Todorova 31 found that the two markets are positively correlated using the predominant liner regression and modified GARCH model respectively. Likewise, Zhang and Sun 32 documented a dynamic positive relationship between carbon futures and Brent spot prices. Through the conventional VAR model, Hammoudeh et al. 33 investigated the short-term dynamics of EUA spot price in response to changes in the prices of oil. It documented that a positive shock to the crude oil prices has an initial positive effect on the EUA spot price, which later becomes negative. However, based on a co-integrated vector error correlation model, Liu and Jin 34 confirmed a long-running co-integration between carbon market prices and the price of diesel in Guangdong. But fossil fuel prices have no impact on the short term dynamics of carbon prices. Through a nonlinear ARDL model, Hammoudeh et al. 35 discovered a long-run negative and asymmetric effect existing in EUA and WTI oil spot prices. Tan and Wang 36 probed into the quantile-based dependence dynamics of EUA-oil in different phase of EU ETS and discovered an opposite conclusion in the three phases. From a perspective of network microstructure, Xu et al. 37 examined the information linkage between carbon and energy markets, and their results presented a U-shape trend in the second, transitional and third phases of the EU ETS. Indeed, both carbon and oil price changes have fully been shown to possess different time-scales or frequency bands. Under this circumstance, some recent scholars began concentrating on their dynamic multiscale interactions. By means of modal decomposition approach, Zhu et al. 38 put forward that the oil price only drives the carbon price at the long durations.
On the aspect of causality study, current research demonstrated that there are different causality relationships at different sample periods or different timescales between carbon and oil markets. Using the traditional linear Granger test, Aatola et al. 22 suggested the volatility of carbon price would cause the oil price fluctuation. To monitor the asymmetric spillovers and dependencies, Ji et al. 16 and Tan et al. 19 adopted the powerful volatility spillover index measurement of Diebold and Yilmaz 39 and identified the oil market as the most important role of volatility transmitter in the carbon-oil system. By introducing the EMD technique and a linear and nonlinear integrated Granger test, Yu et al. 40 examined the causality between carbon and oil market from a multi-scale analysis. Their results claimed that the two markets uncorrelated on a small timescale (within one week), but they had a strong bidirectional linear and nonlinear spillover effect at medium timescale (above one week and below one year), with an obvious linear bidirectional causality appearing in the long timescale. Xu et al. 37 constructed a time-delay multilayer recurrence network to measure the mutual leading relationship between carbon and energy markets. They found that there are different leading relations in different stage and carbon price plays a leading role at the present stage of the EU ETS. On the contrary, some authors obtained no spillover effect between carbon and oil prices, such as Reboredo 41 and Zhang and Sun. 32
To sum up, recent literature exemplifies several but varying interactions between carbon and oil markets at different phases or timescales, presenting highly complex features of multi-frequency and concurrently inconclusive causalities. However, (i) they ignored a comprehensive and systematic analysis framework of the carbon-oil market interaction mechanism from the time-frequency domain, (ii) and lacked a more rational methodology to illustrate the time-varying spillover effects among different frequency bands.
The literature examining linkages based on the perspective of volatility spillover effect, which just reveals the overall level interrelationships, fails to provide insight into the time-frequency connectedness between carbon market and crude oil market. There are heterogeneous market players (such as government, enterprise, investor, financial intermediary, etc.) in both carbon and oil markets. Moreover, the market with active behaviors of different players makes the carbon and oil prices volatility have multi-frequency implicit information. Therefore, the interactions between the carbon market and crude oil market should have time-varying and multi-frequency characteristics. If we ignore the time-frequency relationship between markets, it may lead to the lack of targeted decision-making basis in the regulation of relevant market policies and the design of investment strategies, and even lead to wrong actions. Therefore, it is necessary to analyze the interaction mechanism between carbon and oil markets from a time-frequency perspective. What is more, the existing research lacks the analysis of the impact of external influencing factors on the mechanism, such as stock market, commodity market and other financial markets. This is not only difficult to truly reflect the complex linkage between carbon and oil markets, but also cannot give comprehensive reference information from the view of the overall structure. At this point, we also need to consider the influencers of the interaction mechanism. The structured market data have the characteristics of non-stationary and high random volatility, and generally reflect the dual characteristics of time-varying and multi-frequency. If we use different data sampling frequency or divide different time nodes to test the dynamic multi-frequency interactions between carbon and oil markets, we will not fully define the relationship between the two markets or even draw the opposite conclusion. Although few scholars have discussed the linkage between carbon and oil prices on different timescales using a modal decomposition approach, combining with another statistical technique (e.g. Granger test, regression model), they can only get one of the degree or guidance direction results of their overall relationship but not in a simultaneous way. Moreover, the modal decomposition method has some limitations. In general, it amasses a few modal components for the dynamics of the original time series, which cannot sufficiently reflect the periodic characteristic of the whole sequence.
42
Thus, further comprehensive exploration of the intrinsic mechanism between the two markets in a time-frequency setting and considering the external influencing factors appears worthy of investigation.
Our study has incorporated a logical analysis framework with wavelet analytical method, which allows us to explore the mechanism of carbon-oil price interactions over time and across frequencies, and so to provide a fuller and more pertinent picture to policymakers and practitioners. First and foremost, taking into account the heterogeneous market subjects of internal system and the necessary factors from the external environment, we innovatively outlined a conceptual framework for the complicated mechanism of the carbon-oil system. Secondly, referring to the partial wavelet analysis approach, we creatively consider the necessary inclusion of several control variables, which may influence both carbon and oil price as well as the linkage between them, i.e. stock price, clean energy price, commodity index and interest rates. This wavelet approach combines the time and frequency domain based causality and correlation approaches, as well as can eliminate the influence of the control variables, and then provides more reliable results relative to the traditional time-domain approaches. Most importantly, the wavelet method allows us to conduct local analysis, capturing the localized sub-image area of a larger picture. Therefore, these factors make the wavelet approach more superior to other previously developed correlation methods. Finally, we estimate not only the coherency strength and lead-lag relations of the two markets but also their magnitude via the adoption of partial wavelet gain, which is akin to estimating regression coefficients in the time-frequency domain.
Theoretical framework
As an emerging policy-based artificial market, carbon market possesses a complicated nonlinear system, which is similar to the international crude oil market. Both of the two markets are not only affected by the internal market mechanisms but also impacted by the external heterogeneity factors, such as economic crises, stock prices etc. Simultaneously, the frequency and duration of the impacts, from the internal mechanism and external heterogeneous environment, on carbon and oil prices are dramatically different, as illustrated in Figure 1. We then give the conceptual framework of the interaction mechanism between carbon and oil prices, from the two aspects of the internal system and external factors.
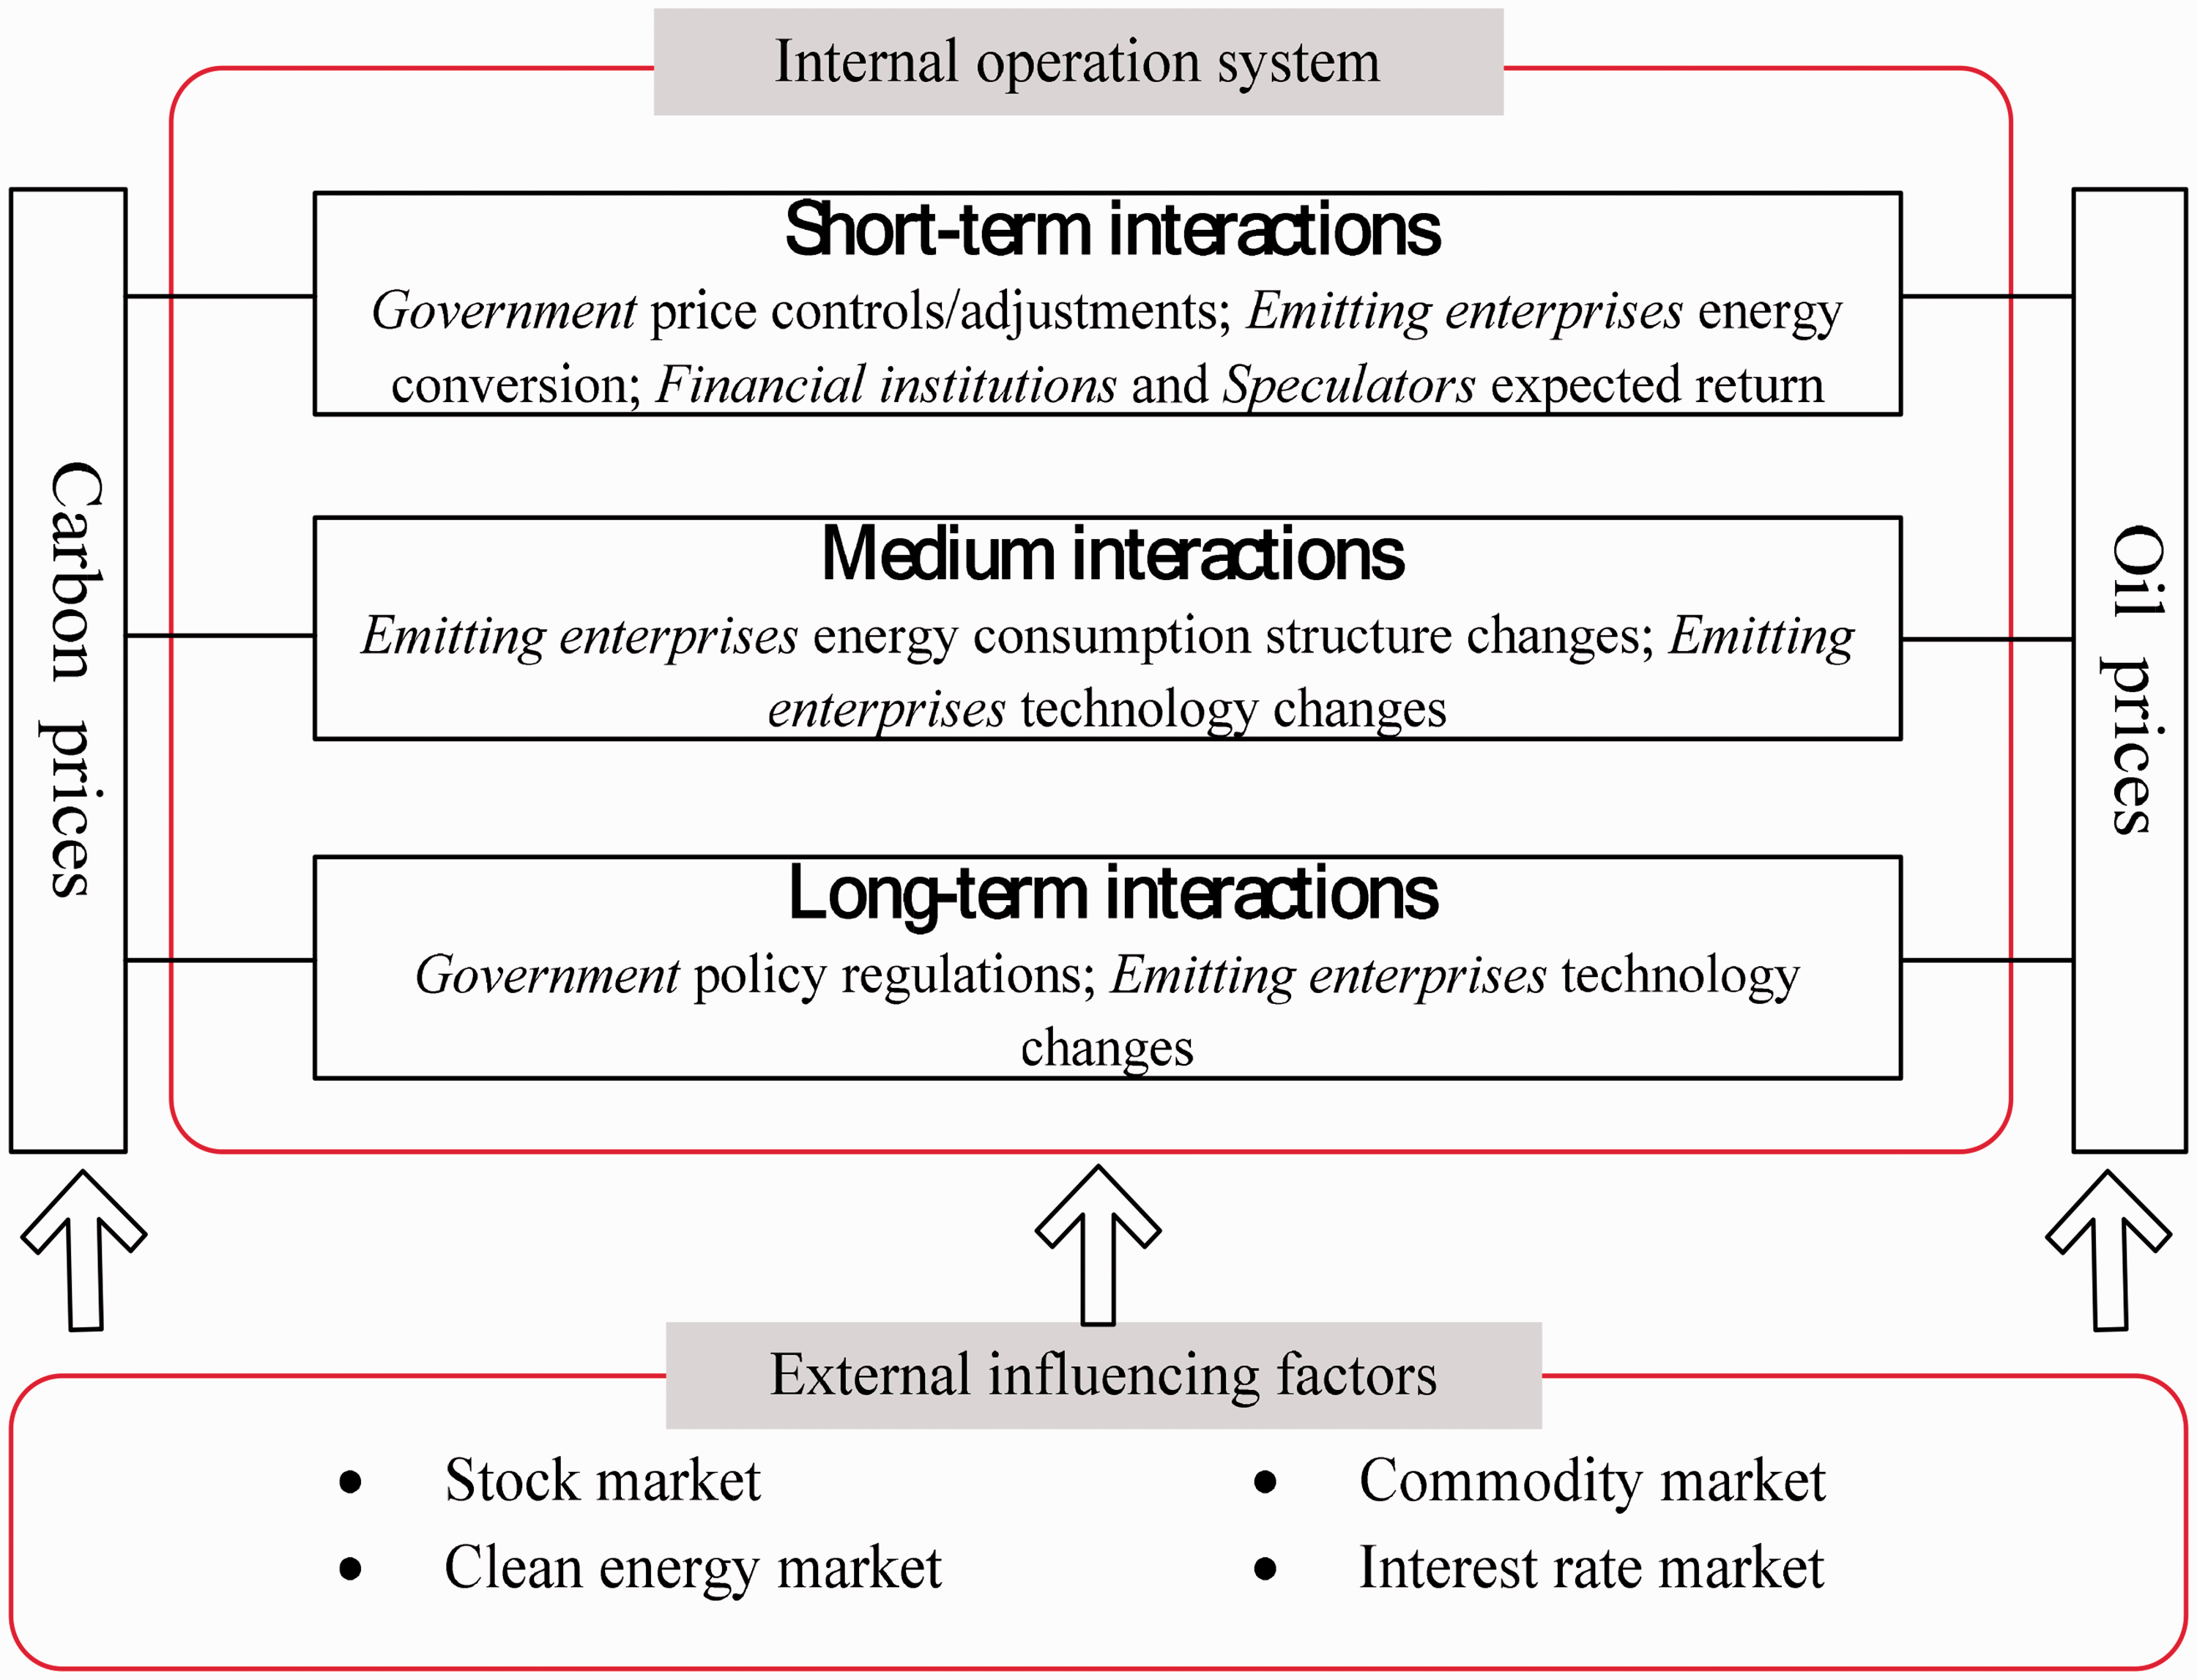
The conceptual framework of carbon-oil price interactions.
On the one hand, from the perspective of the internal system, there exist various market participants which comprise governments, regulated companies, market speculators and financial institutions. These relevant subjects’ behaviors in markets are heterogeneous, and usually, influence the internal operation mechanism of the carbon-oil trading system from different horizons. Among them, the government is the leading driving force. Under the guidance of long-term carbon-reduction policies, governments issue allowances for free or auction quotas to emitters, and supervises the carbon-reduction activities through formulating or revising policies. Also, they would set up short- or medium-term measures to address the oversupply of EUAs. As for the emitting companies involved in carbon-reduction, they are not only the demander but also the supplier of carbon products. Under the whole international macroeconomic situation, the dominant way for regulated companies to realize emission reduction in the short-term is energy conversion. At the same time, the long-term measure is industrial transformation and upgrading by developing carbon mitigation technologies. Consequently, the variation of energy prices promotes enterprises to transform the energy consumption structure, and then changes the demand for carbon emission allowances, ultimately affecting carbon prices. For instance, lower oil prices may increase their consumption by firms, which could lead to excess demand for allowances and consequently increase carbon prices. Nevertheless, higher carbon prices will give firms more incentive to develop clean energy technologies or change energy consumption structure, impacting oil prices and other energy prices. What is more, the transfer inherently has the lagging effect, which is likely to be manifested in the long run. Of course, like speculators and financial institutions, emitters might consider the carbon market as an effective tool for gaining portfolio diversification benefits. From the aspect of the financial property, the information spillovers of oil price volatility could affect the entities’ judgment of expected returns, mostly in the short-term. In this sense, investors would adjust their portfolios via cross-market transactions and always in different investment horizons, causing fluctuations of carbon and oil prices in the frequency domain. In short, the outlook of institutional investors and market regulators may be governed by the long-term trends of price, while speculators are more interested in the short-term price dynamics.
On the other hand, given the external heterogeneity surroundings, carbon and oil prices as well as their interactions are influenced by the stock market, commodity markets, etc. Theoretically, with the gradual expansion of the carbon market scale and the increasing abundance of carbon trading products, as well as the substitution effect of clean energy sources on conventional fossil fuels, it therefore results in the close interdependence between carbon emissions and energy industries, especially in the context of achieving the goal of carbon neutrality. Simultaneously, with the progress of internationalization, the special financial attribute and commodity property of carbon and oil markets will induce themselves to be closely linked with capital markets, such as stock, exchange and interest rate. In practice, major financial crises, political events and public emergencies have substantive effects on carbon and oil prices. For example, the financial turmoil of 2008 and the outbreak of COVID-19 had brought plunge to many asset prices; as an important member of the EU ETS, the declaration of Britain exit (Brexit) has brought evident instability to the carbon market. On this view, these external channels could give rise to movements in both carbon and oil prices, and also the interactions between them. What is worth noting, however, is that the external factors exert influence on different time horizons. For instance, the financial crisis cause medium-term effect, and the macroeconomic conditions bring about the long-term impact. 43 Moreover, due to the heterogeneous concept of market participants among carbon and oil markets, the reactions to financial asset price changes and information shocks are not the same, resulting in different cross-market and cross period trading operations at different trading times, and thus forming a time-frequency interaction between carbon and oil markets.
As can be seen from the internal and external conceptual framework analyses, the interaction mechanism between carbon and oil markets demonstrates differences in different time scales. Hence, the conclusions obtained merely from the analysis of connection in time dimension may not be valid for all time scales, and even are possible to mislead the participants outside the scope. All in all, how to rationally circumvent the short/long-term risk of price fluctuations is worth exploring. Depending on the motivation of time diversification, this article tends to make an in-depth analysis on interactions between carbon and oil price simultaneously at different frequencies, through utilizing a wavelet analysis method.
Methodology
Actually, the wavelet-based approach has already been introduced into interactions exploration, mainly in the field of macro-economic, energy and commodities markets.1,2,11,44,45 The main advantage of wavelet analysis is providing a unified framework and a convenient tool to distinguish relations at specific frequencies and time dimensions. 46 As a matter of fact, the traditional correlation coefficient uses a single value to describe the relationship of two time series, while wavelet consistency can present a matrix to show accurate correlation at each time and frequency point. 20 Another important aspect of applying wavelet method is to overcome the problems of non-stationary time series. The wavelet methodology can easily adjust the time window to low or high frequency, thereby detecting a wide range of frequencies and possessing the ability to capture events that are local in time. 17 At this point, the wavelet technique avoids the subjectivity of sample segmentation and breakpoint detection. It thus could more accurately depict the key feature of carbon and oil price as well as their complex co-movements.
The brief modelling framework for the carbon-oil system is shown in Figure 2. Firstly, to profoundly extract the complexity of carbon and oil prices, we introduce a continuous wavelet transformation method. Secondly, to assess the interactions of the carbon-oil price while accounting for the potential external effect of other related variables, we resort to the concept of partial wavelet coherency. It contains the evaluation of partial wavelet coherence, partial phase-difference and partial wavelet gain. Finally, we analyze the empirical results of different stages of EU ETS and different time horizons through contrastive analysis. The detailed instructions into the corresponding techniques are demonstrated as the following subsections.
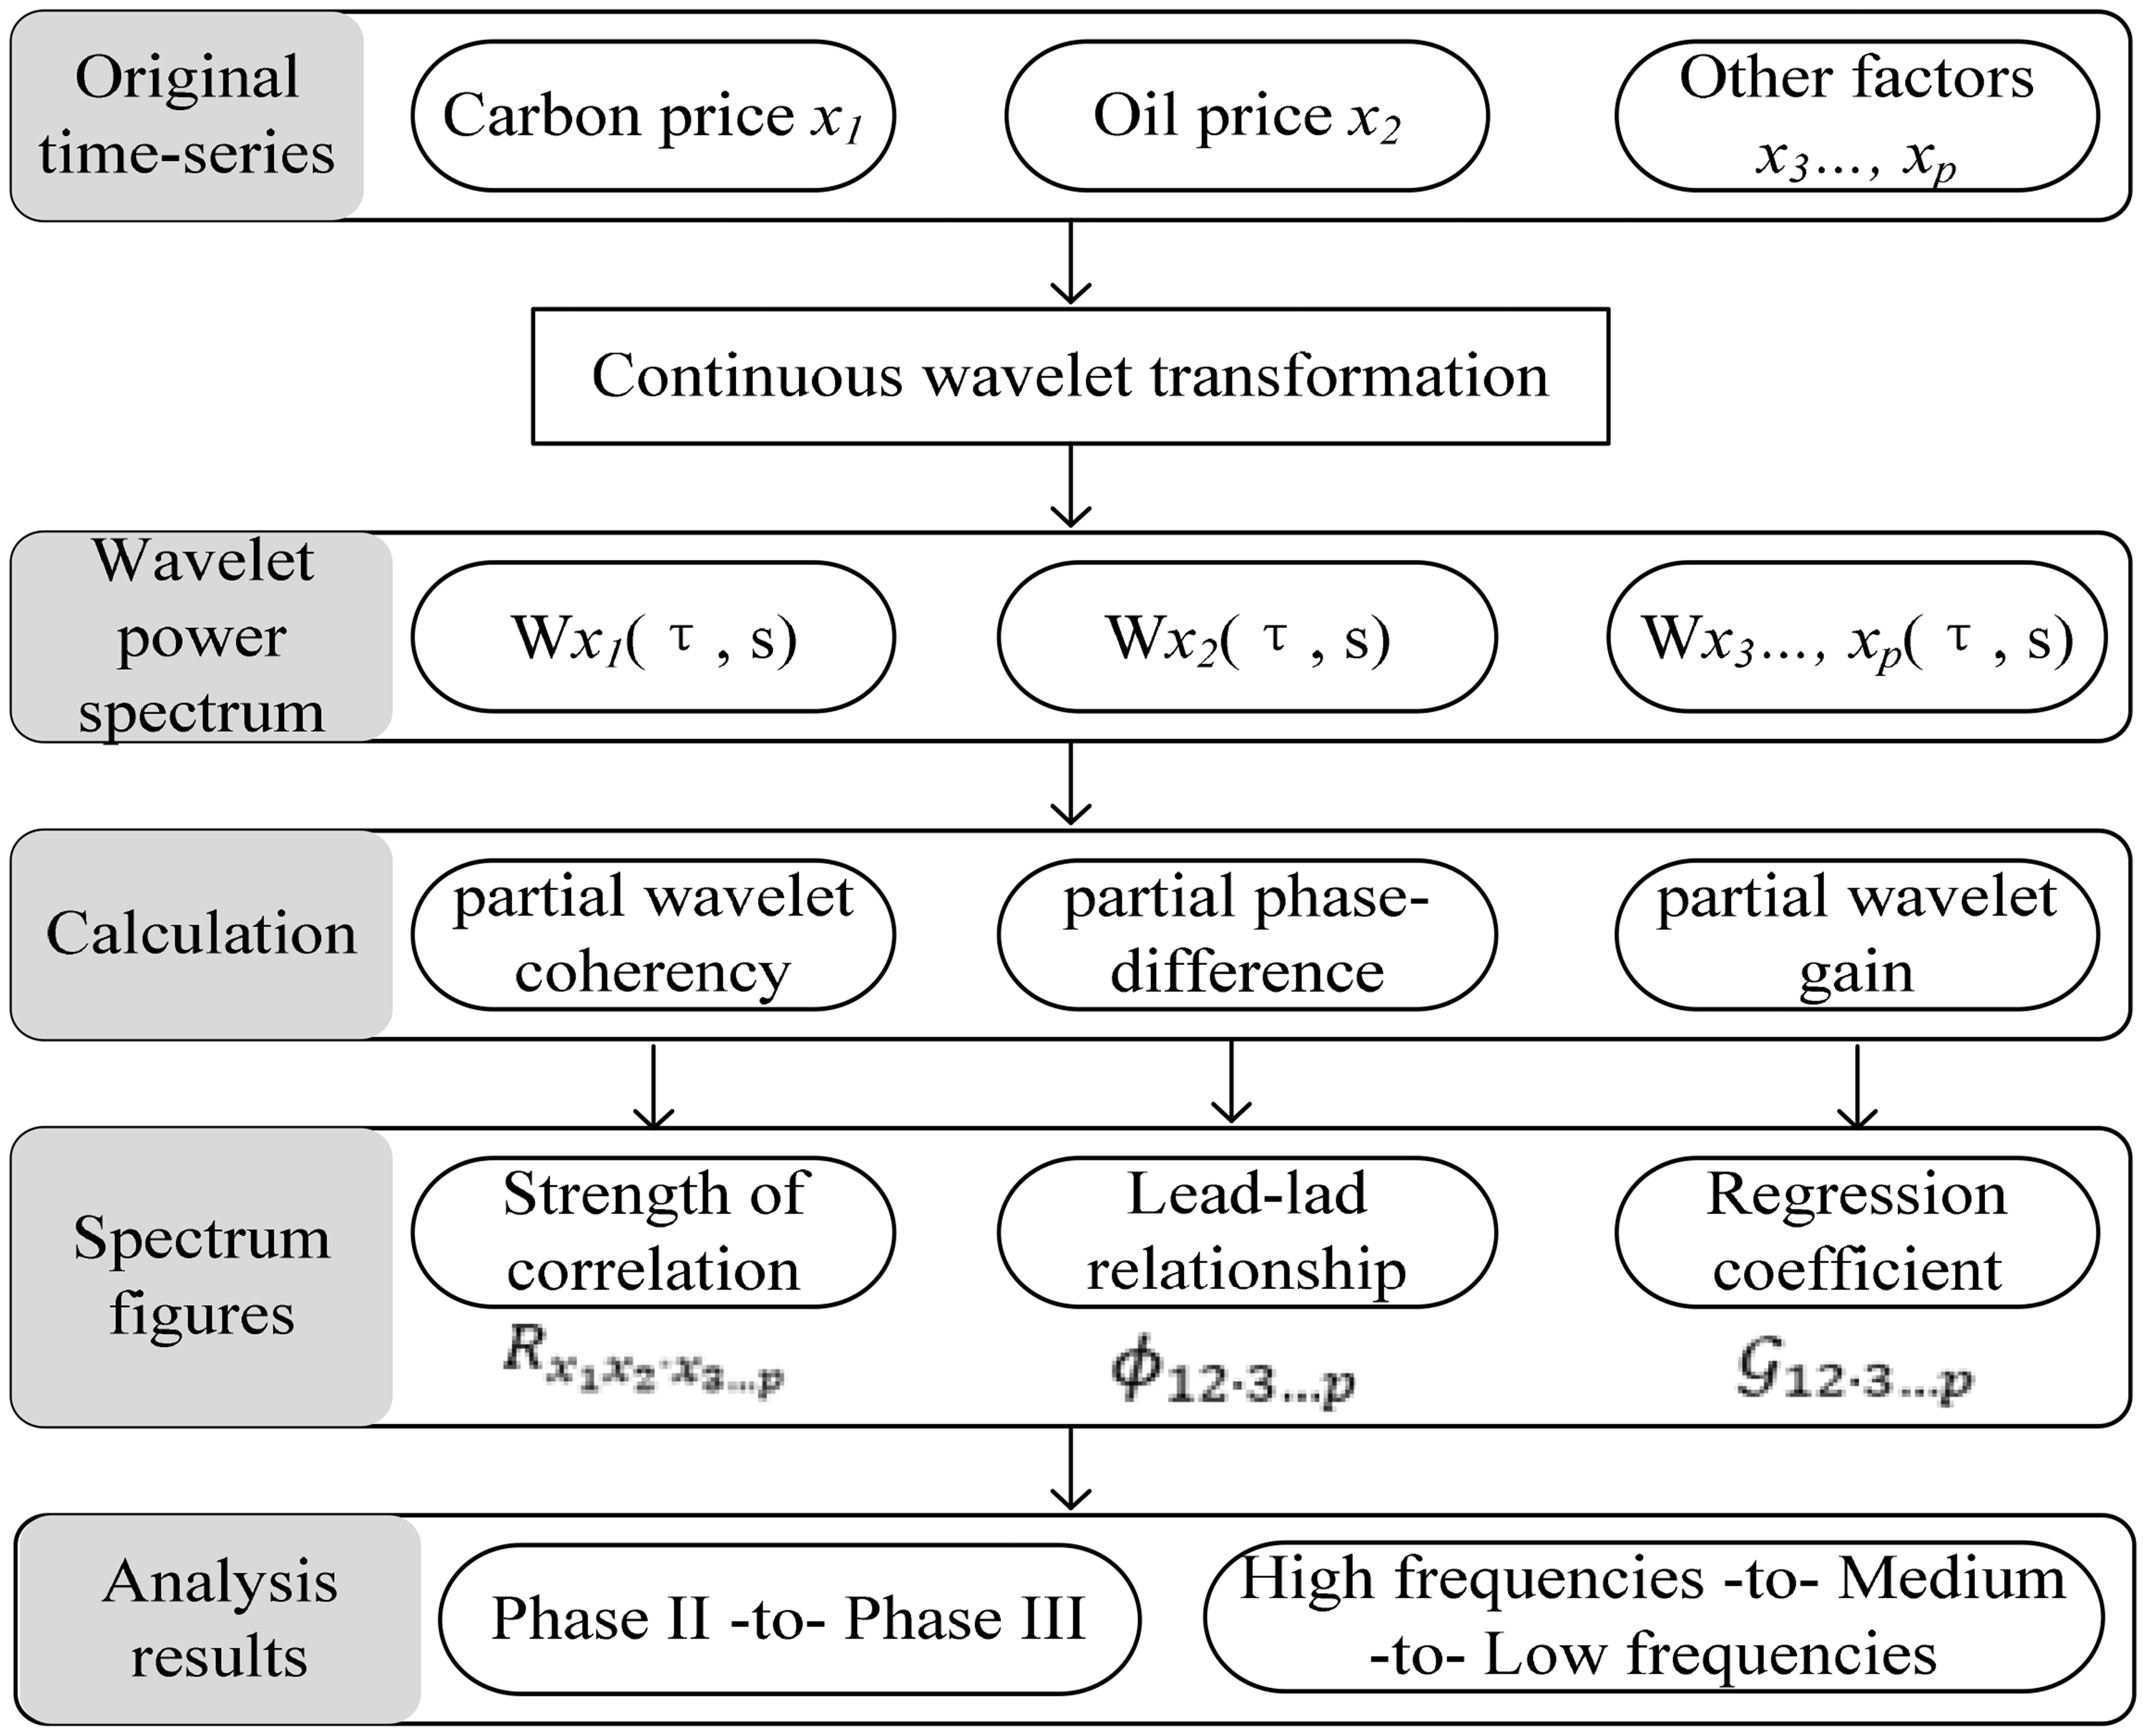
Framework of the proposed wavelet coherency analysis approach.
The continuous wavelet transform and wavelet power spectrum of carbon and oil prices
The starting point in wavelet analysis is the selection of a mother wavelet function. Complex analytic wavelets are ideal for studying oscillations.
44
We employ the most popular Morlet wavelet following Kirikkaleli and Jr
20
study, which provides a good balance between time and frequency localization.
47
The simplified version of Morlet function is written as follows

The time-series conversion in the time-frequency domain is called the wavelet transformation. Also, the continuous wavelet transform (CWT) is the ground of cross-wavelet approaches, which preserves energy in a series and allows connecting two or more time-series from time-frequency perspective.
48
The CWT of a time series
The wavelet power spectrum (WPS),
The partial wavelet coherency between carbon and oil prices with the control variables
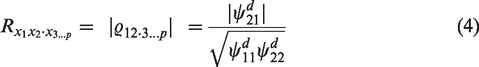
In many applications, one is interested in detecting and quantifying the time-frequency relations between two non-stationary decision variables. Compared with the cross-wavelet power, the wavelet coherency 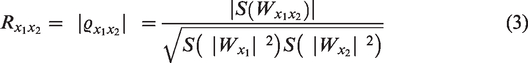
S denotes a smoothing operator in both time and scale. The value of
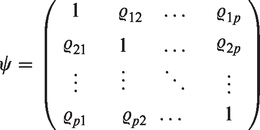
Some wavelet tools are specially designed to use when more than two series are involved. Just as we explore the co-movements between carbon price as x1 and oil price as x2, with the control of other influencing factors x3…p. In this context, it makes sense to introduce the concepts of partial wavelet coherency (PWC). According to Aguiar-Conraria et al.,
44
not considering the partial coherency would lead us to erroneous conclusions. Given several series x1, x2…, xp, the PWC between x1 and x2, after eliminating the influence of all the other remaining series x3…, xp, is designed by the formula
The partial phase-difference and partial wavelet gain between carbon and oil prices with the control variables
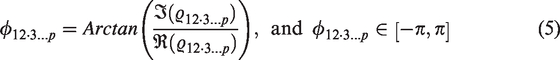
Frankly speaking, the PWC is unable to distinguish between positive and negative interdependences and identify the lead-lag relationship. For this reason, it is natural to introduce the partial phase-difference (PPD) of x1 over x2
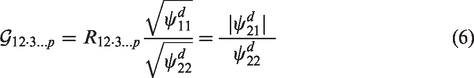
Finally, referring to Mandler and Scharnagl,
49
we construct the partial wavelet gain (PWG) of carbon over oil price after controlling for other influencers
The
Empirical analysis
Data description
We especially focus on the EUA market, which is the most important and largest carbon market, 6 and the Brent crude oil market on behalf of the nearest famous fossil energy market.8,9 The EUA and Brent futures prices are employed because of the better quality and high practicability for both managers and investors.36,39
As the explanation of the theoretical framework in Theoretical framework section and Figure 1, we considered the necessary inclusion of several control variables from the external surroundings, which are the most representative indicators reflecting stock, commodity, capital and clean energy market, and which are all closely linked to the carbon market and crude oil market. 19 The primary is a symbol of European economic activity, namely STOXX Europe 600 index (abbreviated as Stoxx600), which mirrors the stock market performance of 18 European countries. 23 Second is the S&P Goldman Sachs Commodity index excluding energy (S&P GSCI non-energy, denoted by GSCI), which provides investors exposure to all commodities not included in the Energy sub-index.21,38 The third is the Euribor rate which is an important indicator of systematic risk and represents the monetary policy. 36 Beyond that, we also include clean energy prices in this mechanism, namely the S&P global clean energy index (denoted by Clean). It comprises a diversified mix of 30 clean energy production, equipment and technology companies worldwide, and can be seen as a reliable proxy of clean energy market tendency. 16
The sample data is weekly b and ranges from the beginning of March 2009 until 11 December 2020, yielding a total of 616 observations and which is suitable to study cycles of periods longer than a year. We skip Phase I of the EU ETS (2005–2007) in our empirical investigation, as it is not mature enough during a trial running phase.28,37 As Brent futures price is quoted in USD, we made the unit conversion according to the EUR/USD reference rate. All of the variable records are sourced from the Wind Database.
As an illustration, Figure 3 displays the variable series of the whole period in levels. We can see a sudden collapse occurred among the majority of the variables around 2011–2012, due to the European sovereign debt crisis (ESDC). Also, the Euribor variable was found to be extremely volatile during this period. The Libyan war began in February 2011 exerted a bullish influence on the crude oil market, pushing oil price to increase. There was a drastic drop period for EUA price at the end of Phase II (namely at the beginning of 2013), which may relate to the political uncertainties over the Post-Kyoto period. Possibly, the carbon market stability reserve (MSR) of European and the declaration of Brexit caused a prominent uptick in EUA price after 2017. The Organization of Petroleum Exporting Countries (OPEC) announced no reduction in oil production repeatedly, resulting in the occurrence of a violent shock to oil price in 2014. Then it struggled at low level continuously until 2016. The plunge of oil price thus generated a spillover impact on other commodities, as the similar change showed in GSCI. There are also some resemblances between EUA and clean energy prices, especially for the period running form 2012–2017. The Euribor variable was below zero from 2015, following the quantitative easing policy. The US political turmoil in 2017 and the trade disputes between the United States and many countries in 2018, especially for the Sino US trade dispute, had led to fluctuations in oil market, financial and commodities market. The outbreak of COVID-19 had a comprehensive and profound impact on world economic development and people’s lives. Particularly at the beginning of March 2020, all of the variables witnessed a crash but then slowly recovered with the control of the epidemic. Under the global initiative of “carbon neutrality”, the carbon price and clean energy price display a rising trend. In summary, the graphical evidence indicates some similar trends of these series during certain periods, implying potential interactions between them.
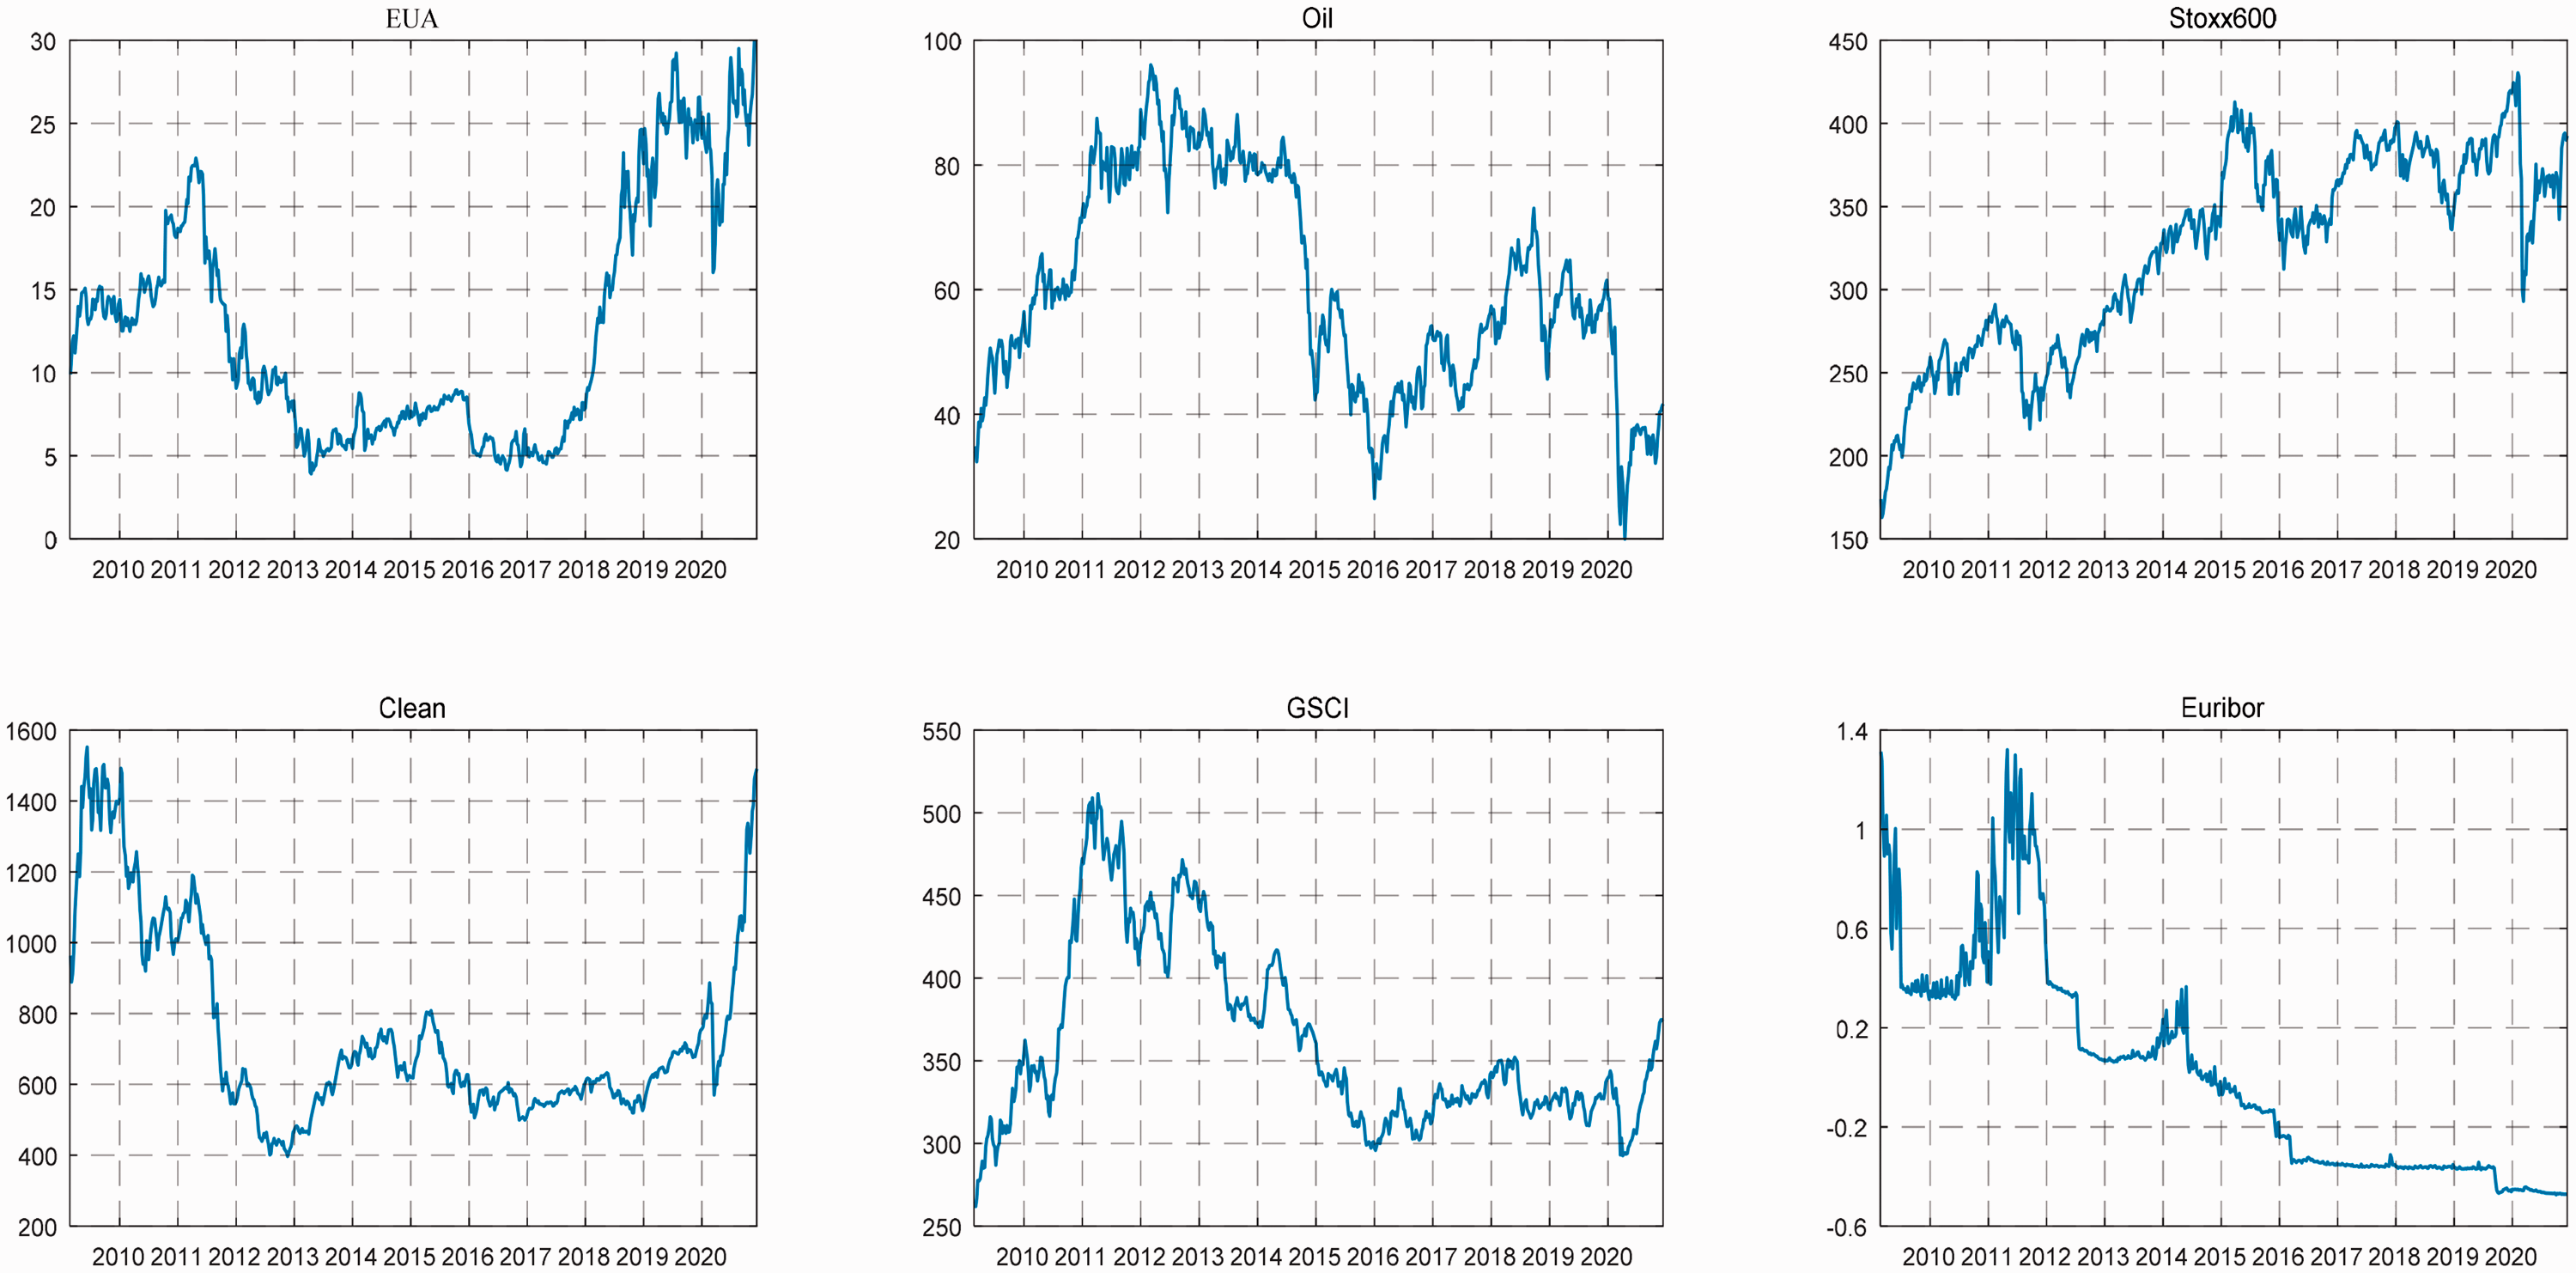
Carbon price, oil price and control variables in levels.
The preliminary analysis on carbon and oil prices based on wavelet power spectrum
The wavelet power spectrum gives us a measure of the time-series variance for each time and for each frequency, which is defined as the absolute value of the square of the wavelet transform. In practice, we fit an ARMA (1, 1) model to perform significance tests of wavelet measures, and then extract the critical values based on 2000 Markov bootstrapped series. After many times simulations, a scale of 64 periods is selected finally, as the dataset covers the sample period from March 2009-December 2020 (612 weekly observations). In Figure 4, we furnish a preliminary analysis with our data. c On the left-side panel, we plot the returns of EUA and Oil, together with their wavelet power spectrum (abbreviated as WPS) on the right-side. This provides a first assessment of the behavior of each variable in the time-frequency domain.
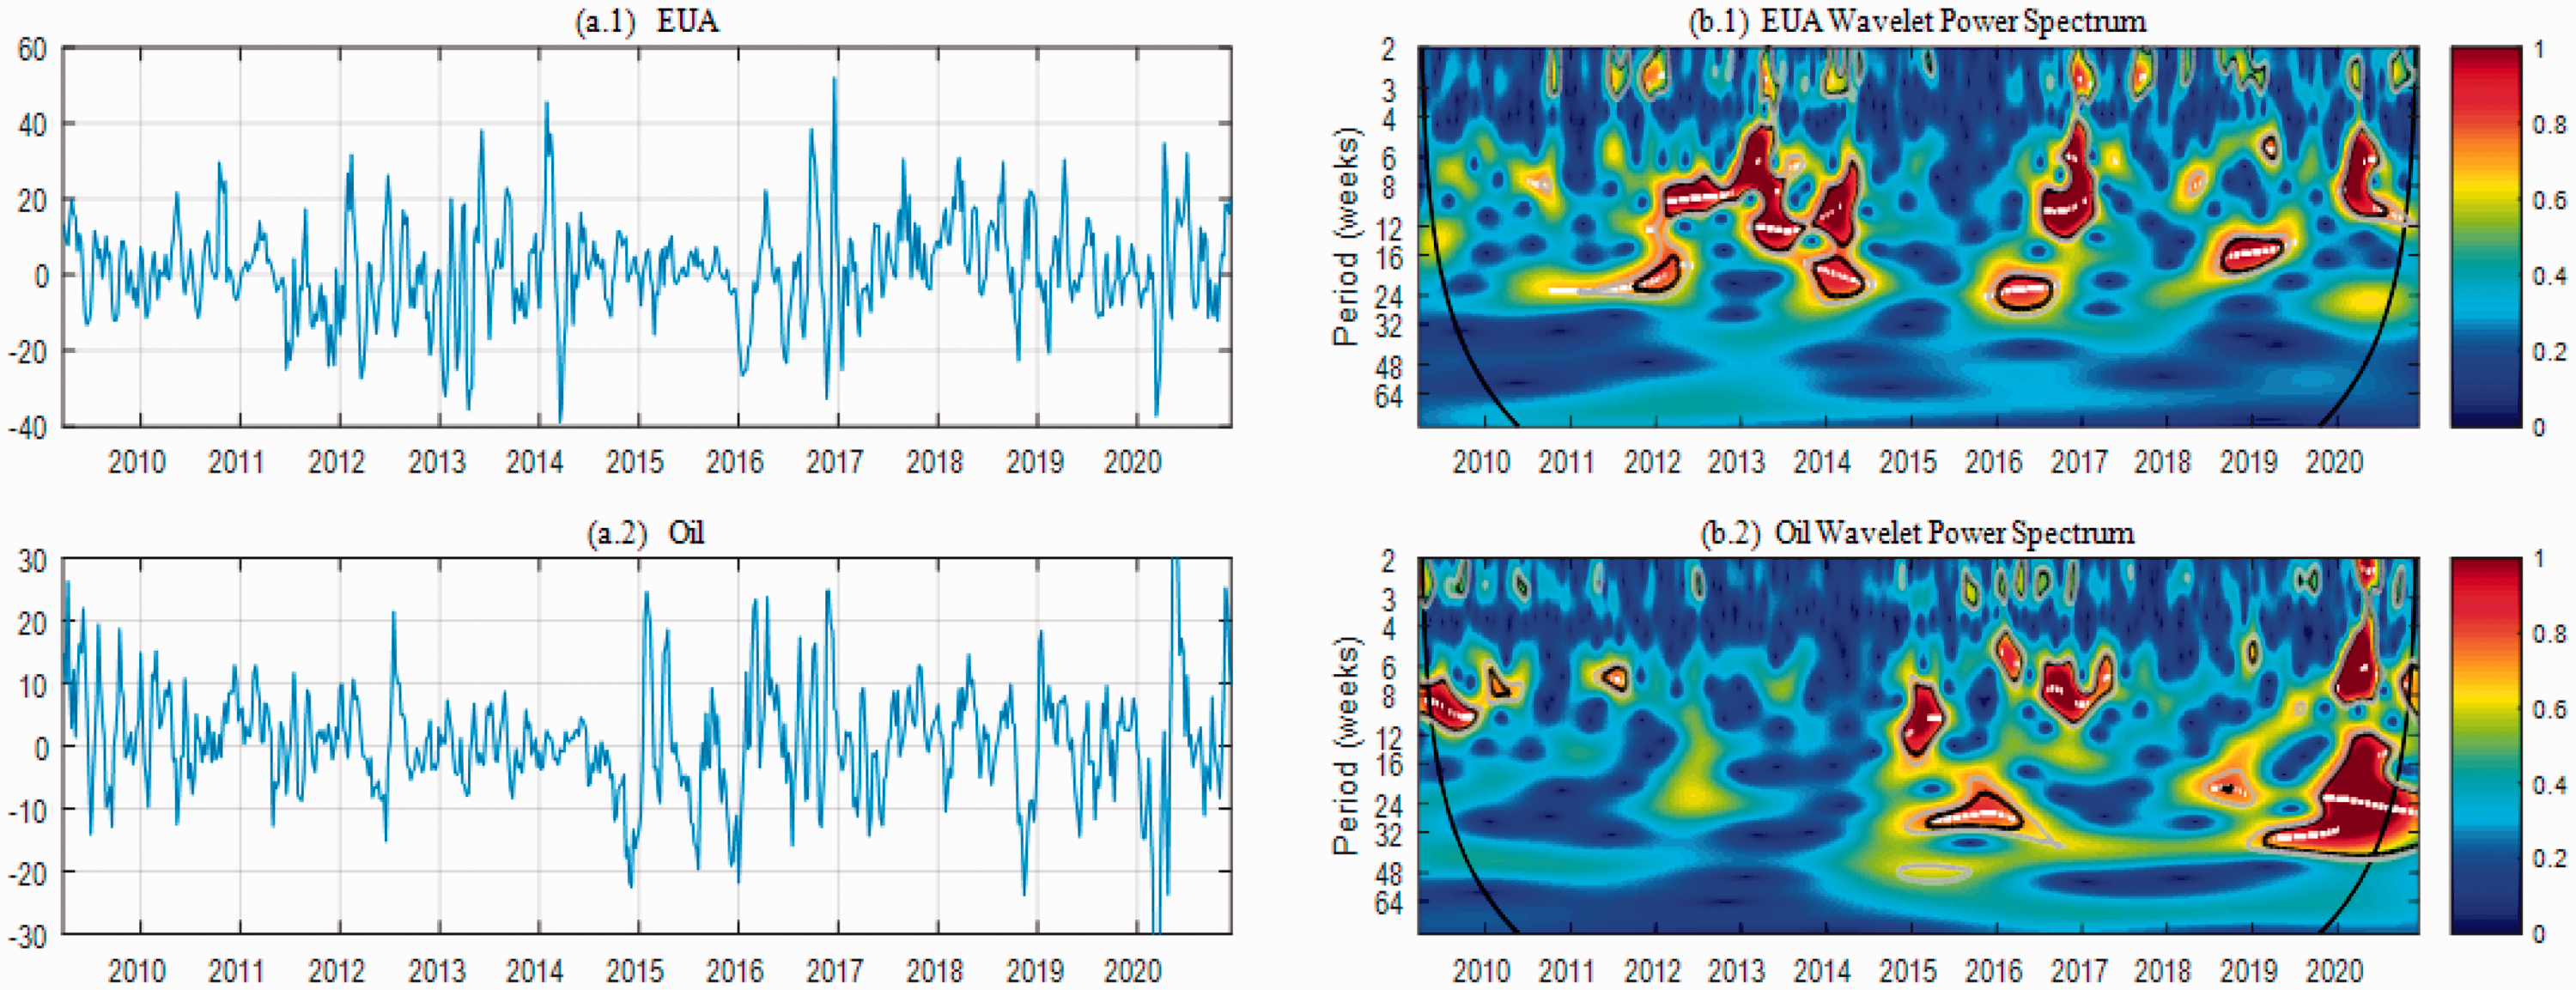
Continuous wavelet power spectrum of carbon and oil prices. Note: The oval black cone of influence (COI) line delimits the significant power regions (see Kirikkaleli and Jr 20 for more details). The white lines indicate local maxima of the undulations in corresponding WPS figures. The black contours signify 5% significance level, while the grey contours represent 10% level. The Y-axis provides a measure of period lengths, whereas the X-axis refers to the timeline. A color code is applied to depict the intensity of variability ranges from dark blue (low variability) to red (high variability).
Note: The oval black cone of influence (COI) line delimits the significant power regions (see Kirikkaleli and Sowah 20 for more details). The white lines indicate local maxima of the undulations in corresponding WPS figures. The black contours signify 5% significance level, while the grey contours represent 10% level. The Y-axis provides a measure of period lengths, whereas the X-axis refers to the timeline. A color code is applied to depict the intensity of variability ranges from dark blue (low variability) to red (high variability).
The plots of WPS tell different stories as they move along the timeline of the sample period. The volatility of EUA price is apparent after 2012, especially at higher frequencies during 2013 2017, 2019, and 2020. The red regions correspond to cycles of horizon smaller than 16 weeks.
While the oil market exhibits high levels of volatility before 2010 with a periodicity of 8 weeks, which may be attributed to the outbreak of the European debt crisis. It is interesting to note that regarding oil price, there are two dominant cycles that coexist for the period 2015–2017. One cycle has a 12-week horizon, and the other has a half-year cycle. Similarly, the COVID-19 pandemic has caused significant fluctuations on oil price, notably in the period of about 24 weeks band from the beginning 2020.
Additionally, the WPS results suggest that the EUA price mainly withholds a short-term memory effect over the sample period. The Oil price reaches statistical significance for an 8–12 week span; however, in some cases, the effect transforms into a long-memory effect of up to a half-year band.
The presentation of partial wavelet coherency between carbon and oil prices
In the light of preliminary analysis, it is difficult to discern any interrelations between the two markets in time-frequency dimension. Remarkably, it is paramount to account for the interaction with the other series, otherwise one risks of incurring an omitted variable bias. Figure 5 illustrates the trajectory of the wavelet coherence spectrum in highlighting regions where carbon and oil prices co-vary, after eliminating the impacts of other related variables (i.e. Stoxx600, Clean, GSCI and Euribor). For the sake of clarity and completeness, we estimate the partial wavelet coherency in a longer cycle (a scale of 256 periods). Comparing Figure 5 with Figure A2 (the cross-wavelet coherence spectrum of EUA-Oil pair), we can notice the results change somewhat and that not considering the partial wavelet coherency (abbreviated as PWC) would lead us to erroneous conclusions.
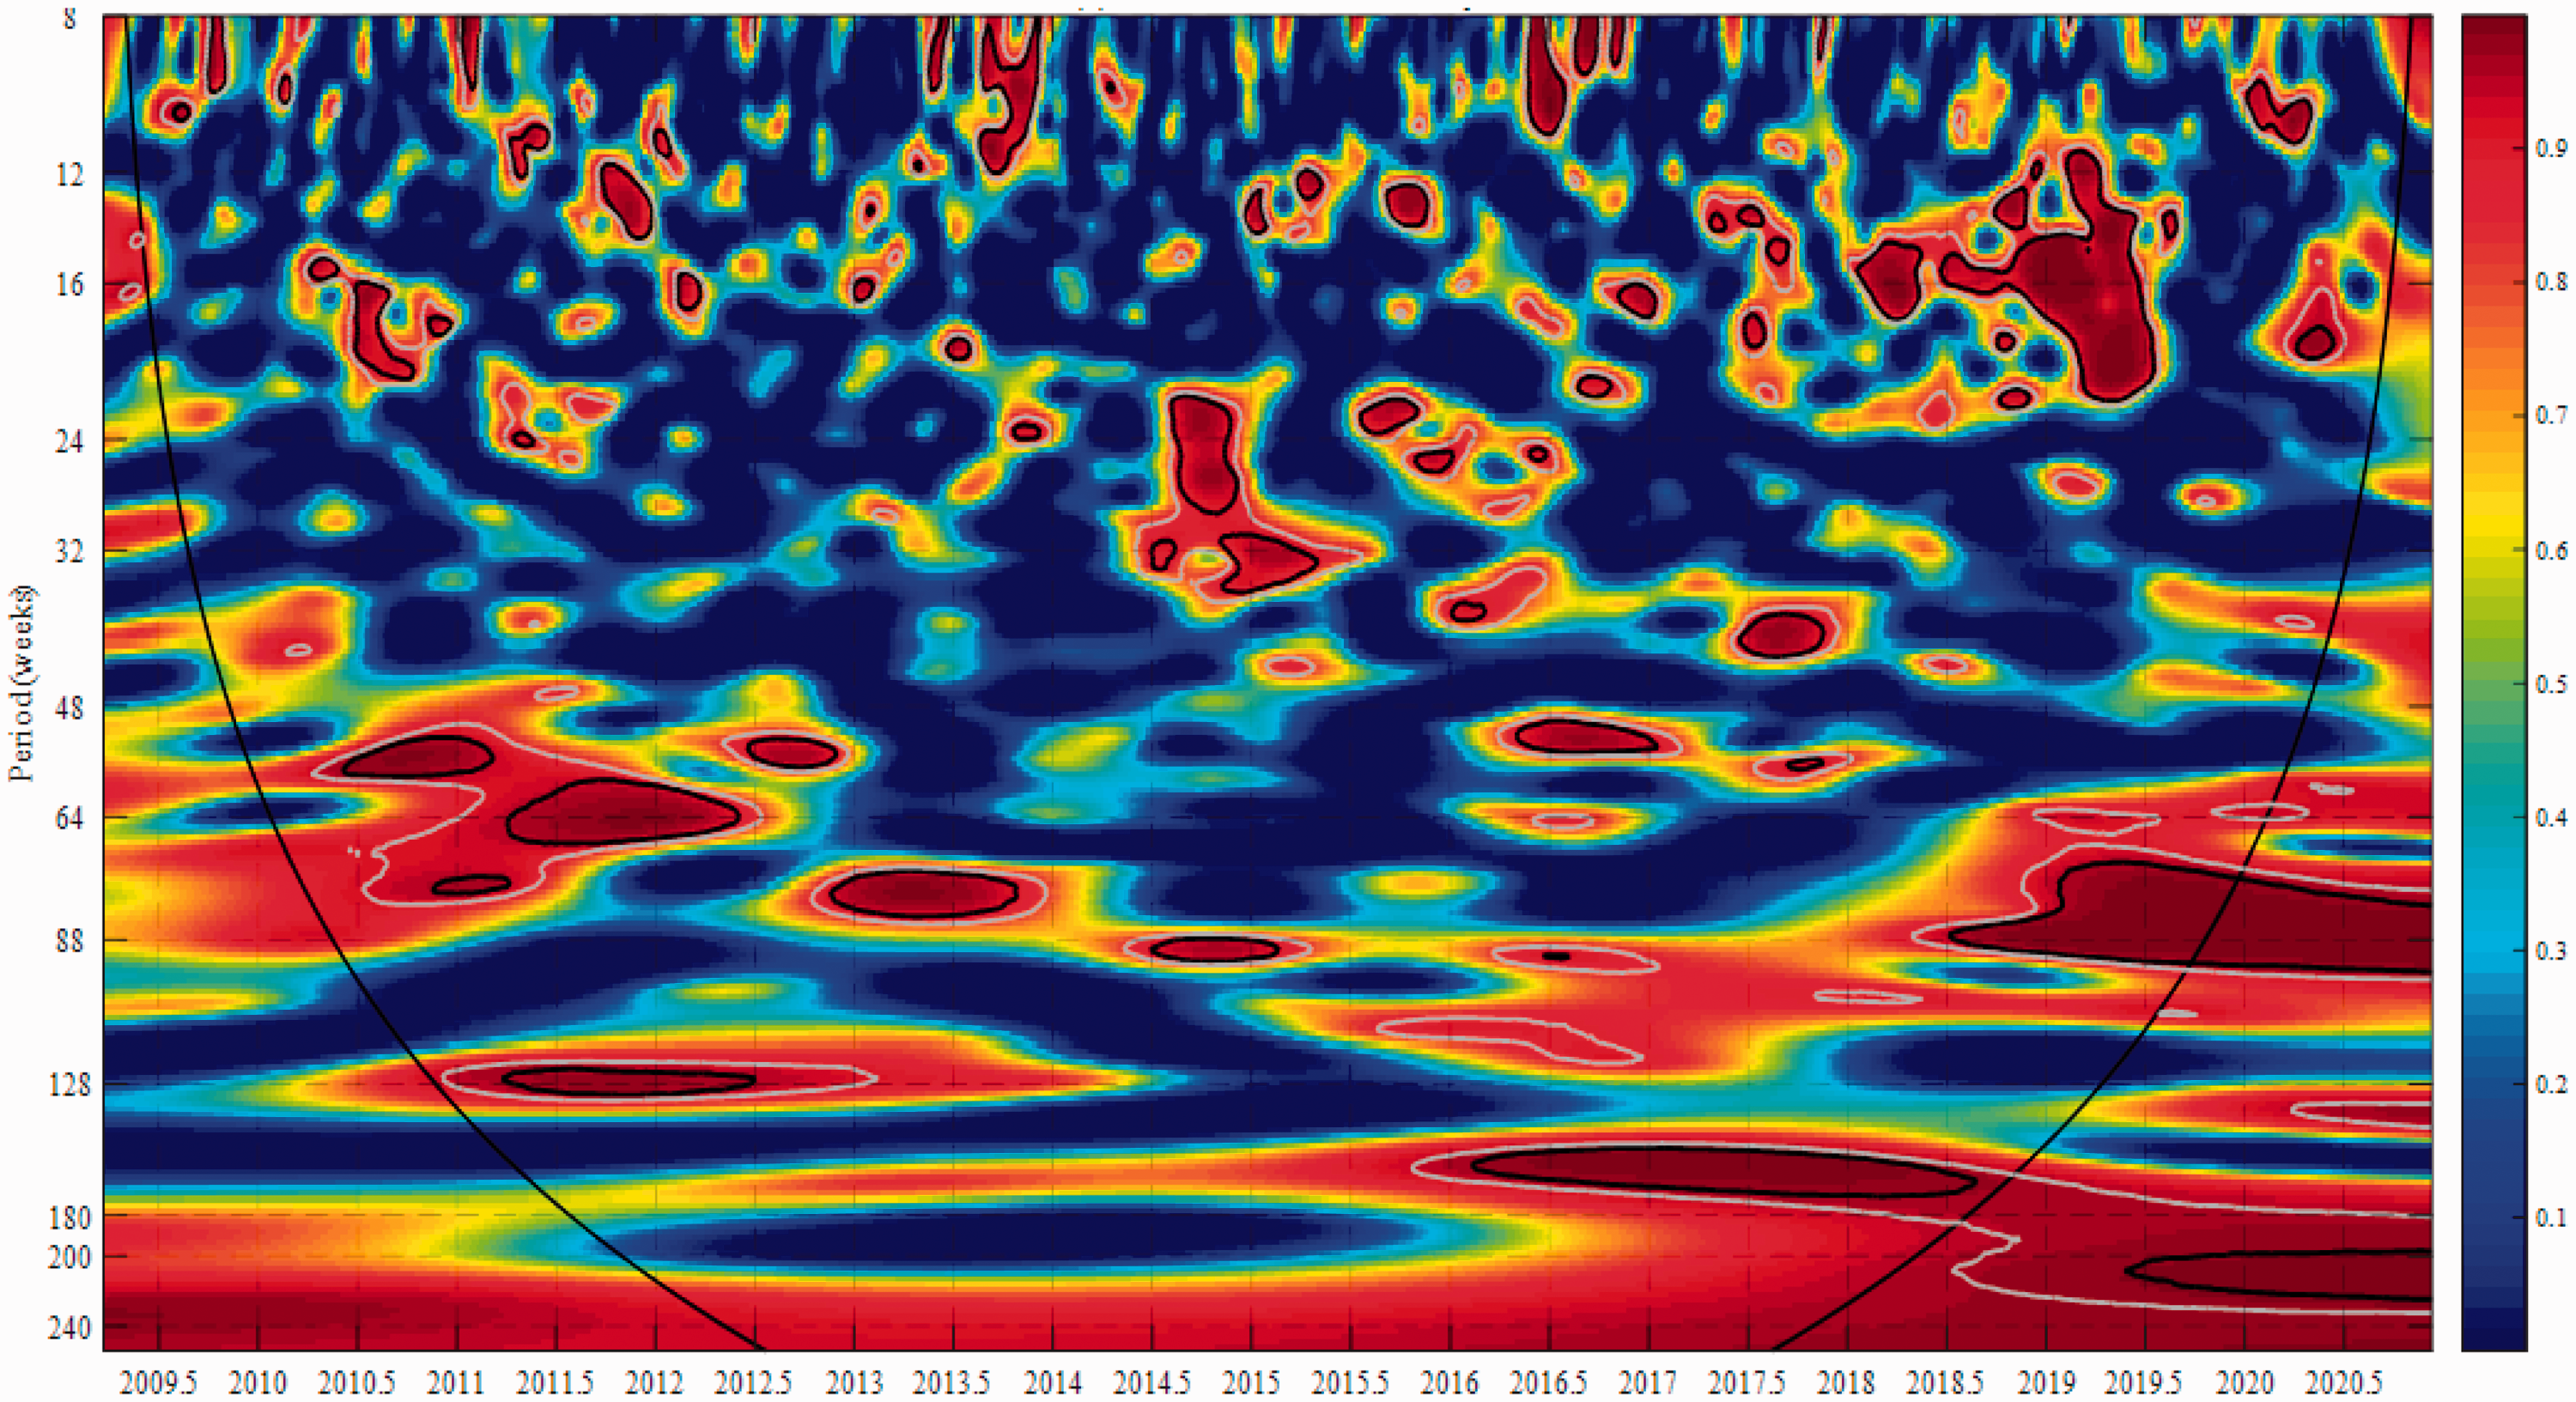
The partial wavelet coherence spectrum between EUA and Oil with control variables.
The correlations can be seen at high, medium and low frequencies, and exhibit quite different dynamics. Our graph reports many small and scattered red regions at higher frequencies, corresponding to the cycles of less than one-year periodicity. Among the 16–48 frequency bands, there are two main statistically significant regions of strong coherence. The first one is located in the 24–32 week frequency bands and runs from the second half of 2014 to the first half of 2015, which may be explained by the plunge of oil price in 2014. The second is located across the 14–24 week frequency cycles from the beginning 2019 to mid-2019. Possible reasons are the repeated reforms in Phase III of EU ETS, resulting from the desired effect on the boom of the carbon market.
What is more, in the intermediate bands for 48–200 week frequency cycles, the pronounced regions of high partial coherency range from the beginning of 2010 until the second half of 2019, followed by six different patterns of co-movements and are observable across most of the sample. These patterns are observed during (i) the 2011–2012 ESDC episodes, (ii) the first half of 2013 when the EU ETS stepped into Phase III carrying a lot of uncertain emission reduction policies, (iii) the oil price collapse as well as the medium-term measures to address the oversupply of EUAs d in mid-2014, (iv) the Brexit referendum in 2016, the US political turmoil in 2017 and the Sino US trade dispute in 2018, (v) the implementation of MSR in carbon market at the beginning of 2019 and finally (vi) the outbreak of COVID-19.
More importantly, a large red circle is detected over the sample period March 2009- December 2020 at the low frequencies, corresponding to the cycle’s periodicity above 200 weeks. These red areas show the high association between EUA and Oil price after controlling other endogenous variables in that particular frequency bands. Different from the results of Figure A2 showing the wavelet transform coherence between the two markets, there seems little coherence when other influence variables are ignored, except for the 180–200 week frequency bands. In brief, the apparent significant areas happen in the medium and long term.
The estimation of partial phase-difference and partial wavelet gain between carbon and oil prices
As described in The partial phase-difference and partial wavelet gain between carbon and oil prices with the control variables section, we calculate the values of partial phase-difference (PPD) and partial wavelet gain (PWG) in the time-frequency domain (Figure 6), which can give us information about the lead-lag relationship between EUA and Oil prices, and magnitude of the impact that a shock in Oil will have on EUA, respectively. To facilitate the presentation, we draw the mean values for PPD and PWG corresponding to the considered frequency bands. As it is difficult to attach any meaning to the phase-different in regions where the wavelet coherency is not statistically significant, therefore, we refrain from interpreting the phase-differences at shorter time scales of less than 12 weeks. Moreover, the contrast of Figure 6 and Figure A3 (the phase-difference and wavelet gain of EUA-Oil pair) indicates the crucial role of these control variables to explain the considered co-movements between EUA and Oil prices. Looking at Figure A3, we cannot observe a stable lead-lag relationship and steady size relation. Figure A3 even illustrates an opposite lead-lag relationship at some frequency bands, with a weaker level of correlation displayed in the partial gain chart.
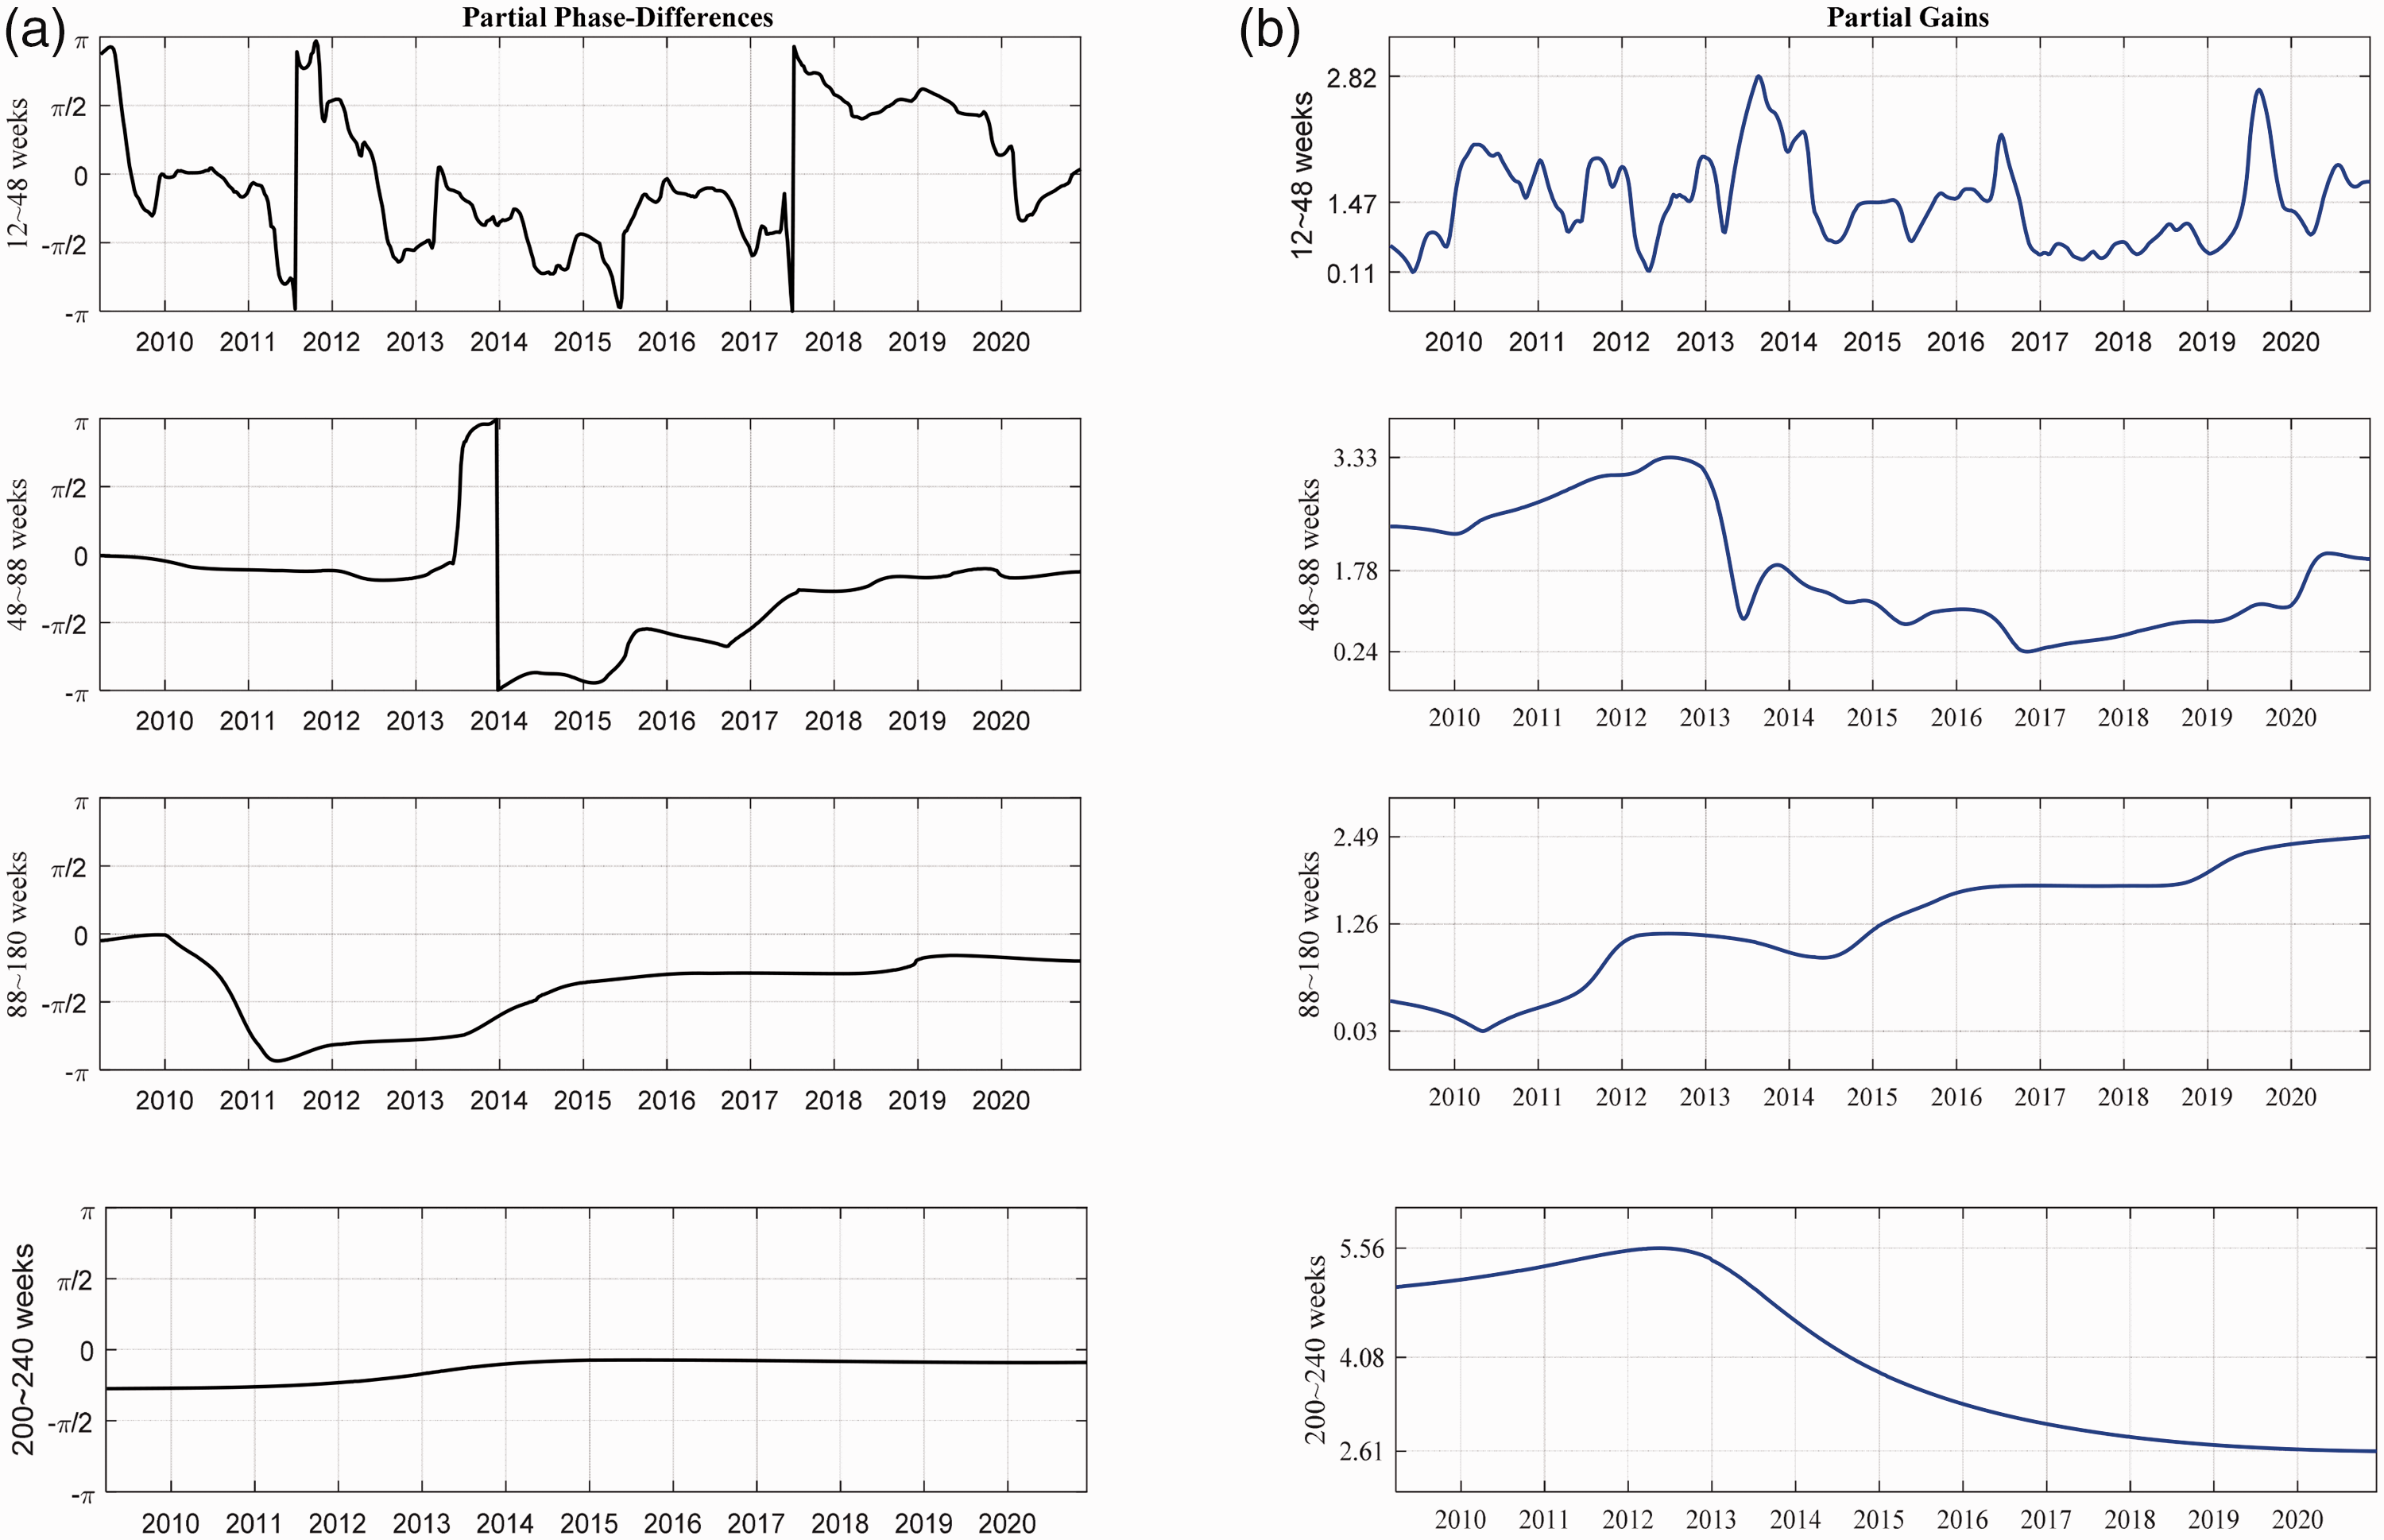
The partial phase differences and partial wavelet gain between EUA and Oil with control variables.
In higher frequencies (16–48 weeks), the PPD varies within the range −π to π, and many of them locate in −π/2 to 0. This means that the variables are almost perfectly in-phase and that, if anything, Oil is the leading variable. Owing to the financial nature of both markets, any market-related information can be quickly reflected in the market price. In other words, the stochastic factors such as market noise, speculative trading and information transmission among markets, could give rise to the normal market fluctuations, thus leading to the quite short and volatile duration of the effect. What is even more interesting is that the PPD switches between -π and π in the second half of 2011 and mid-2017. This means that the EUA-Oil nexus is out-of-phase when impacted by significant events and policy changes, such as the ESDC episodes and the US political turmoil (as mentioned above in Figure 5). According to the chart of partial gain, there is a distinct time-varying correlation between EUA and Oil, which fluctuates up and down within the scope of 0.11–2.82. Our results are somewhat in line with the research of Reboredo, 41 which documented that the relation between the two markets was extremely weak, and are also similar to the work of Zhang and Sun, 32 Liu and Jin, 34 i.e., that fossil fuel prices have no impact on the short-term dynamics of the carbon price. In this condition, there is no doubt that it is difficult for investors to carry out portfolio risk management and the market management for policymakers.
As for the medium frequency range (48–88 weeks and 88–180 weeks), the PPD is basically stable between -π/2 and 0, which indicates that the series move in-phase, with Oil leading. This is in accordance with a variety of previous studies (e.g. Koch, 14 Ji et al., 16 Tan et al., 19 Dutta 28 ) and fit well into the reality that the development of oil market is more mature. Interestingly, there are three situations that should be paid attention to. (i) The EUA and Oil price move together before 2010 at the intermediate frequency bands, as the PPD value reaches 0. However, it then turns out to be the leading role of Oil. (ii) From 2011 to 2014 at the cycles of 88–180 weeks, the relationship of EUA and Oil comes to be out-of-phase, and EUA is the leading variable. This is probably because there are many uncertainties in Phase III of EU ETS during the phase transition period, and so to bring about the oscillation of the carbon market. And then, investors will turn to the crude oil market to avoid the carbon market risks. (iii) It is also interesting to mention that the PPD value of the 48–88 weeks frequency bands switches from π to -π in early 2014. This suggests that the EUA-Oil nexus is out-of-phase when impacted by significant events and policy changes, such as the oil price collapse. Economically, this implies that, at these special frequencies, an increase in the oil (carbon) price is followed by a decrease in carbon (oil) prices. (iv) What is more, the PPD between 2014 and 2017 at the 48–88 weeks periodicity is [−π, −π/2]. It also illustrates that the EUA-Oil nexus is out-of-phase, while the leading role is EUA. During this period, the Brexit referendum had caused certain influence to the EU ETS, especially for the carbon market. In saying so, there would be volatility transmission from the carbon market to crude oil market. However, the relationship does not last long, which may be due to the immature of the EUA market. As can be seen from the PPD value among 88–180 weeks band, it then comes to be in-phase coherence with Oil leading. Meanwhile, the PWG line of these two frequencies ranges report an opposite correlation trend, but with the similar mean value.
Finally, in view of the lower frequencies (suited in the 200–240 frequency components, to be more precise), the relationship in this interval stabilizes between −π/2 and 0, indicating that the variables are in-phase, with Oil leading EUA. As the scholars (e.g. Zhu et al., 38 Yu et al. 40 ) deemed that, the lower frequencies can be treated as the long-term trends of the markets, i.e. the deterministic forces for the market evolution in the long run. From the trajectory of PPD, we can find the tendency is likely to towards 0, that is to say, carbon and oil price would move together in the future, especially for cycles with periodicities above 200 weeks or four years. The result is somewhat consistent with the works by Yu et al. 40 focusing on the multi-scale Granger causality investigation between carbon market and crude oil market, i.e., that they closely interact with each other in a bidirectional way on long-term trends. The long-term measure of MSR which implemented in early 2019 has improved the economic and environmental efficiency of EU ETS, presenting a closer relationship with the energy market. This can also add confidence to the stable development of the carbon market and the realization of carbon neutrality. What is more, it is conducive to promote emission reduction enterprises to actively participate in the clean and low carbon energy transition. More interestingly, the PWG value of the two variables could stable at 2.61 in the long run, about twice as large as that in the higher and medium frequency bands. In this context, this would be beneficial for the investors’ asset allocation and be conducive to the market and price management decision-making of policy regulators.
Notably, our results in the large timescales might contradict some previous studies, due to different sample periods, different research objects and different analysis techniques. For instance, Hammoudeh et al. 33 and Hammoudeh et al. 35 concluded a negative relation, using EUA and WTI spot prices during Phase I and Phase II, and depending on VAR model and NARDL model respectively. Tan and Wang 36 focused on a sample period from 2005–2016, using EUA and Brent futures prices, and they found a negative and asymmetric dependence resorting to the quantile regression model. Aatola et al. 22 using the data from 2005–2010 supported a unidirectional Granger causality running from the carbon market to Brent oil market. However, the four aforementioned works focused on the sample data during Phase I or/and Phase II of EU ETS. They ignored the critical uptick situation of EUA market after 2017, while this paper extends the sample period to Phase III until the end of 2020. Considering the sample data during Phase III of EU ETS, Xu et al. 37 based on a time-delay multilayer recurrence network method found a similar causality as the carbon market leading the crude oil market. Conversely, depending on the network diagrams calculated from the error variance decomposition results, the works by Ji et al. 16 and Tan et al. 19 focusing on a similar sample period from 2008–2018 showed that EUA acts as a net receiver of information from the oil market. Nevertheless, the three aforementioned types of research could not obtain the interactions between carbon and oil prices in the frequency domain, which is essential for finance and economic time series. From this point of view, Zhu et al. 38 utilized an EMD approach to deal with the task, while they supported a negative effect at the long timescales, using a sample period before 2017. Relying on a linear Newey-West estimator, they can only get the overall correlation limited to one frequency band. In a similar vein, Yu et al. 40 investigated the Granger causality between carbon market and crude oil market employing a multi-scale analysis approach, and obtained the relationship among each pair of matched components on a similar time-scale. However, they neglected the essential influencing factors from the external environment, which is possible to draw erroneous or even contrary conclusions. Moreover, apart from the mutual leading relationship between carbon and oil markets, the research of Yu et al. 40 could not get the magnitude of the nexus between them in different time-scales.
Differently, this paper extends the sample period until December 2020, and applies the more representative EUA and Brent futures prices, and then excavates their time-varying interdependence as well as frequency varying relations within the framework of wavelet coherency analytics. As can be seen from the results, the high wavelet coherency concentrates in long-term trends, while the short-term and medium frequency components possess a feeblish and unstable linkage, signifying that empirical studies might draw different conclusions even though by a uniform sampling frequency of data. Therefore, the conventional pure time-domain methods will lead to unilateral results. Most importantly, taking account the heterogeneous market subject of internal system and the necessary factors from the external environment, this paper innovatively constructs a theoretical analysis framework of the time-frequency interaction mechanism between carbon market and energy markets, and then carries out a detailed and precise analysis with the method of partial wavelet analysis. Synthesizing these aspects, this paper provides a more comprehensive and satisfying demonstration for the interaction mechanism between carbon and oil market, from a view of the time-frequency domain.
Conclusion and implications
Conclusions
Driven by achieving the goal of carbon neutrality, the marketization of carbon emission trading is an effective means to promote the development of a low-carbon economy and optimize the energy consumption structure. The carbon market and energy markets have significant information transmission mechanism through the carbon emission channel. However, due to the joint influence of the internal system and external surroundings, the interaction mechanism between the carbon market and energy markets behaves a high nonlinearity and complexity. This paper takes the most representative carbon price and crude oil price as the research object. Considering the obvious varying econometrics characteristics of carbon and oil prices across time scales, the article determines to explore the time-frequency interactions between European carbon and crude oil markets. We construct a logical analysis framework on the basis of the internal heterogeneity market participants and external factors, and then conduct the empirical research with a partial wavelet tool. The time span of our data is as long as twelve years, from March 2009 until December 2020, which is suitable to study cycles of periods longer than a year. Through comparison with the existing literature, our paper uncovers the following findings:
Firstly, a weak and unstable linkage is found in higher frequency bands (less than 1-year period cycles), which represents the normal market volatile. Since both of carbon and oil markets possess financial nature, they can rapidly digest and absorb the information, and finally, reflect the fluctuation of market prices. Hence, the causality relationship between them tends to be randomness for the short-term period.
Secondly, regarding the medium timescales (above one year but below four years), we observe a positive EUA-oil nexus, with the oil leading. However, some significant events and policy events after 2011 (i.e. the uncertainties during the transitional period of Phase II -to- Phase III of EU ETS, the oil price collapse, and the Brexit referendum) triggered striking influence on the co-movements between the two markets, the same to say, turning to an anti-phase relation. It is not difficult to understand that, as one relatively mature energy market, the oscillations of oil price are channels through which macroeconomic or financial uncertainties could spread to the carbon market. However, although oil price can be used as significant early-warning information of carbon price, these major political and economic events may increase the difficulty of market monitoring and prediction.
Thirdly, as to the long-term trends of the two markets, a stable and high partial coherency displays in cycles between 200 and 240 weeks, with oil leading for an in-phase relationship. Along with the more mature and efficient development of carbon market, the correlations between carbon and the nearest famous crude oil markets will become more and more intimate.
Discussion and implications
Research on the market interactions mechanism has great theoretical significance and practical application importance for relevant economic agents, including market regulators, emitting enterprises, financial institutions and portfolio managers. These agents require a better understanding of the dynamic and multi-frequency interactions in the carbon-oil system in order to build efficient and robust hedging models or when formulating policies. Inspired by the outcome of the study, several insightful enlightenments can be drawn as follows.
To begin with, our findings provide a foundation for policymakers to improve the risk control mechanism and maintain the stability of the carbon market. (i) Since there is a time-frequency interaction mechanism between carbon and oil markets, regulators should focus on identifying the risk sources in multi-frequency structure and test the direction and degree of the interactions. Specifically, the period in which it works with the strongest interactions should be carefully monitored in the carbon-oil system, to timely do a good job in risk warning and prevention control management. (ii) It is worth mentioning that the major financial crisis, energy market turbulence, international political events and global emergency will not only lead to a sharp increase in the volatility of the relevant markets, but also cause changes in the interactions between the carbon market and oil market to varying degrees, thus greatly reducing the risk control ability. Therefore, it is necessary to establish a risk early-warning management system of carbon market and improve the efficiency of joint-supervision. In this way, market regulators should build comprehensive energy, carbon markets and economic, ecological and environmental security related index system of important economies, and reasonably design early-warning signal, early-warning period and real-time monitoring system according to the time-frequency interactions between carbon markets and crude oil markets, so as to effectively reduce the impact of major events and prevent the spread of risk between markets to the greatest degree. (iii) In the long-term periods, policymakers should attach importance to the market design in cooperatively, since the carbon price and oil price would move together in the future. After all, the EU ETS undoubtedly offers a valuable experience for those emerging carbon markets under the carbon neutrality target. With R&D in clean energy technologies and the constant optimization of energy consumption structure, the carbon market is becoming more and more efficient and globalization.
Second of all, we find evidence of predictability of carbon price volatility arising from the interaction mechanism between carbon and oil markets, which are informative for investors and portfolio managers. The empirical results show that the crude oil price changes can be regarded as important antecedent information at medium and long time-scales. Since the carbon market is not strongly connected to the oil market at short-term scales according to their faintish partial gain, there may be diversification opportunities to exploit for investors. Nevertheless, during the medium-term periods, financial players should pay more emphasis on improving the recognition and forewarning experience of market anomalies. They should not ignore the risk impact of major events such as international energy market turbulence, global economic and trade shocks, extreme climate change and epidemic outbreaks, which result in different extent effects and different action periods. In this sense, they may need to rely more on computational financial tools for hedging strategies against extreme risk.
Finally, emission control enterprises should accelerate energy transformation and upgrading and effectively prevent external risks. Our results conclude that, while promoting energy conservation and emission reduction, the carbon market bears more external risk shocks, such as the impacts from the crude oil market and major events. The outbreak of COVID-19 has dealt a heavy blow to the world economy and carbon market, but also ushered in the opportunity of transformation and upgrading for economic development. Therefore, in the environment of carbon neutrality, emitting enterprises should actively adjust the industrial production path to prevent the risk of short-term energy price fluctuations and the spillover effect caused by medium and long-term industrial structure adjustment and technological changes. At the same time, they should also pay attention to the severe impacts caused by external major economic and energy events through the time-frequency interaction mechanism.
Footnotes
Declaration of conflicting interests
The author(s) declared no potential conflicts of interest with respect to the research, authorship, and/or publication of this article.
Funding
The author(s) disclosed receipt of the following financial support for the research, authorship, and/or publication of this article: The author(s) acknowledge financial support from the National Natural Science Foundation of China (Grant No. 71971071and Grant No.71373065), and the Fundamental Research Funds for the Central Universities, North Minzu University (Grant No. 2021KYQD04 and Grant No. 2021XYSJJ05).
Notes
Appendix 1