
Abstract
The industrial development alongside inadequate planning in the energy sector put demand-side pressure on Pakistan's energy demand. Similarly, the excessive dependency on fossil fuels has an ecological footprint. Moreover, the abuse of energy tariff subsidies and deficits had a detrimental effect on department earnings, limiting the sector's emergence and intensifying its crisis. This research examines the electric demand and supply imbalance in the context of the China–Pakistan economic corridor investments using the system dynamics modeling approach, highlights the renewable resources, and discusses the hurdles in the way of green conversion. Moreover, the study forecasts the production capacity, electric demand, and supply up to 2040. The results show that China–Pakistan economic corridor investments will uplift the production capacity up to 12.9%, whereas the average production will reach 15.8%, variables that were 5% and 4.8% before China–Pakistan economic corridor. As a result, the energy sector will be able to meet the energy demand after 2021. However, the current investment in the renewable industry will not help in achieving policy targets. The study provides targeted implications to overcome potential barriers to the green path.
Keywords
Introduction
Access to clean, appropriate, and affordable energy is a foundation for a sustainable growth path. 1 Therefore, energy economics focuses on resource allocation for an uninterrupted supply of energy to society. 2 It is reliant on the policies and demand–supply forces of the market, which mainly cause uncertainty for the energy planner who focuses on evolving the environment for investments in this sector. 3 Future energy policies are based on economic, environmental, and political factors that determine the technology needed to meet the future energy demand. 4 Electricity planning in the developing world is normally linked with gross domestic product (GDP) growth as it boosts energy consumption and uplifts electricity demand. 5 The other factors, such as climate change, 6 rural electrification and household consumption, 7 industrialization, and international trade 2 are putting demand-side pressure while resources are diminishing. Whereas, outdated technology and lack of proactive behavior at sectoral expansion and policy side are not supportive to uplift production. 8 Therefore, an uninterrupted electricity supply is determined by the price, the prices of alternative sources, costs, inappropriate planning and expansion, 9 inadequate maintenance of power plants, 10 expensive materials/ingredients, and outdated technology. As a result, it suppresses power supply, 11 making it expensive for end-users and heavily dependent on fossil fuels causing 37.8% of greenhouse gas (GHG) emission. 2 The taxes and power tariffs reduce the revenues of power producers, motivating them to shift their investments to other sectors causing a supplementary power shortfall. 3
Pakistan's economy maintained a stable GDP growth of 7.2% during 2001–2007, uplifting electric power demand. 12 However, inappropriate planning and expansion in the power sector caused severe power cuts that cost 2.4% of GDP loss, unemployment of 0.53 million, and trade loss (exports) worth $1.3 billion. 10 The power sector was never able to catch up with the energy demand, and therefore, an energy crisis started in 2007. 5 The GDP losses in 2015 reached 3.8% annually, with 40% of industries being closed and about 7.5% of the labor force being out of work. 13 In addition, imported coal, oil, and liquefied natural gas (LNG) were worth 23% of total imports, costing $12.75 billion. They increased the cost–tariff deficit and added 37.8% of the total GHG emission. 11 The upsurge in the prices of fossil fuels and line losses dragged the sector towards a financial crisis. Things got even worse due to the inadequate maintenance of power plants, resulting in de-rated capacity, the misuse of energy tariff subsidies, and inefficient and inaccurate forecasting. These factors resulted in an electric power shortage of 4153 MW in 2014, 9 which translated into a circular debt worth $6.6 billion.14,15 To handle this situation and increase electric supply, the energy sector needed heavy upgrades in infrastructure, which required notable investments. During this period, the geopolitical situation and political unrest did not create a suitable climate for private investors interested in transferring funds. Metaphorically or not, this crisis moved the country toward darkness, the power shortage, and discouraged local industrialists that moved their production plants to Bangladesh and China. 5
In this situation, China initiated the China–Pakistan economic corridor (CPEC) project in 2015, which is part of the belt and road initiative, which provides access to China to move their commodities and oil through Pakistan. Initially, China agreed to invest $59 billion, including energy and infrastructure projects, and the amount rose to $87 billion in 2020. 16 It brings new hope for the energy sector of Pakistan. Out of the total, $35 billion (20% of Pakistan's GDP) has been allocated for the energy sector, including investments in 19 projects related to hydroelectric power, wind power, and solar and coal. The successful completion of these projects will help to reduce the demand–supply gap in the power sector and double the production capability.17,18 In addition to this, the project ensures energy security because of the Iran–Pakistan–China oil and gas pipeline. 4 This investment came when total inbound foreign direct investment (FDI) was only 0.671% of GDP. The average circular debt of the sector was $1.96 billion more than inward following foreign investment, and the government was providing subsidies to stabilize the sector at the cost of a budget deficit 5 . CPEC energy projects are summarized in Table 2.
Energy projects under China–Pakistan economic corridor (CPEC) investments.
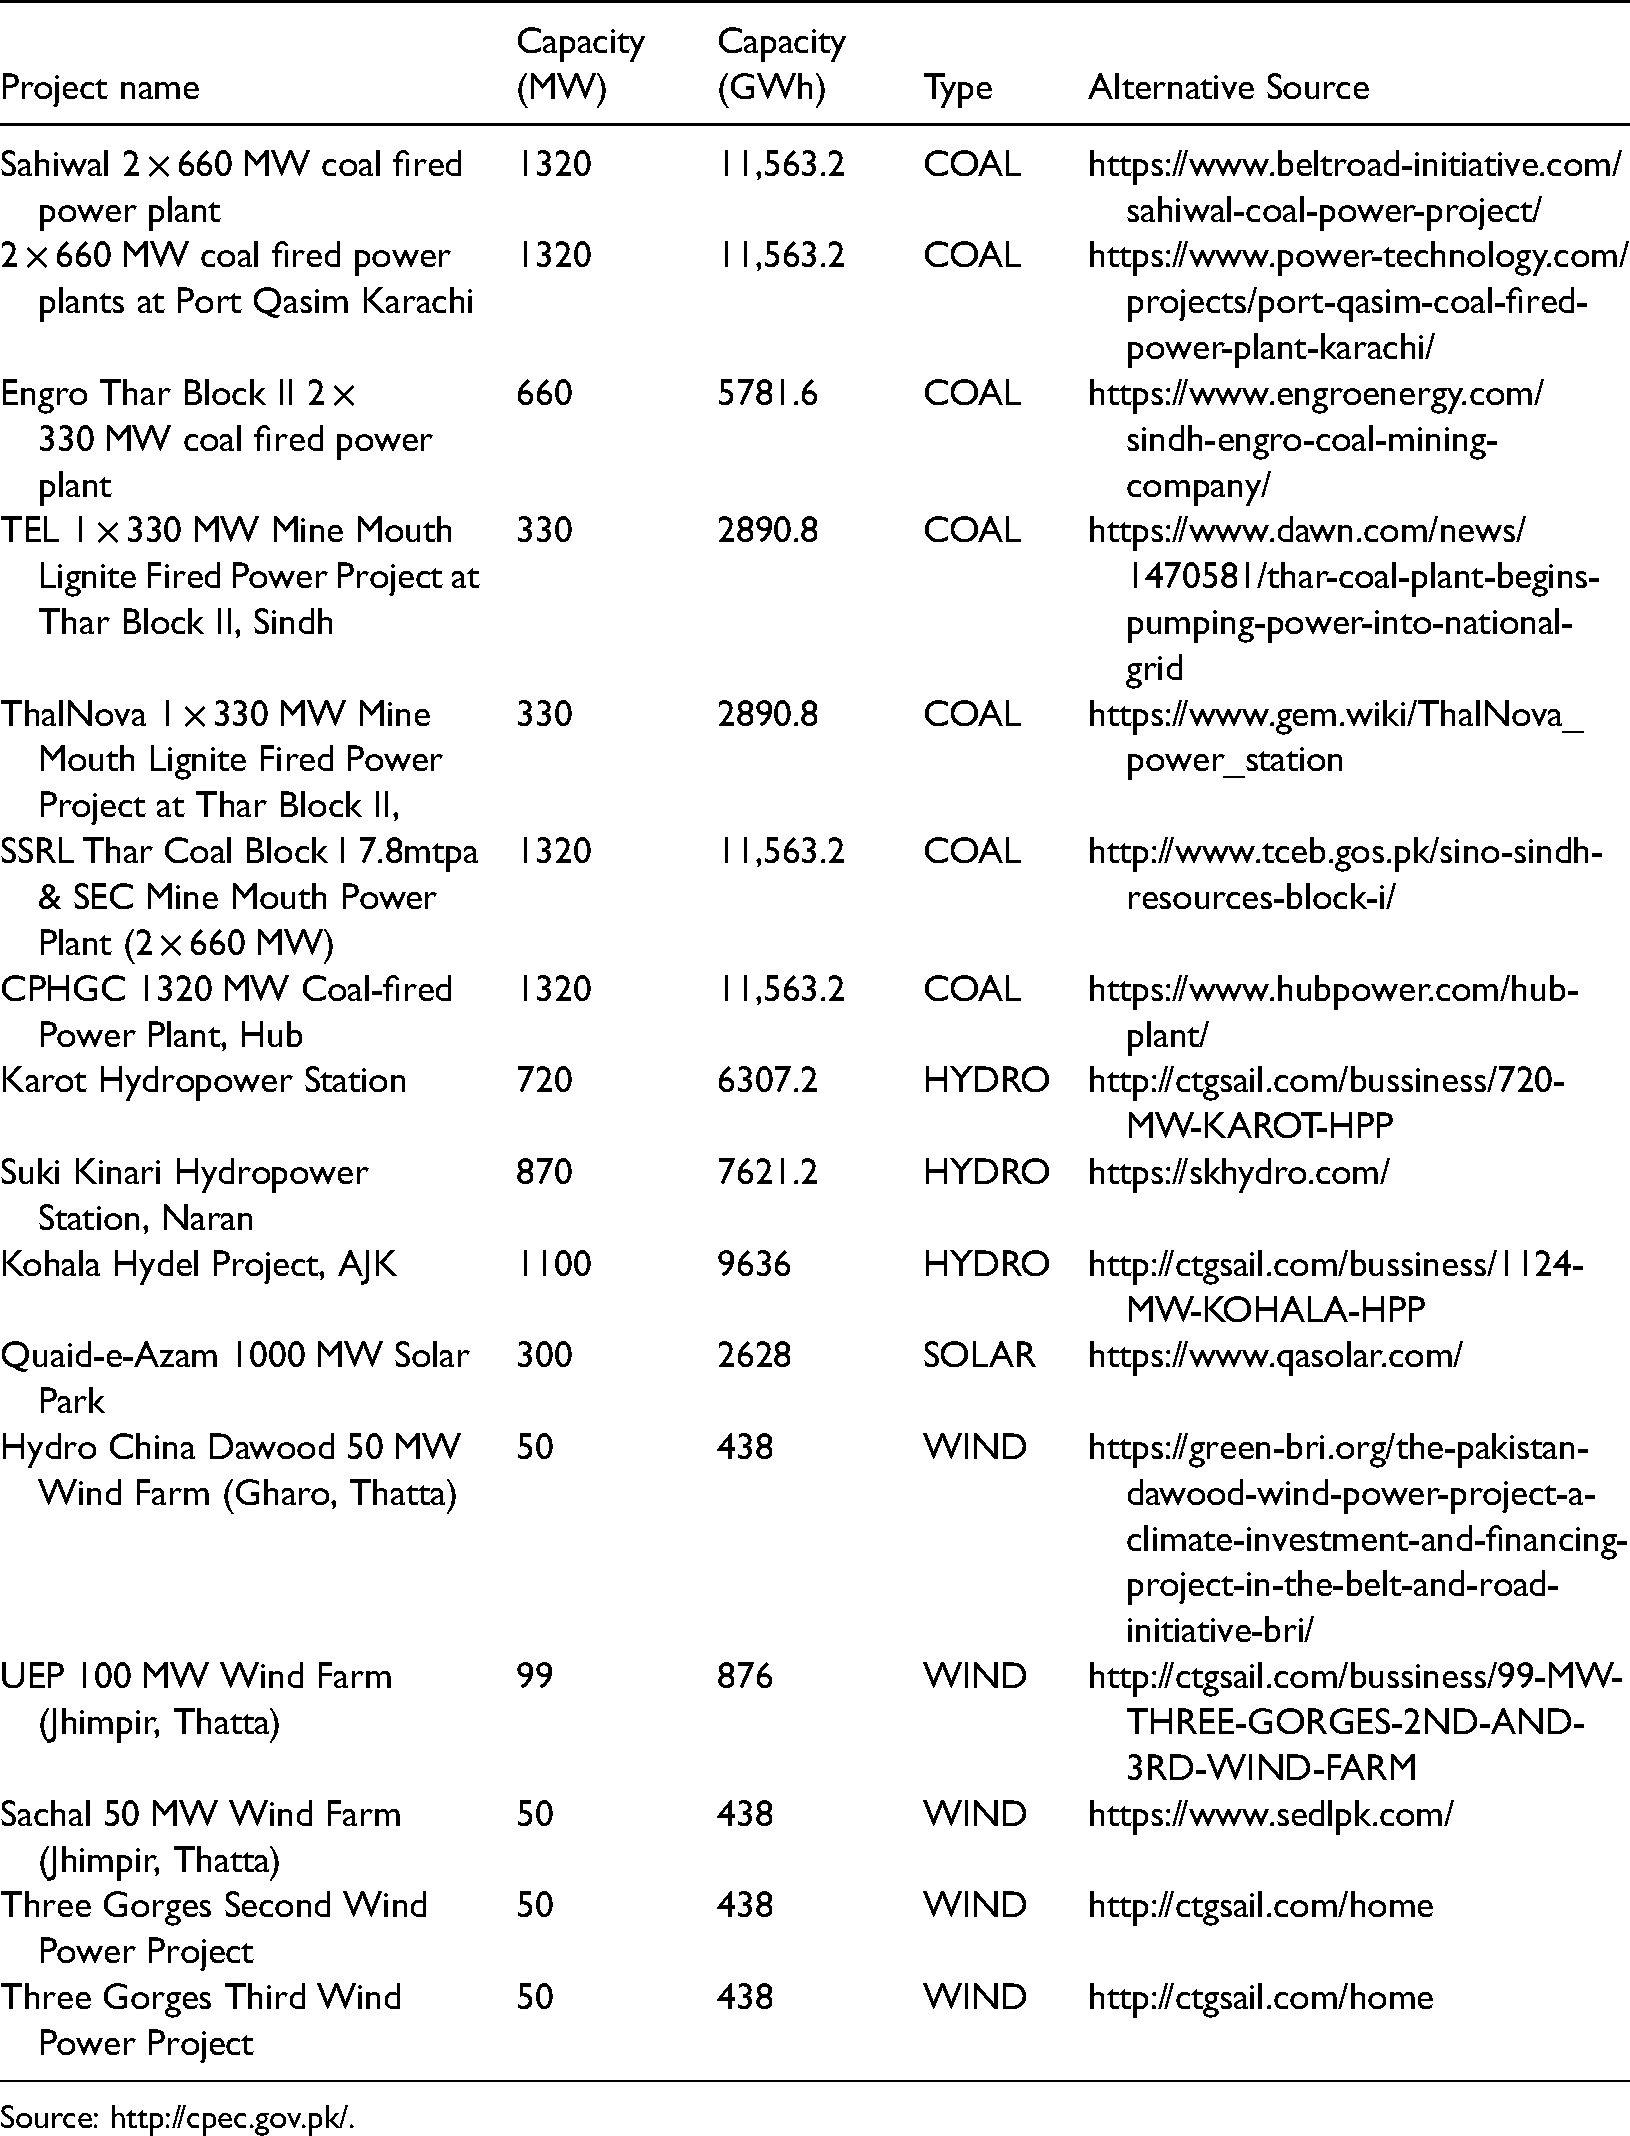
Source: http://cpec.gov.pk/.
An extensive number of studies have been conducted on electricity demand and its impact on economic growth.19–22 The above-mentioned investigations tested the relationship using different methodologies, and none of them disagreed with the positive relationship between energy consumption and economic growth. The studies23–26 used cointegration and causality methods to check the nexus between electricity consumption and economic growth. They concluded that business uplifts energy consumption that in turn boosts economic growth. Other studies produced results that advocate the fact that with results that business development expands the electricity consumption in the country. 13 Similarly, the energy consumption of 1 kt uplifts the GDP by $2.517 million. 27 Emir and Bekun 19 examine the energy consumption and growth using an autoregressive distributed lag (ARDL) model and document on the energy-led growth hypothesis in Romania. Khan et al. 10 studied the electricity demand function and found it to be stochastic. In very recent studies, Gershon et al. 28 examine the energy-growth relationship for west African countries using a panel fully modified ordinary least squares setup. They find out that electricity consumption and GDP growth are positively interconnected. They suggested that even in countries with inadequate energy access, it is essential to implement energy efficiency policies and initiatives, boosting production for each unit of energy consumed. 28 Similarly, Anastacio 29 studied the relationship between electricity consumption and growth in Canada, the United States, and Mexico by panel fully modified ordinary least squares that uncovered a causal relationship between the variables. Bano et al. 30 examine the impact of electricity availability on FDI and the economy using the ARDL method. The results of this study show that electric shortfall discourages investors and reduces inbound FDI. As a result, it reduces productivity, causes unemployment that negatively affects the economy. 30 Cevik et al. 31 studied the impact of renewable and non-renewable energy consumption on economic growth in the USA using a Markov-switching vector autoregressive analysis. The results show that there is bi-directional causality relation between non-renewable and economic growth. However, they did not observe a causal relationship running between the variables. 31
Ou et al. 32 studied the economic impact of electric shortage in the case of China by employing computable general equilibrium modeling. The results show that electric shortfall is a threat to sustainable economic development and mainly hits the industrial sector of the economy. 32 Similarly, Allcott et al. 33 examine the influence of electric shortfall on India's industrial sector. They found that the producer's surplus and plant revenues decrease up to 5% to 10%. Shortages affect the production size distribution because generator prices have large economies of scale, and shortages harm facilities without generators more severely. 33 However, retail power contracts might significantly lessen the effects of shortages. The electric shortfall directly affects the economy through agriculture and the industrial sector. It squeezes these sectors, reduces productivity, uplifts unemployment and poverty, causes inflation, and suppresses the country's GDP. 27 Nawaz et al. 34 examined the demand function of electricity using a smooth transition autoregressive model and concluded that continuous investment in this sector is required to meet future demand. They further argue that electricity has a high-income elasticity, although prices are lower than unity. In addition to this, the results showed that the real average prices are below the required amount. The weaker relation between power demand and the price of electricity is mainly due to the absence of electrical alternatives. 34
Perwez et al. 35 examined the supply–demand relationship and forecasted the electricity supply in Pakistan over the study period (2011–2030) using the Leap modeling approach. This study forecasted the supply from available resources but neglected the CPEC energy investments and their possible outcomes in the future. 35 Raza et al. 36 studied the impact of CPEC energy investment on economic development and growth for a period from 1990 to 2016 and concluded that it would help uplift the industrial sector and boost growth. However, this study did not discuss the increasing demand and production of electricity in the case of CPEC. Junejo and Khoso 37 examined the impact of energy crises on industrial growth using multiple regression analysis approaches for 2005 to 2015. The author reports that energy crises seriously impact Pakistani industries and negatively affect growth during the study period. In addition to this, CPEC investment in the energy sector will create more employment opportunities and encourage industrialization to bring Pakistan on a sustainable growth path. However, this study did not explain when these projects will overcome this gap along with the green potential and investments required to complete conversion from gray to green energy. Iqbal et al. 38 studied the impact of CPEC investment on the energy crises of Pakistan using the generalized methods of moments and ARDL techniques. The study concluded that Chinese investments would reduce the electricity deficit and positively affect growth in Pakistan. However, the article did not discuss or forecast the timeframe related to the demand–supply gap and capacity. In addition to this, the article did not discuss future demand. Mirza et al.39 try to forecast energy consumption due to the economic activity caused by CPEC. The results show that energy consumption will increase by 41% in 2030 compared to 2013. 39 The study focused on the consumption side and forecasted consumption while ignoring the demand and capacity scenario.
In sum, the previous research concentrates on the cause–effect relationship between electricity demand and consumption and their correlation with economic growth. Furthermore, previous studies investigated the impact of electricity shortages on various sectors and discussed their economic implications on industries. However, in Pakistan, studies overlooked the Chinese investment plan, representing the highest investment in the country's history. Moreover, none of the studies forecasted the electric supply or production capacity in the following years and how it will affect the country's economy. Nevertheless, this study will serve as a benchmark for future studies by answering the following questions and will assist policymakers in establishing sustainable energy policies.
This investigation will explain the current electricity demand and supply scenario and discuss the available green energy resources. In addition to this, it empirically examines and forecasts electricity production, demand, and capacity in the context of CPEC. Moreover, we intend to analyze renewable energy policy objectives, illustrate renewable energy resources, and argue for a shift toward them. This study will forecast the demand-based growth during the study period, which will assist researchers and policymakers in their future work. This study attempts to answer the following questions and contributes to the existing literature in the following ways. First, as the electricity demand increases and the existing electricity supply are lower than the demand, how long would it take CPEC production to meet the demand? Second, this study attempts to forecast the total production, demand, and productive capacity from 2019 to 2040. Third, in light of the renewable policy targets, do Chinese investments help achieve renewable energy targets? If not, how much more renewable production is required to achieve these targets? In addition to this, we explain the reasons to shift from fossil fuels and discuss the barriers in the way of green energy. Fourth, we forested the energy demand and consumption-based economic growth. It will help policymakers plan the energy demand and supply to boost or achieve a certain level of growth. Fifth, this study applied a system dynamics (SD) modeling approach with a strong ability to describe complex relationships. The SD model is a computer-aided computational technique for analysis, using common feedback and interconnection, of complex and dynamic frameworks. 40 The underlying ideas for creating the model depicting the structure utilizing feedback loops, stocks, and flows are provided by the SD theory. SD theory is a useful way of determining how interrelated factors interact inside complex and dynamic systems and their outcomes are more reliable than traditional econometric techniques. 41 The study assumes that the growth patterns of electricity production through national sources would remain the same during the study period; only the effect of CPEC projects would be added to the existing generation. To the best of the our knowledge, these questions have never been tested in the CPEC context, and the SD modeling approach has never been used for energy sector research in Pakistan.
This study is organized in the following way. The next section illustrates the electric power sector, the demand–supply situation, and green energy resources. The third section is dedicated to the methodology used in the study. The fourth section examines the scenarios and forecasts the total production, demand, and production capacity. In addition to this, it explains the reasons to shift toward green energy highlighting the barriers to conversion. Finally, the last section concludes and provides relevant policy implications.
Electricity demand–supply and renewable resources
Pakistan's electric power sector has five main divisions, namely Water and Power Development Authority (WAPDA), Independent Power producers (IPPs), Karachi Electric Supply Company (KESC), Pakistan Atomic Energy Commission, and Generation Company (GENCO). The electric power structure of Pakistan can be seen in Figure 1. WAPDA is responsible for infrastructure and hydropower generation. National Transmission and Distribution Company (NTDC) is in charge of restructuring/reforms and electricity distribution. Finally, KESC is the only integrated electric power company involved in power generation and distribution throughout Karachi. 42
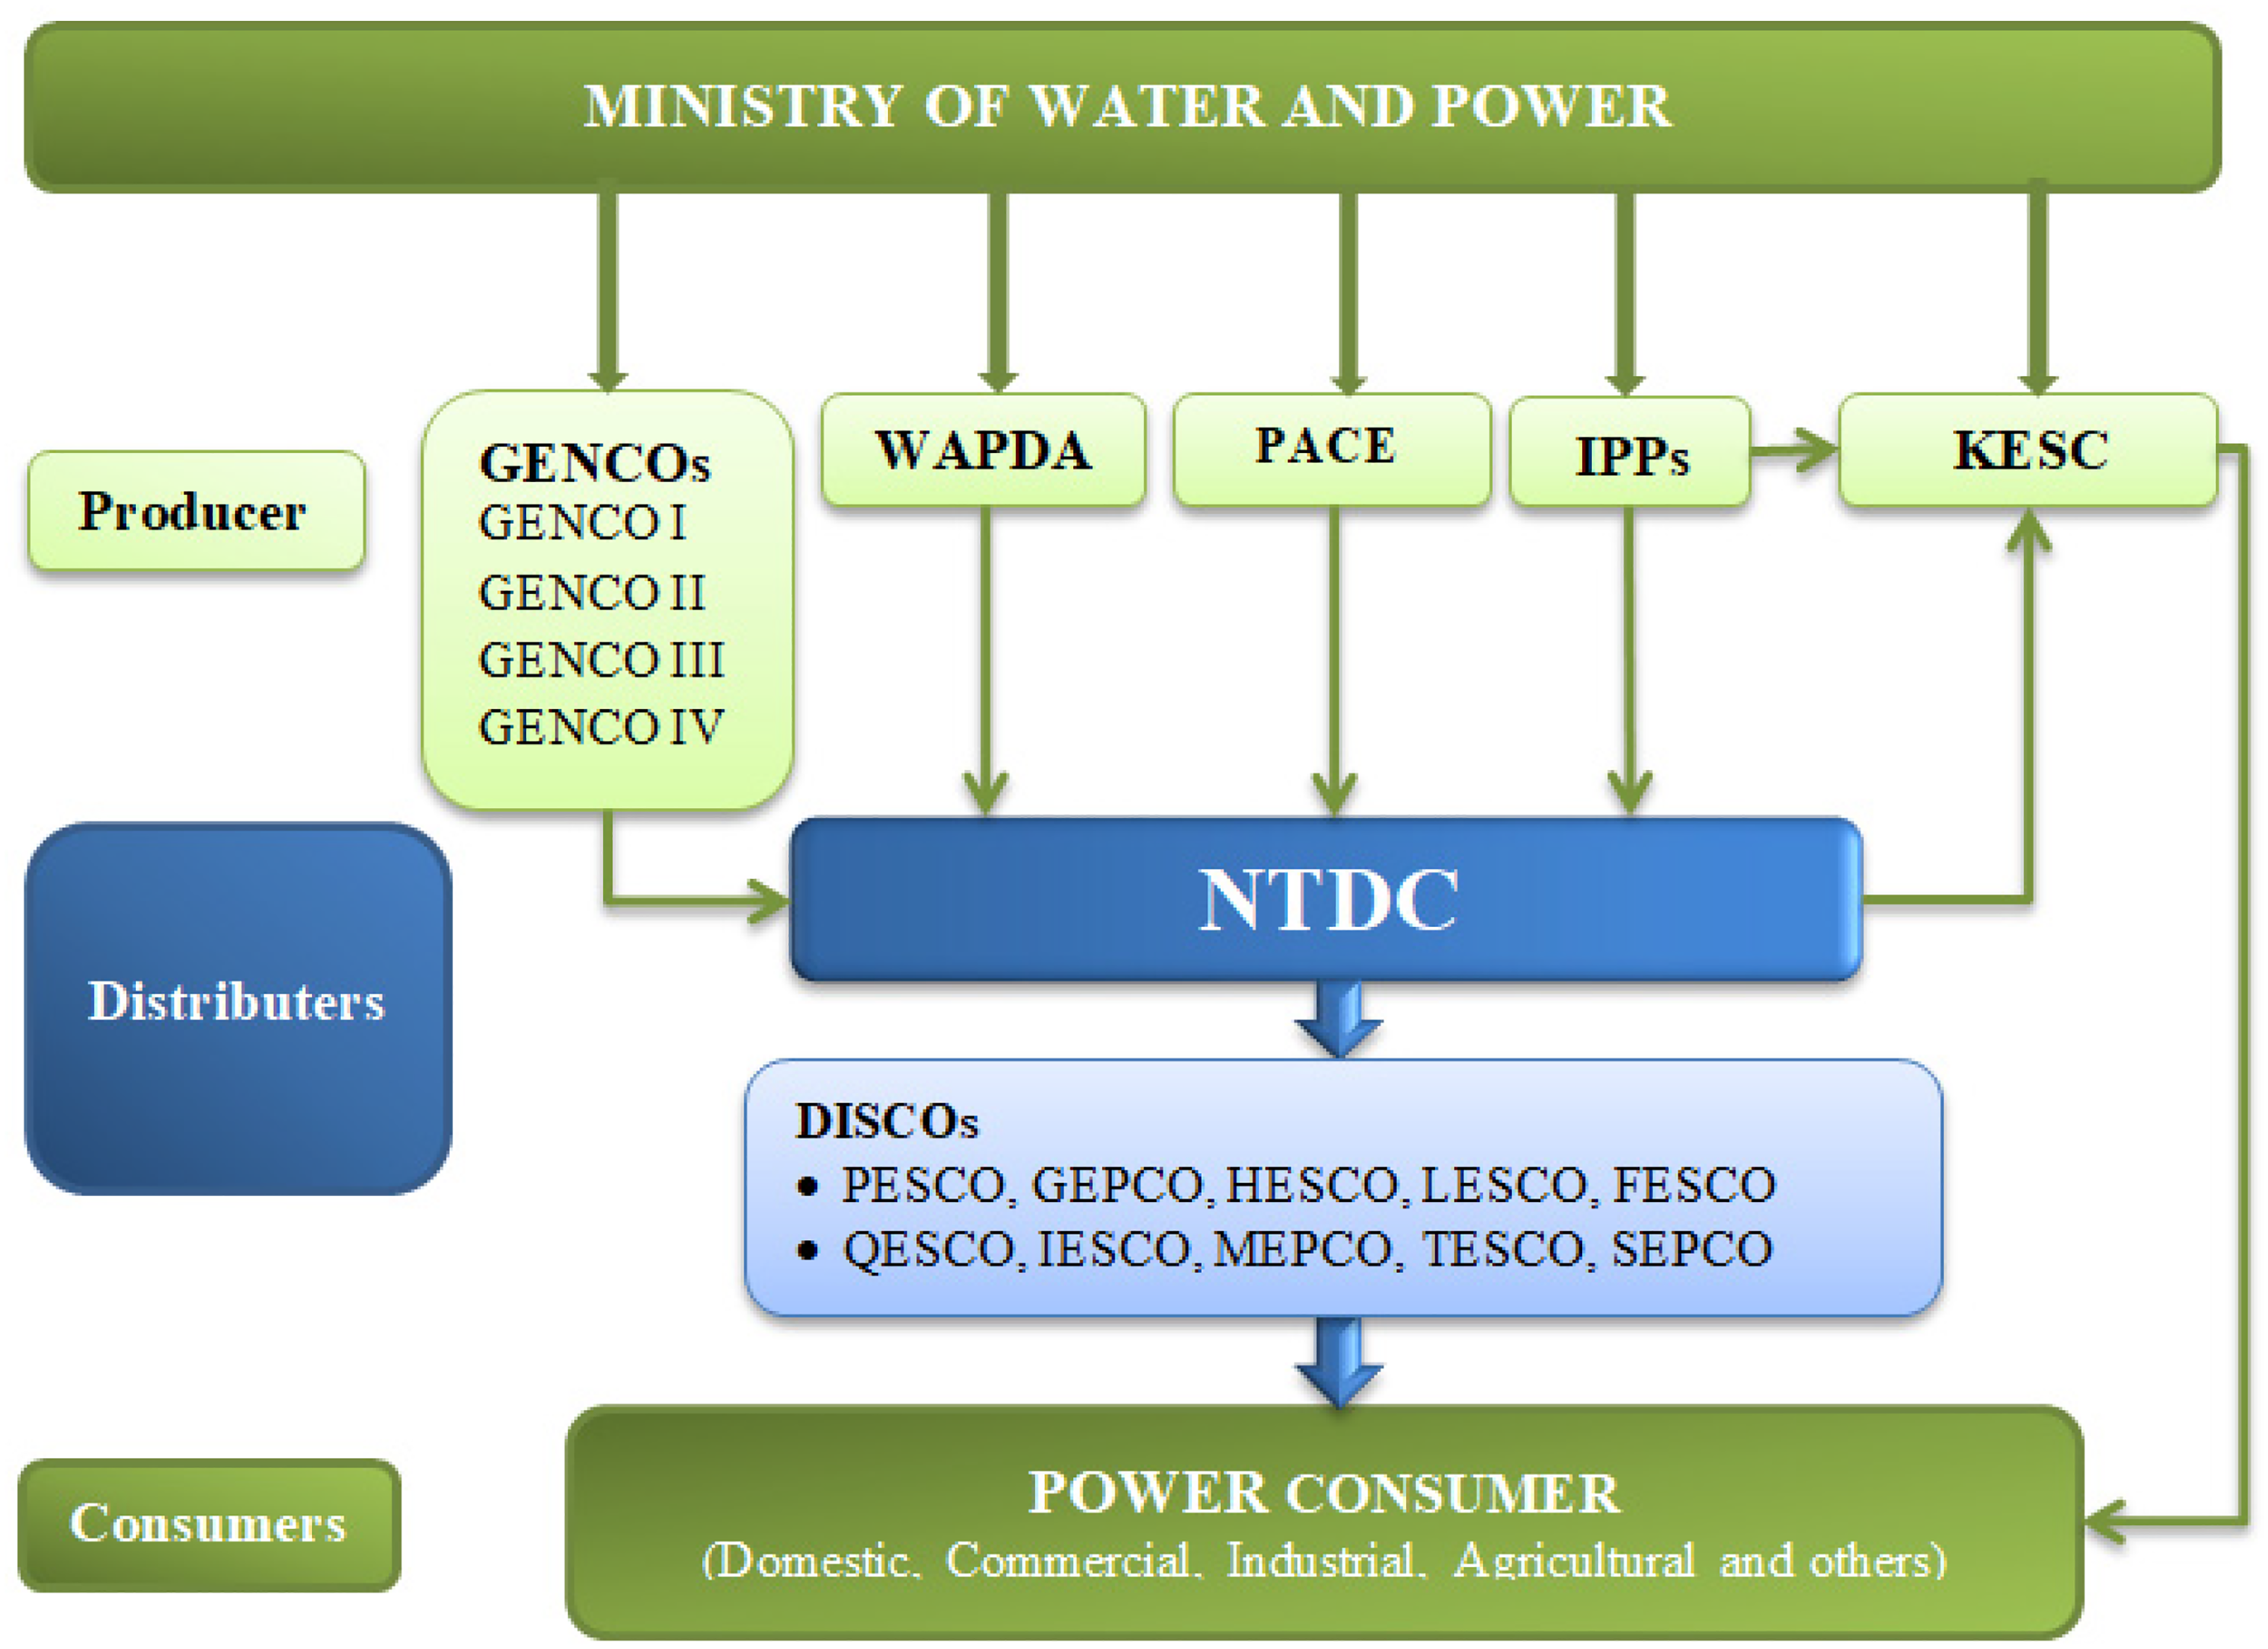
Electric power structure in Pakistan.
Electricity demand analysis
The country's electricity end-users are mainly divided into domestic, industrial, agricultural, commercial, and other sectors. Nearly 80% of electricity users are from the domestic sector, with an average annual growth rate of 3.6% over the past decade, making the supply system complex and making it much more difficult to regulate peak load management. Table 3 (see the Appendix) summarizes category-wise power consumers from 1983 to 2018. It shows that consumers in the industrial sector are growing at an annual average rate of 2.57%, mainly because textiles, cement, and leather products requiring constant-power sources. 43 Commercial and agricultural sector demand is growing with an annual growth rate of 2.46% and 3.02%, respectively. Figure 2 illustrates that the electricity demand from 2001 to 2018 increased with an annual average growth of 5.01%. 44 The improved living standards during the same period uplifted the energy demand by 5.17%. In 2018, the demand for electricity in the industrial sector was 23.2 TWh, in the agricultural sector, 9.98 TWh, in the commercial sector 6.75 TWh, and in other sectors 10.76 TWh. The quantitative effect of power shortages is also considered by examining the demand and supply gap from 2002 to 2018, as shown in Figure 3. In 2003, the deficit was zero and became 3984 MW in 2011 and was recorded at 5454.7 MW in 2018. 44
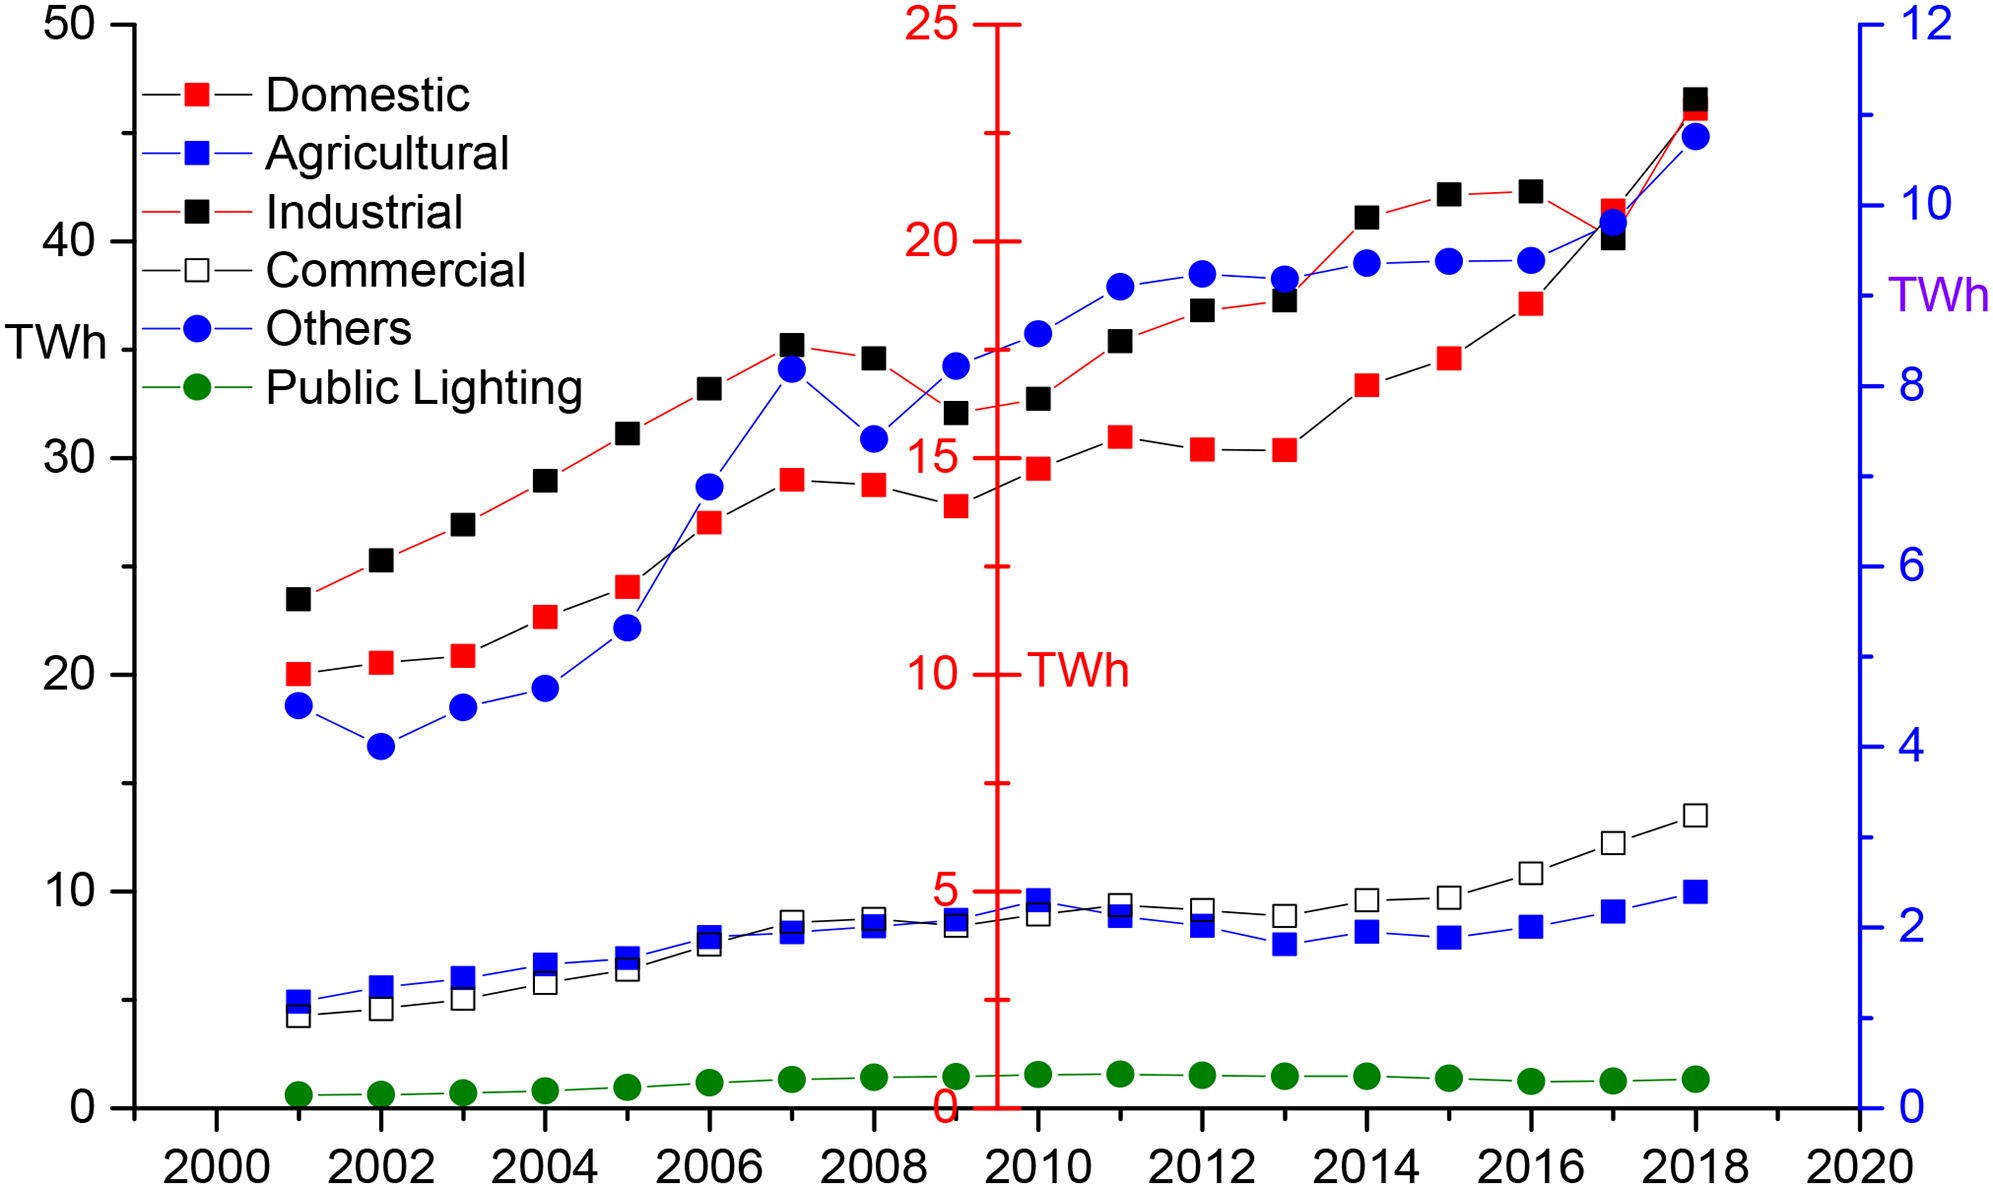
Sector-wise electricity consumption.
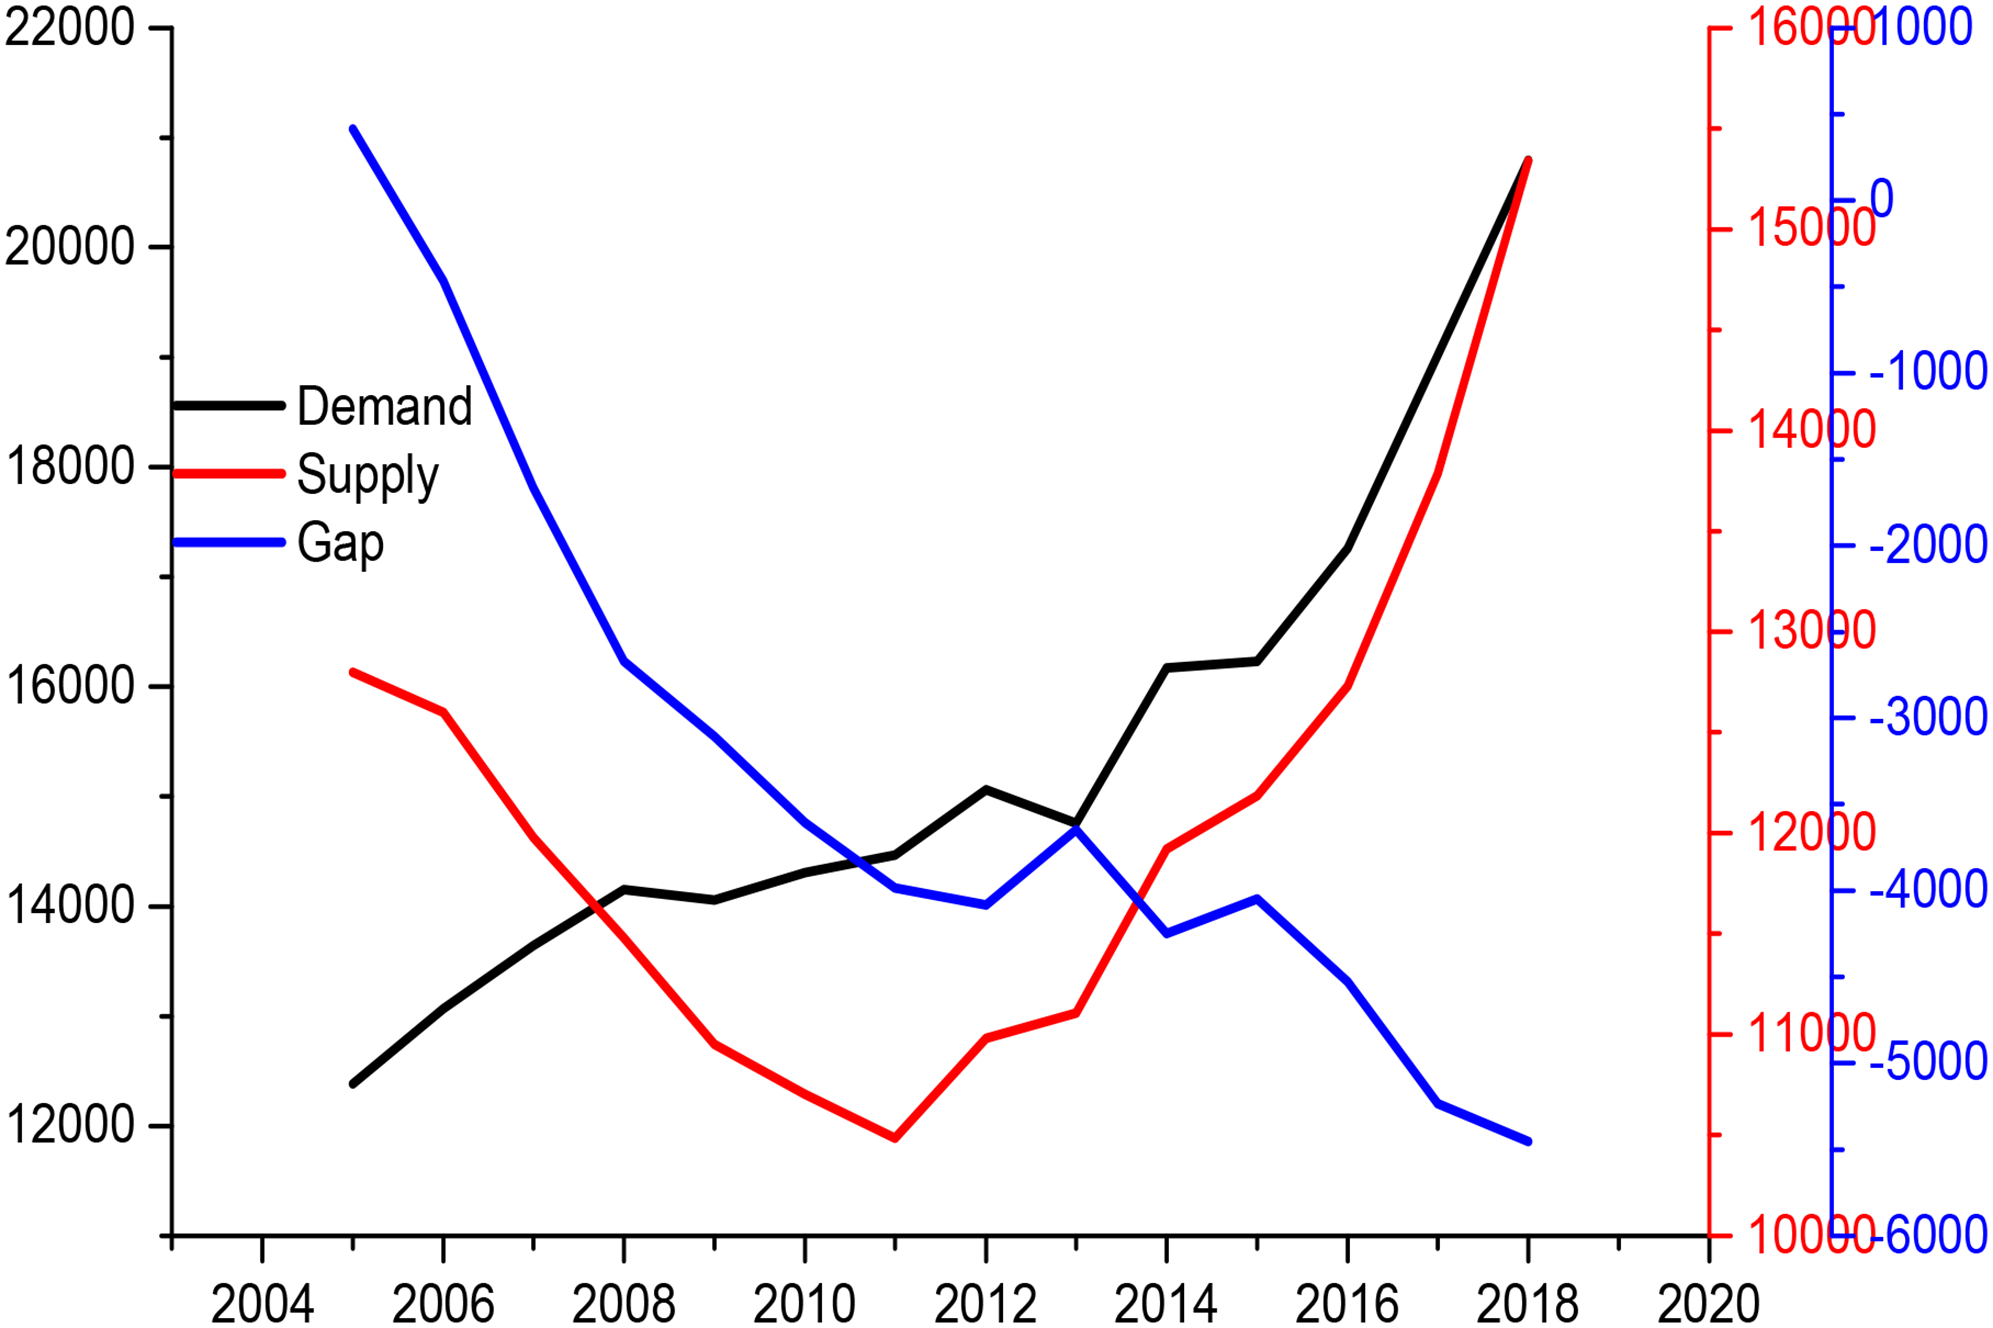
Electricity demand and supply (2004–2018). Source: National Transmission and Dispatch Company (NTDC) Pakistan, Annual Statistic Book 2017–18.
Number of consumers category-wise (in million).
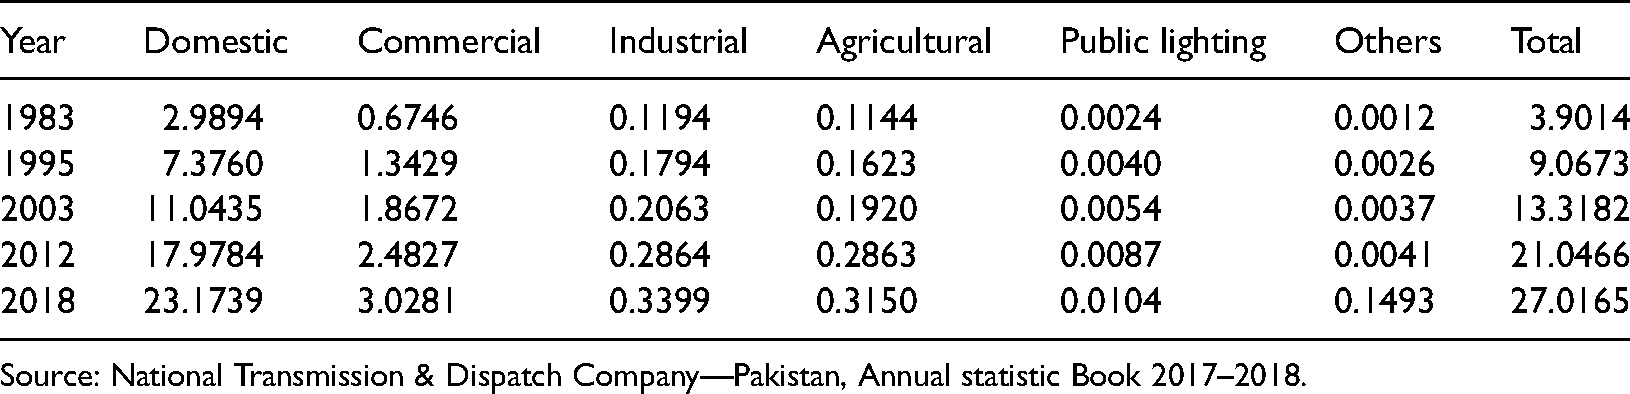
Source: National Transmission & Dispatch Company—Pakistan, Annual statistic Book 2017–2018.
Electricity supply analysis
Pakistan's electricity supply is heavily focused on non-renewable resources. Natural gas accounts for 42.8% and furnace oil accounts for 12.9%. They are followed by hydropower, which accounts for 26.7% of the total electricity generation—the installed capacity upsurge by 30% in February 2018 due to the CPEC projects compared to 2012 numbers. Figure 4(a) shows that Pakistan's electric supply comes from IPPs, WAPDA, KESC, GENCOs, and PAEC. The maximum installed capacity of IPPs is 15,486 MW, mainly composed of petroleum and natural gas plants. WAPDA has a total installed capacity of 8341 MW, based on hydroelectric plants. GENCOS is the oldest state-owned enterprise with a total installed capacity of 5662 MW, of which 5362 MW comes from natural gas, 250 MW from oil power plants, and 50 MW from coal power plants. PAEC only operates in nuclear power, having an installed capacity of 1345 MW. The decline of international oil prices and huge natural gas reserves in early 2000 turned investors’ attention toward thermal power generation based on oil and natural gas. At present, the share of gas and oil power plants in Pakistan is 42.8% and 12.9%, respectively (Figure 4(b)). The coal power generation plant's installed capacity is 2690 MW, the nuclear power station is 1345 MW, and hydropower power is 8689 MW. 44
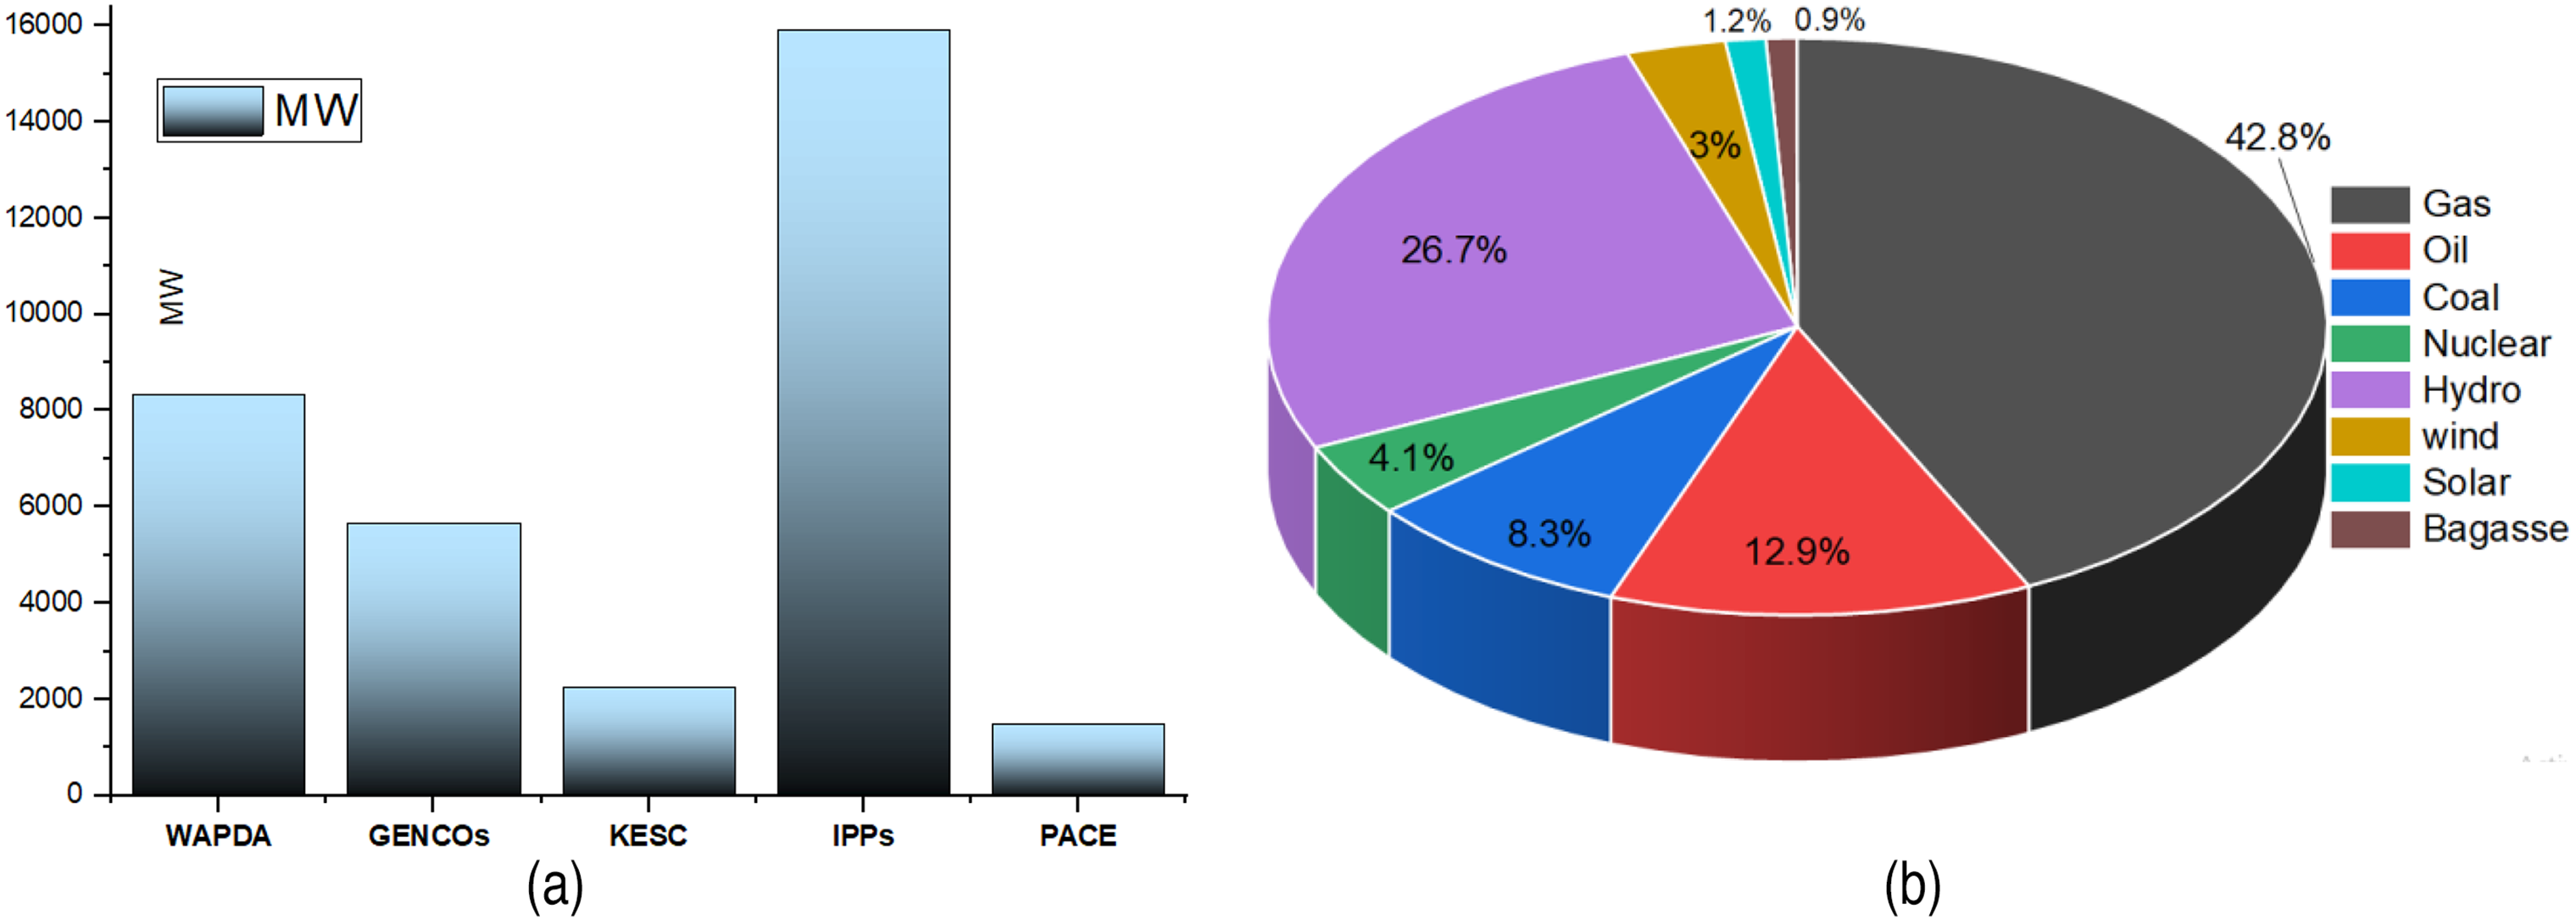
(a) Installed capacity of electricity providers and (b) install capacity of electricity by source.
Renewable resources
Pakistan is gifted with renewable energy resources that can help fulfill the energy needs, lower the burden on the balance of payment and reduce CO2 emissions. The glaciers and high mountains in the northern part are suitable for hydroelectric projects, whereas the deserts and plains sites are flooded with sunlight and suitable for solar energy generation. Pakistan's renewable sector (solar, wind, hydropower, and biomass) potential assessment and its current generation highlights are presented in the following section.
Solar energy
The energy sector management assessment program (ESMAP) identified wind energy potential in the southern part. In the southwest, the annual global horizontal radiation is more than 2300 kWh/m2, decreasing toward the north but still exceeds 1800 kW/m2 per year 83% of the area exceeds the 2000 kWh/m2. 12 Pakistan solar irradiance map can be seen in Figure 12. Pakistan's solar power capacity is estimated at nearly 50,000 MW which is enough to fulfill Pakistan's energy needs until 2040. The southwest region of Baluchistan and the northeastern area of the Sindh province benefit from about 2500 h of sunshine, 8–10 h a day, and 2400–2800 h per year. Currently, Pakistan is unable to utilize this resource properly, only generating 1568 MW. 44
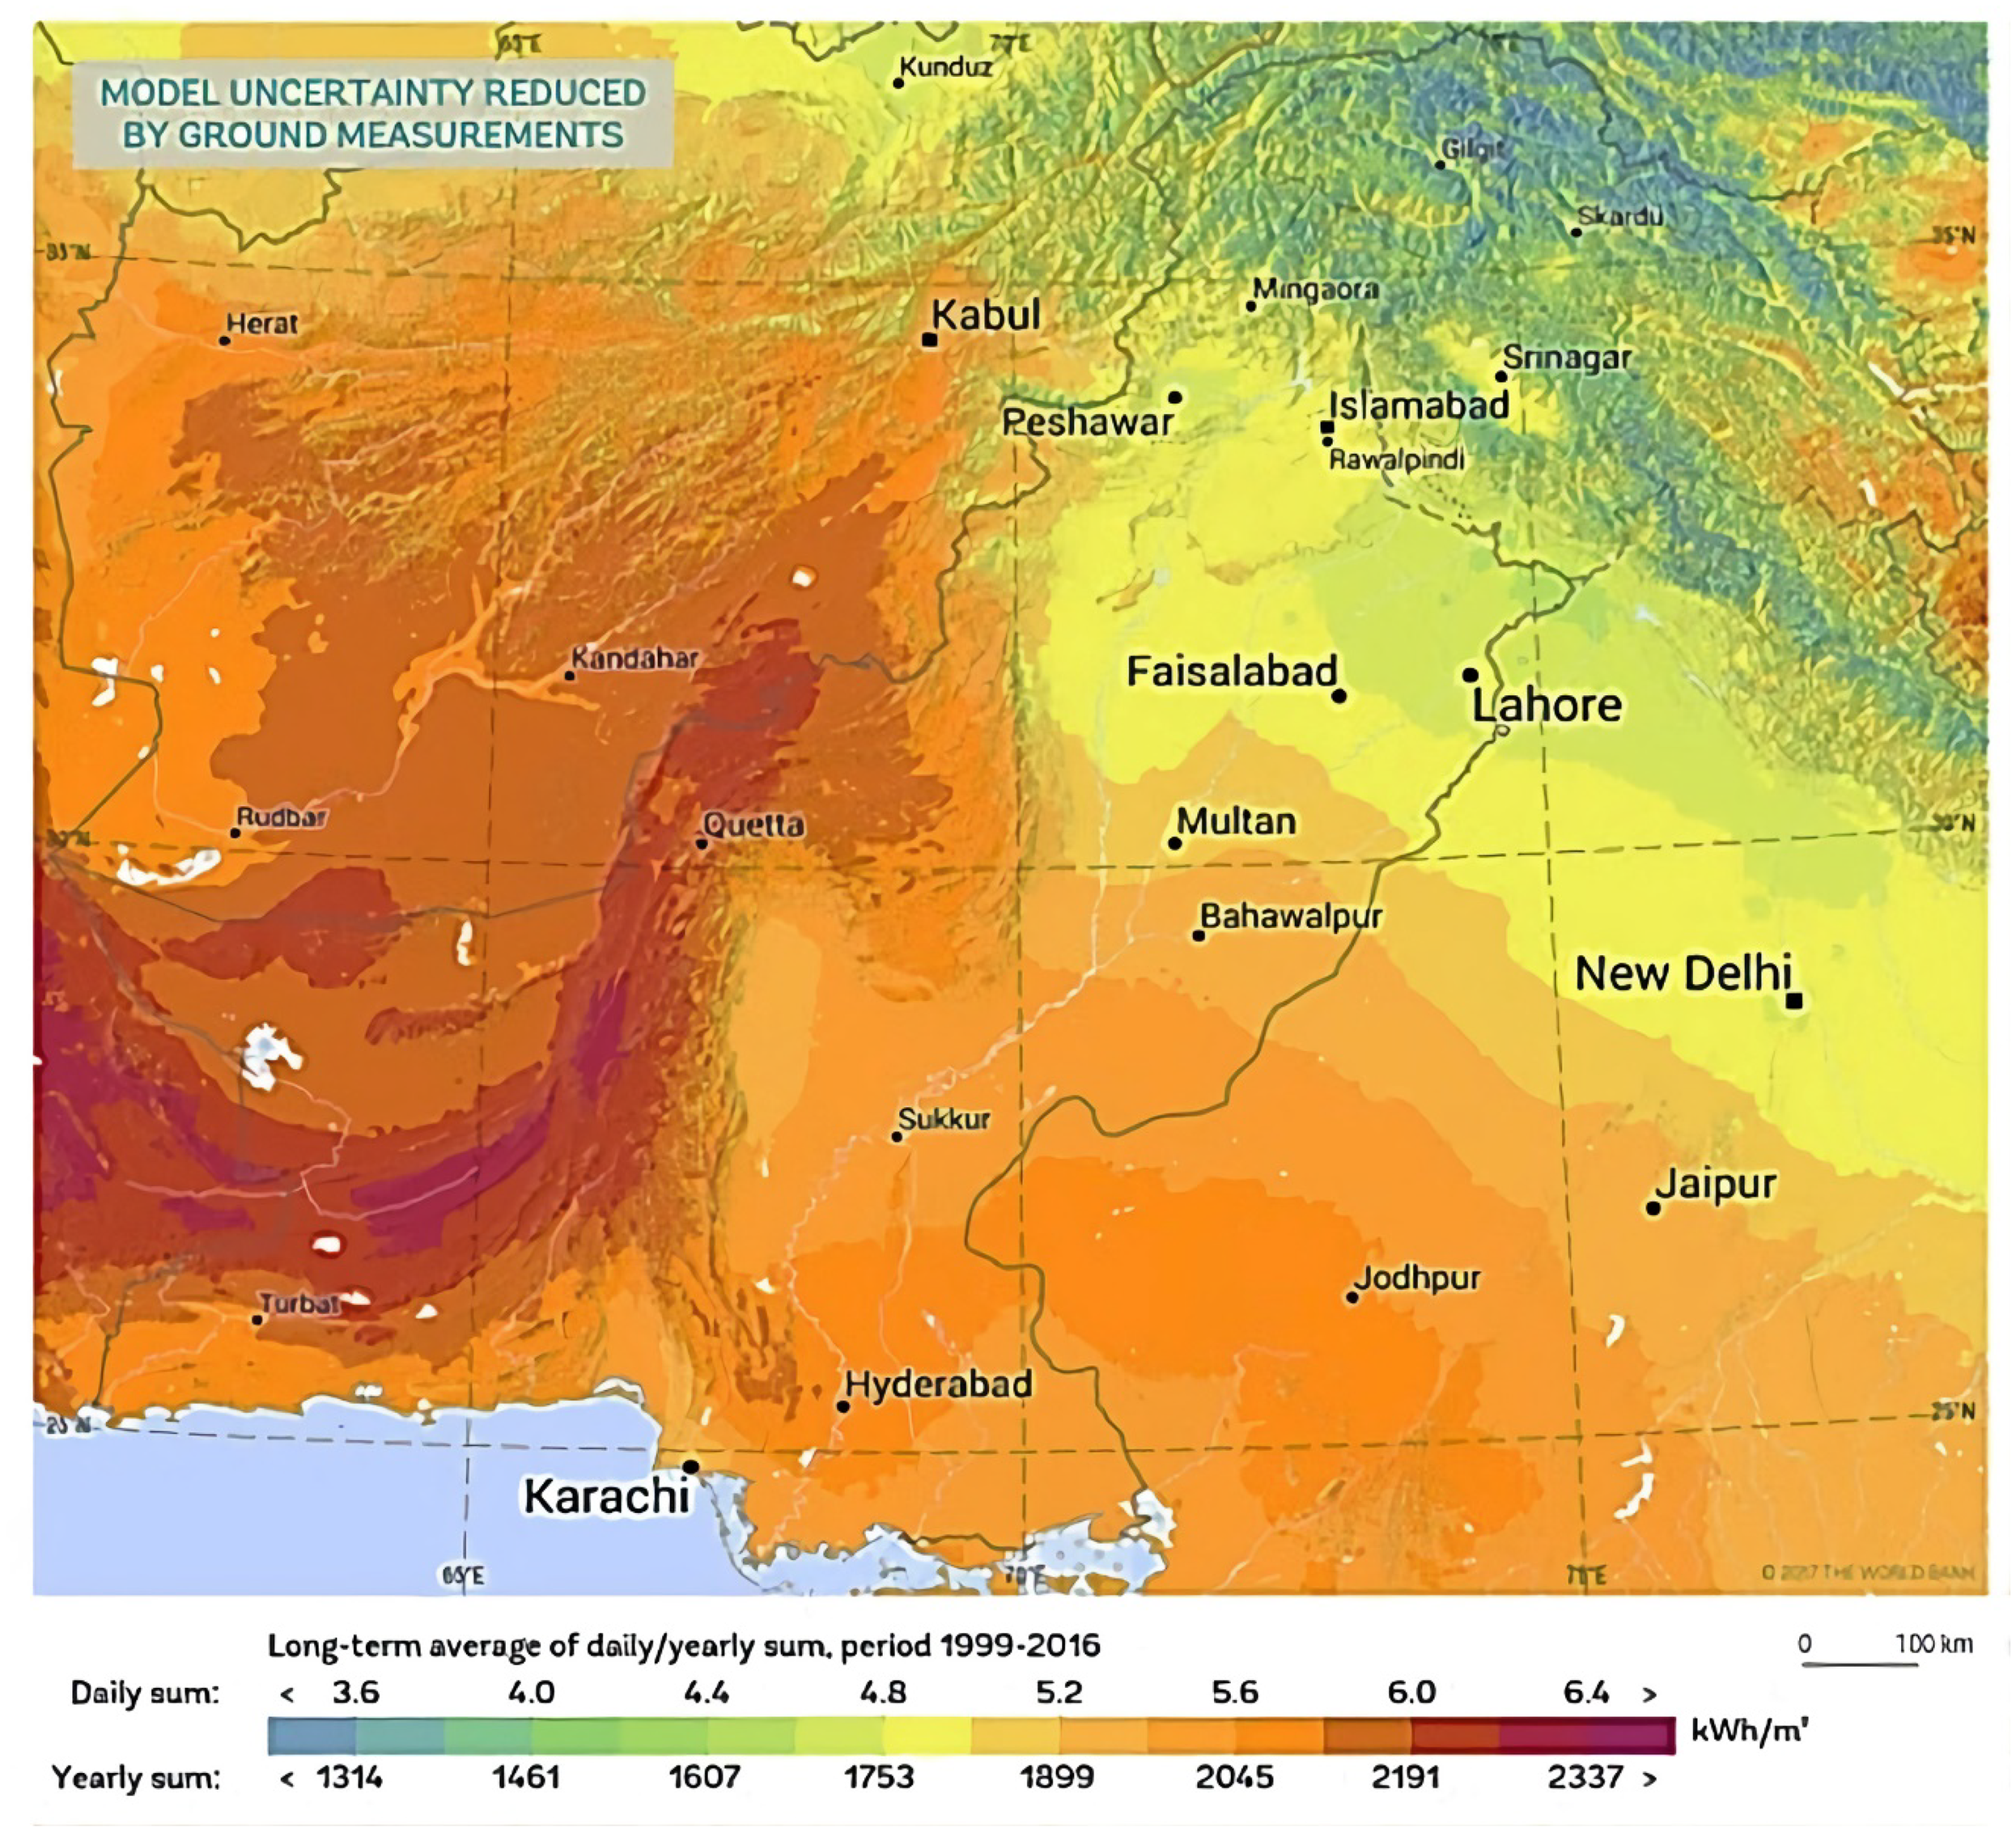
Solar map—Pakistan. Source: Renewable readiness assesment-2018, Pakistan. IRENA (n.d.), Global atlas for renewable energy, using data from World Bank–Energy Sector Management Assessment Program (ESMAP).
Wind energy potential
According to the World Bank–ESMAP wind map (Figure 13), the estimated theoretical potential in wind power generation is about 370 GW. The research work started in 1980, and wind turbines of 10 kWh and 1 kWh were installed in Sindh and Balochistan. 24 The Gharo–Keti–Bandar wind energy corridor in southern Pakistan, with a theoretical potential of about 50 GW, was prioritized at the beginning of the country's renewable energy development. 45 Currently, all of Pakistan's wind power installations are in this corridor. Under the CPEC, the wind projects will add 300 MW, whereas all under-construction projects were supposed to add 479 MW into the national grid by 2019.
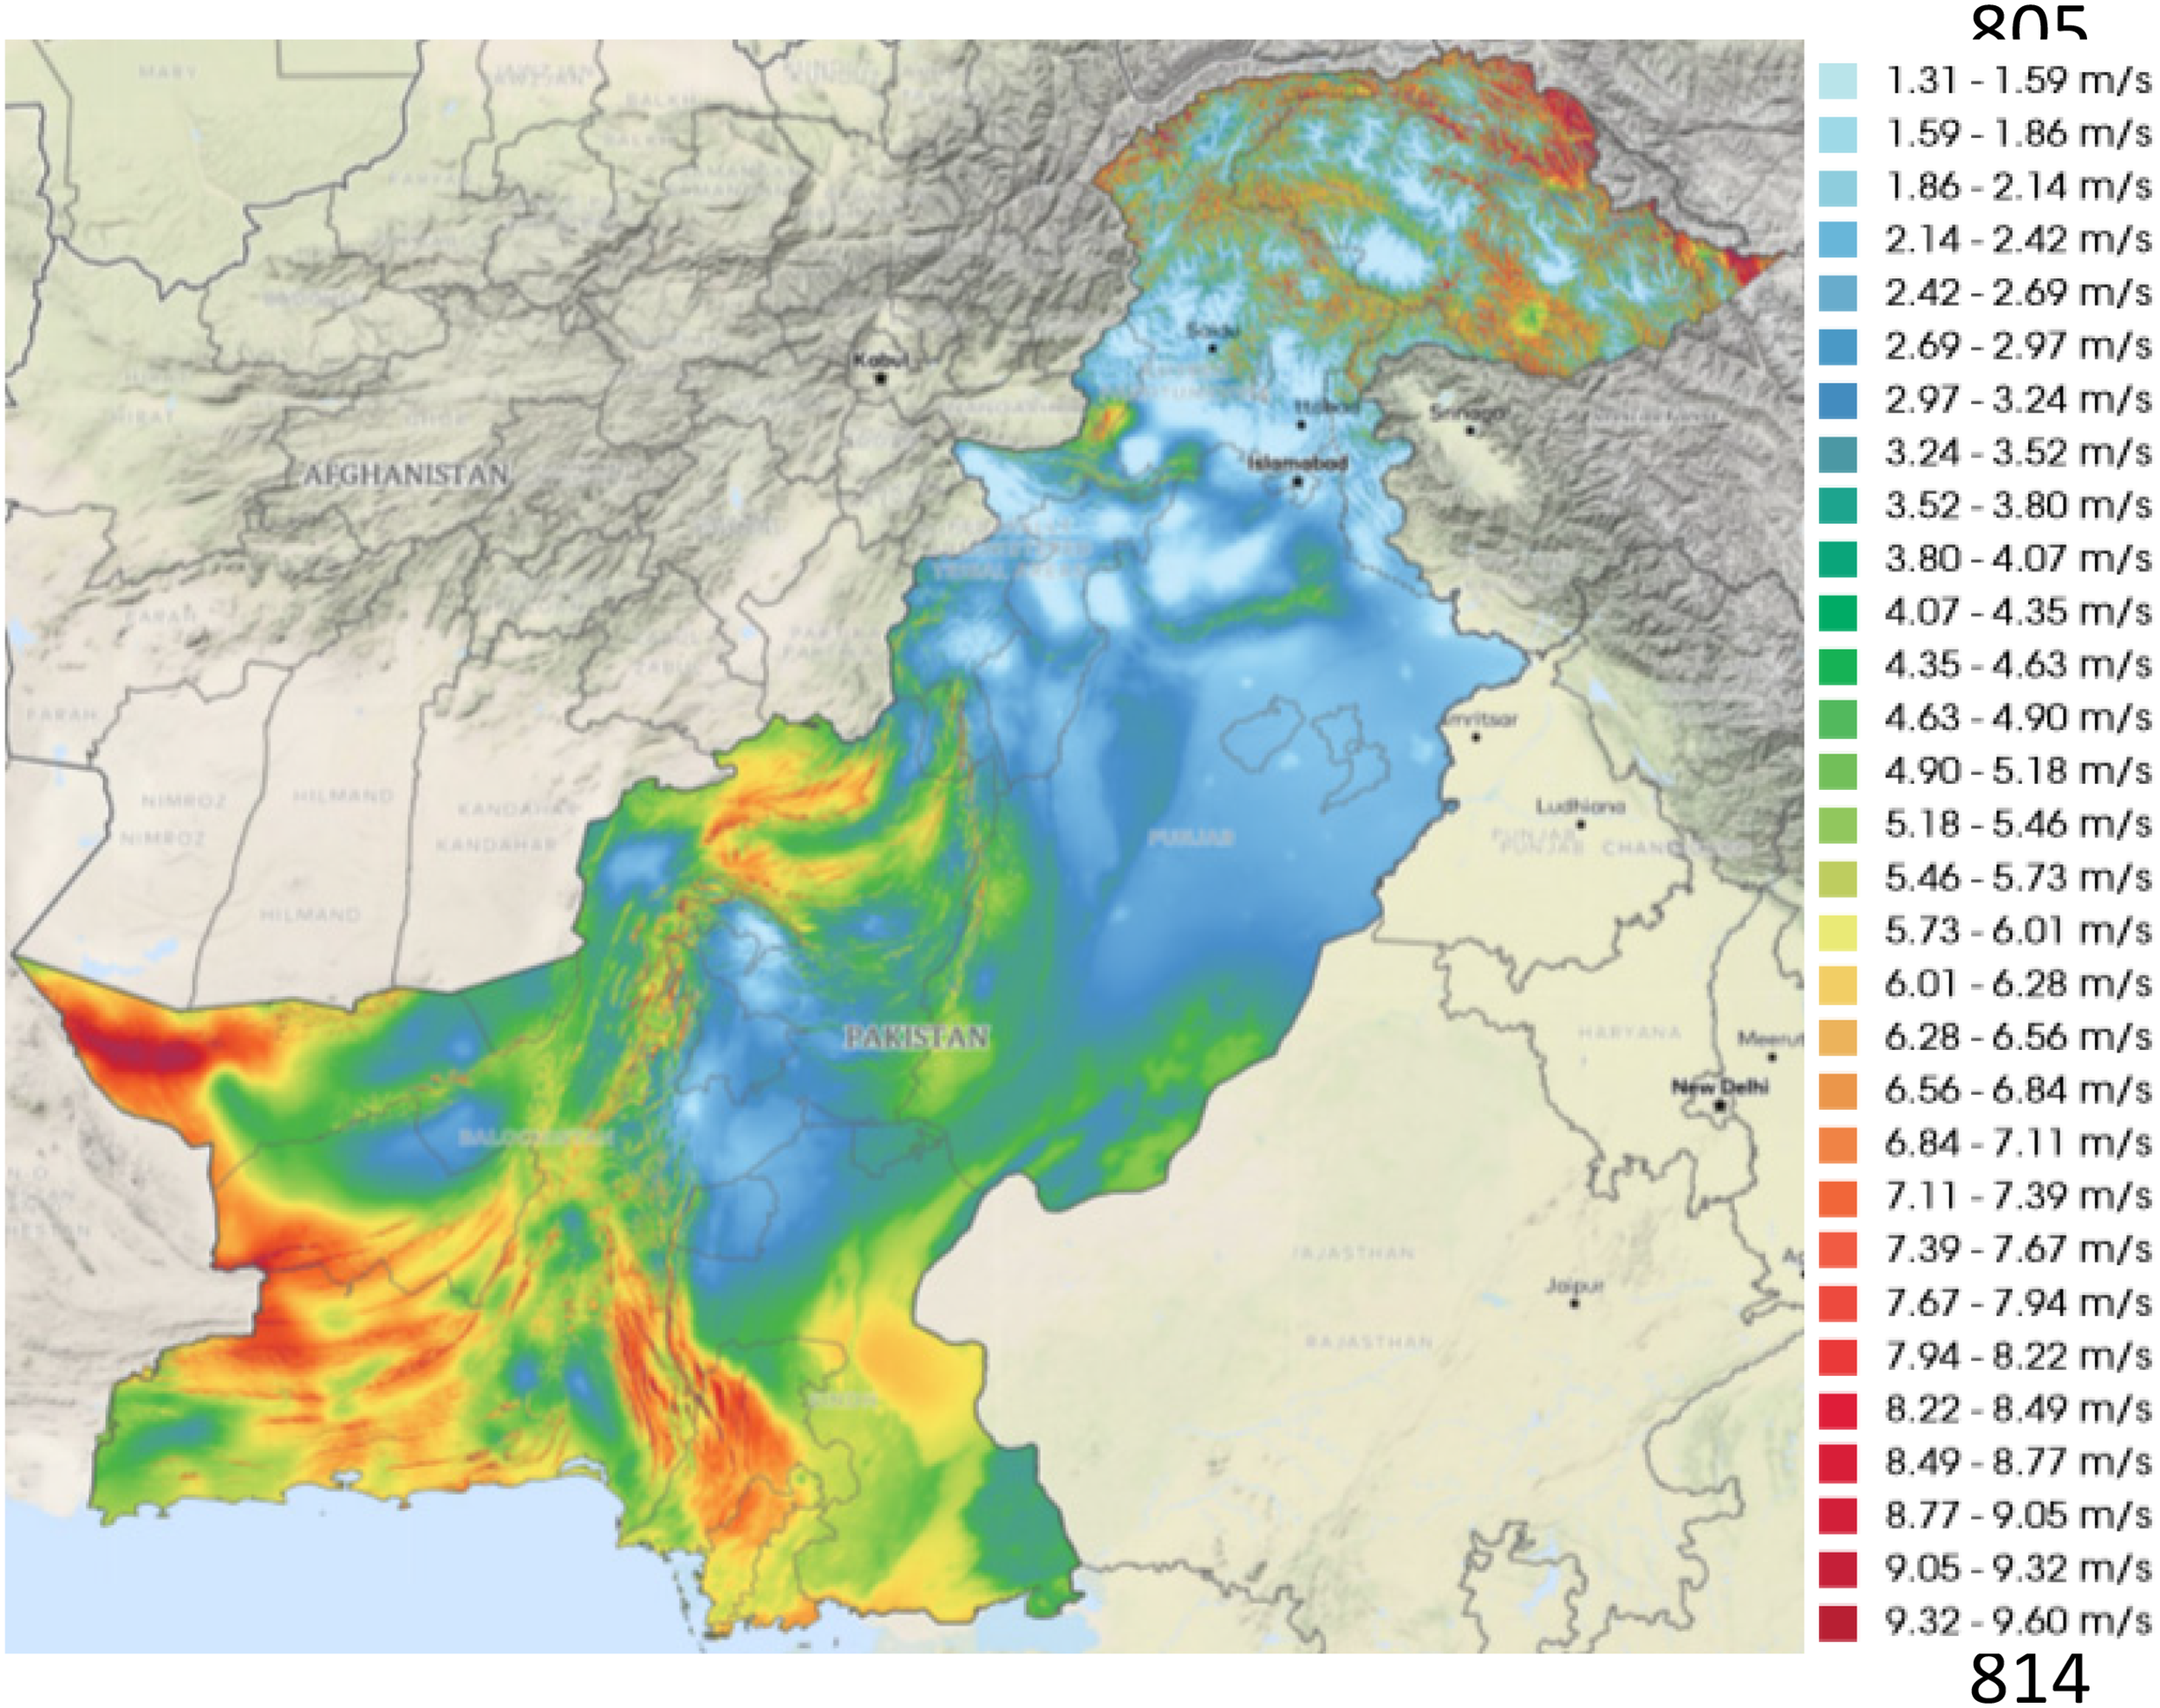
Wind map—Pakistan. Source: IRENA (n.d.), Global atlas for renewable energy, using data from World Bank–Energy Sector Management Assessment Program (ESMAP).
Hydropower potential
Global hydropower contributes around 20% of the total electricity production. 46 In Pakistan, the total water resources have been estimated at around 400,000 km2, generating 42 GW for the national grid. 47 Regardless of these resources, hydro is declining due to climate change, land clearance, short-term policies, long construction periods, and political and financial issues. Hydropower project details can be seen in Figure 14. Pakistan is only utilizing 15% of its potential and adding 8689 MW to the system. 34 CPEC is playing its part as well, as, under this initiative, Pakistan will complete three hydro projects by 2023 that will add 2690 MW to the system.
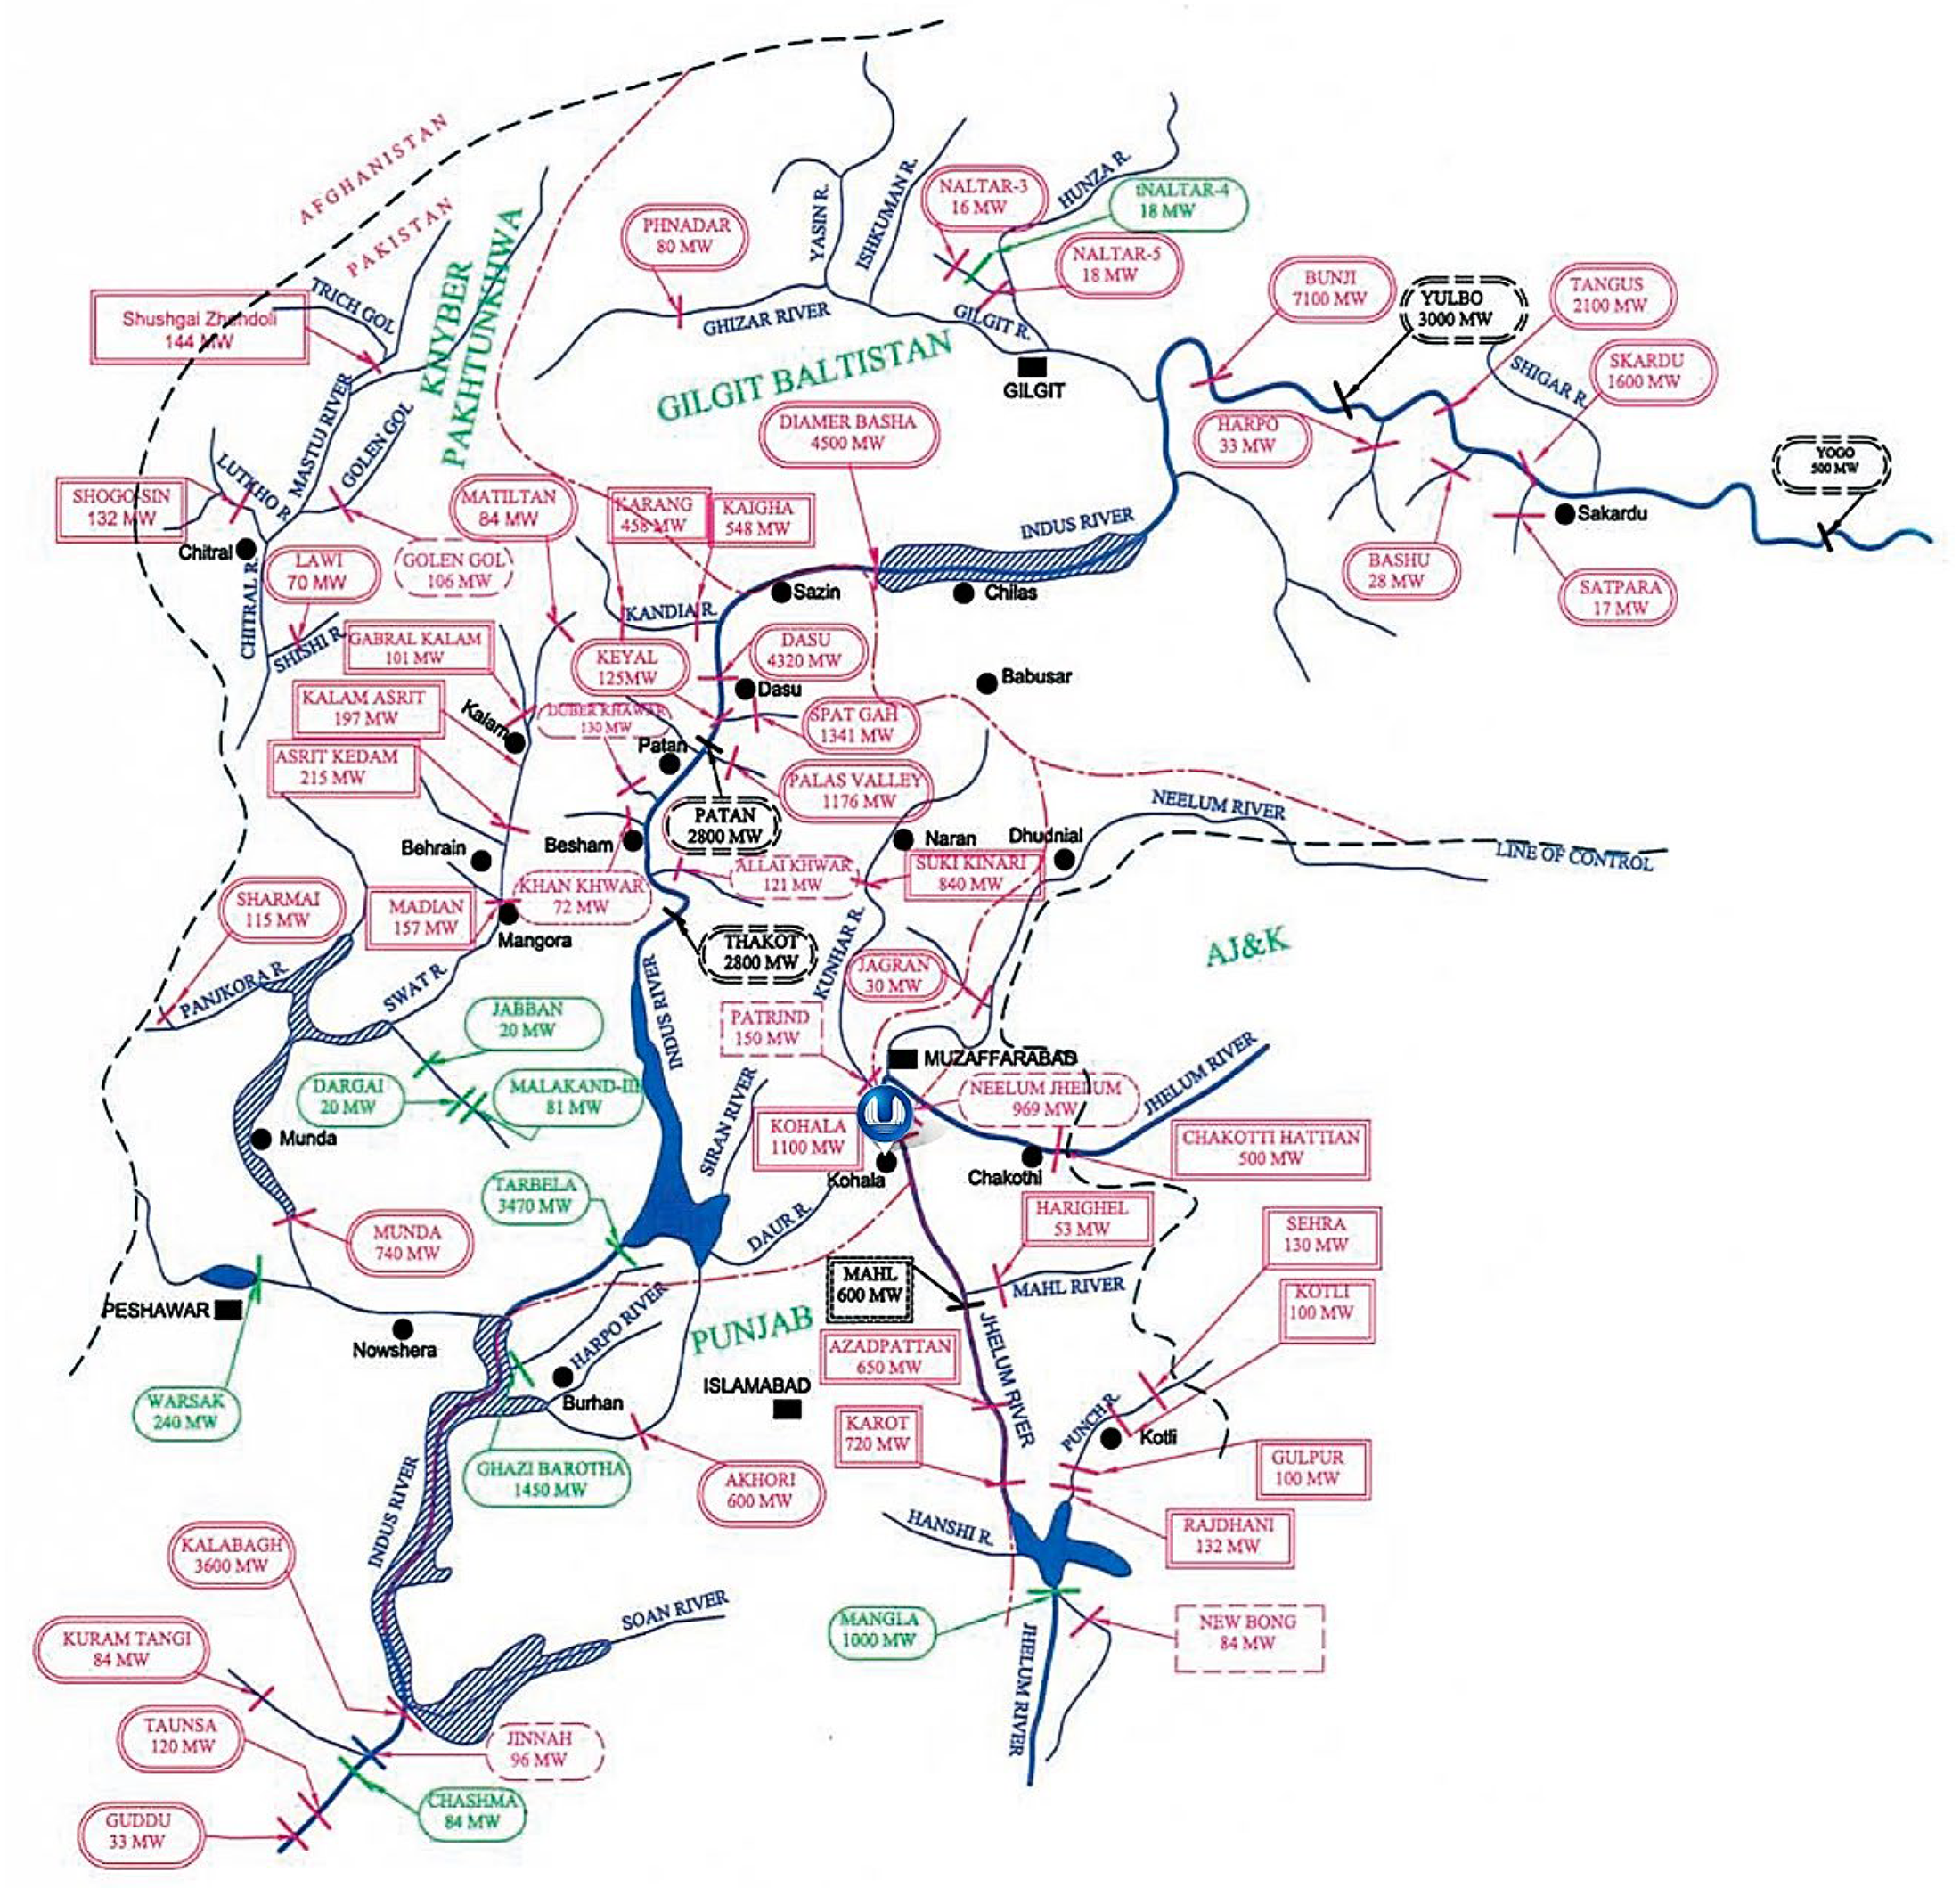
Hydropower projects. The Red circled projects are under consideration or construction at different stages. The green circled are in operation. Source: Water and Power Development Authority.
Biogas potential
Pakistan is mainly an agricultural country with abundant livestock. Therefore, it has great potential to generate electricity from biogas. World Bank–ESMAP Renewable Resource Mapping Project surveyed in 2016 and estimated biogas’ theoretical and technical potential in Pakistan. The biogas power generation capacity is estimated between 8.8 and 17.2 billion m3 (about 55–106 TWh), equivalent to the recent total electricity demand. The biomass energy resource map can be seen in Figure 15 (see the Appendix). However, the current electricity production in Pakistan using biogas gas is only 396 MW. 34
Data and methodology
The present study developed a SD model to estimate the gap between the demand and supply in Pakistan. First, a conceptual model is drawn to show the relationship between the variables. Then, mathematical equations have been formulated showing the relationship among variables and the time lags in CPEC projects’ output. The contribution of CPEC to total electricity production has been added to the existing production to estimate and forecast the demand–supply situation. The average growth rates of demand for electricity, electricity production, and production capacity have been taken over the past few years, from 1990 to 2018, to make a projection until 2040. Data on electricity consumption, production, demand, and generation capacity for 1990 to 2018 are used for empirical analysis. The data is collected from Power System Statistics, 45th edition, accessible from the NTDC 6 source. The data on CPEC production have been obtained from the official website of the project 7 showing the updated information on energy projects and their production. The project-wise details, that is, production, capacity, cost, and progress, are also accessible from other sources, summarized in Table 2 (Appendix). Since different projects have been launched under CPEC with varying time frames and outputs, the output of these projects has been added concerning their completion time. These projects are then added one by one to the total production for their time of output. This has been done by formulating mathematical equations with the help of Stella 10.1. In the present study, the CPEC projects with a confirmed date and output have been counted toward our model estimation. Thus, it is found that the projects fulfilling the criteria range between 2018 and 2023. Further, a policy scenario has been developed based on the targets discussed in FAC & PITCO, 48 Bloomberg New Energy Finance 49 and in the integrated energy plan. 50
SD energy model for Pakistan
The present study has developed a system model for electricity demand and production by considering the time lags between different CPEC projects.
Causal diagram
The first step in SD modeling is to draw a conceptual diagram showing the relationship among variables. Figure 5 shows that electricity production is balancing the total capacity available, and CPEC is reinforcing the production, thus increasing the capacity. From the consumption side, there are five major categories: domestic use, industrial, commercial, public lighting, and use of electricity for agriculture. These all are resulting in the growth of consumption of electricity, thus causing an increase in demand. There are three sources to produce electricity: public sources, IPPs, and CPEC. Electricity production from public sources includes hydro, nuclear, thermal, wind, and imports. IPPs are using hydro and thermal sources to produce electricity. With the inclusion of CPEC production, electricity production is increasing, thus reducing the demand–supply gap. The policy targets envisage that renewable sources would get a higher share in the future.
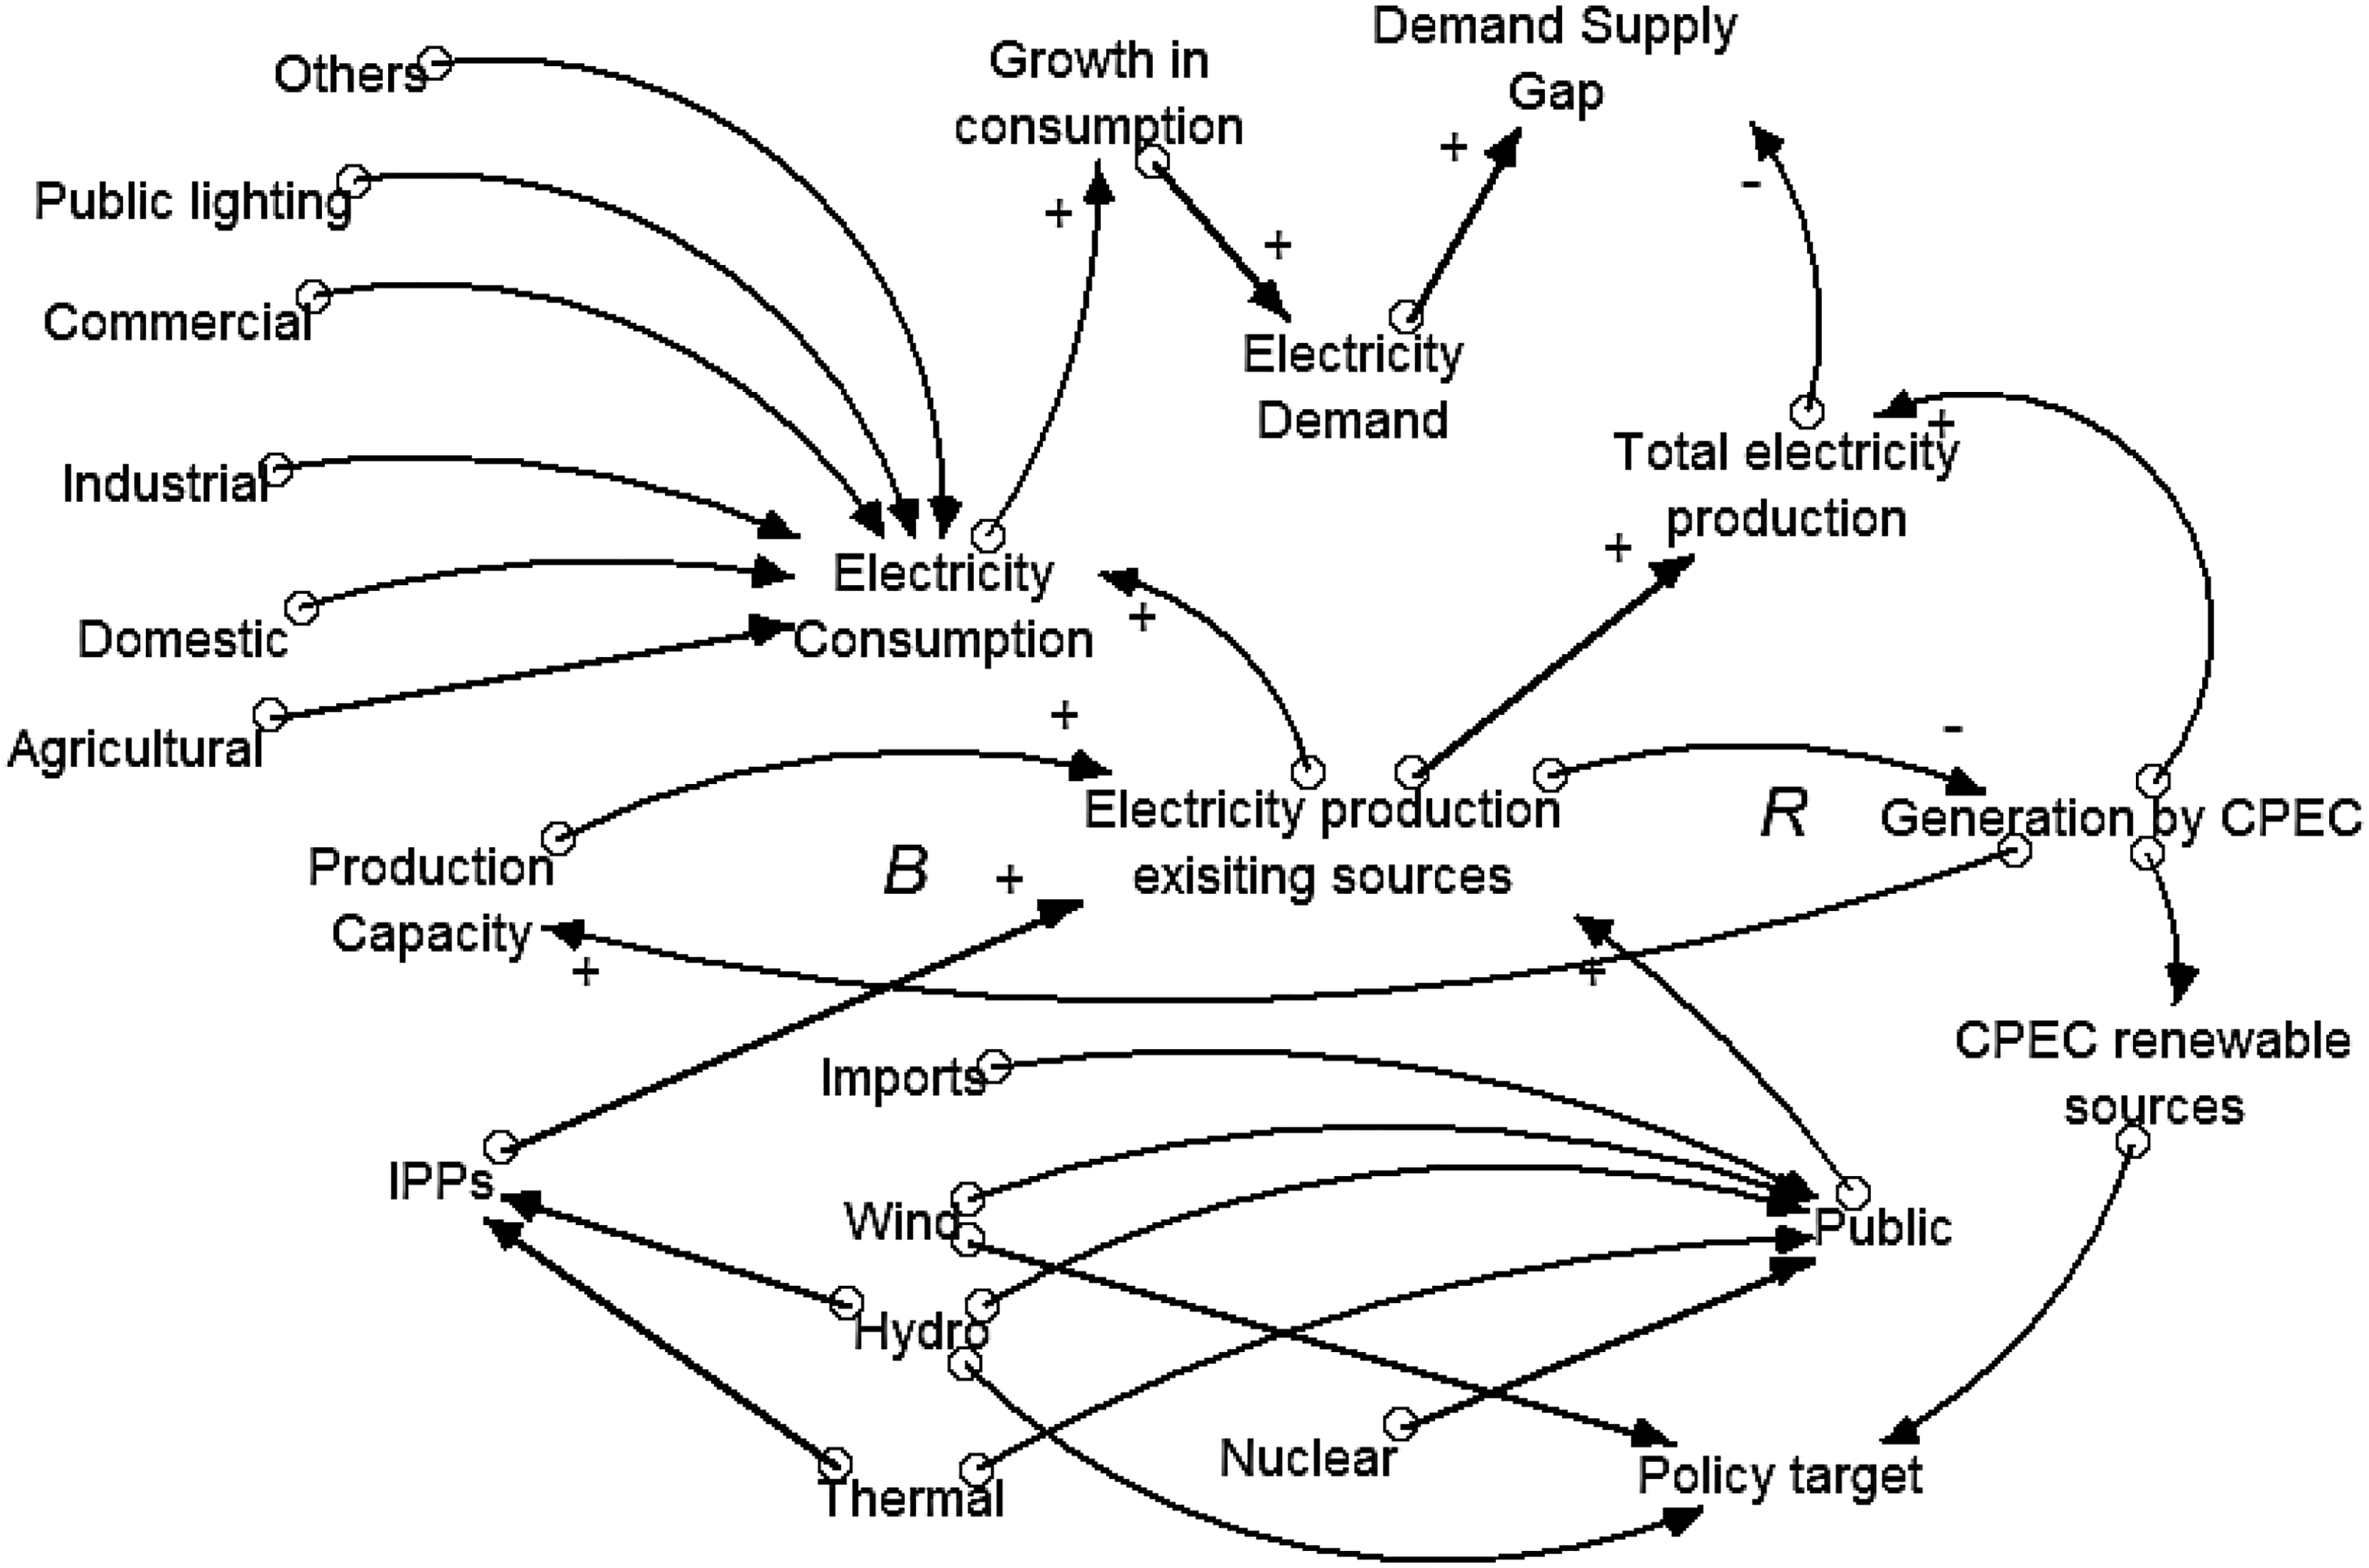
Conceptual map showing electricity demand, and electricity production (including China–Pakistan economic corridor [CPEC].
Mathematical model
The mathematical equations showing the variables and their relationship used in the SD model are shown in Table 1.
Model variables and equations.
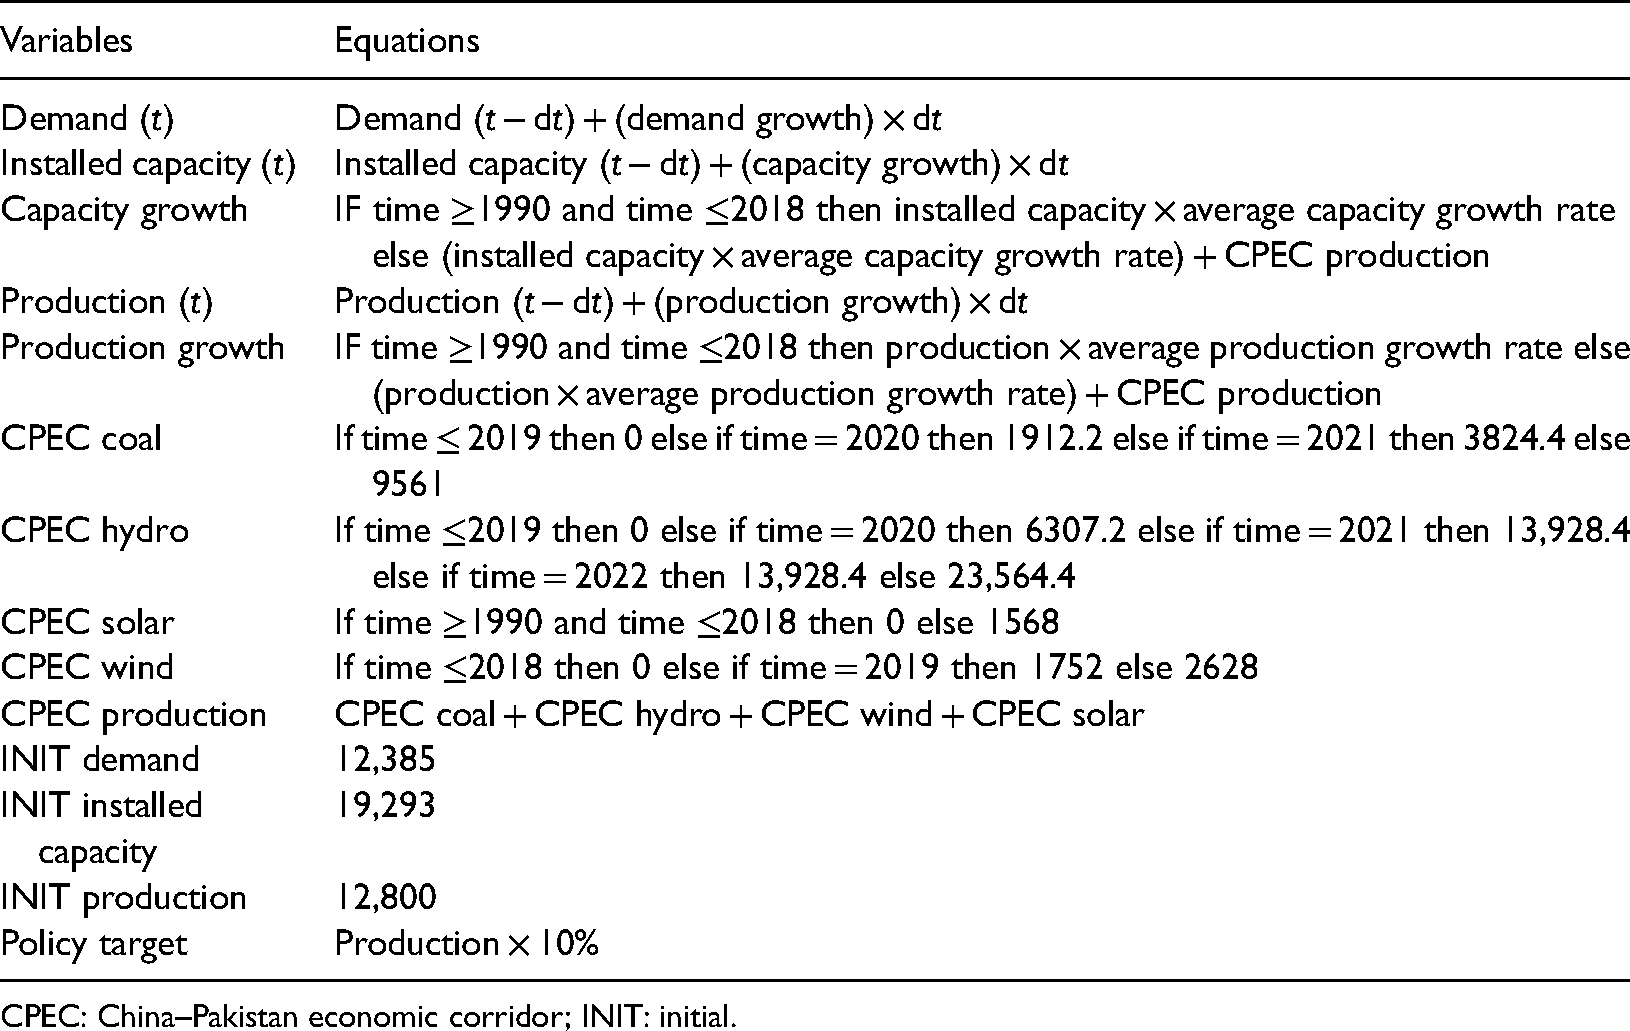
CPEC: China–Pakistan economic corridor; INIT: initial.
Computer simulation model
A computer simulation model has been built with the help of Stella version 10.1. The model in Figure 6 is built by using the growth rates of past years (1990–2018) to estimate the demand–supply gap for 2019–2040.
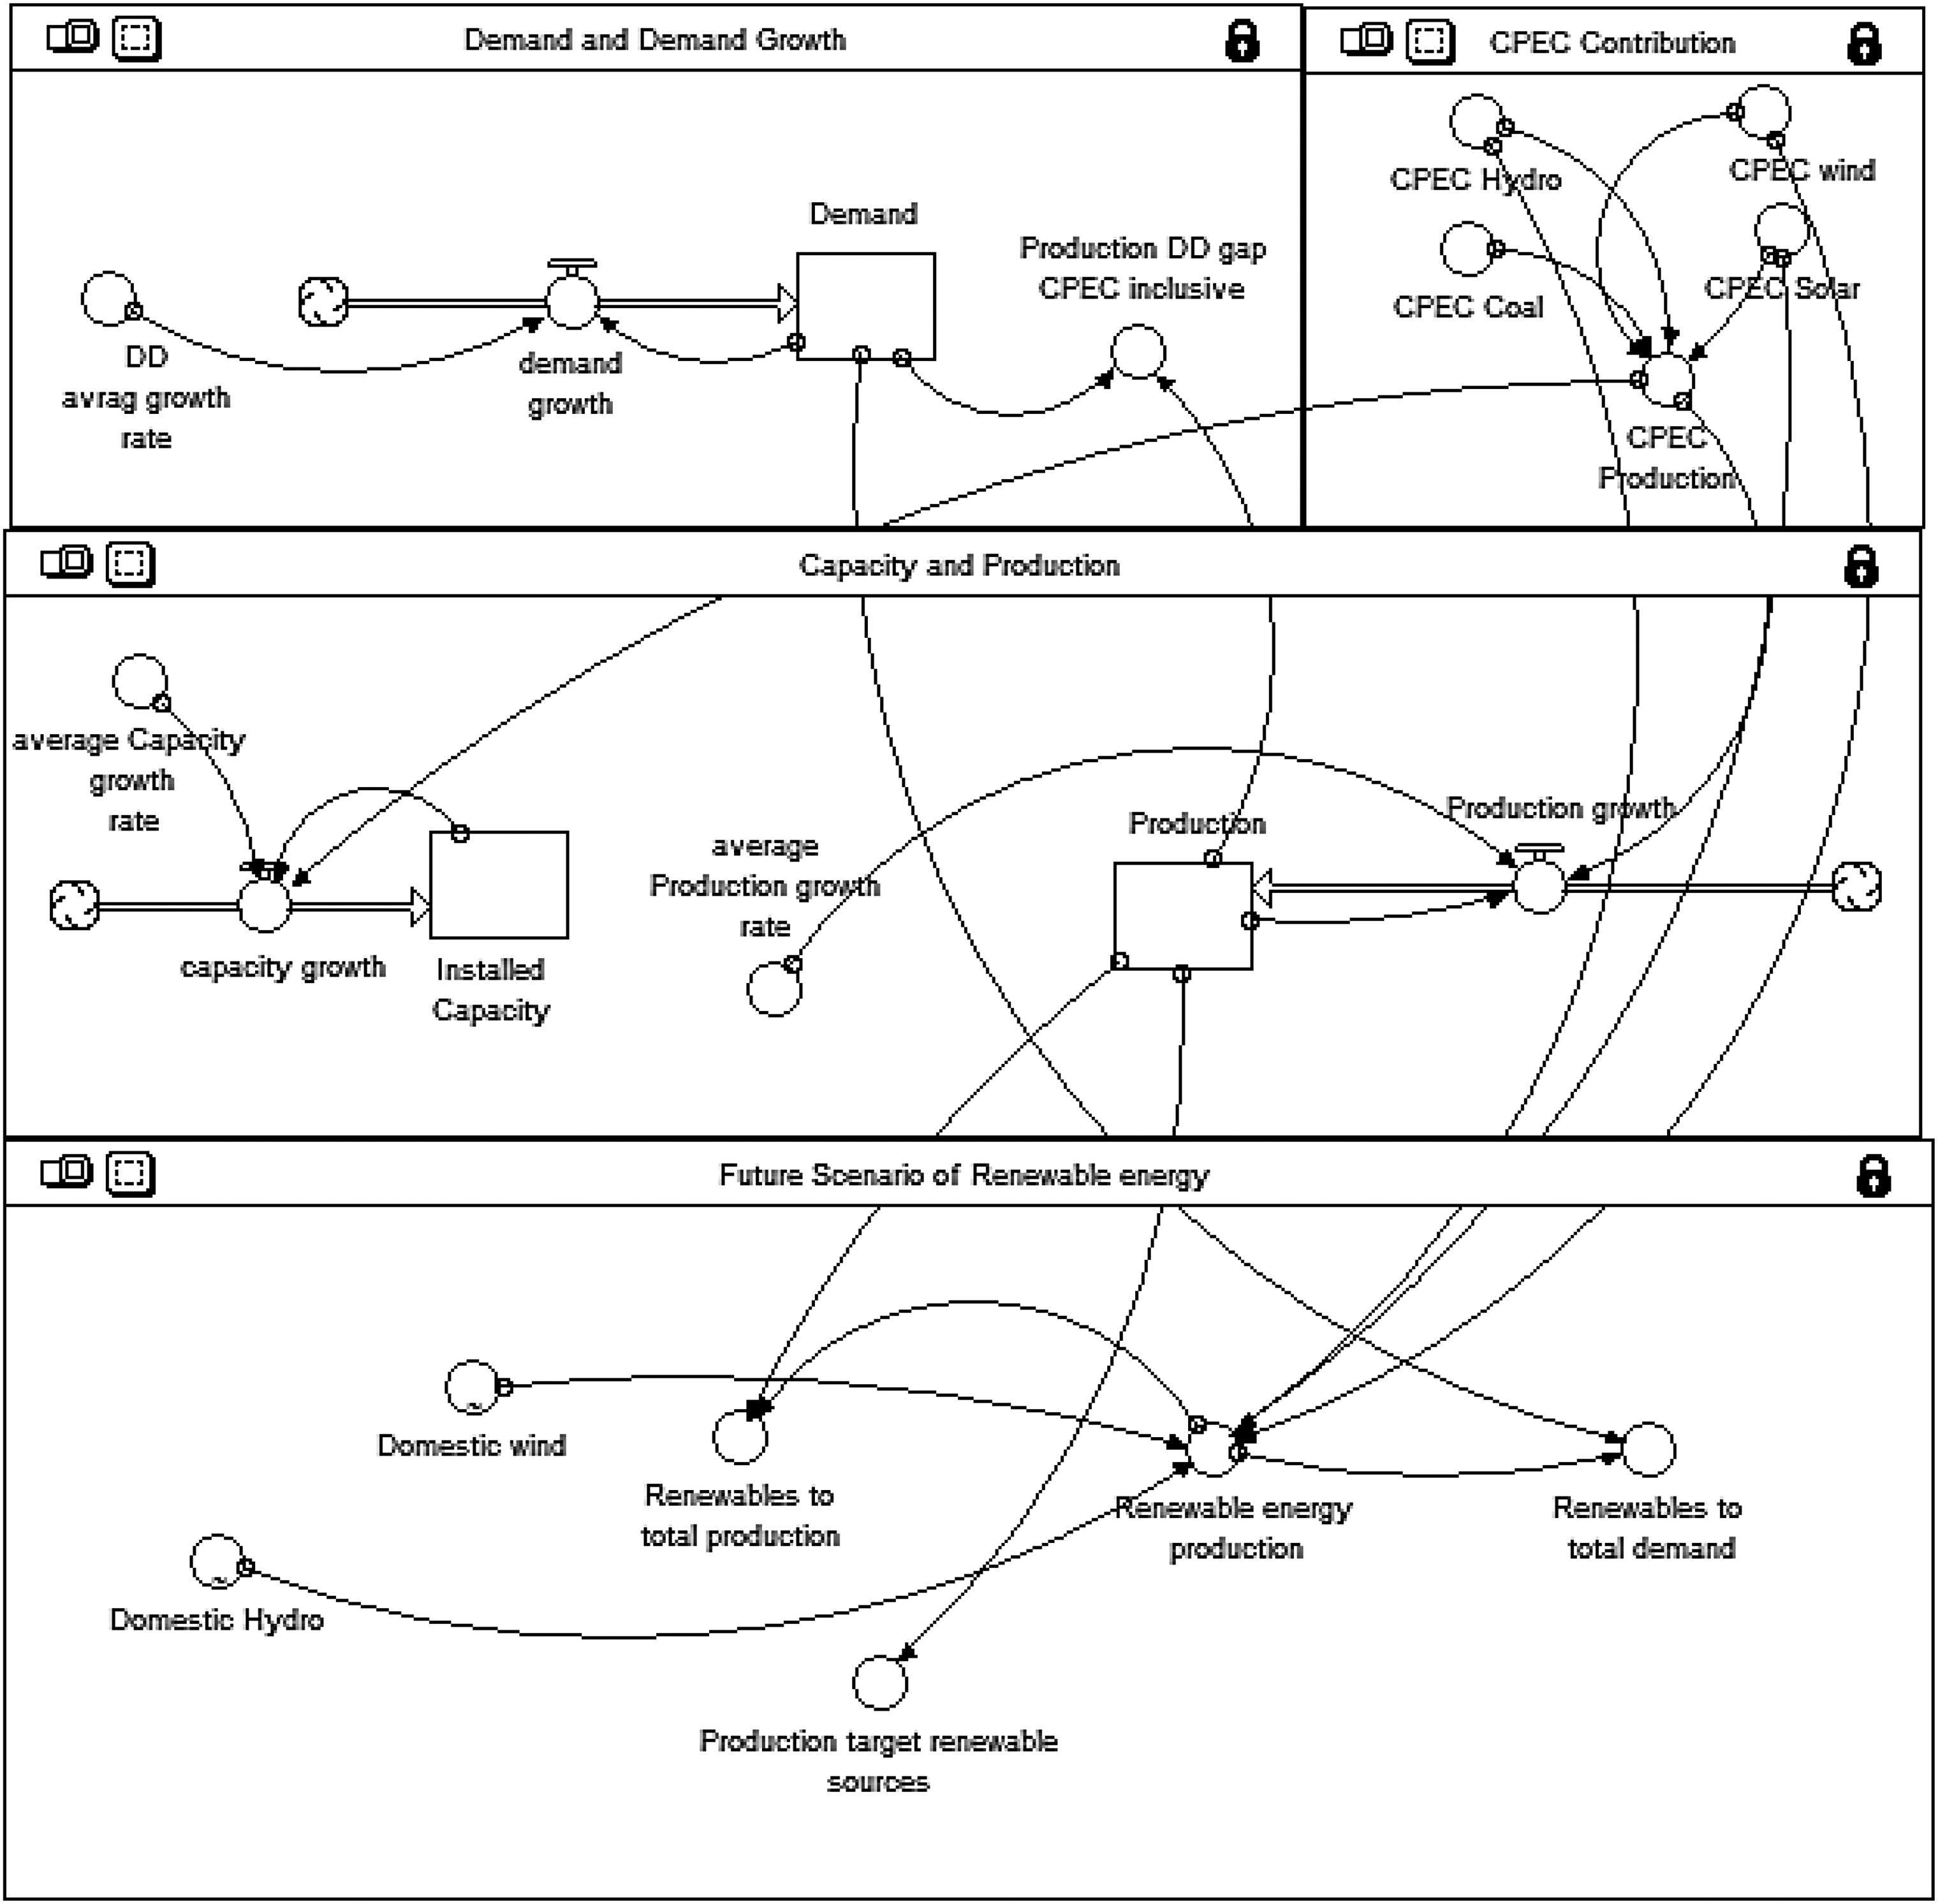
Computer simulation model showing demand and supply of electricity and share of renewables in Pakistan.
There are four frames in the above model; demand and demand growth, capacity and production, CPEC production, and future renewable energy production scenarios. The sectorial frames are explained as follows:
Sector frame “demand and demand growth”
The five major groups, namely: domestic users, industrial, commercial, agricultural, and electricity for public lighting, consume electricity. The demand is higher than the consumption as it also includes electric line losses and load shedding. Therefore, the average growth rate of demand based on past years (1990–2018) is calculated as 2.31%.
Sector frame “CPEC contribution”
The frame is representing the contribution of CPEC to the total electricity production in the country. There are four sources through which CPEC supplies electricity: coal, wind, hydro, and solar. There are many projects with varying capacities working under each category. The production time of each project also varies, as explained in the methodology (section “Electricity demand–supply and renewable resources”). The model has counted the time of generation of electricity by each project. Thus the simulation is based on the respective projects’ production inclusion in the national grid (see the equations in the “Renewable resources” section). The CPEC project details are given in the Appendix.
Sector frame “capacity and production”
The frame showing capacity and production represents not only the past capacity, past production, and their average growth rates to generate electricity but also the growth in generation capacity and production by CPEC sources. Therefore, the total capacity would be increased, and the total production would be enhanced, thus decreasing the gap between demand and supply of electricity in the country. The data show that the average growth in generation capacity was 5.29% and the average production growth rate was 4.6% during the study period.
Sector frame “future scenario of renewable energy production”
The above frame highlights the share of renewables and policy targets for renewable energy production in the country. The renewable sources are hydropower, wind, and solar, contributing to the total production. The policy target is set at 10% electricity production through solar and wind power by 2040.
Results and discussion
The model results are first validated in the light of official data taken from the National Transmission and Dispatch Company (NTDC) for the period 1990 to 2018.
Model validation
Model data on key variables, that is, demand and supply of electricity, has been compared with official data for the period 1990 to 2018. The results (Figure 7) show that the trend between the two sets is the same. Further, the trend lines joined together at the later stage. Thus, we can use the model values to project the situation up to 2040.
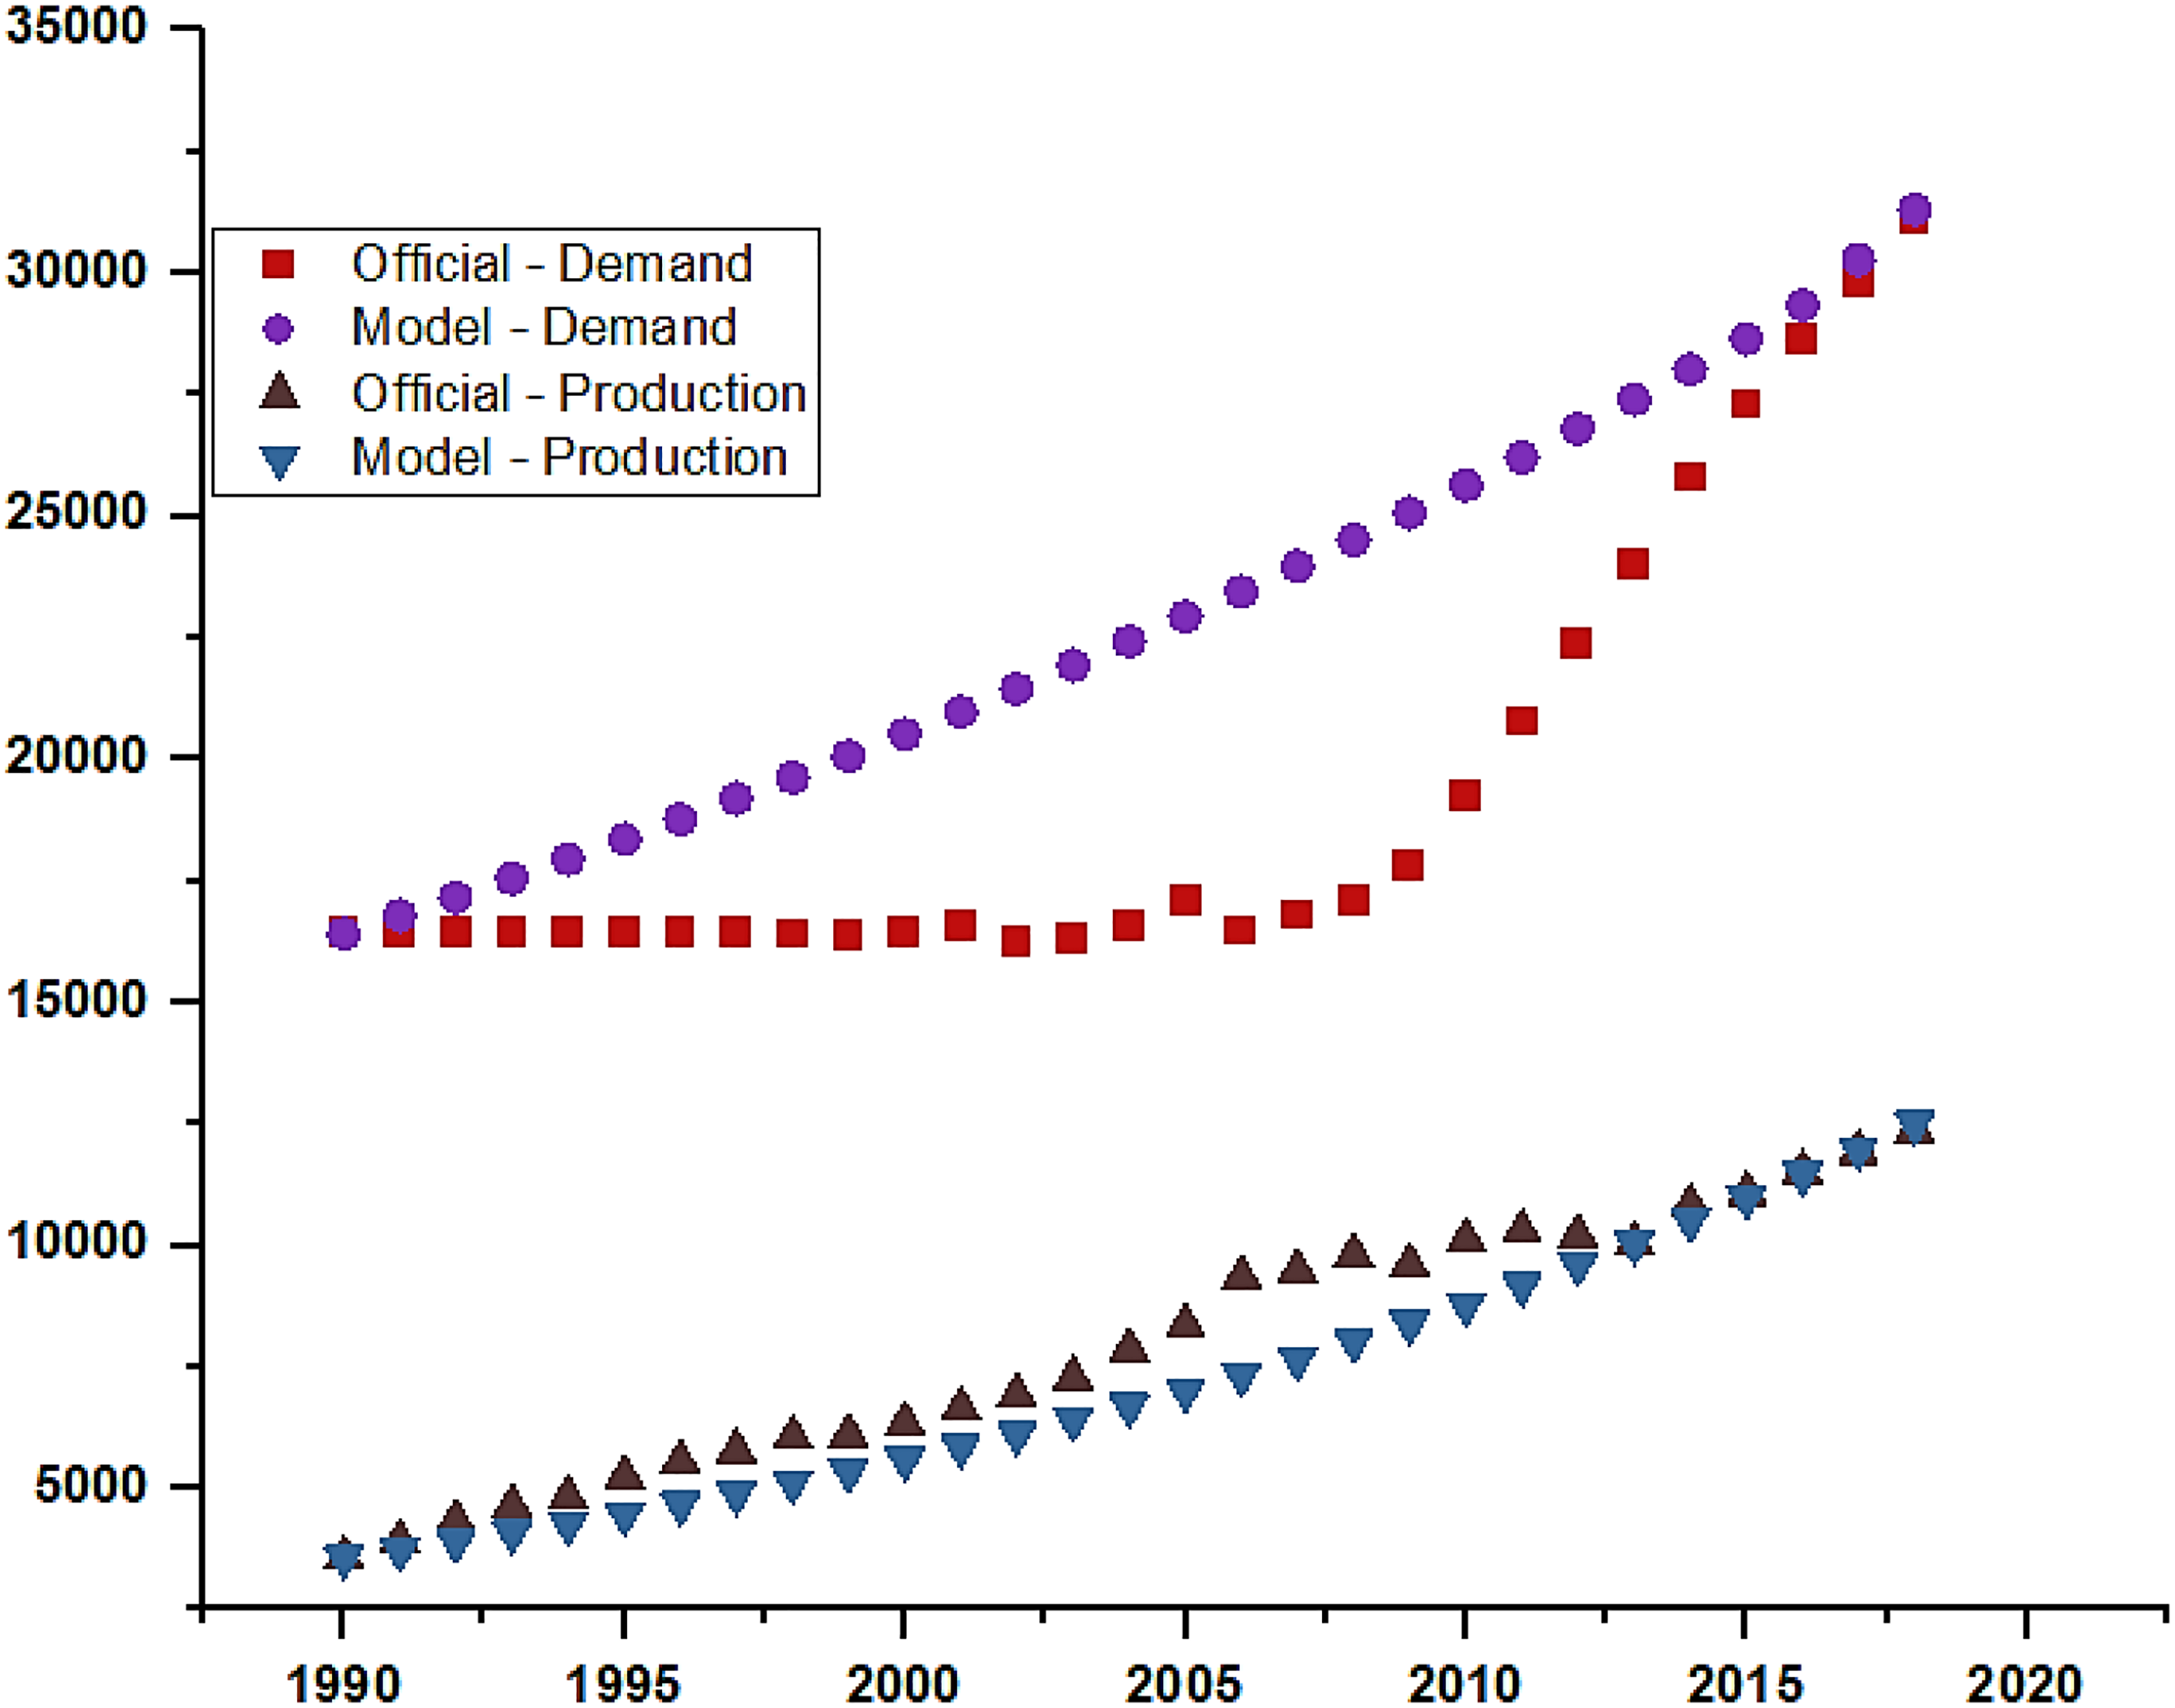
Electricity production and demand (official and model data).
Results and analysis
The results of the model cover key variables such as electricity demand, generation capacity, production, and production under CPEC. The past trends and average growth rates from 1990 to 2018 are discussed below. The projected scenario is also discussed.
The country's productive capacity in the country was 6409 MW in 1990 and has increased with an average growth rate of 5.2% to 22,236 MW in 2015. After the inclusion of CPEC production from 2019 to 2023, the productive capacity will increase to 41,261 MW in 2024, thus an upsurge of 19,025 MW in nine years. As a result, the projected capacity would be 70,102 MW for the year 2040. The production of electricity was 5476 MW in 1990 that grew at 4.7% to 12,186 GWh in 2015. After the inclusion of CPEC projects’ output from 2016 to 2023, the production will increase to 31,623 MW in 2024, increasing 19,423 MW. Thus, the projected production for the year 2040 is estimated at 57,960 MW. The CPEC production sources (2016–2023) are shown in Figure 8. The domestic production without CPEC is mainly coming from gas, oil, hydro, and coal. As per CPEC sources of production, the highest contribution comes from coal projects followed by hydro, solar, and wind, respectively, as shown in Figure 8.
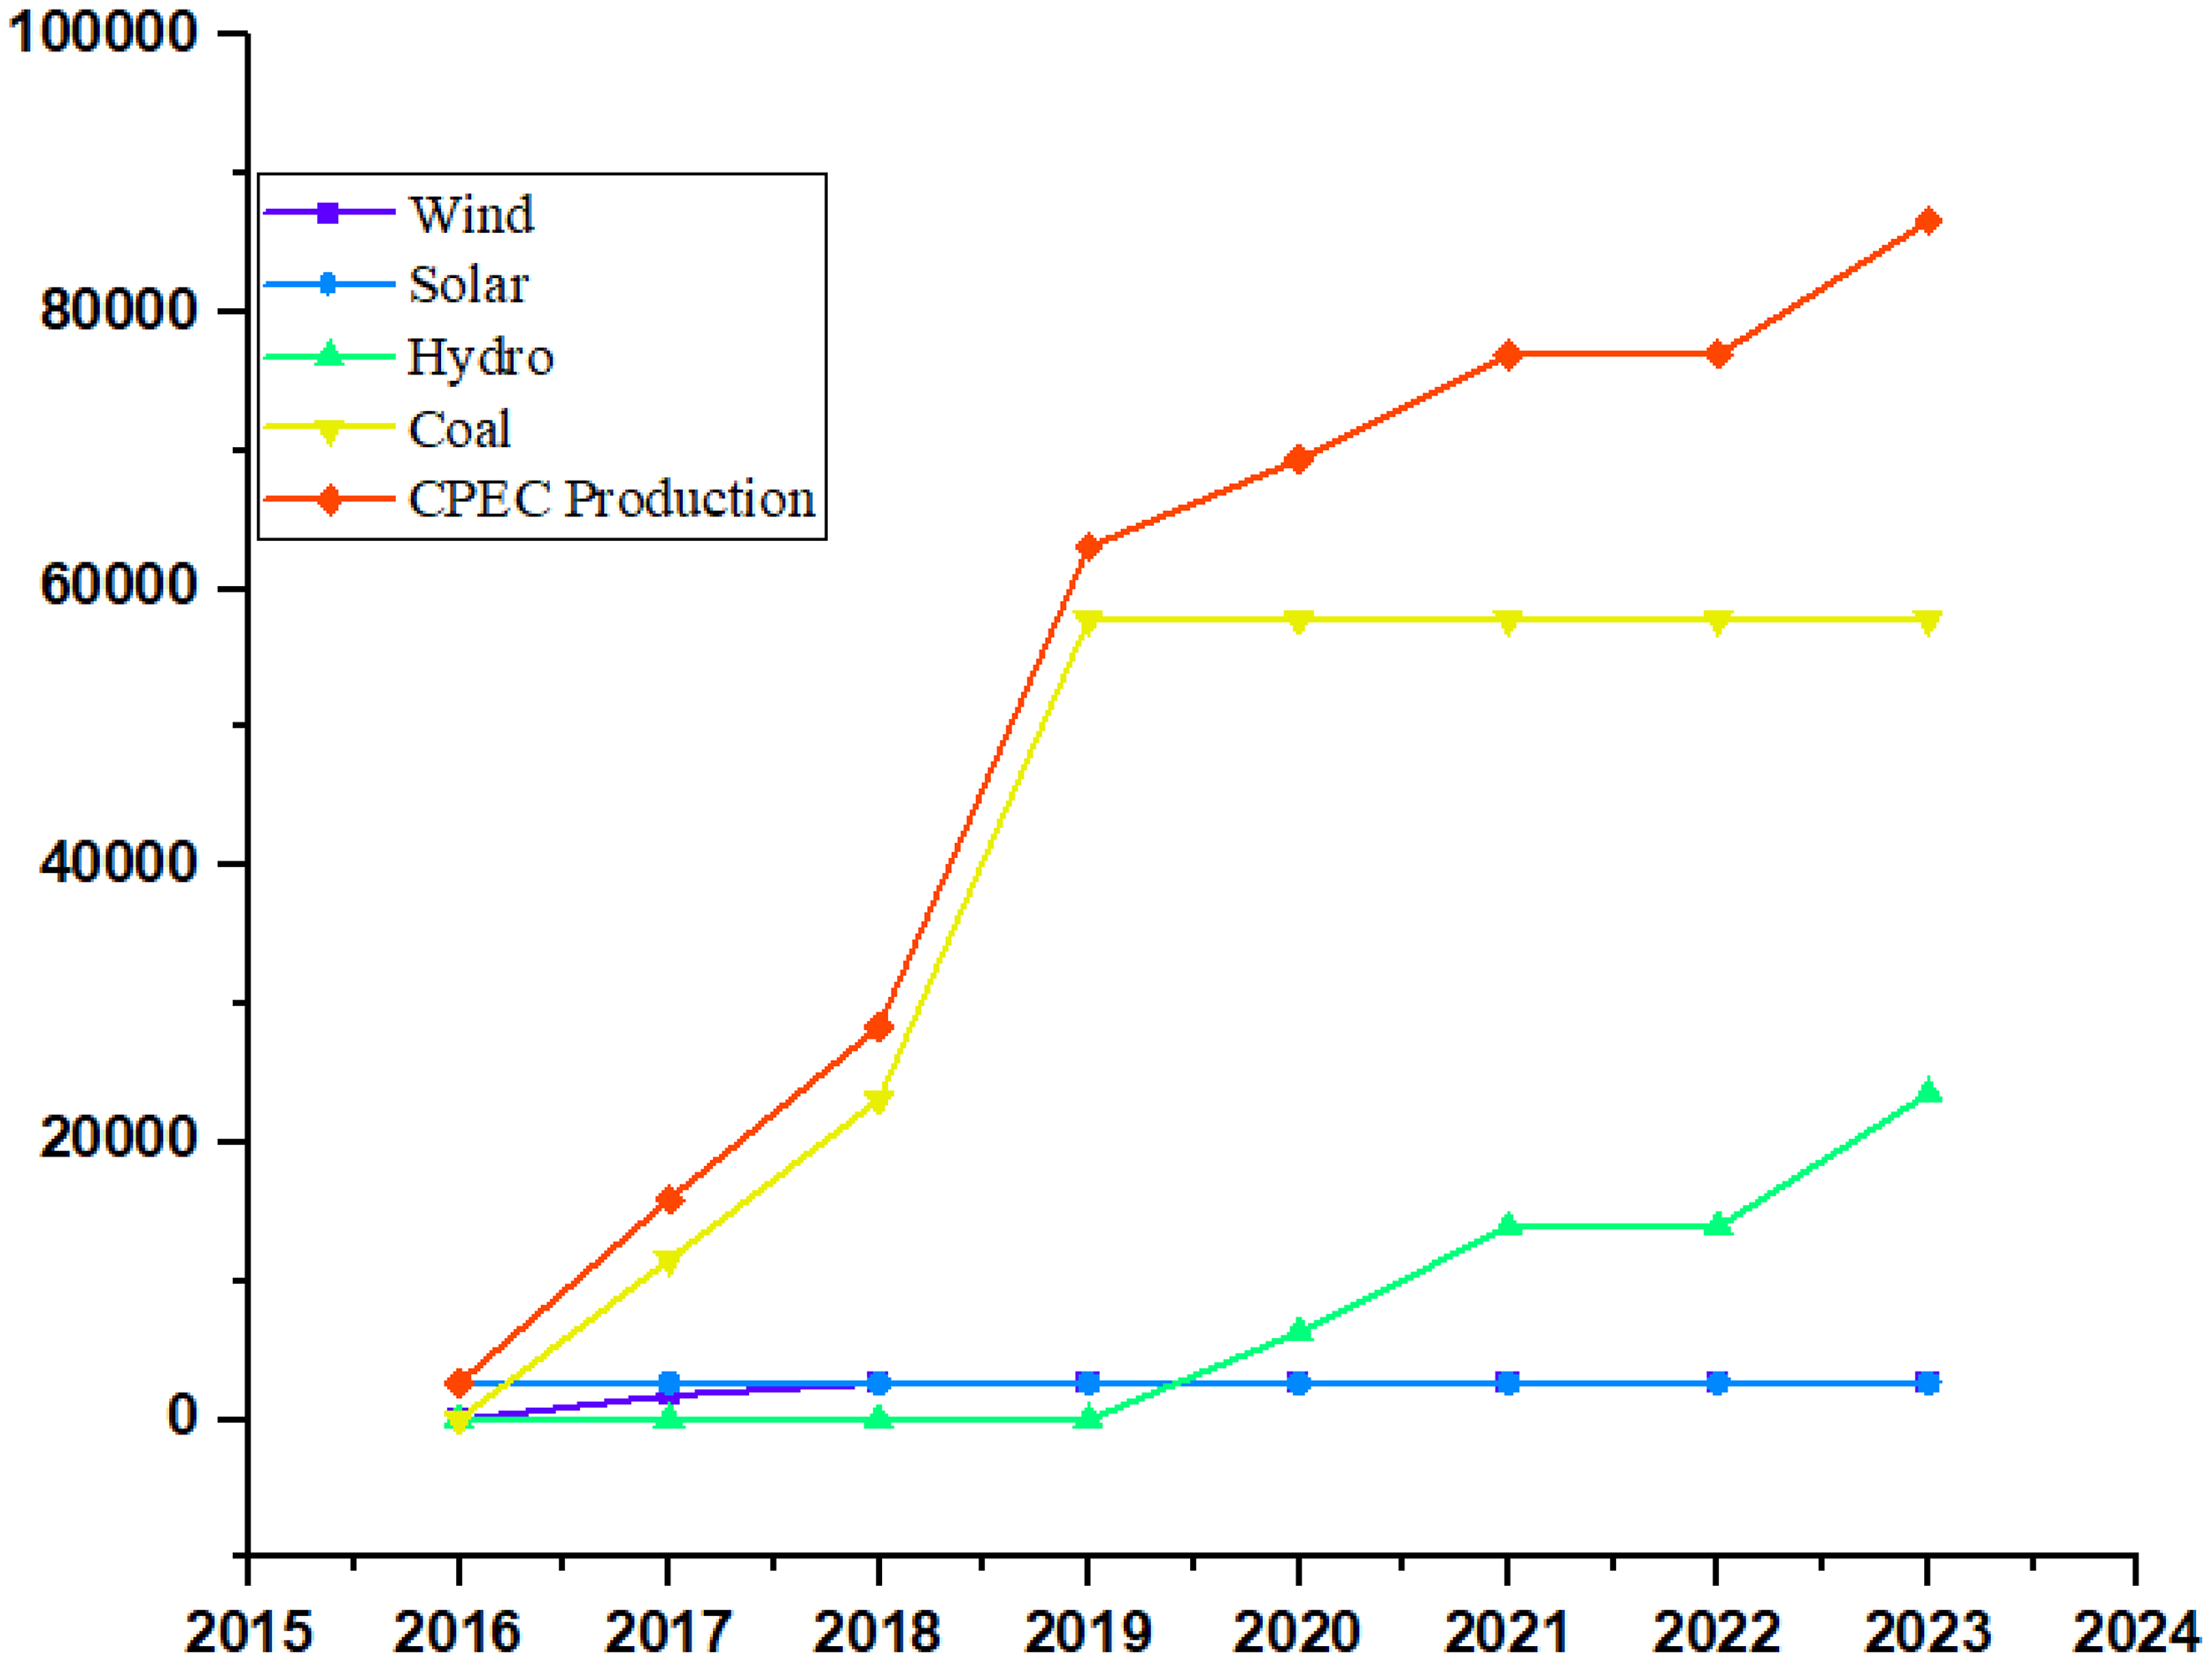
Electricity production by China–Pakistan economic corridor (CPEC) sources.
The electricity demand was 5406 MW in 1990 and increased with an average growth rate of 2.25% to 16,233 in 2015. The model results show that the projected demand would be 440,224 GWh in 2040. The model has estimated the gap between “capacity and production” and the gap between “demand and production,” as shown in Figure 9(a) and (b). The forecasted data set is in Table 4. The results show that productive capacity will start improving significantly after 2021. The estimated results further show that the demand would remain higher than production until 2020. However, after the inclusion of CPEC production, the country will have surplus electricity after 2021 (Figure 9(b)).
Gap between “electricity production and capacity” and gap between “electricity demand and production.” (a) Electricity production and capacity. (b) Electricity demand and production.
Electricity production, capacity, and demand before and after China–Pakistan economic corridor (CPEC) inclusion.
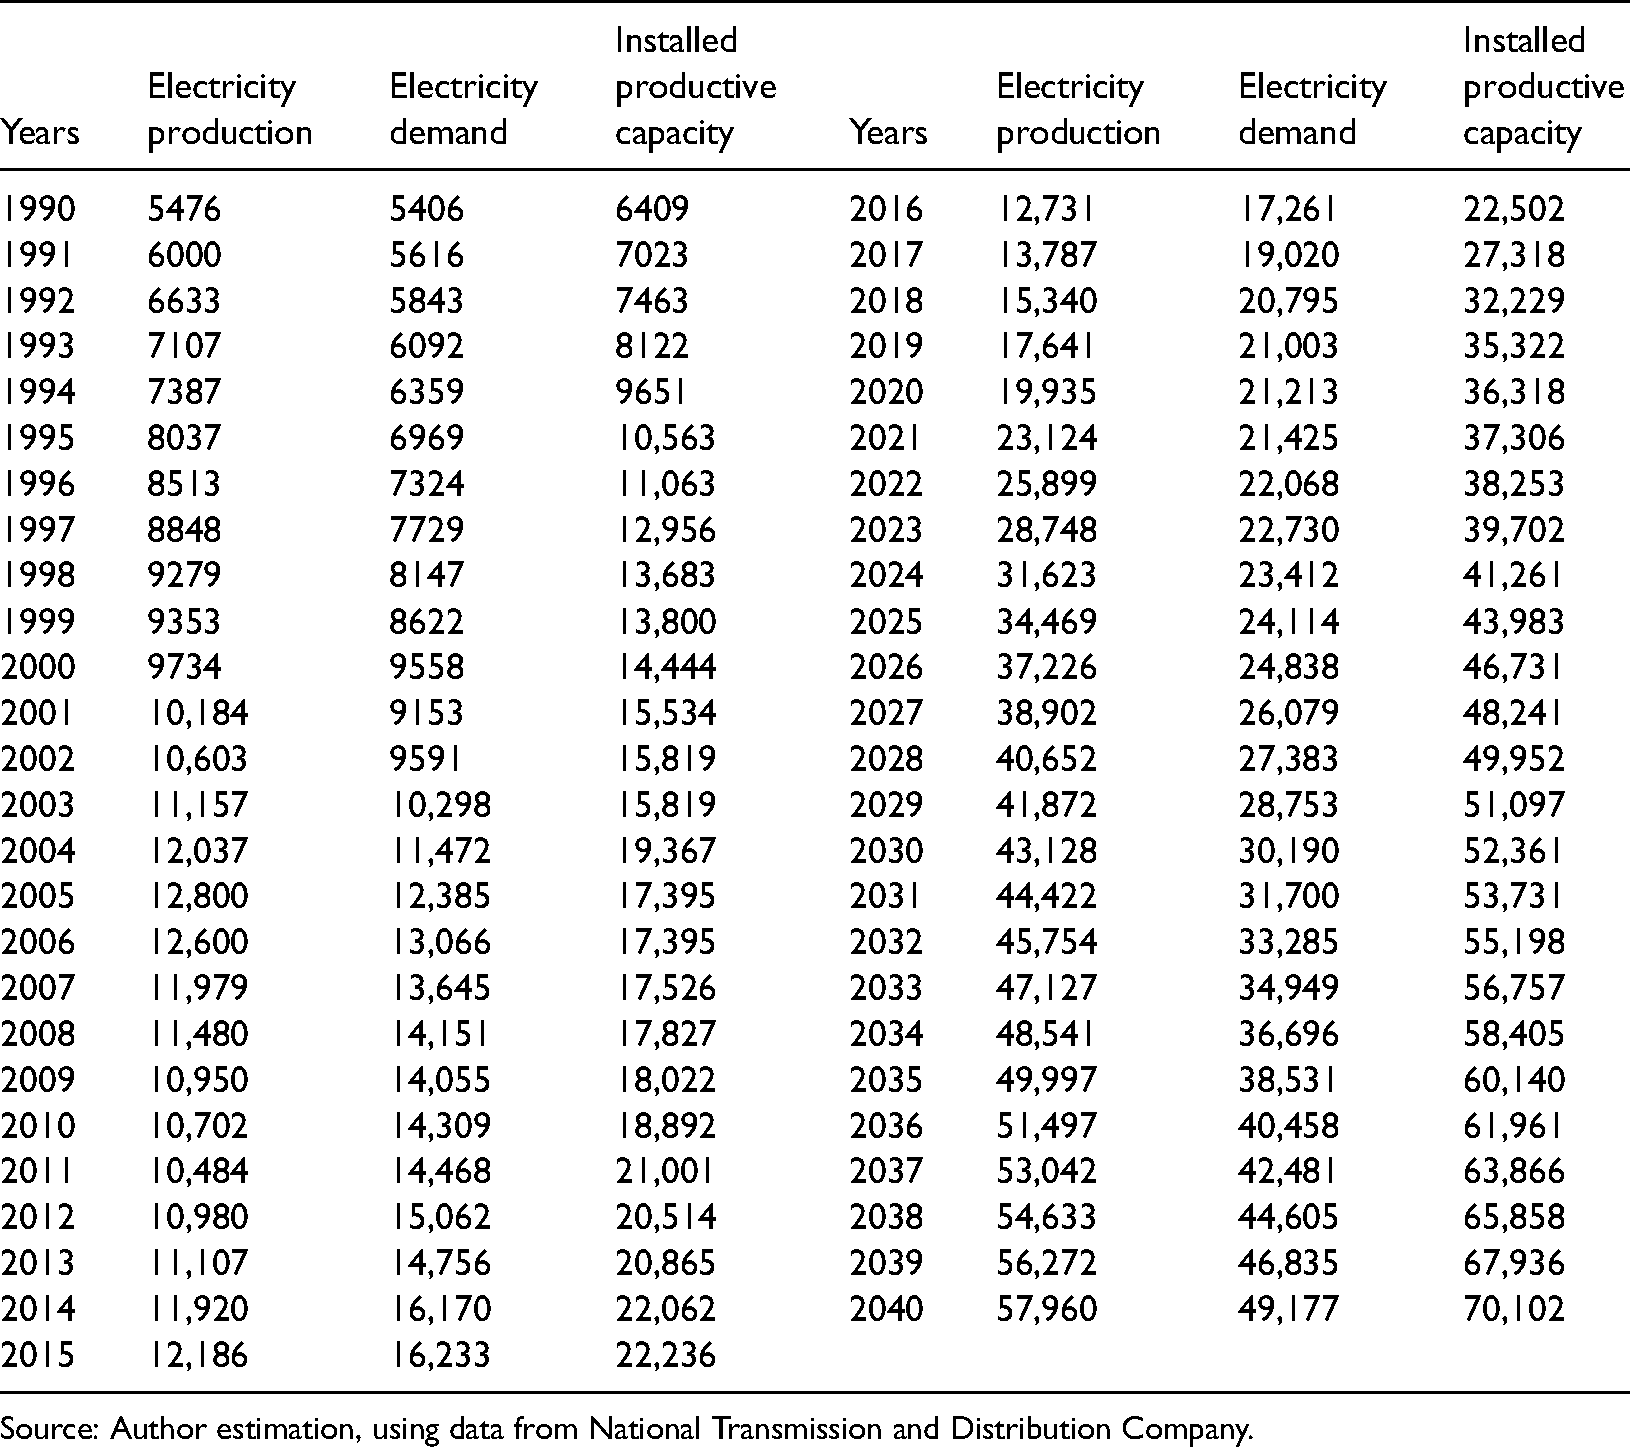
Source: Author estimation, using data from National Transmission and Distribution Company.
The growth rates of production and the productive capacity have also been estimated. The inclusion of CPEC projects would help to increase the average growth rate of production from 4.2% in 1990 to 2015 to 18.2% for the period 2016 to 2040 and 16.8% from 2018 to 2040. Similarly, the average growth in the capacity to produce electricity would increase from 4.35% during 1990 to 2015 to 14.96% for the period 2016 to 2040. The results further reveal that after 2021, there would be surplus production of 1699 MW that would reach an all-time high at 8782 MW in 2040 due to the CPEC initiative.
The self-sufficiency and sustainability in the energy sector will have consistent economic implications for Pakistan. The ease in the energy shortages will boost local exports, linked with employment. 51 To examine its economic impact, we further forecasted the energy demand and supply impact on the GDP and unemployment of the country until 2026. The outcomes are presented in Figure 10. This is because a longer forecast may provide false results as a major portion of energy in Pakistan is consumed in the domestic sector (47%). Similarly, the contribution of the industrial sector in the GDP revolves around 20%, which was reported 19.2% in 2020, consuming 23.85% of total electricity. In contrast, 61% of the country's growth is dependent on the services sector. In the current structure, the industrial sector can boost growth up to 5.5% until 2026, reducing unemployment from 4.65% to 2.88%. Moreover, the economic growth in 2021 is expected to be 3.918% and jump to 5.03% in 2023, and will remain under 6% until 2026. The results show that this will be the threshold level in the current structure. The excessive energy supply will bring back the economy on track and attract more investments. 30 Other factors such as policy and structural reforms, institutional reforms, internal political and law and order situations will aid in production growth and enhance the industry share in the GDP.
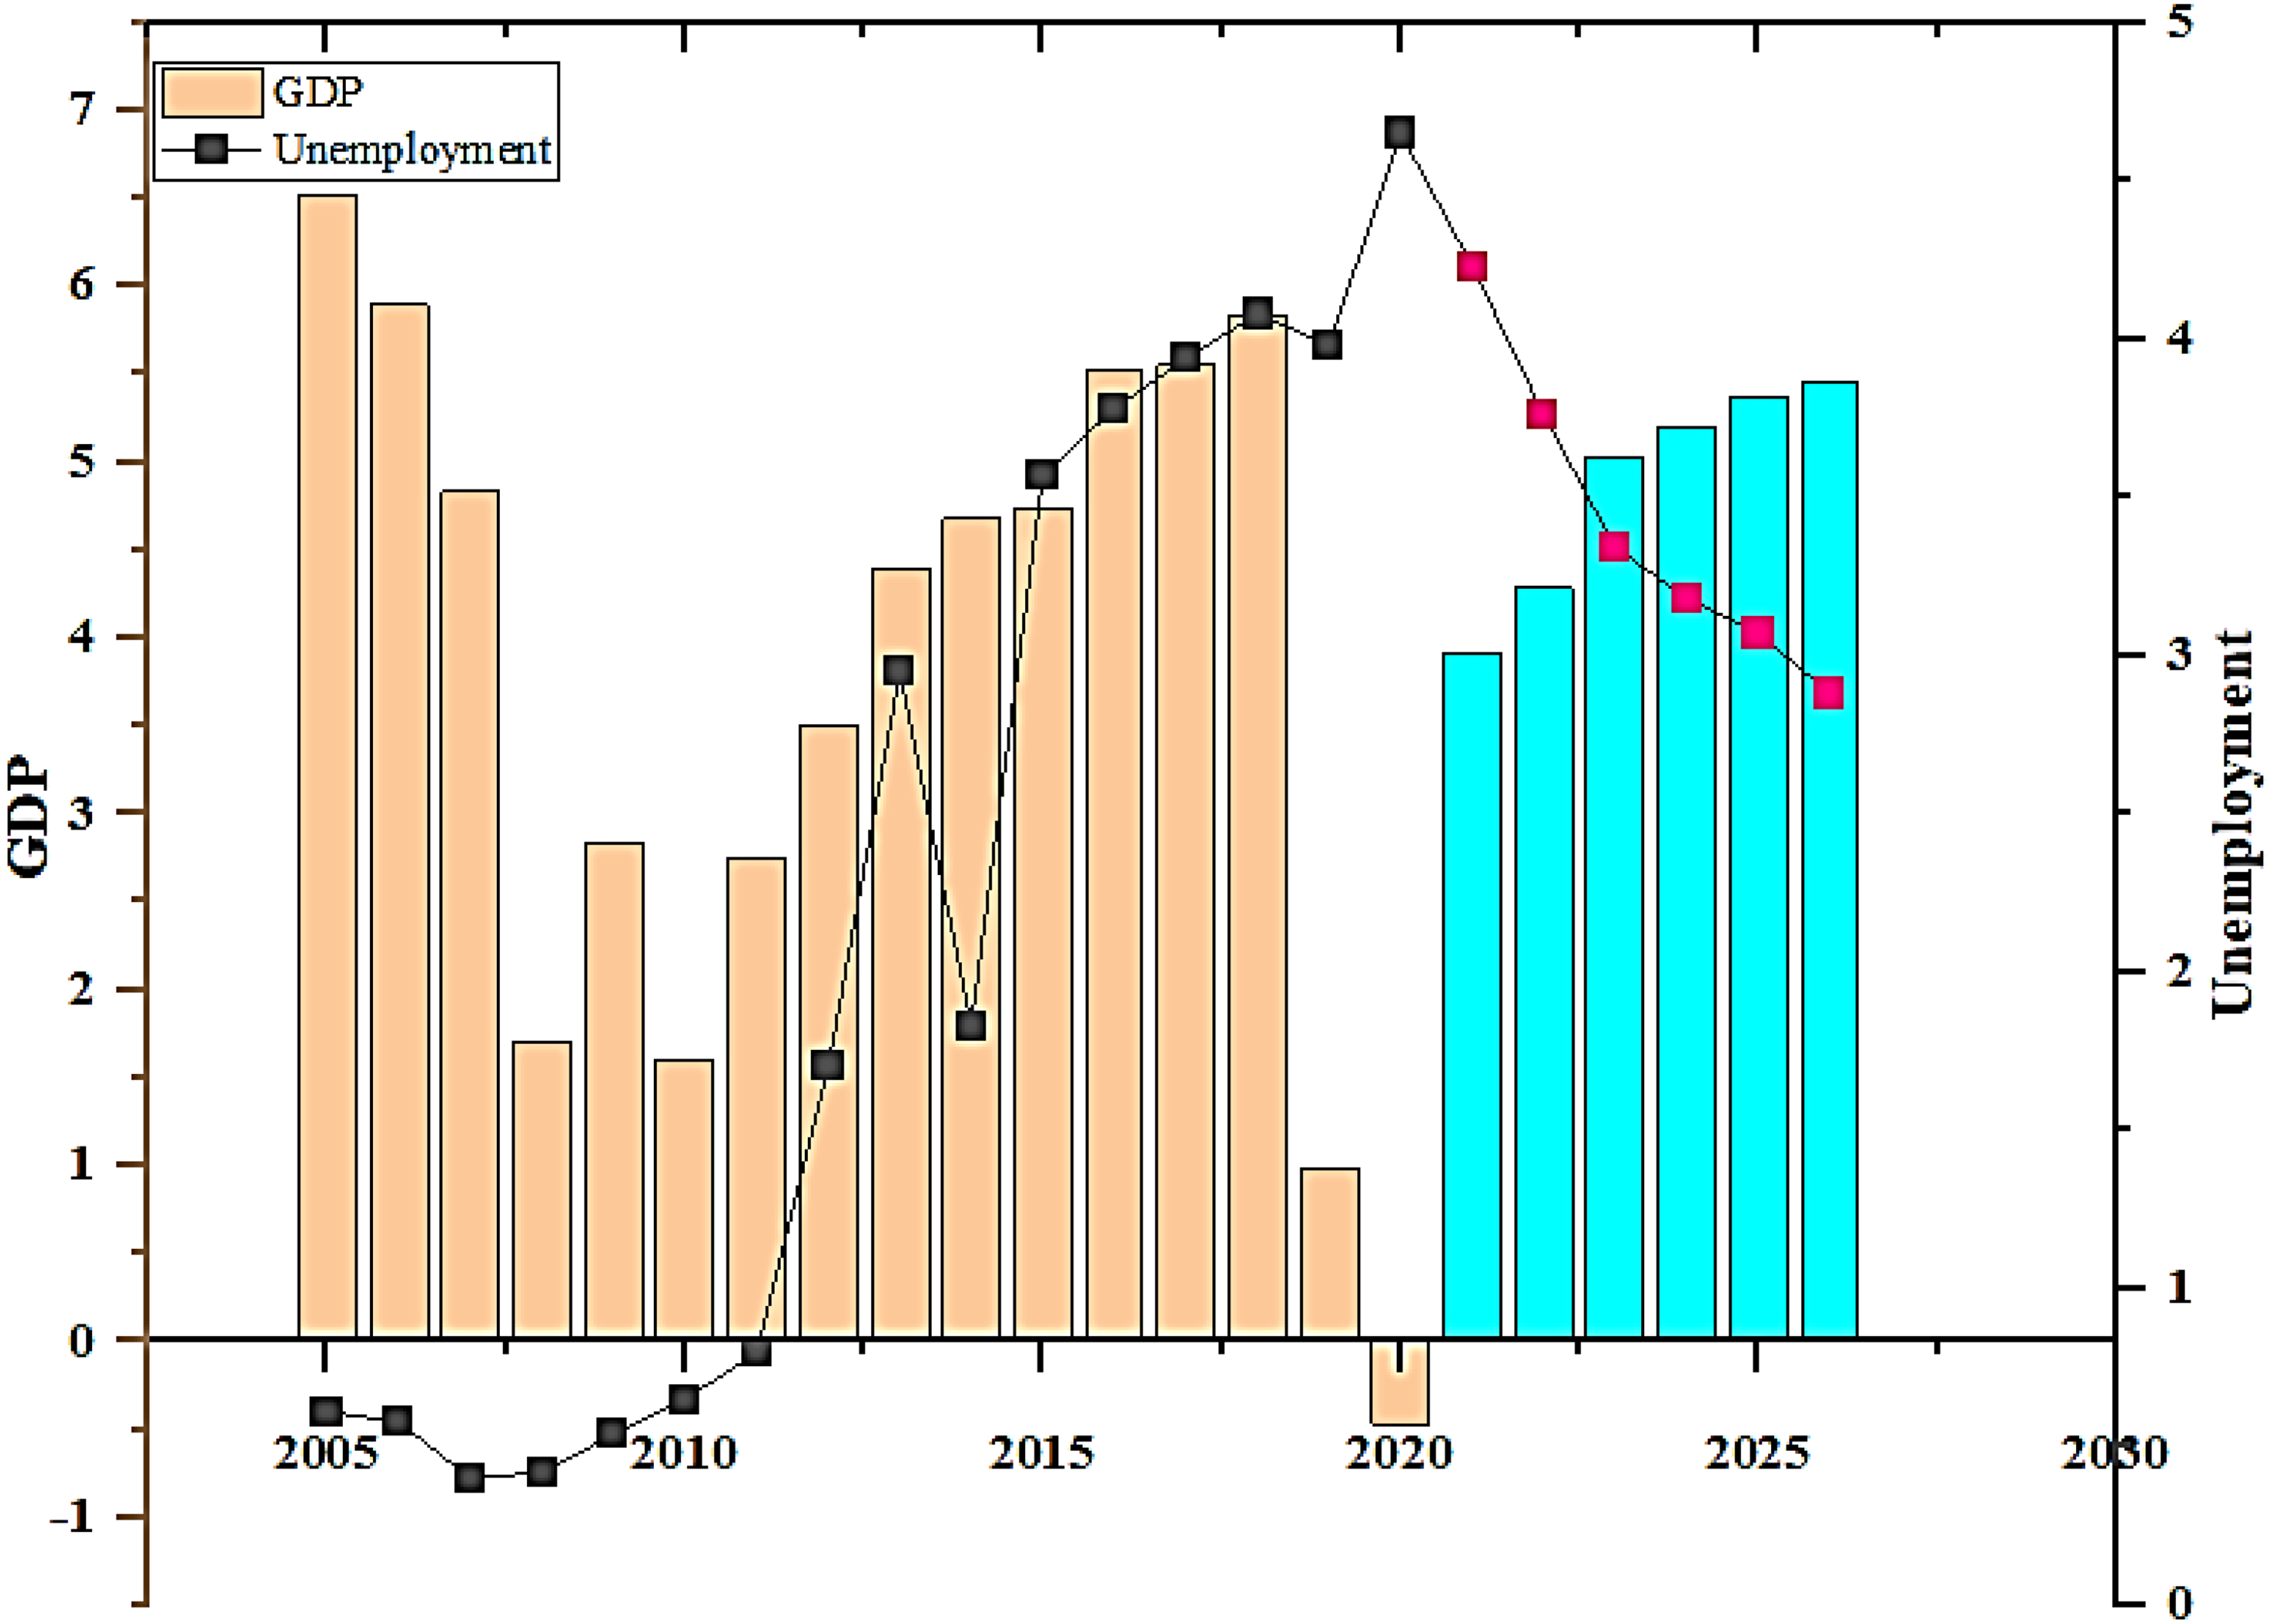
GDP and unemployment forecast. Source: Author calculation, using data from WDI and ILO.
Sustainable energy will encourage domestic industrialists to bring back their production plants moved to neighboring countries due to its shortfall. 8 In the CPEC and belt and road context, Pakistan provided a corridor for China that will help it reach out to the Middle East and Africa. Chinese businesses are interested in moving their production plants to Pakistan to save time, transportation, and labor costs due to the exchange rate differences. Therefore, they already establish 16 new economic and industrial zones in different provinces of Pakistan. 9 It will provide production opportunities to domestic, Chinese, and international firms on the same terms. However, one major hurdle was insufficient energy to run these industries. Once the country achieves a sustainable energy production level, an industrial revolution is possible. 10 It will encourage investors around the globe due to Chinese presence, low labor costs, and connectivity both to Africa, Middle East via Pakistan and Central Asia, and Europe through China. The inward FDI and industries are coupled with technology that improves product quality, uplifts domestic production, and the belt and road initiative will provide access to better product placement worldwide. 52 It will drive the country toward the optimum level by increasing real output, which will uplift living standards by reducing poverty and boosting per capita income and government revenues.
Renewable energy under CPEC and policy targets
The renewable energy projects, production capacity, and completion details are summarized in Table 2 (see the Appendix). In China, the contribution of wind power has increased from <1% of the total renewable energy mix in 2005 to 25% in 2014. The estimated results of our study show that, under CPEC, China is investing 66.7% in coal, 27% in hydro, 3.04% in solar, and 3.04% in wind power by 2023. The present study results show that the share of renewables (excluding hydro) was 0.33% in 2015, meeting only 0.133% of the total electricity demand in the country. The projection for 2040 shows that the CPEC production of renewables (hydro excluded) from wind and solar will raise the share to 0.49% of the total electricity production. If the hydropower contribution is added, by 2040, the renewables share would be 34.59% of the total electricity production. The government is planning to increase the share of renewables to 10% of the total production. In the absence of the policy target, the production of renewables (excluding hydropower) would be just 5256 GWh (1.2% of the demand) by 2040. For two renewable sources, wind and solar, estimations say that the government is required to achieve 61.5 times more production by the year 2040 to meet its policy targets. The past trends show that the efforts to meet policy targets were insignificant. For example, in 2006, under its Energy Security Action Plan 2006, the government set a target to produce at least 5% of the total energy through wind sources by 2030. However, by 2015 to 2016, in 10 years, it could achieve only 0.3% of the total production through wind power. In another case, the situation was not much different. The policy strategy “The National Sustainable Development Strategy (NSDS 2012)” has set the target of renewable energy share, wind, solar, and small hydro to at least 12% of the total energy production by 2022. 11 The same source mentioned that the share of renewable sources (excluding large-scale hydropower) was about 2.3% of the total energy production in 2016, which was about 19% of the total target that has been achieved in 4 years. This leaves around 80% of the target to be achieved in 6 years, that is, by 2022. To enhance solar and wind share, there is an ample need for high investment in renewable sources. The government should first identify and then remove all impediments, from investment to production, to meet its policy targets.
Why green energy now
The CPEC projects will produce energy mainly from non-renewable resources. These projects will cause environmental degradation and have health implications in the future. The resources of renewable energy are enduring and sustainable. The optimistic aspect of such energy consumption is its satisfactory performance for providing the required energy without any adverse effects on the atmosphere. 2 Pakistan will become a trade hub after the completion of CPEC. The Chinese trade for the Middle East and Africa will use the CPEC corridor and it will encourage them to relocate to Pakistan. It will affect energy demand and CO2 emissions in the country.
By shifting to green energy, Pakistan can obtain the following benefits:
As Pakistan needs to rapidly expand its electricity generation, renewable energy will better meet the growing demand than coal, hydro, or nuclear. Wind and solar projects can be built in 18 to 24 months.
53
Energy security can be improved by diversifying sources of power generation, including reducing unnecessary nuclear, thermal, and hydropower projects. Improve energy security by reducing expensive fossil fuel imports. Economic pressure can be reduced by limiting/cutting the demand for imported coal and LNG, thus improving Pakistan's current account balance and easing the pressure on foreign exchange reserves. More than 23% of total imports worth US$12.75 billion consist of refined petroleum, crude, gas, and coal.
54
The reduction in the cost of power generation lowers the tariff costs, which currently imposes additional pressure on businesses and consumers while addressing the cost–tariff deficit in the system will address circular debt problems. The current levelized tariffs in Pakistan are illustrated in Figure 11. The data show that coal, diesel, and hydro levelized tariffs are more than 8 cents/kWh. In comparison, in 2018, solar and wind tariffs are 5.25/kWh and US cents 4.3/kWh, respectively.
55
A firm and ambitious energy policy further reduce renewable energy costs, lowering the cost of solar and wind energy and uplifts the renewable energy industry. Diversification of investment—China is a global leader in renewable energy and a major investor in Pakistan's energy system. With the help of ambitious clean energy policies and plans to adopt new energy technologies, China and other domestic and foreign investors can make diversified investments in energy resources. Renewable energy is likely to attract more international investors than coal and hydropower.
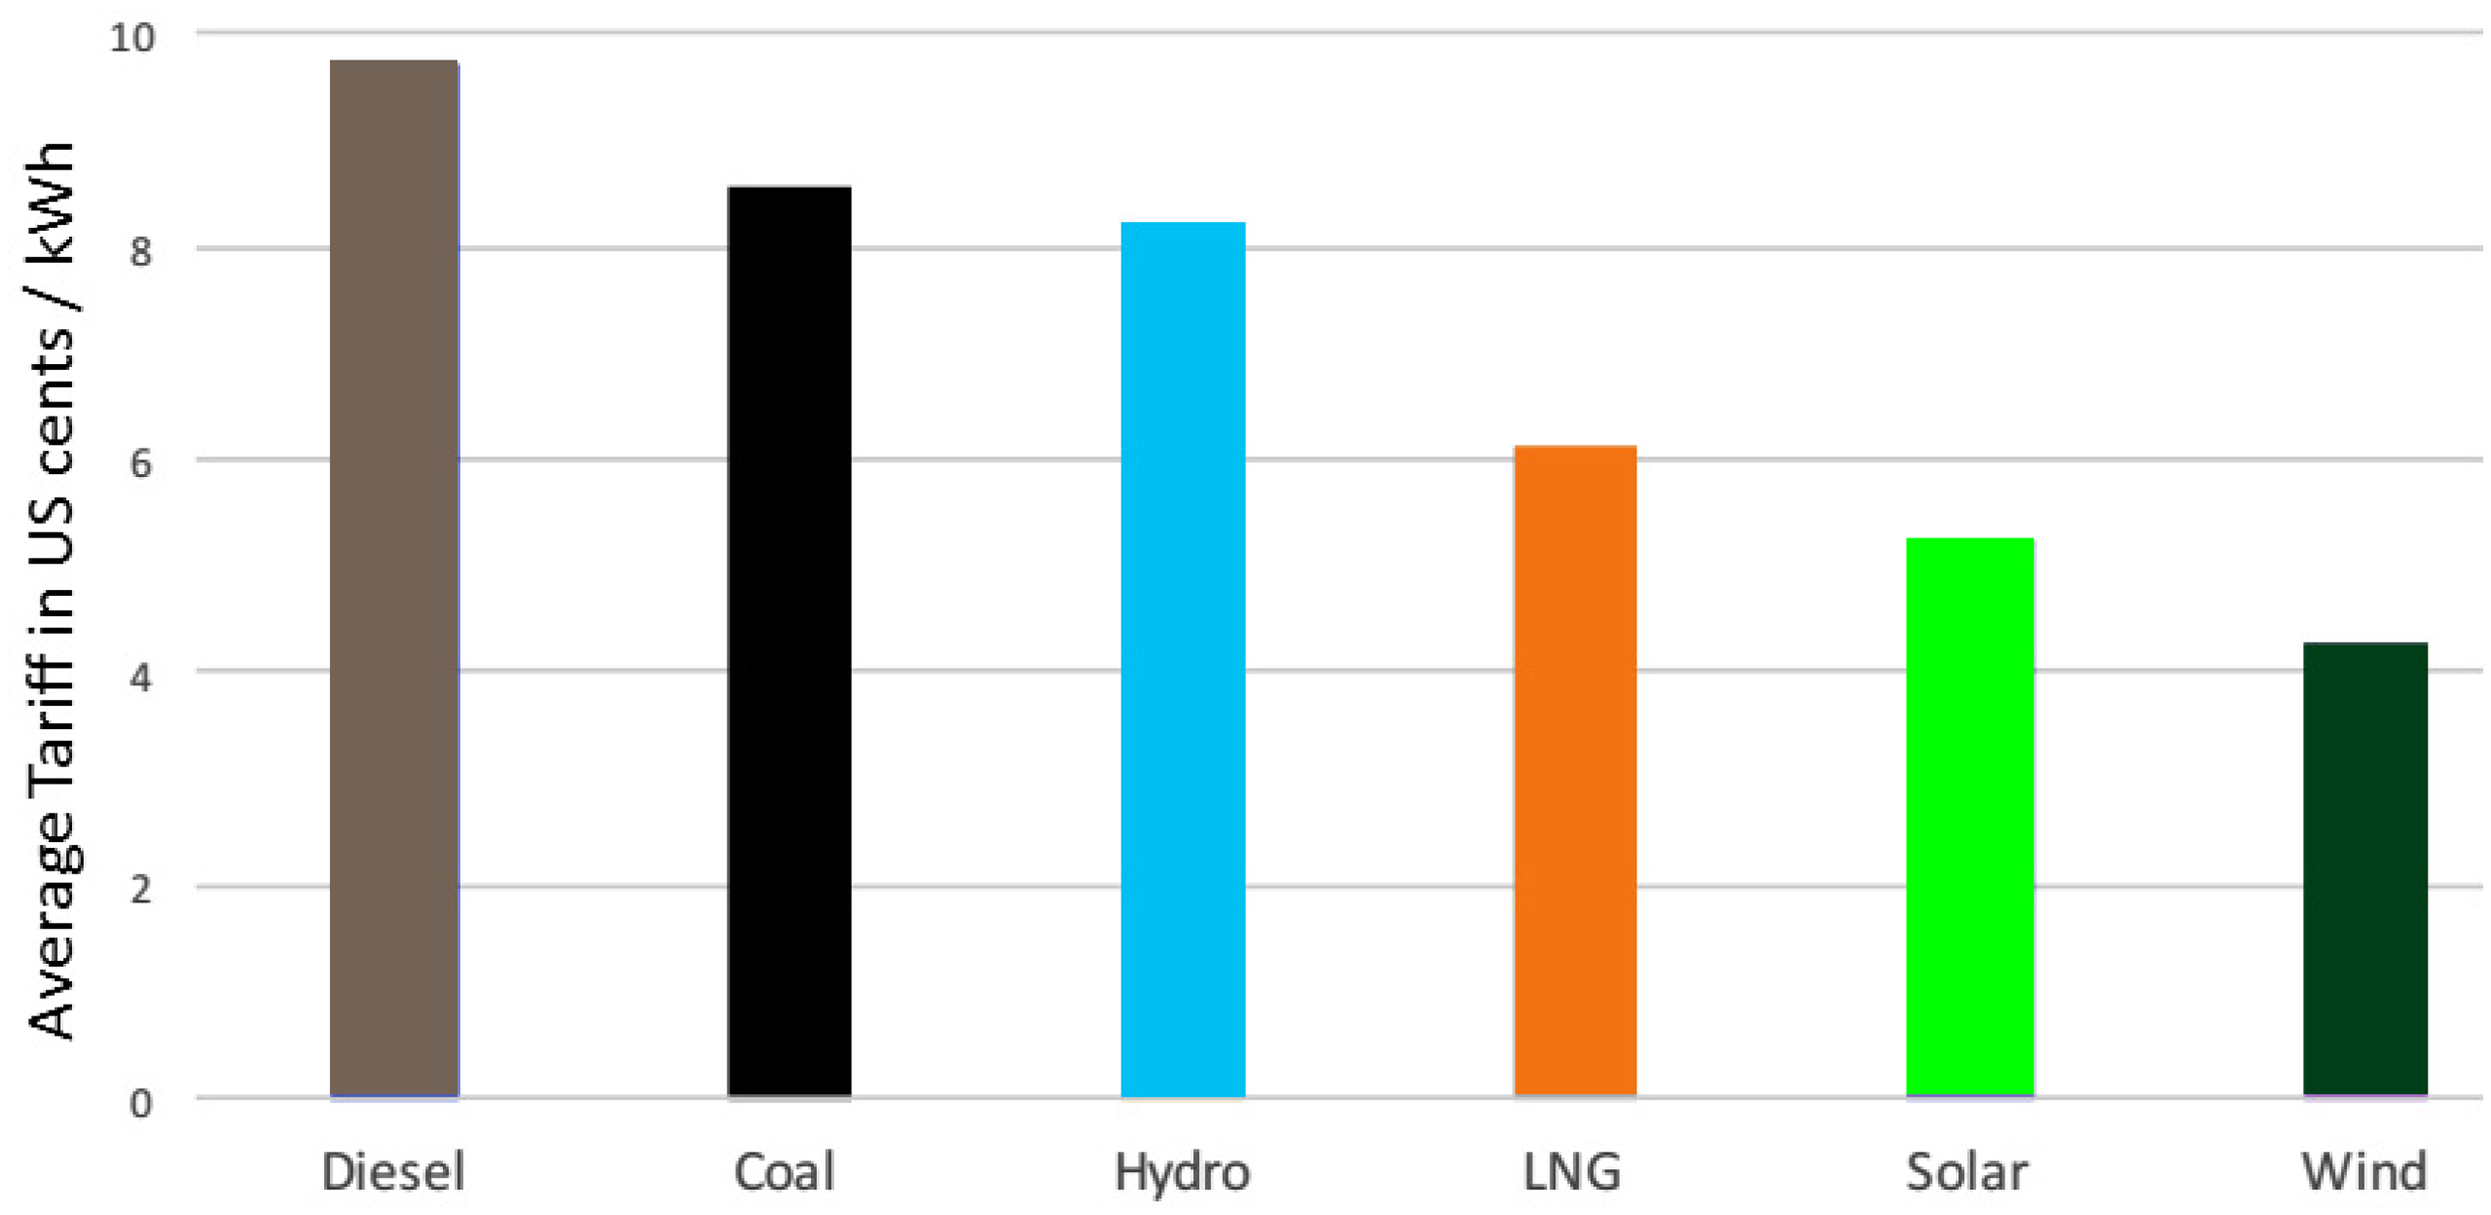
Levelized tariffs in Pakistan. Source: National Electric Power Regulatory Authority, State of Industry Report 2018.
Barriers in green energy production
Pakistan has huge potential for wind and solar energy, but few barriers must be overcome to capitalize on them. These category-wise barriers are summarized as follows.
Economical barriers
They are capital intensive and normally take a longer time to generate profits.
The initial cost of the new solar and wind project. Lack of awareness regarding market potential. Government subsidies are limited and banks are reluctant to provide loans for large renewable projects. The risk associated with performance after installation.
Policy barriers
Complicated policies for private investors and public–private partnerships.
Weak policy and environmental structure.
Unclear tariff system for renewable energy.
More priority to other energy mix sources and fewer reforms for renewable energy.
More subsidies for other energy mix sources and less for renewable technologies.
Technological barriers
Local technology is not reliable.
Limited production at the local level and there is no state-level solar cell production facility.
Foreign dependence on key components and equipment.
Unauthentic wind and solar maps and dependence on developed economies. Lack of technical knowledge increases dependence for both installation and running the daily operations.
Human resource and market information barriers
Insufficient information regarding energy efficiency for effective social mobilization policies.
Inadequate business management and marketing skills.
Lack of knowledge about modern wind and solar technologies, professional equipment, potential financers, and suppliers.
Limited skilled manpower and experts to handle big projects.
Solar and wind data collection constraints and uncertainties of project development.
Social barriers
Lack of green energy (solar and wind) awareness, especially in rural areas.
Acceptability and participation are lacking because people stick to traditional power generation ways, which is a major obstacle in green energy projects.
Due to the cultural issues, several communities oppose some projects, such as installing solar heaters or panel on high roofs.
They also fear that if some problems occur (solar), they do not have the expertise to solve them themselves. In addition, because of new technology, repair and maintenance costs will be higher.
Conclusion
The estimation of energy demand, sources, and energy supply is an area of concern for researchers and policymakers. SD has been widely used in other countries to estimate and project the patterns of energy issues. The present study aimed at developing and implementing an SD model for the power sector of Pakistan and forecasted the energy demand and supply up to 2040, including the CPEC projects. The outcomes reveal that the energy sector will meet the increasing demand in 2021 because of CPEC investment in the energy sector. The CPEC energy projects will boost the average production growth from 4.6% during (1990–2018) to 15.8% for 2019 to 2040. However, this study also highlighted the available renewable energy resources, the reason for adopting them, and the barriers to renewable energy production. Therefore, policymakers should consider the following policy measures to reduce their dependence on imported fuel and increase the share of renewable energy in the energy mix.
Policy implications
This study provides the following policy recommendations for the government of Pakistan.
The cost of electricity generation, losses at each level of the chain, inadequate recoveries, and generation capacity constraints created financial distress and circular debt. The second reason that has never been discussed is a lavish contract with IPPs, as their payments in dollars are hurting the sector. Therefore, firstly, the government has to reduce its dependence on fossil fuel and LNG and speed up the ongoing hydro projects. They can reduce the line losses through proper maintenance, which can be started grid-wise from the most to the least affected area. The ElectroCure (electric meter) and TransfoCure projects by PESCO have saved $19,745 from one Karkhano feeder. It can identify theft, reduce load shedding, and improve the accuracy of billing. 12 Given these aspects, the government should prioritize the initiative and implement it in other regions as well. This will strengthen the sector and generate revenues that can be later used for other projects. In addition to this, the government should negotiate contracts with IPPs, reduce dependence on furnace-based producers, and encourage them to divert their investments toward the renewable sector.
The energy sufficiency and infrastructure development under the CPEC project provided a base for long-term development. Moreover, current policy reforms strengthen the country's position in several business-related indices such as the doing business index or the starting a business indicator (provided by World Bank), as the position changed from 130th to 72nd. 13 However, the government still needs to improve and develop a business-friendly environment, accelerate ease of doing business, strengthen domestic law and order, and facilitate access of investors to uplift FDI inflows. In this regard, foreign missions can coordinate with Pakistani businessmen and encourage investments. Similarly, the government can also coordinate with international donor agencies such as IRENA/ADFD, ADB, GEEREF, and Renewable Energy and Energy Efficiency Partnership for green financing.
The rise in the share of solar and wind-based energy can reduce fossil fuels. This can be possible by adopting Renewable Portfolio Standards and Feed-in Tariffs. Such measures will encourage investors to head toward green energy production.
The domestic sector consumes a major portion of the energy. Therefore, for better utilization of solar energy, the government should prioritize its availability, and cutting tariffs/import duties will help in reducing its cost. Lower prices will create demand and business opportunities, lower demand-side pressure, and move the country one step closer to complete conversion. It will also help in reducing the import bill and help in building the national reserves.
Pakistan is an agriculture-based economy, so electric shortages and their costs can reduce the comparative advantage of commodities. The International Water Management Institute launched the solar pumps program back in 2015, providing a cost-efficient alternative. However, the problem is awareness and availability in the rural areas of Pakistan. This can be done quickly, initially from importing and later producing them at a local level. This initiative will reduce costs and the burden on the national grid.
China started both wind and solar energy projects in Pakistan. Instead, the focus should be on transferring technology, manufacturing key components, overhauling, and training the local staff at all levels.
The Pakistani government should initiate an energy research program. This could be co-financed by a joint venture with entities from other industries such as cement or steel. These entities could be motivated by common advantages from technological upgrades because they are massive consumers or exemptions in tariffs or taxes.
Lastly, the government should build awareness regarding environmental hazards also educating people on the sustainable link between prosperity and clean energy.
Directions for future research
The study highlighted a few potential areas that need the attention of academic researchers and policymakers. Firstly, excessive energy supply will attract local and foreign investors, and in the future, will induce demand-side pressure. Therefore, it is necessary to design a framework based on model (1) by continually changing the variables 1% up and forecast the energy demand and capacity required in the coming years. In addition to this, another point of focus would be determining the pressure on the electricity demand that derives from the percent growth of certain key variables while maintaining everything else constant:


Footnotes
Declaration of conflicting interests
The authors declared no potential conflicts of interest with respect to the research, authorship, and/or publication of this article.
Funding
The authors received no financial support for the research, authorship, and/or publication of this article.
Notes
Appendix
See Figures 12 to 15 and Tables 2 to 4.