
Abstract
To figure out at what extent of China's investment in energy technology in recent years has helped economic growth and improved the environment. From the basic theory of environmental regulation’s influence on energy consumption efficiency, this study uses the super-efficiency slack base model to measure the green energy efficiency of 30 provinces in China from 2010 to 2019, and uses the kernel density function to analyze evolution trajectory. Then, the spatial Dubin model is used to test the influence of some important economic variables. The results of value show that although China's green energy efficiency improved significantly from 2010 to 2019, the overall performance was lacking. However, the overall efficiency value was significantly improved during the study period. Moreover, the efficiency value was closely related to the performance of economic development. From the dynamic trajectory perspective, efficiency values of all years show the type of "two peaks".Altough the width between the two peaks did not change noticeably, but the efficiency still had a significantly improved. In addition, according to the results of spatial economic regression analysis, eco-environmental constraints, foreign direct investment, and industrial agglomeration were not conducive to the efficiency value, while industrial structure and manufacturing enterprise scale had positive effects. In addition, the influence effects had obvious spatial phenomena. Therefore, for the Chinese government, enterprises and society, the next step is not only to vigorously exploit energy-saving and emission reduction technologies to improve energy consumption efficiency but also to establish reasonable environmental regulation policies to push enterprises to produce in a cleaner way. Additionally, a reasonable regional development plan should be established to promote the rational distribution and flow of the energy industry across different places. This paper provides a novel perspective for the study of energy input and usage.
Keywords
Introduction
Energy Is an important factor in economic and social development. The history of human economic and social development is also a history of energy development. 1 Since the first industrial revolution, the discovery and use of carbon-based energy (coal, oil and gas) has greatly increased productivity. However, the serious crisis of the economy and environment caused by energy consumption has gradually become a popular research topic. Studies have confirmed that energy consumption causes serious environmental pollution.2–5 Since the 1970s, environmental protection and regulation have been widely considered by countries around the world.6,7 As a fast-growing economy, China's extensive economic growth model has wreaked havoc on environmental quality. For example, in 2016, China's CO2 emissions from fossil energy accounted for 1/3 of world emissions, far exceeding that of other countries. 8 The conflict between resource and environmental constraints and accelerated industrialization is becoming fierce. Currently, the carrying capacity of resources and the environment in most areas of China has reached or is approaching its upper limit.9,10 The development pattern of the past no longer supports China's rapid economic growth and sustainable development. Environmental protection has become an important part of people's livelihood.
Recently, the Chinese government has been deeply aware of this problem. On September 22, 2020, Chinese President Xi Jinping, had proposed at the general conference of the 75th United Nations that China would adopt more powerful policies and measures to strive for the peak of carbon dioxide emissions by 2030 and achieve carbon neutrality by 2060. 11 However, this is not an easy task. This will be a huge transformation of economic structure, social cognition, energy transformation and technological innovation, and even a change of the humankind, because energy is not only the driving force of economic and social development, but also the main source of carbon emissions.1,12 Now China's energy structure is relying too much on coal. From the perspective of China's energy consumption structure in 2020, coal consumption accounts for 56.8%, oil for 18.9%, and clean energy such as gas and non-fossil accounts for 24.3%. 1 Under the premise of continuous industrialization, China's demand for energy will continue increased in the future. Therefore, the core of how to ensure China's energy security should be to vigorously reduce the proportion of coal and other fossil energy, and develop non-fossil energy dominated by renewable category. 13 Therefore, it is necessary to commit to improving energy efficiency and pushing the transformation of China's economy to a green economy with low energy consumption, low emissions, and high output. 14 Energy utilization is the key factor to economic development and environmental governance promotion. Therefore, under the condition of energy shortages and ecological destruction, environmental regulation and energy efficiency are both important objectives of China's economic development and transformation. Whether the two types of policy, energy and environment, can achieve a better combination is the key to the realization of China's future green development transformation.
This paper establishes a theoretical framework for the relationship between environmental regulation and energy efficiency, bringing the possible environmental damage caused by energy consumption into the calculation of energy efficiency, and constructs the concept of “green energy efficiency”. This study also seeks to further enrich the literature of energy and environment economics and to clarify the relationship between environmental regulation and energy efficiency. Additionally, the results can aid in assessing the applicability of the “Porter Hypothesis” under the background of the Chinese economy entering a high-quality period while also helping to clarify the magnitude and direction of environmental regulation of energy efficiency.
Literature review
Energy is an important guarantee for social and economic development. From the static perspective of traditional economic theory, environmental regulations will force enterprises to increase investment in pollution treatment, resulting in increased production costs, reduced business benefits and energy efficiency. However, Porter 15 and Porter & Vander Linde 16 proposed the Porter hypothesis, which is different from traditional theory and holds that environmental regulation promotes enterprise innovation, optimizes the energy structure, and urges technological progress, thereby improving energy efficiency. Academic studies have confirmed that technological progress is the key to improving energy efficiency.17–20 Some representative studies include, Cagno et al. 21 who studied Italian foundry enterprises and found that enterprises with better innovation activity had higher energy efficiency, were more willing to adopt existing energy saving technologies, and had fewer cognitive barriers to energy efficiency improvement, Otsuka et al. 22 who used data from Japan and found that the productivity improved by technological progress promoted energy efficiency, Ramirez-portilla et al. 23 who also confirmed the positive correlation between enterprise innovation and energy efficiency, Li & Du 24 who confirmed that the deep integration of the internet and manufacturing technology is conducive to promoting the development of the manufacturing industry towards intelligent energy saving, which is conducive to improving energy efficiency and Chen & Lin 25 who find that infrastructure development can reduce regional differences in green total factor energy efficiency in the manufacturing industry and that the impact is heterogeneous across transport and power infrastructure. Over time, the marginal effect of infrastructure diminished.
However, for environmental regulation, there are two opposing views. Some scholars have calculated that environmental regulation has an inhibitory effect on energy efficiency.19,26 However, additional studies have confirmed that environmental regulation has a positive effect on energy efficiency.27,28 For example, as early as 1977, the National Research Council and EPA conducted a study on the relevant data of the 1960s and 1970s in the United States and found that environmental regulation can lead to an increase in energy efficiency. The economic benefit is much greater than the cost of the environmental regulations.
Researchers contend that the effect of environmental regulation on energy efficiency depends on the combined effects of both positive and negative aspects 29 ). The strengthening of environmental regulations increases the production and operation costs of enterprises, which forces enterprises to spend part of their funds on pollution prevention and control or pay pollutant discharge taxes and fees, thereby increasing production costs. 30 In addition, with the increase of the intensity of environmental regulation, enterprise pollution treatment cost increases gradually, which, to an extent, is due to productive investment, resulting in a decrease in the level of enterprise production. If the energy input levels remain the same, the output is reduced to a certain extent, reducing the overall energy efficiency.31,32 Conversely, forced by the government's environmental regulations, some enterprises must improve and upgrade their production methods to maintain market advantages, which may promote the overall production performance of enterprises and energy efficiency.33,34 Additionally, new enterprises are usually required to install more advanced energy and pollution control equipment than old enterprises, and existing enterprises and new enterprises are required to set different pollution prevention standards, thereby establishing a barrier for new enterprises to develop. This type of regulation is known as “grandfather rules”. 35 Therefore, under strict environmental regulations, the overall enterprise has higher energy efficiency and pollution control ability.36,37
In addition to environmental regulations, energy efficiency is also affected by other factors. For example, economic agglomeration is the primary manifestation of the spatial distribution of economic activities and elements, and the spatial distribution of economic activities will undoubtedly have a significant impact on energy demand and pollution (carbon) emissions. 38 It also has a significant impact on the productivity of output and additional factors. 39 Foreign direct investment has an obvious impact on energy consumption in both the long and short term. 40 Industrial scale change, structural adjustment and industrial upgrading all have great significance for improving energy efficiency, realizing energy conservation and emission reduction, and regional economic development.41,42
In conclusion, there are certain differences in the verdicts about the impact of environmental regulations on energy efficiency. Therefore, further verification of the relationship between the two has certain significance for solving the conflict between the environment and economy in China. Considering this issue, this study uses the super-efficiency SBM model to measure total factor energy efficiency, uses the spatial econometrics method to incorporate it into the analysis framework, and further analyses the relationship between the two. The results of this study provide some reference for the formulation of relevant environmental regulation policies and further supplement the literature in this field.
Calculation and dynamic analysis of green energy efficiency
Super-efficiency SBM model
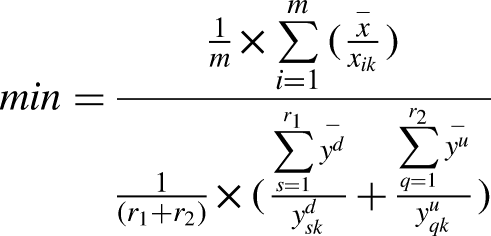
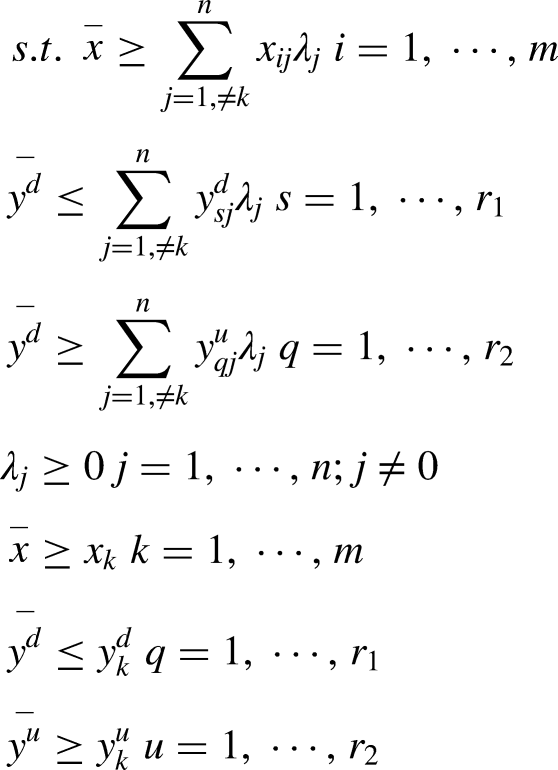
Data envelopment analysis (DEA), a nonparametric estimation method created by the famous operational research scientists A. Charnes and E. Rhodes, is frequently used in the interdisciplinary areas of operations research, management science and econometrics. Its principle is to construct a relatively effective efficiency frontier by mathematical programming and then judge the relative effectiveness of each production decision unit (DMU) according to its deviation from the frontier, which is a decision-making method to evaluate efficiency. The greatest advantage of this method is that it does not need to consider the functional relationship between input and output indices or estimate parameters and weight assumptions, thereby avoiding the influence of subjective judgement. 43 The slack-based measure (SBM) model is a non-radial DEA model based on slack variables that was proposed by Kaoru Tone in 2002. 44 This model directly adds slack variables into the objective function, and the result is no longer just the maximization of the efficiency ratio but the actual profit. The super-efficiency data envelopment analysis (SE-DEA) was modified on the traditional DEA model. In practical applications, the classical DEA model may produce multiple DMUs at the same production frontier (that is, the efficiency value is 1), which creates difficulties for further comparative analysis and sequencing. The SE-DEA model was improved based on the BCC model and proposed by P. Andersen and N. C. Petersen in 1993. It can make the efficiency value of the effective DMU greater than 1 so that all decision units can be further evaluated and compared.
Suppose there are n decision units, and each decision unit consists of three parts: input m, desired output
Variable definition and data sorting
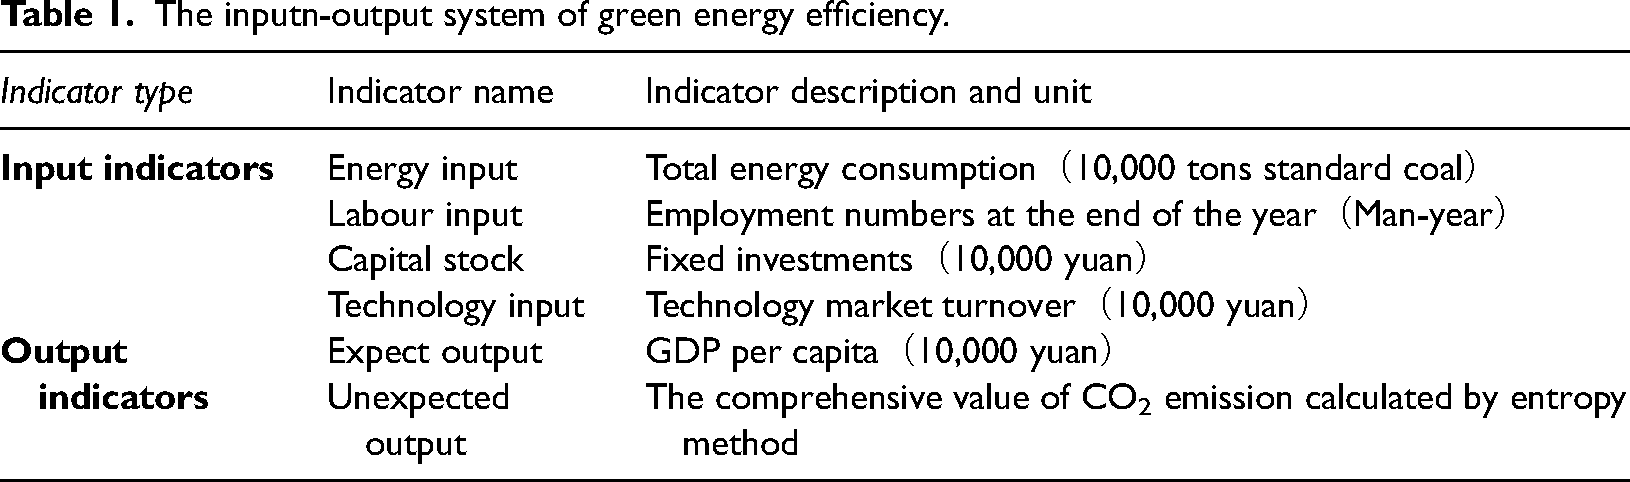
Energy consumption is a complex production system with many input and output variables, so efficiency evaluation should be considered comprehensively. Referring to previous academic studies on energy efficiency and considering important conditions such as data consistency, the variable indices selected in this paper are all large-calibre statistical variables related to energy consumption, as shown in Table 1.
The inputn-output system of green energy efficiency.
This study considers the research years of 2010∼2019, and the data primarily originates from the China Statistical Yearbook, the China Energy Statistical Yearbook and the China Environmental Statistical Yearbook from 2011 to 2020. Cooper et al. concluded in 2001 that the number of DEA decision units in the algorithm should meet the condition of
Calculation of super-efficiency of energy consumption
MaxDEA Pro 6.6 was used to realize the operation of the model, and the energy efficiency of 30 provinces and autonomous regions in China from 2010 to 2019 was calculated. The results are shown in Table 2 and Figure 1. The drawn of Figure 1 is based on the average value.
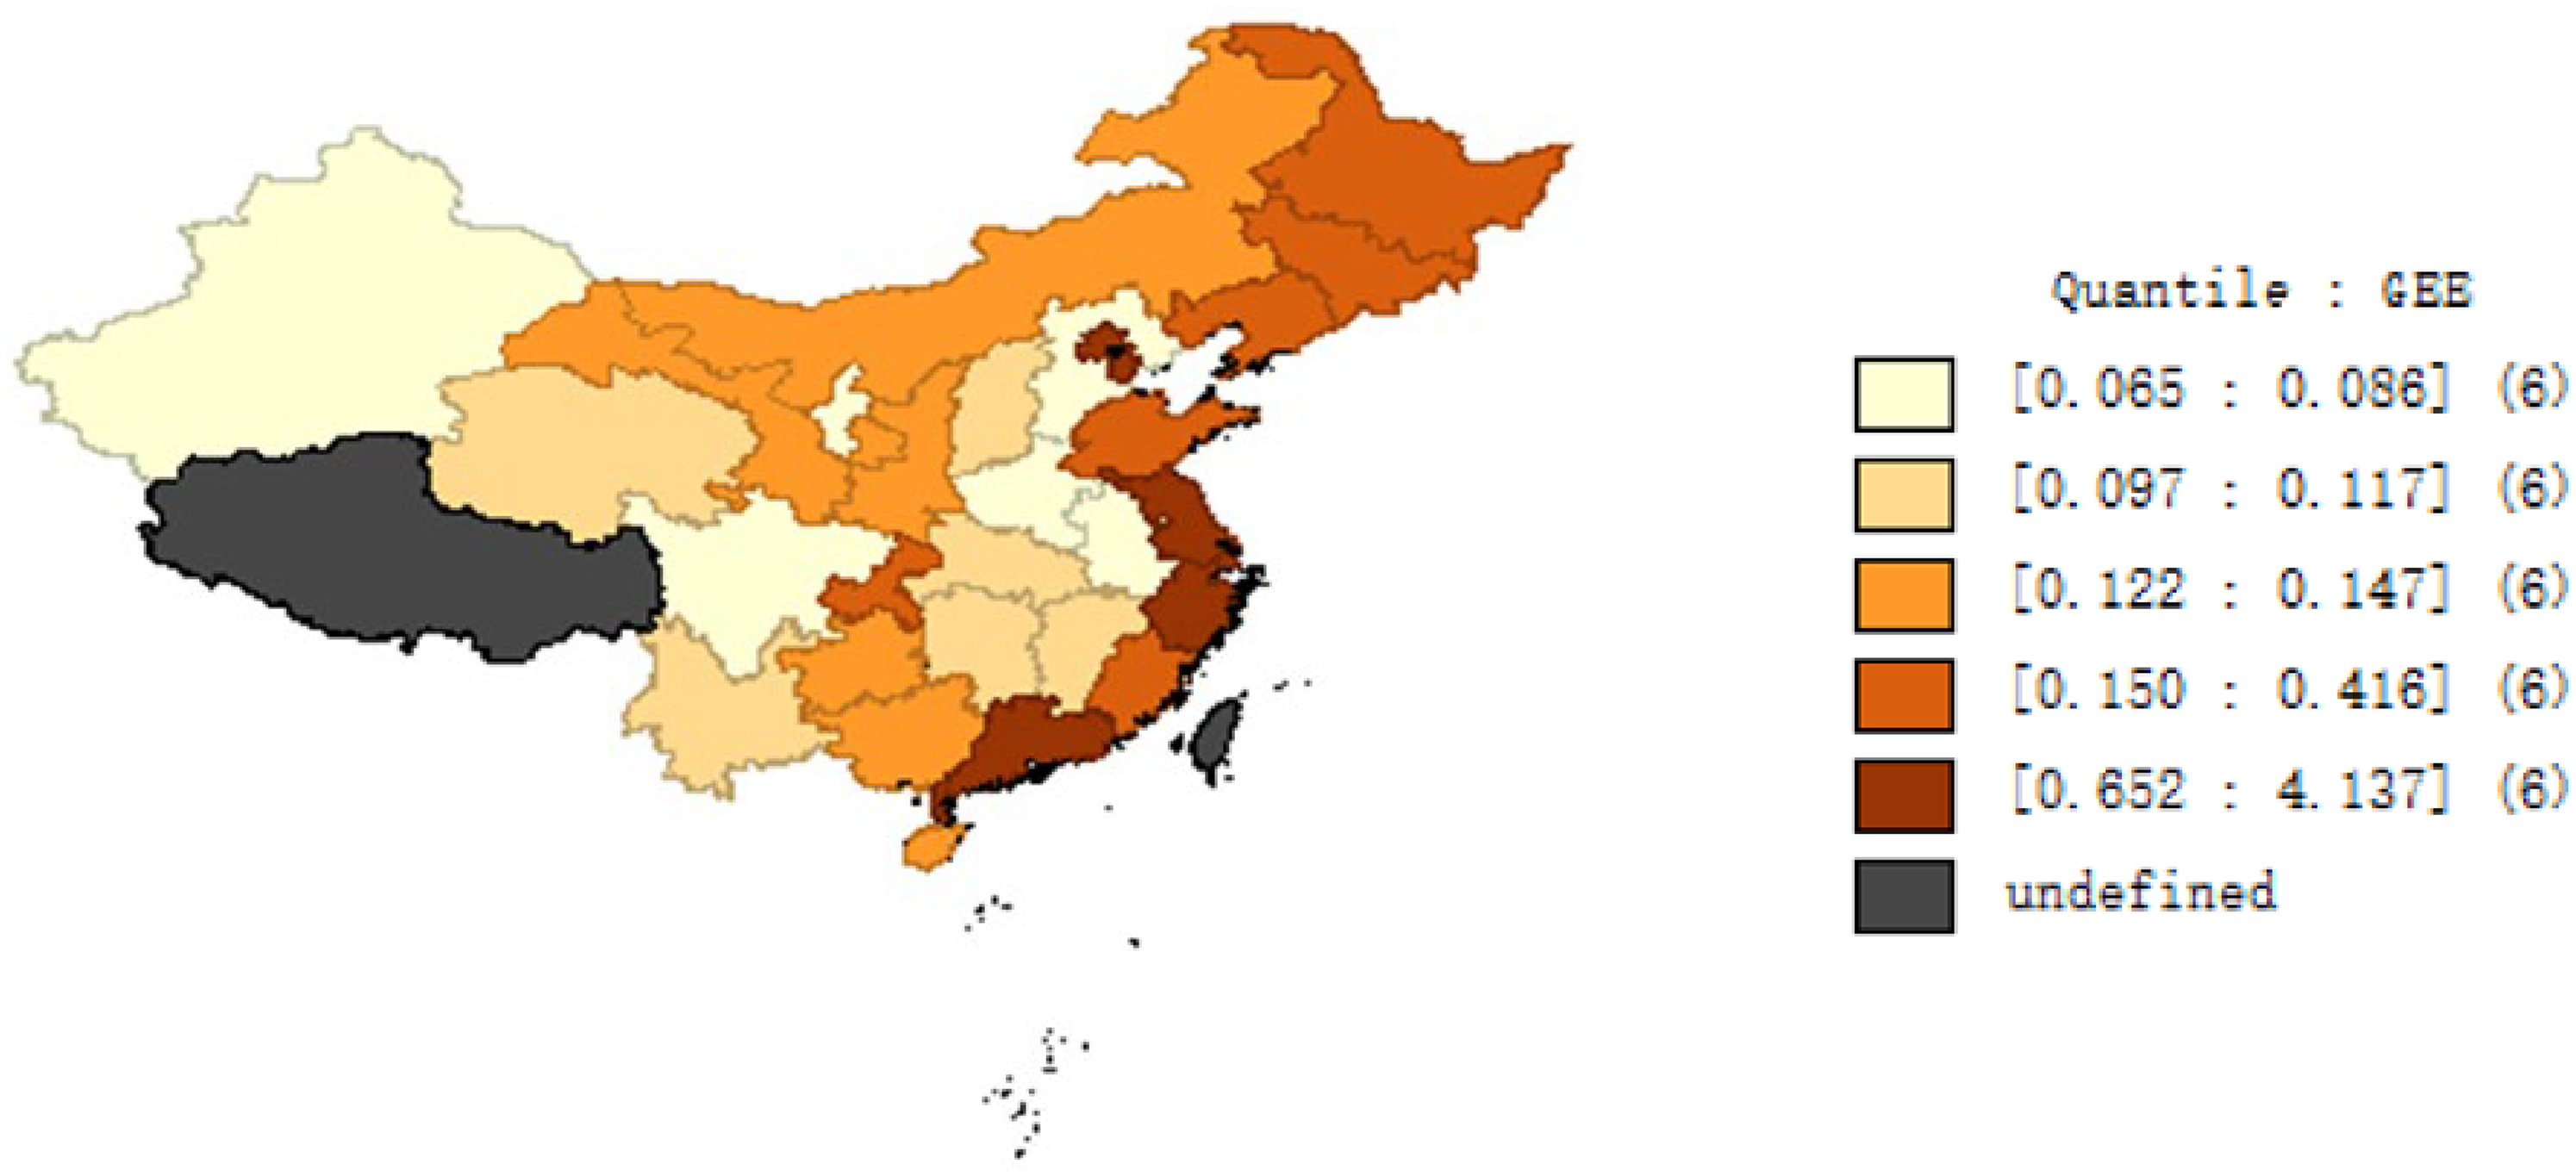
Spatial differentiation of regional green energy efficiency in China.
The assessing results of green energy efficiency.
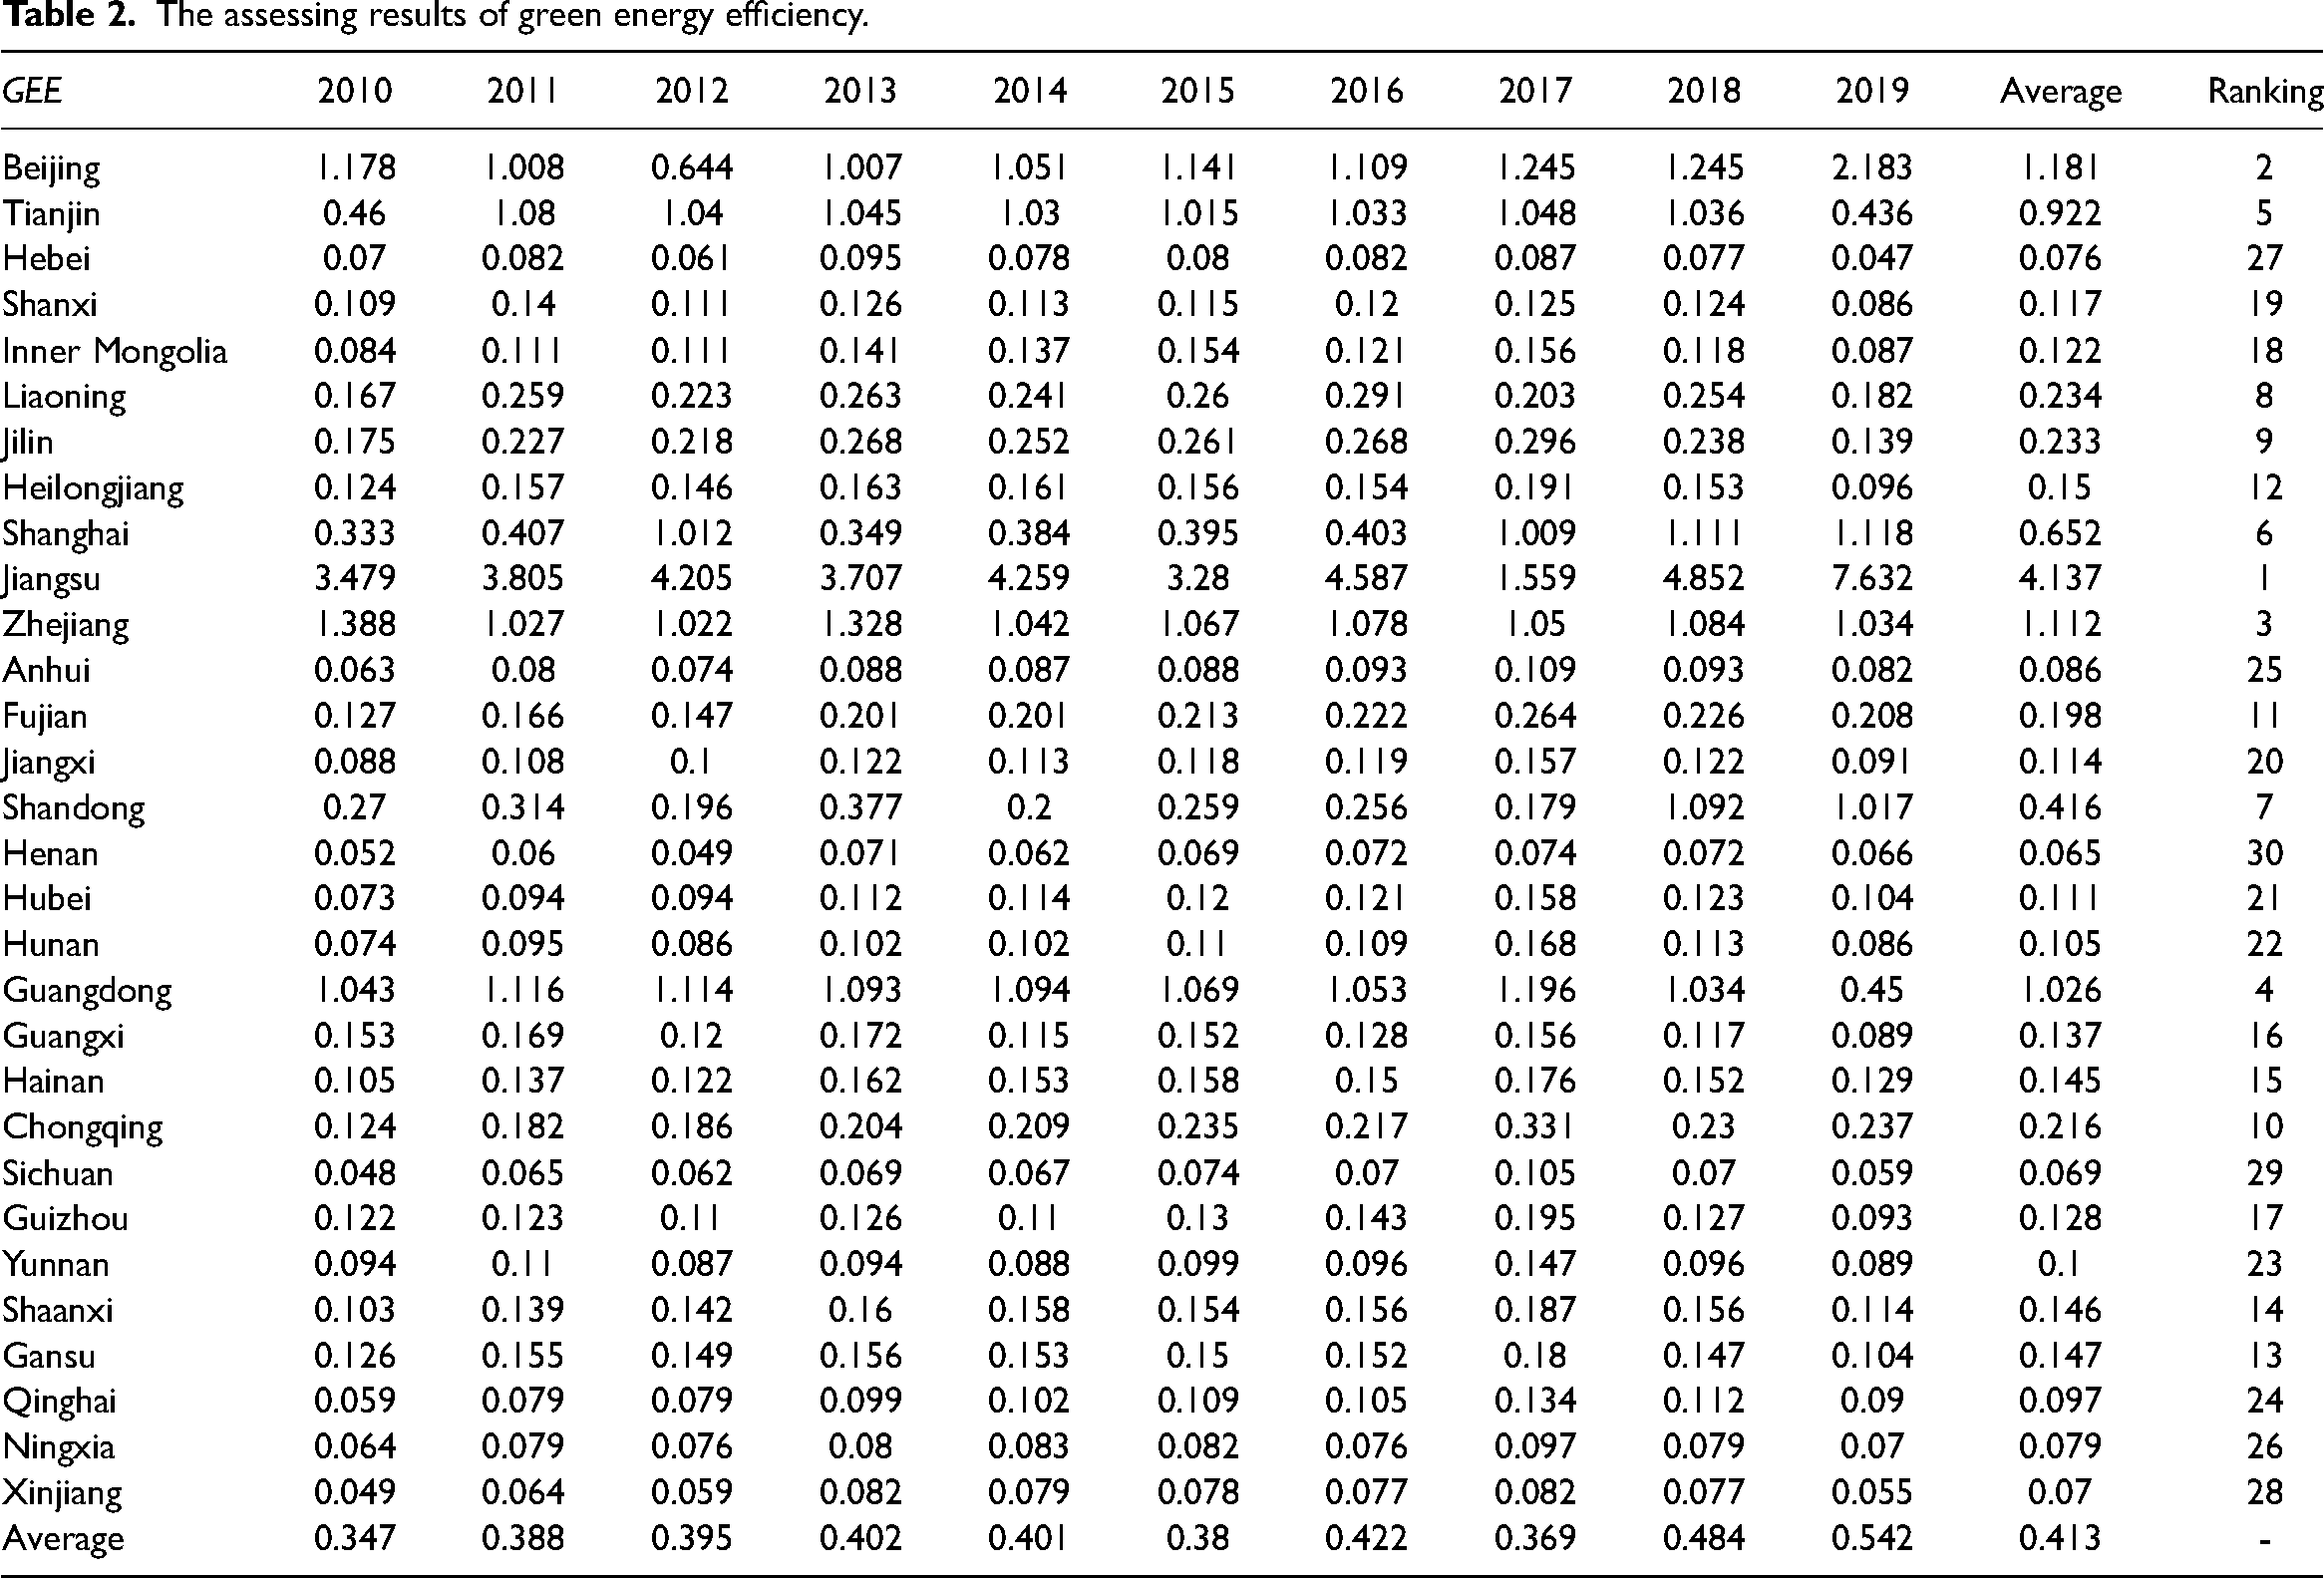
At the national level, the average number for green energy efficiency in China from 2010 to 2019 was 0.413, which means that the overall performance was poor. However, the average efficiency value increased from 0.347 in 2010 to 0.542 in 2019. Although there were many fluctuations during that period, the overall efficiency value was significantly improved. The results were generally in accordance with China's development situation. In recent years, the Chinese government has accelerated the implementation of energy conservation and emission reduction policies and achieved remarkable results. During this period, the country effectively implemented energy conservation and emission reduction by strengthening constraints, promoting transformation, controlling increments, optimizing the stock system, and promoting innovation, 45 thereby promoting green energy efficiency.
According to the average efficiency values of different provinces, Jiangsu (4.137), Beijing (1.181), Zhejiang (1.112) and Guangdong (1.026) were the four provinces with the best performance (their efficiency values are all greater than 1). Tianjin (0.922) was the only province that had an efficiency value between 0.9 and 1. No province had an efficiency value between 0.7 and 0.8, and only Shanghai’s efficiency value (0.652) was between 0.6 and 0.7. The above province number was six, which means that only one-fifth of the 30 provinces were above 0.6, and the other four-fifths all had poor performance. It is particularly worth noting that the performance of Shanghai, China's most developed city, has been disappointing.
The worst-performing provinces (all with efficiency values less than 0.1) were Qinghai (0.097), Anhui (0.086), Ningxia (0.079), Hebei (0.076), Xinjiang (0.07), Sichuan (0.069) and Henan (0.065). These are all important manufacturing provinces in China. The poor efficiency performance of these manufacturing provinces means that China's industrial development was based on energy and the environment. From the perspective of space (which can be seen from Figure 1), most provinces with better efficiency values were located in developed regions in the southeast coast, while most provinces with poor performance were located in less developed regions in the inland area, which shows that the performance of regional green energy efficiency was significantly correlated with the level of regional economic development.
Dynamic evolution analysis of green energy efficiency
In this study, the dynamic evolution and trend of China's industrial green energy efficiency is portrayed through the nonparametric estimation method -- kernel density analysis. The basic principle is to suppose the probability density estimation formula f(x) of the variable X at point x is as follows:
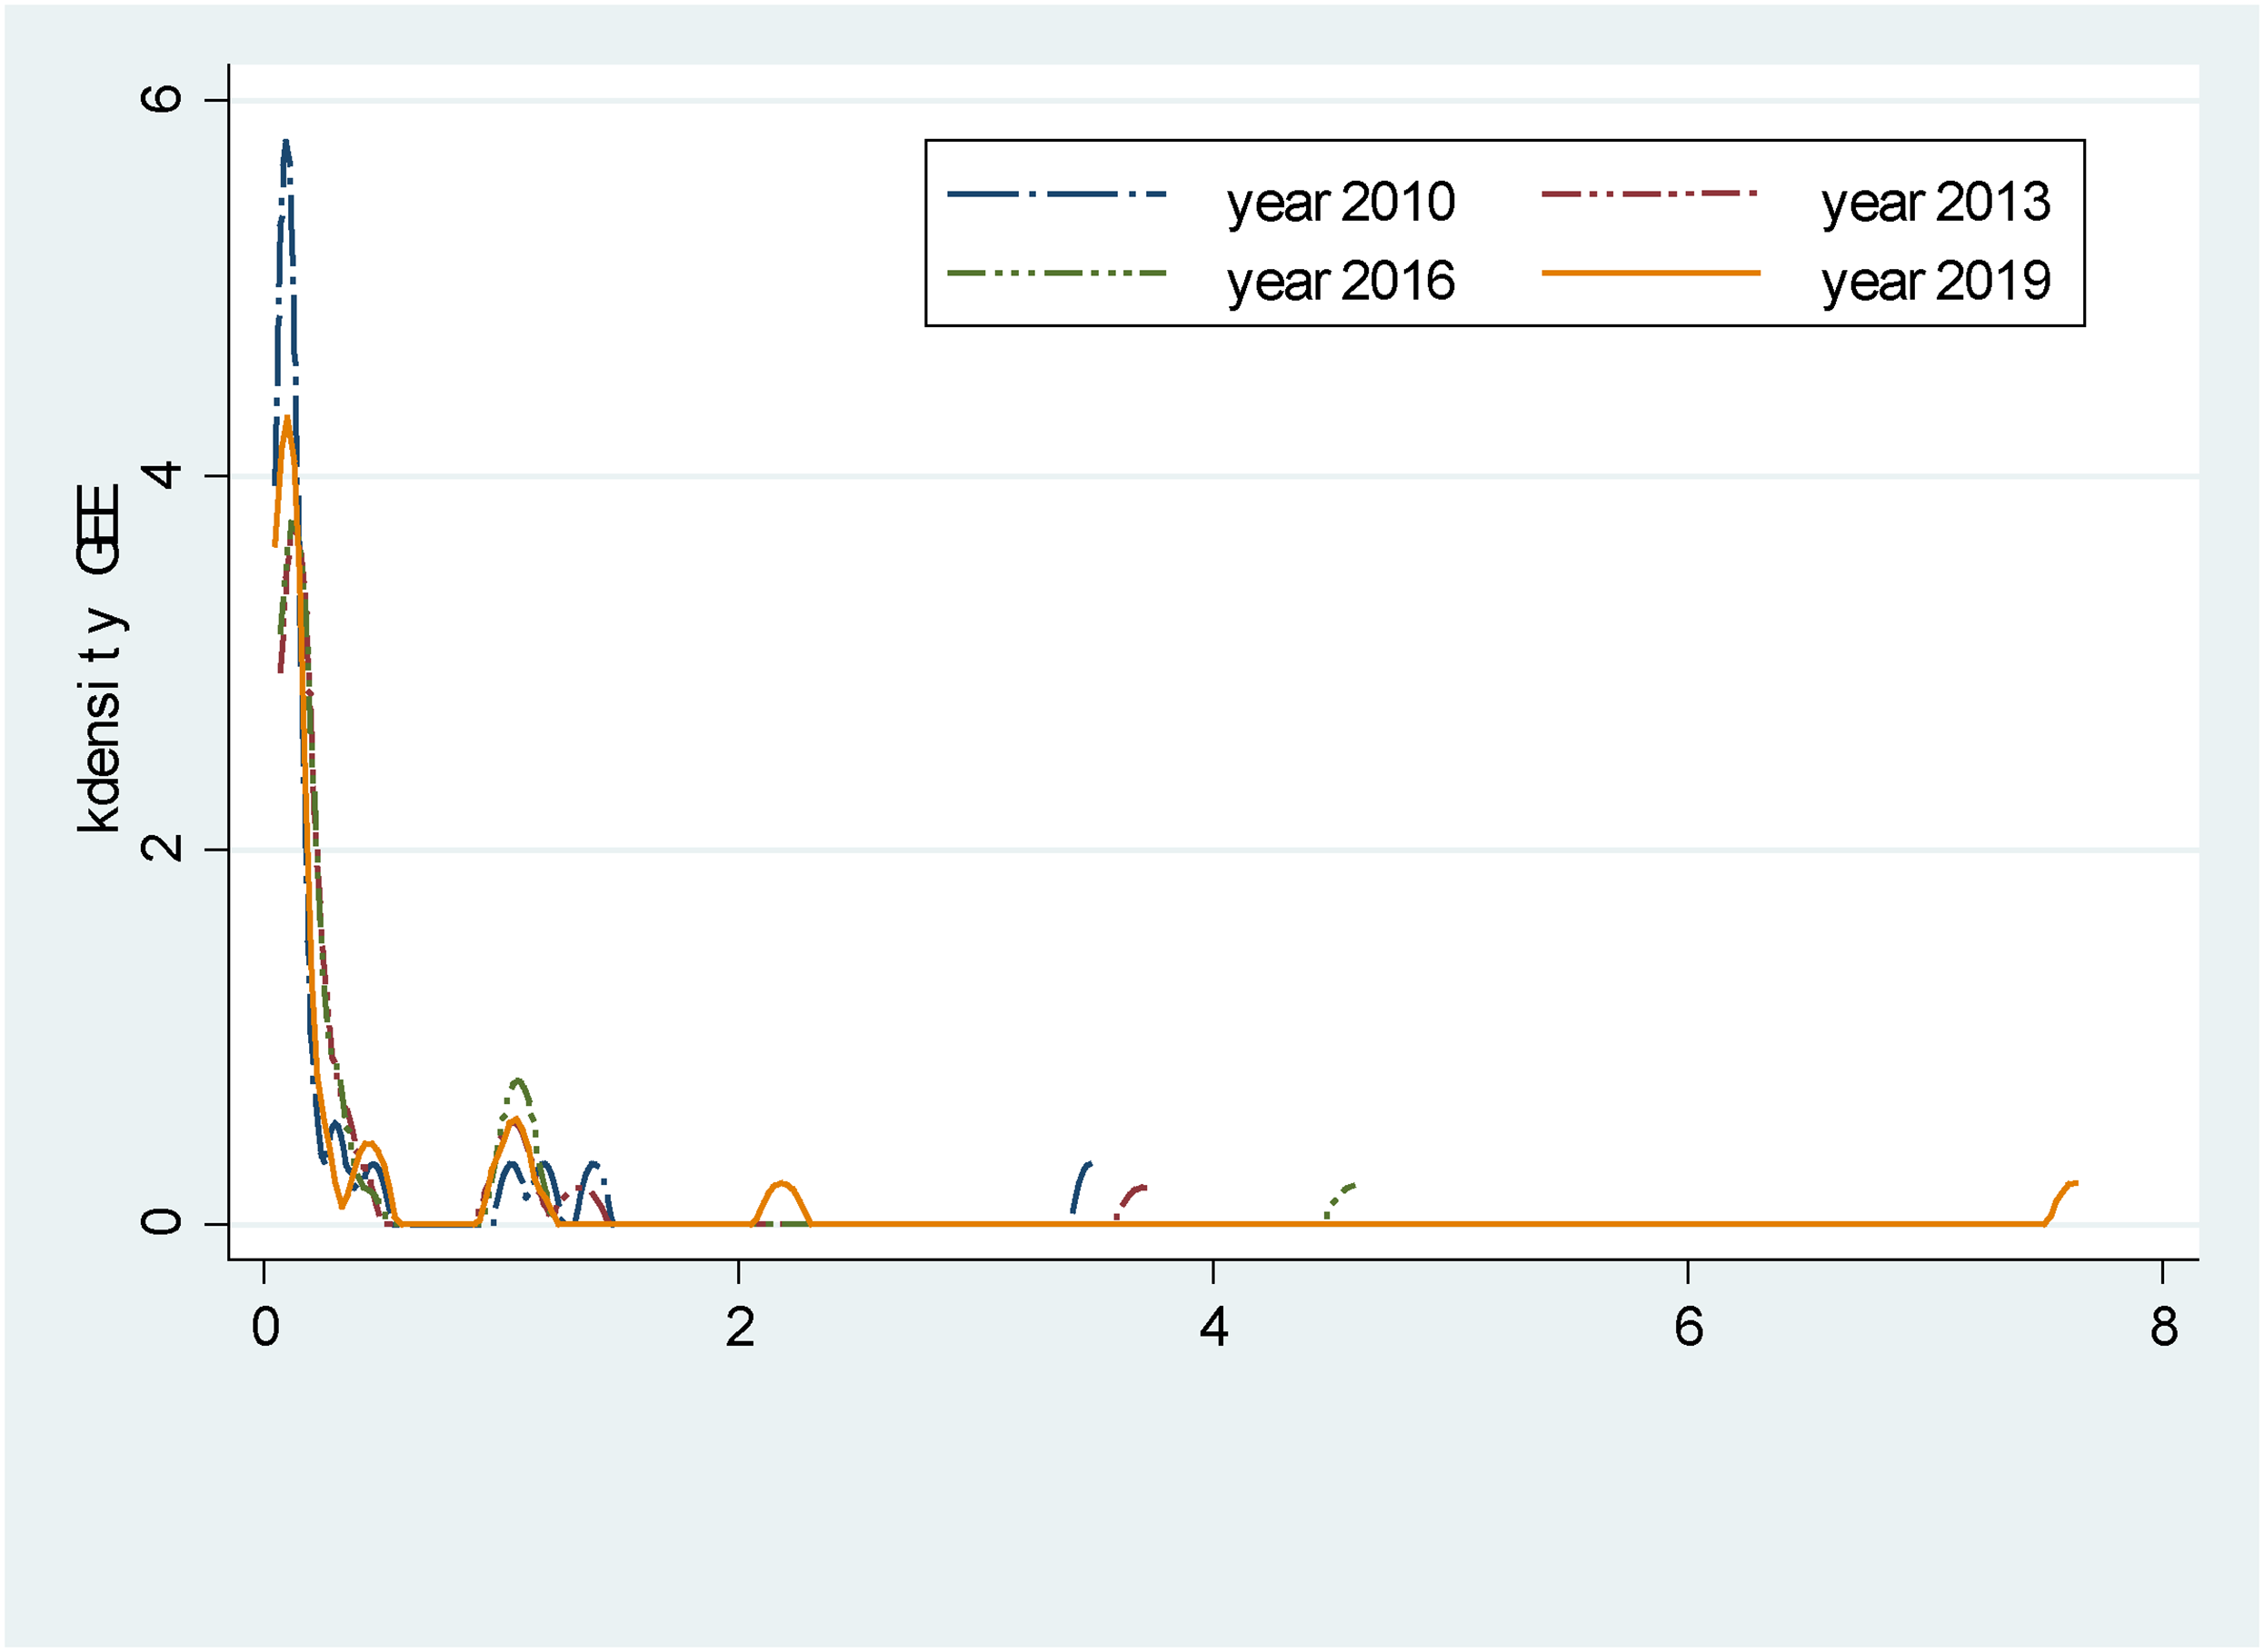
Kernel density diagram of industrial green energy efficiency.
From Figure 2, the dynamic evolution of China's industrial green energy efficiency distribution presents two features. First, the distribution peak of China's industrial green energy efficiency did not change much from 2010 to 2019, indicating that the improvement of green energy efficiency in most Chinese provinces was limited during this period. Second, the value of industrial green energy efficiency in the four years all belonged to the “twin peaks” type, and the width between the two peaks did not change noticeably. The values of the two equilibrium points were near 0.1 and 1, which means that China's industrial green energy efficiency presented an obvious polarization phenomenon, and the gap between provinces has not narrowed. In addition, from the figure above, the wave peak near 0.1 was significantly higher than that near 1, indicating that there were significantly more provinces with low efficiency than with high efficiency. In addition, it is worth mentioning that the kurtosis of the two peaks of 2019 was significantly lower than the crest of the other three years and appears to have a small crest near 2.1, which indicates that in 2019, the low values of the data series were relatively few, the polarization phenomenon was relatively slow, and there were more efficient values. This result indicates that the energy efficiency of 2019 has significantly improved compared with previous years.
Global spatial autocorrelation analysis of green energy efficiency
Global spatial autocorrelation analysis primarily studies the overall spatial distribution of the object through its location and performance in the whole space. Scholars often use global Moran's I to express this, and the value range is [-1, 1]. Generally, when the significance level is certain, if Moran's I value is greater than 0, it indicates that units with similar green innovation efficiency show agglomeration, and the larger the value is, the higher the agglomeration degree is. If Moran's I value is less than 0, it indicates that the units with similar green innovation efficiency show dispersion, and the smaller the value is, the higher the dispersion degree is. If Moran's I value is equal to 0, it indicates that units with similar green innovation efficiency present a completely uniform distribution, and there is no spatial correlation at all, which only exists in theoretical assumptions. In practice, the closer the Moran's I value is to 0, the more uniform the distribution and the weaker the spatial correlation. The test results of the global spatial autocorrelation analysis of the green energy efficiency of provinces and cities in China are shown in Table 3.
Spatial autocorrelation test of the dynamic panel model.
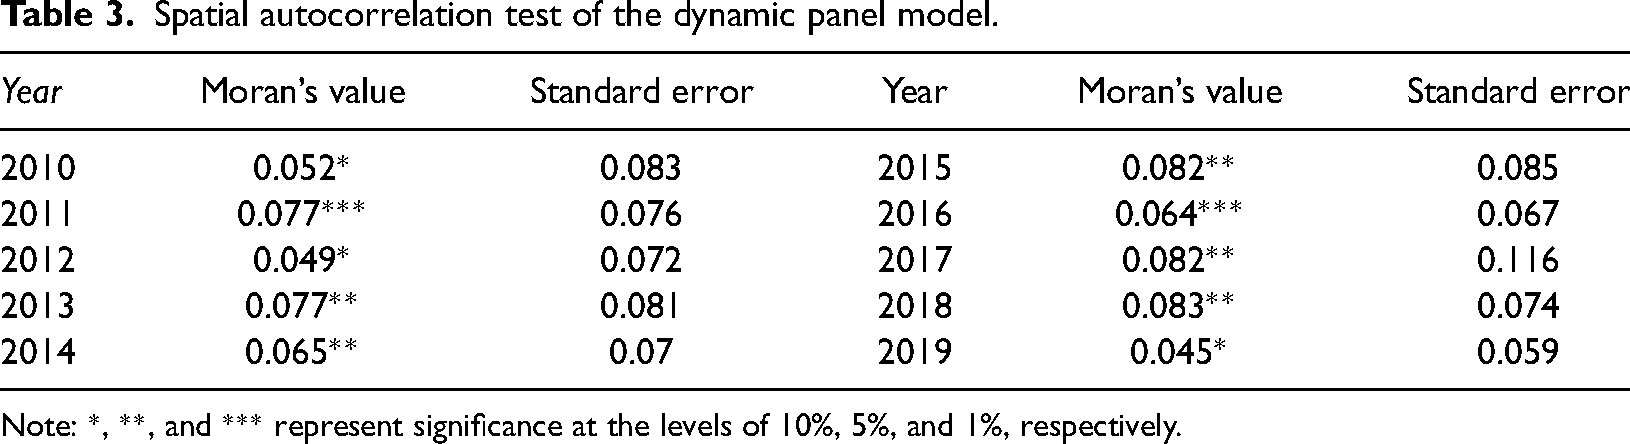
Note: *, **, and *** represent significance at the levels of 10%, 5%, and 1%, respectively.
From Table 3, the green energy efficiency of all provinces and cities in China has an obvious positive spatial agglomeration phenomenon, which is significant at the 10% level. This means that the spatial distribution of the energy efficiency of provinces and cities in China does not show a completely random state but a spatial agglomeration between similar values, that is, regions with higher efficiency are adjacent to each other, and regions with lower efficiency are the same. Therefore, China's energy efficiency research cannot ignore the factor of the objective existence of “economy - geographical” spatial distribution. The spatial econometric analysis method for China's energy efficiency research can consider the spatial effect, namely, spatial dependence and heterogeneity. Therefore, using the spatial econometric model to research China's energy efficiency was inevitable.
Spatial economic analysis of the impact of eco-environmental regulation on energy efficiency in China
Research method selection
The theory of spatial economics is based on the first law of geography, that is, a certain economic geographical phenomenon or an attribute value in a spatial unit of a region is related to the neighbouring region.
7
The spatial lag model (SLM), spatial error model (SEM) and spatial Durbin model (SDM) can be used to show the spatial effects of spatial correlation.
46
Among these models, the spatial Durbin economic model considers the spatial correlation of not only dependent variables but also independent variables. The dependent variables are affected not only by the independent variables of the local region but also by lagged independent and dependent variables of other regions. Therefore, to test the impact of eco-environmental regulation on energy efficiency and the spatial spillover effect in various regions of China more scientifically, this study uses the spatial Durbin measurement model. The formula is as follows:
Next, we introduce the establishment of the spatial weight matrix. Research on the spatial dependence or autocorrelation of green energy efficiency among provinces and cities in China is based on the geographical distance and adjacency relationship. The adjacency relationship is generally expressed by 0 and 1. If the number is 0, locations are not adjacent, and 1 indicates that they are adjacent. This assumption ignores the effect of actual geographical distance between regions. Therefore, scientists have also developed a spatial adjacency relationship based on the distance function. Under this definition, the spatial weight matrix is defined such that the influence of the two provinces is greater when the spatial distance between them is closer, while the influence is smaller when the distance is greater. The elements of the spatial weight matrix based on the distance function are defined as follows: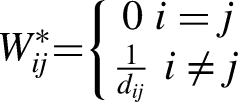
Empirical analysis
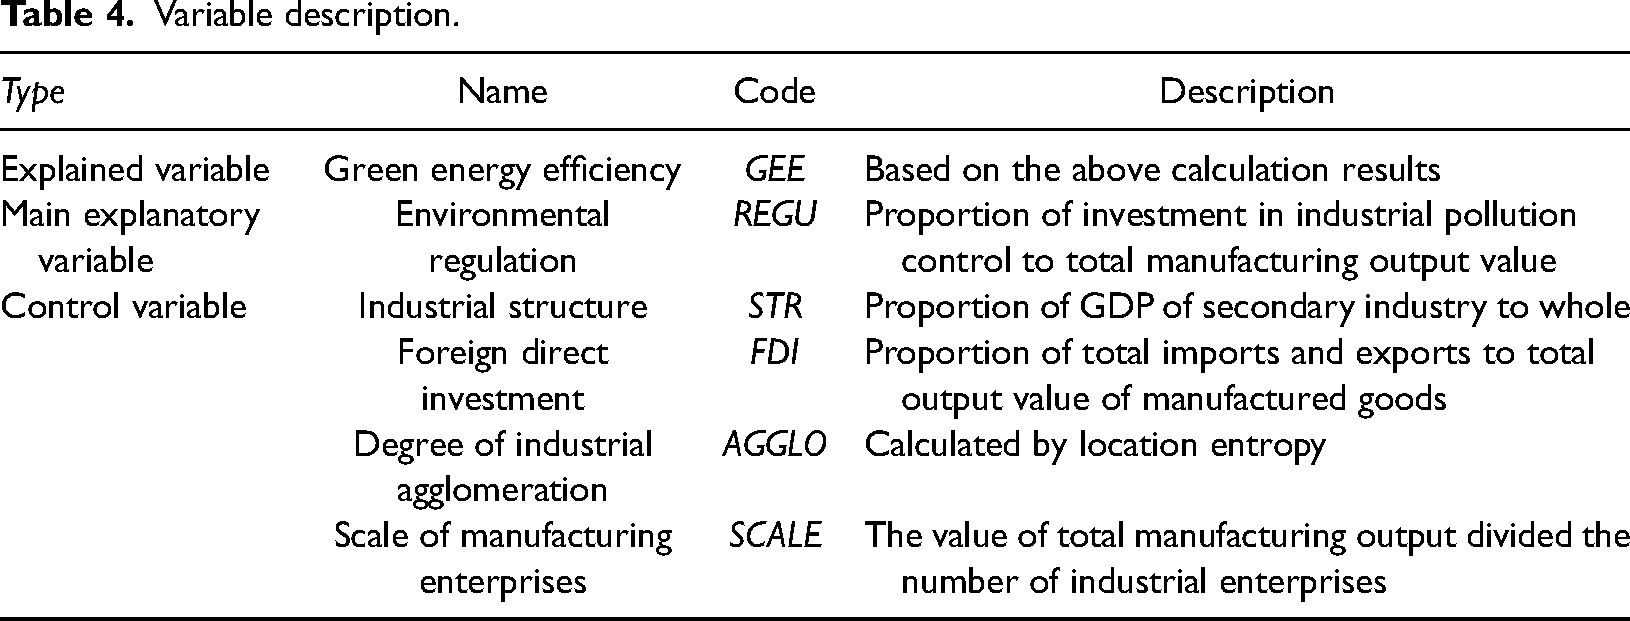
Based on the understanding of green energy efficiency and referencing the previous literature, we believe that the main factors affecting regional green energy efficiency include industrial structure and concentration degree, foreign direct investment, and manufacturing scale, in addition to environmental regulation (see Table 4).
Variable description.
According to the above table, the spatial Durbin dynamic panel model of influencing factors of green energy efficiency is constructed in this paper as follows: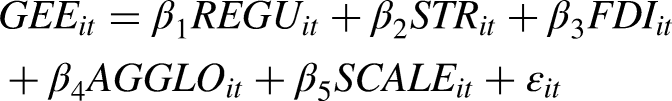
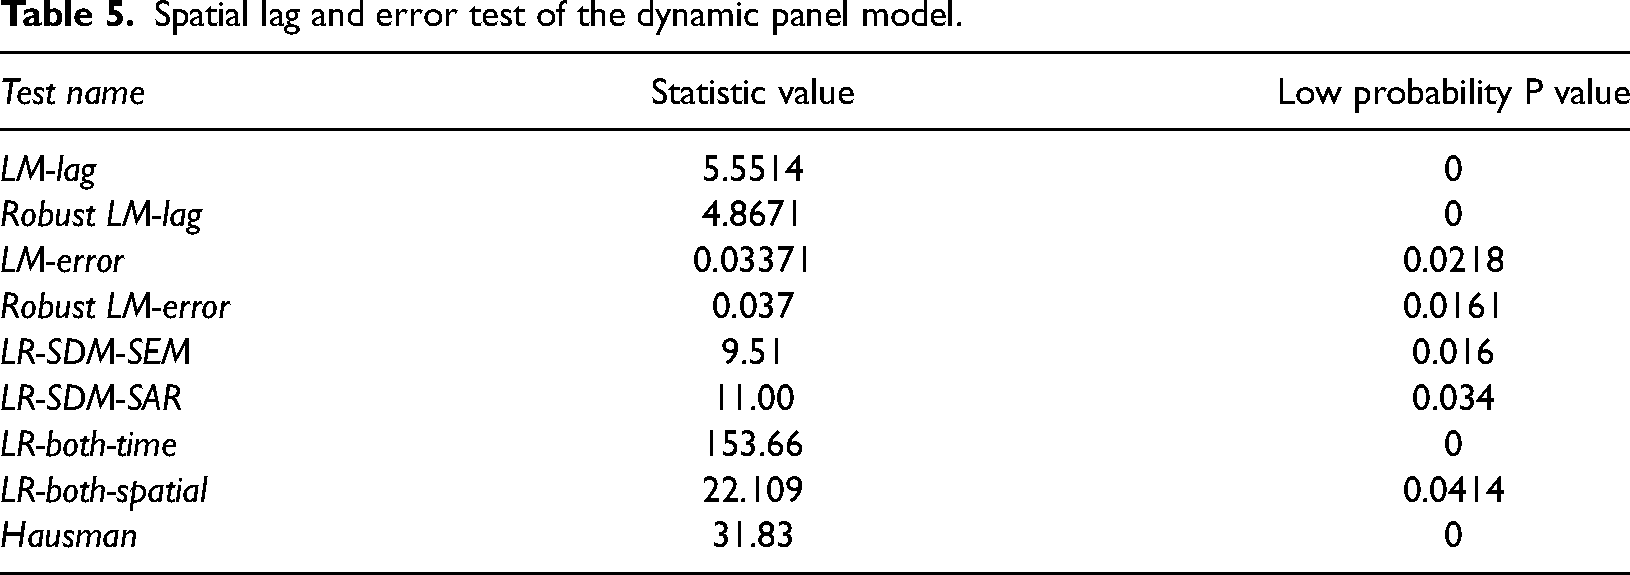
The global Moran's I test showed that China's green energy efficiency had spatial correlation. Therefore, this paper adopts the method of spatial economics to test the relationship between the two. In addition, the following tests need to be done before determining the model. First, the autocorrelation results of the regression of the ordinary panel data model (OLS) showed that the p statistics of LM lag, robust LM lag, LM error and robust LM error all rejected the null hypothesis under the 5% assumption, which further supported the reasonable construction of the spatial econometric model. Second, through the LR likelihood ratio test, it was found that all variables passed the significance test under 5%, which means that the statistics of the spatial Durbin model (SDM) were more suitable than those of the spatial lag model (SLM) and spatial error model (SEM), and individual effects and time effects exist Finally, the Hausman test showed that the fixed-effect model was better than the random effect model. In summary, the spatial Durbin model with bidirectional fixed effects was selected to study the spatial effect. The results of the inspection process are shown in Table 5.
Spatial lag and error test of the dynamic panel model.
Then, based on the spatial Durbin model, this study uses the maximum likelihood method to estimate the impact of eco-environmental constraints on energy efficiency in China during 2010–2019. The estimated results are shown in Table 6.
SDM estimation results of spatial panel data.
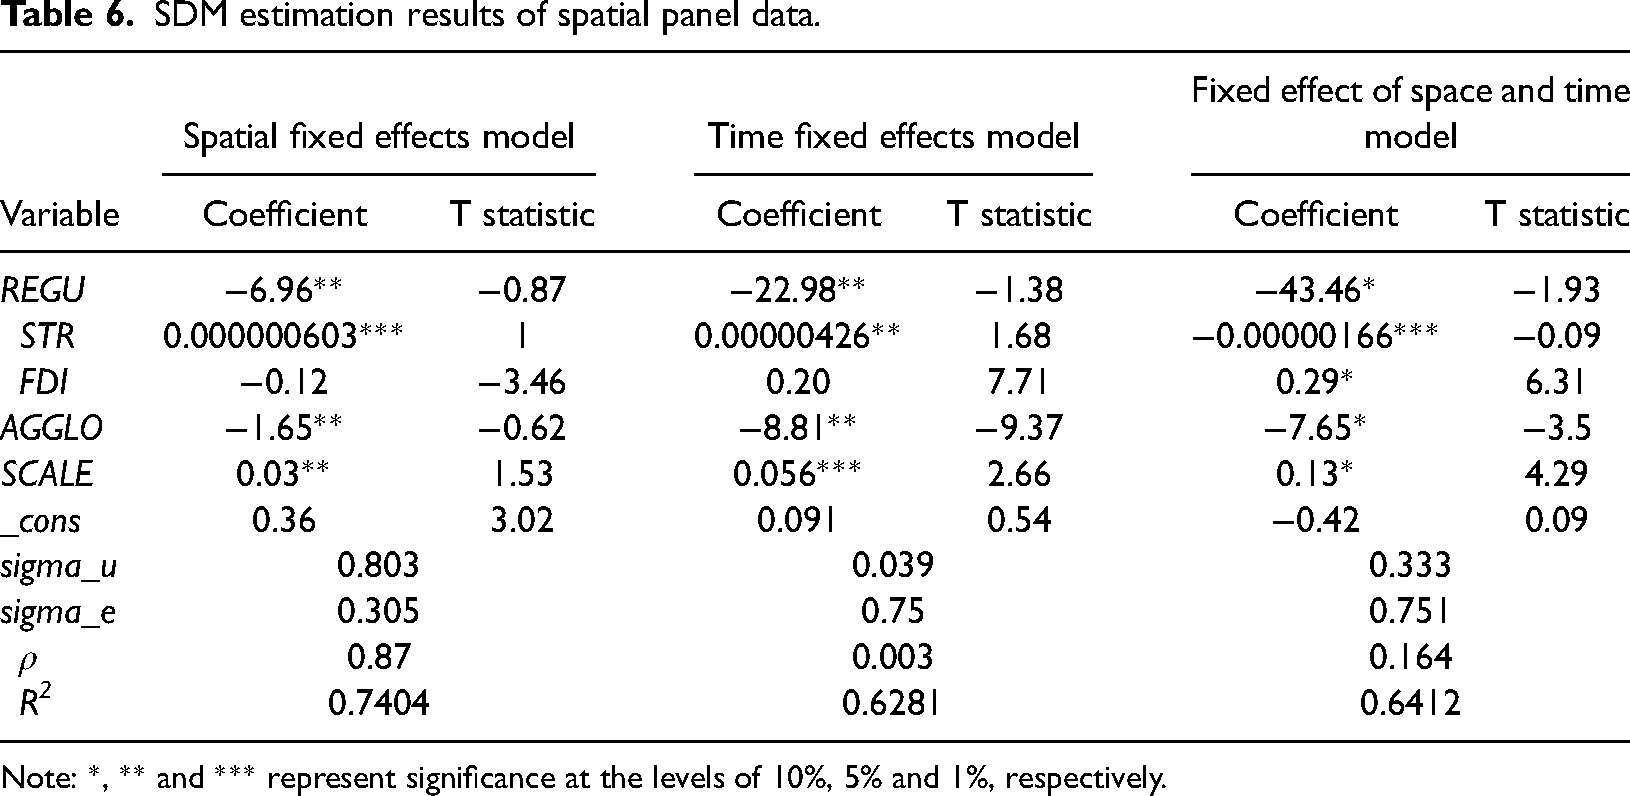
Note: *, ** and *** represent significance at the levels of 10%, 5% and 1%, respectively.
From Table 6, SDM coefficients (
The estimated results of the Durbin spatial fixed effect in Table 6 show that the coefficient of eco-environmental regulation (REGU) was negative and passes the significance level test of 5%, indicating that eco-environmental constraints were not conducive to the improvement of regional green energy efficiency, which further means that the compliance cost effect of China's current environmental regulations was greater than the innovation compensation effect of industrial energy enterprises. Therefore, government environmental regulations reduced the productivity and profitability of enterprises. From the perspective of total factor production, enterprise energy efficiency declined. Therefore, improving energy efficiency and reducing environmental pollution are dilemmas for China's future development.
The coefficients of industrial structure (STR) and manufacturing enterprise scale (SCALE) were both positive, indicating that they have positive effects on green energy efficiency. The reason may be that with the increase of the industry proportion and enterprise scale, some important elements like capital, labour, energy and others can be better coordinated. In particular, the potential of machinery and equipment has been further developed, which has led to increasing returns to scale and energy intensification, and energy efficiency has been improved.
The coefficients of foreign direct investment (FDI) and industrial spatial agglomeration (AGGLO) were negative, indicating that they had a negative effect on green energy efficiency. The former proved the existence of the “pollution haven” phenomenon in China, in which economically less developed areas often choose loose environmental regulation, creating a comparative advantage in energy trade products and promoting high pollution industries to use relatively low environmental control technology for production to save costs, which further drives high pollution industry to accumulate in the less developed areas. This trend shows that vicious competition among local governments in China for liquid resources comes at the expense of energy efficiency and environmental deregulation, which is alarming. The latter indicates that the agglomeration of industrial enterprises does not help energy conservation and emission reduction. It can be hypothesized that faced with drastic competition, local governments in China attract enterprises to form neck-deep industrial agglomerations by administrative measures to pursue “policy rent”. In addition, clustered enterprises tend to pursue economic benefits rather than environmental benefits, which leads to more repetitive construction and low-level capacity expansion and results in increased energy consumption and a decline in efficiency. In addition, we believe that China's low-level industrial agglomeration does not produce a good technology spillover effect, leading to agglomeration that cannot be good for energy efficiency.
In the nonspatial econometric model, the regression coefficient of the explanatory variable indicates its influence on the explained variable. However, in the spatial econometric model, the regression coefficient of the explanatory variable includes not only direct influence but also indirect influence (namely, the spillover effect). The impacts were decomposed based on the SDM partial differential method (Table 7). The total effects can be divided into two parts. The first is the direct effect, namely, the local effect, which represents the impacts of explanatory variables in the region on its own green energy efficiency. The second is the indirect effect, also named the spillover effect, which represents the influence of explanatory variables in this region on green energy efficiency in adjacent regions.
Direct and indirect (spillover) effects of SDM results.
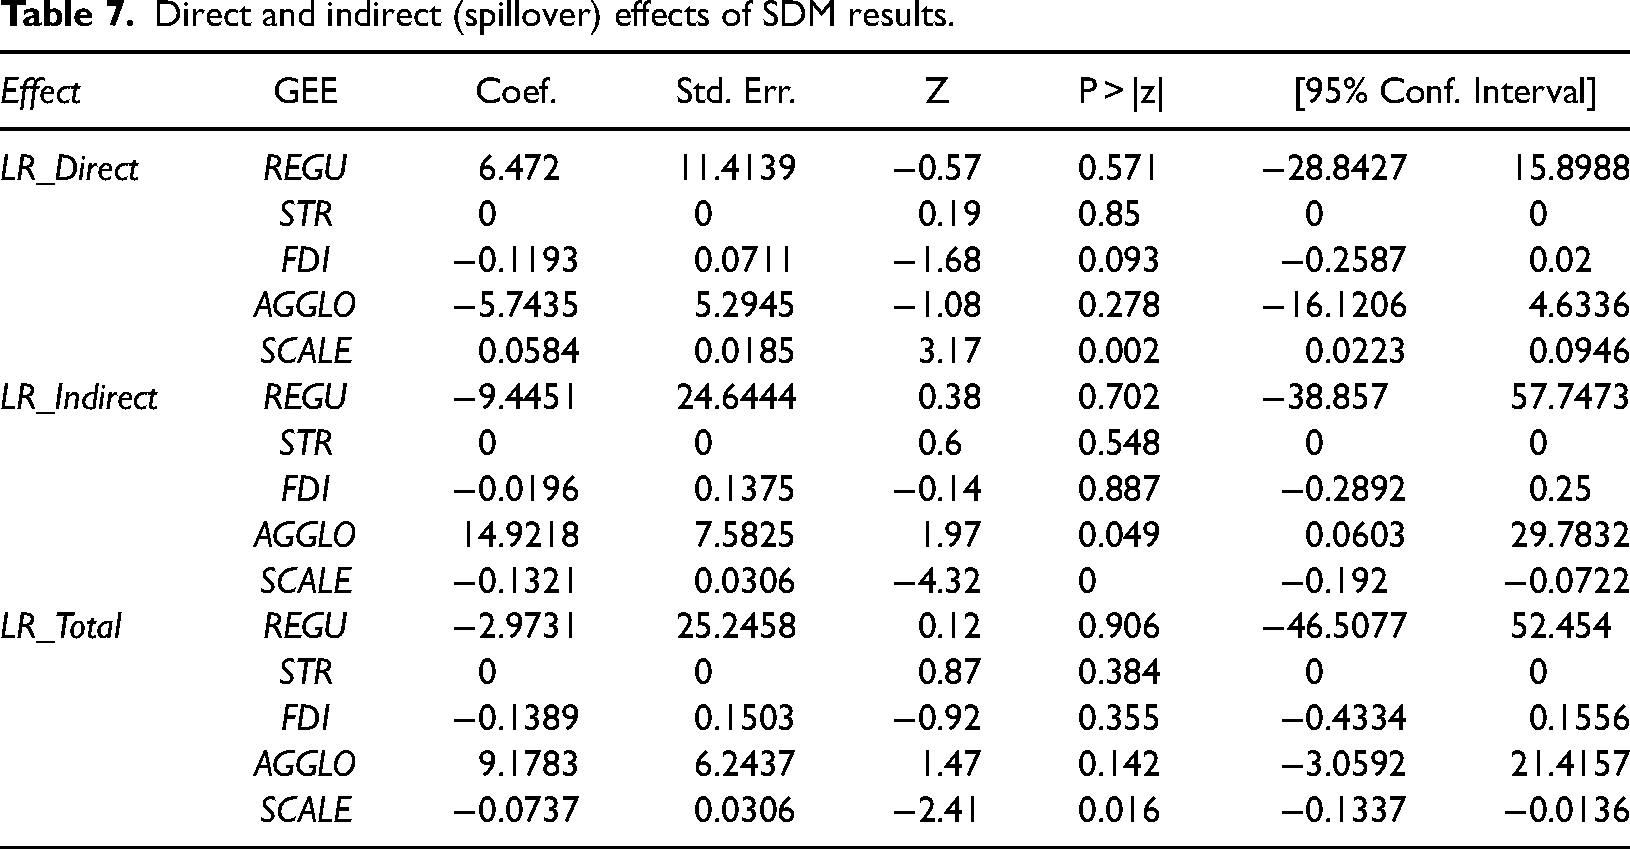
The following observations can be made according to the decomposition results in Table 7. ① The impact benefit of environmental regulation (REGU) on local areas was 6.472, the spillover effect on adjacent areas was − 9.4451, and the total effect was − 2.9732. These results show that the strengthening of environmental regulation was beneficial to the improvement of green energy efficiency in the region but leads to a decline in neighbouring places to a greater extent, resulting in a negative overall effect, which shows that the strengthening of local environmental constraints will force local governments and enterprises to strengthen regulations, forcing enterprises to produce in a cleaner way and leading to the improvement of green energy efficiency in the region. However, such changes also lead to the flow of local enterprises with high pollution and consumption to the surrounding areas, resulting in the decline of green energy efficiency in those areas. According to the regression results, the negative indirect effect (spillover effect) was much larger than the positive direct effect, which is worth the Chinese government's attention. For the Chinese government, future development requires better regional coordination and planning. ② The direct influence, indirect influence and total influence of the industrial structure (STR) were all 0. In fact, it can be seen from the regression results in Table 5 that the coefficient value of this variable was very small. Therefore, the direct and indirect regression results of the SDM model were nearly 0. This result shows that the proportion of the secondary industry had a negligible impact on green energy efficiency because in China, all regions with large or small proportions of industry use the same industrial production technology and process, which is the embodiment of the standardization of China's industrial production. ③ The direct effect (-0.1193), indirect effect (-0.0196) and total effect (-0.1389) of foreign direct investment (FDI) were all less than 0, indicating that FDI had a negative impact on green energy efficiency. China was still at a low position in the international industrial chain, and the industry structure still belongs to traditional modes, which were characterized by high consumption and pollution. Foreign direct investment mainly invests in these low value-added primary and extensive industries, which leads to an increase in foreign direct investment but does not help to improve green energy efficiency. ④ The direct effect of the industrial agglomeration degree (AGGLO) was negative (-5.7435), but the indirect effect was positive and has a large coefficient value (14.9218). Therefore, the total effect was positive (9.1783), which indicates that the regional industry concentration had a negative effect on the local green energy efficiency value but a positive impact on surrounding areas. This result shows that there was a phenomenon of “low-level agglomeration” in China's industrial layout. Currently, traditional industries account for too much of China's overall industrial layout, while the new manufacturing industry has not been developed sufficiently due to its late start. Most of the products of traditional industries had low technological content and added value. They were generally at the “middle and low section” of the value chain and were mainly engaged in original equipment manufacture or the production of spare parts and peripheral components. Without independent technology and management skills, they could only rely on resource consumption and ecological destruction to survive. In particular, the negative environmental externalities brought by the agglomeration of traditional manufacturing industries with high pollution, such as steel, building materials and the chemical industry, cover up the positive effect on ecological improvement, resulting in the status quo of “more agglomeration, more pollution” from industrial enterprises. ⑤ For manufacturing firm scale, the direct effect was positive (0.0584), the indirect effect was negative (-0.1321), and the total effect was negative (-0.0737). Generally, with an increase in company scale, the technical efficiency value can be improved by the economic scale effect to increase regional green energy efficiency but is not conducive to the surrounding areas, which also illustrates the urgent need for an overall regional plan in China.
Conclusions
(1) From 2010 to 2019, although China's green energy efficiency performance improved significantly, the overall situation was still relatively poor. The efficiency value has a great correlation with regional economic development. (2) Eco-environmental constraints, foreign direct investment and industrial agglomeration are not conducive to regional green energy efficiency improvement. Industrial structure and manufacturing enterprise scale have positive effects on efficiency. (3) The effect of government regulation caused by environmental constraints on green energy efficiency in local regions was positive, but the spillover effect on adjacent land was negative, and the total effect was negative. The three kinds of influence are 0 of industrial structure and less than 0 of foreign direct investment. The direct effect of industrial agglomeration was negative, but the indirect and total effects were positive. At the enterprise scale, the direct effect was positive, and the indirect effect and the total effect were negative.
Therefore, we make the following suggestions.
More effort should be made to develop energy conservation and emission reduction technologies to improve energy consumption efficiency. According to the calculation results of the DEA model, China's green energy efficiency value was generally low, and waste was a serious problem because China’s energy industry technological level was less developed.
5
Therefore, the Chinese government needs to encourage energy companies to optimize their structure through mergers and acquisitions and close outdated production capacity. That is, it must not only increase the development of related technologies, innovation and new products to strengthen the transformation and application of technological achievements but also weed out outdated production facilities such as power companies through mergers and reorganization. The limited energy resources can be used more scientifically and rationally. China must establish reasonable environmental regulation methods to promote enterprise production in a cleaner way. Intensifying the reversed transmission mechanism of the environment on energy efficiency, the economy and energy control will force enterprises to upgrade technology and transform the economic development mode. China should strengthen regional evaluation and assessment and make energy conservation and emission reduction targets more binding. In addition, environmental regulation policy formulation should pay more attention to applicability, take measures according to local conditions, and take full consideration of the local environmental carrying capacity and energy resource endowment to further improve policy effectiveness. Reasonable regional development plans should be formulated to promote the rational distribution and flow of the energy industry across regions. From the regression results of the SDM model, we concluded that most economic variables have obvious spillover effects, which requires the government to establish a reasonable cross-regional development plan. However, this is not a simple task. The cross-regional development mechanism of industrial synergy has an extremely strict logic mechanism and system coordination. A good, harmonious mechanism needs the government, enterprises and society to work closely together. However, the government is bound to play a leading role in formulating scientific regional and industrial development policies. Additionally, enterprises should strive to break regional barriers, exploit the market, seek cooperation, and enhance competition in cross-regional flow. Society should strengthen the construction of such a cross-regional development mechanism, reinforce road traffic and information exchange construction between regions, and create a good environment for enterprise flow.
Of course, there is further space for improvement in this article. Optimization and breakthrough can still be made in the index system design, so as to make the measurement and evaluation of green energy efficiency more scientific and reasonable. Although the index selected in this paper is representative, but the measured efficiency numbers cannot entirely represent the development status of green energy. In addition, in order to reflect the differences among regions and provinces of the whole country, the index with the greatest influence on each province was not differentiated, which may affect the objectivity of the results. Therefore, the design of the index system can be optimized in the future research.
Footnotes
Declaration of conflicting interests
The author(s) declared no potential conflicts of interest with respect to the research, authorship, and/or publication of this article.
Funding
The author(s) disclosed receipt of the following financial support for the research, authorship, and/or publication of this article: This work was supported by the National Natural Science Foundation of China (Grant No. 72171124; Grant No. 71771126), the General research projects of philosophy and Social Sciences in Colleges and Universities of Jiangsu Province (Grant No. 2021SJA0107) and Social Science Research Foundation of Nanjing University of Posts and Telecommunications (Grant No. NYY220006).