
Abstract
Due to the intermittency of renewable energies, their acceptances in electricity market are lower than fossil energies. Therefore, it is necessary to overcome the development resistance through portfolio re-equilibrium. Balance supply and demand in markets involving different stakeholders to optimize return on investment. Compared with the past, this paper proposes an integrated optimization with combined meta-heuristic for wind-solar-hydro system. It investigates to coordinate the interactions of power stations and power grid with their internal conflicts respectively. Specifically, the investment profit, the investment volume and the investment risk are considered as the optimized objectives for wind-solar-hydro system. However, power grid takes operation efficiency, surplus electricity and carbon emissions into account to be the optimal objectives. They are composed to establish a bi-level programming model. Moreover, an improved particle swarm optimization is utilized to deal with the problem-orientated model with NP-hard complexity. Finally, to verify the feasibility of the proposed model, a case of wind-solar-hydro system from Panzhihua located in southwest China is conducted. The results showed that portfolio re-equilibrium strategies had the potential to push forward sustainable development. Secondly, generating capacity was positively affected by the initial investment volume. However, the investment profit did not absolutely rise with the grow of investment risk. Thirdly, profit-oriented strategies were conducive to carbon emissions reduction. But risk-oriented strategies can reduce surplus electricity and increase the stability of electricity purchase schemes.
Keywords
Introduction
The scarcity of fossil fuels and surge in carbon emissions have rouse increasing attentions to renewable energies (REs) in electricity power. In particular, multi-energy complementary systems, such as wind-solar-hydro system (WSHS), have attracted a lot of attention.1–5 According to the Renewables 2021 Global Status Report, REs reached a record share of the global electricity mix in 2020, around 29%. 6 However, China has been responsible for more than half of capacity additions in the growth of the global hydropower market. 6 Despite these advances, renewable energy power generation is still facing the challenge of achieving a larger share of global power generation. Especially in China, increasing the share of renewable energy and improving energy efficiency play an important role in decarbonizing the energy system around 2050 throughout the world. 7 As the world's largest CO2 emitter, China currently accounts for 30% of global emissions, and actively takes a series of measures to reduce carbon emissions, improve energy efficiency and optimize energy structure. 7 There is no doubt that China's reduction of carbon emissions and improvement of energy utilization play a pivotal role in global CO2 emissions reduction, particularly leading the global markets for wind power, concentrating solar thermal power, solar photovoltaic and hydropower. 6 Therefore, it is very important to realize the sustainable portfolio re-equilibrium on wind-solar-hydro system in China.
Numerous researches have shown that wind, solar and hydropower can effectively reduce carbon emissions.8–11 For instance, Yao et al. found that wind power played an important role in reducing carbon emissions in the power supply system. 8 It even had the lowest emissions of the SO2, CO2, CO and NOx and consumed the least energy. 9 Beltrami and Cui et al. demonstrated that wind power and solar power can reduce CO2 emissions and bring economic savings.10,11 These studies have sufficiently illustrated that renewable energy can provide much cleaner energy systems. However, it is well known that there is inherent intermittent nature in wind and solar energy. Therefore, it is necessary to carry out energy joint development to solve this problem.
Joint development of renewable energy is conducive to their complementary advantages.1,12–16 It can not only greatly improve the inherent intermittency nature of energy, 1 but also make full use of resources. For instance, Javed et al. pointed out that hybridization of pumped hydro storage with other storages is helpful to the reliability of REs. 16 Liu et al. proposed a multi-objective optimized wind thermal combined power generation system to improve wind power utilization, decrease carbon emissions and ensure power supply demand risk and profitability. 17 According to the existing researches, renewable energy portfolio can effectively address the problem of energy intermittency nature, and it reflects the complementary advantages of portfolio. But an effective portfolio way still needs to be found.
Portfolio approaches of developing and utilizing WSHS have been increasing in recent years.2–5 For example, to solve the uncertainties in the short-term optimal operation model, the probability density function was applied.2,3 And a parallel particle swarm optimization algorithm was developed to solve the stochastic peak shaving model. 4 As well as a day ahead peak shaving model was established with minimum residual load peak-valley difference. 5 In addition, some research modes and methods also have been proposed in other renewable energy combinations.18–20 Such as an optimal coordinated generation mode, 18 and a new chaotic sine-cosine approach. 19 As well as a robust operation interval was proposed to handle the uncertainties caused by emergencies. 20 These studies have solved the portfolio problem for investors to a certain extent. However, there are often multi-objective conflicts in hybrid REs.21,22 Such as Chu and Hawkes proposed an optimization model involving the objective of minimizing cost, residual load and portfolio output variability. 21 Moreover, it is necessary to match the power demand to reduce surplus electricity and resource waste. Greater efforts are still needed to realize the re-equilibrium considering the interaction between power stations and power grid.
In order to address WSHS sustainable portfolio re-equilibrium based on the supply-demand balance in electricity market, according to the above researches, this paper establishes an integrated optimization model with combined meta-heuristic. Specifically, the bi-level multi-objective model is proposed to solve how the power stations (i.e. WSHS) interacts with power grid in a hybrid uncertain environment and how their internal conflicts are coordinated. Secondly, this paper transforms fuzzy random variable to trapezoidal fuzzy variable to gradually reflect the decision maker's preference through three-stage interactions under optimism-pessimism perspective. Moreover, an improved particle swarm optimization (PSO) combined with chance constraint is utilized to deal with the problem-orientated model under NP-hard complexity. Finally, a real-life case of Panzhihua in China is conducted to verify the feasibility and effectiveness of the proposed algorithm, and some sustainable strategies of portfolio re-equilibrium are put forward. The main progresses and contributions are summarized as follows.
Providing a way to realize sustainable portfolio re-equilibrium on WSHS. Coordinating heterogeneous stakeholders to promote the supply-demand balancing in electricity market under the dominance of REs developers. Employing meta-heuristic approach involved with chance constraint to solve the bi-level multi-objective matter with NP-hard problem under hybrid uncertainty. Discovering the risk-oriented strategies of WSHS are conducive to decreasing surplus electricity and increasing the stability of power purchase schemes.
To make these progresses, the presentation of this paper is organized as follows: Section 2 describes the key problem of this paper. Section 3 establishes the integrated bi-level multi-objective optimization model under hybrid uncertain environment. Section 4 employs the improved particle swarm optimization combined with chance constraint. Section 5 presents a case to verify the feasibility and effectiveness of the proposed model, as well as comprehensive discussions are conducted. Finally, Section 6 summarizes the conclusion and gives some future study directions.
Key problem statement
Portfolio re-equilibrium problem
This paper introduces the sustainable portfolio re-equilibrium based an improved bi-level multi-objective programming. It fully coordinates the interest of WSHS and power grid, as well as internal multi-objective conflicts within different types of power stations or power grid. Before stating the proposed model, some energy backgrounds in China are given, as shown in Figure 1.
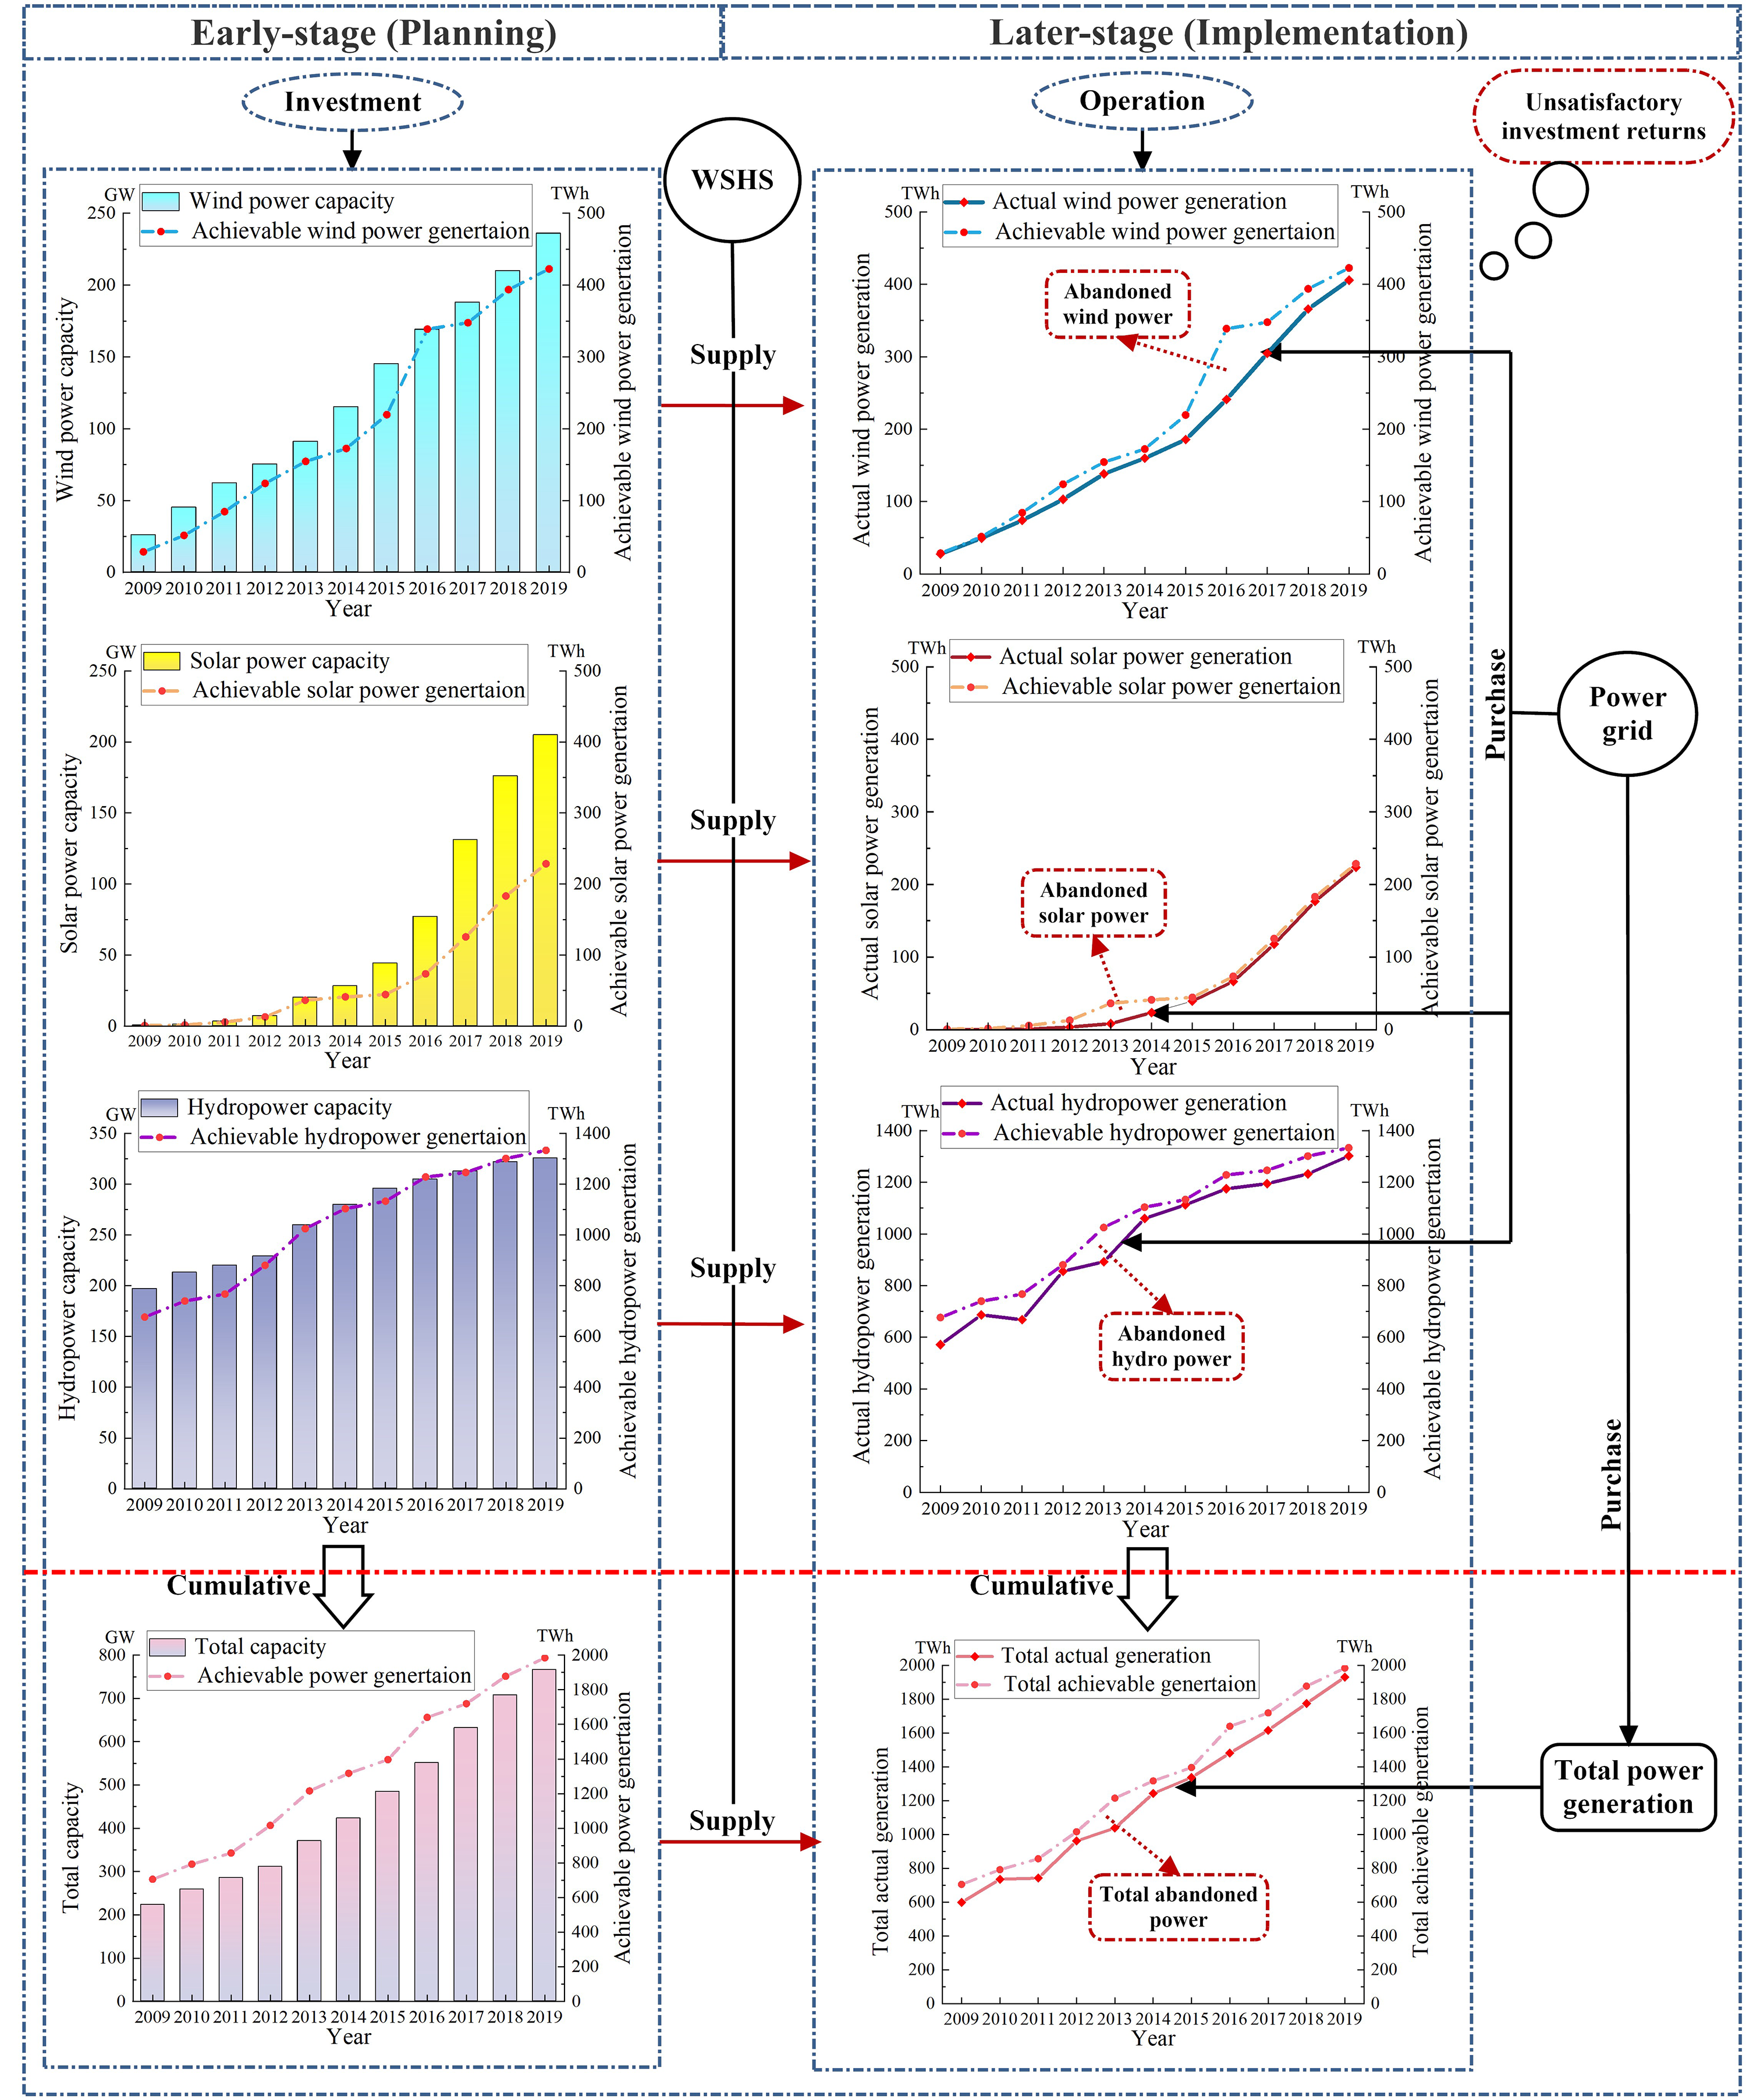
Problem framework of REs investment in China.
It is necessary to ensure the supply-demand balancing in electricity market for the portfolio re-equilibrium of WSHS. It is inclined to optimize the multi-energy complementary power system through research on supply and demand stage. 23 Such as a generic mixed integer linear programming was presented to determine the net economic position of each power utility and the optimal electricity generation mix of power stations. 24 And a multi-stage coordinated scheduling model was proposed to address the optimization problem of multiple-energy synergistic supply. 25 However, most studies were conducted from one aspect of supply or demand. To simultaneously consider the benefits of power stations and power grid have proven to be difficult. What is exciting is that the portfolio rebalancing in general equilibrium was presented. 26 As well as the multi-level programming model proposed by Bracken and Gill was proved effectively to solve the hierarchical decision problem. 27 Its prominent feature is that there is another optimization model under the constraints of one optimization model. 28 For example, a stochastic bi-level problem was introduced to study the interactions between power producers and wind generation portfolios. 29
WSHS's planning is key to portfolio re-equilibrium. Because dominant producers can make more aggressive exploit in power market. 30 Some researchers put forward energy portfolios basically have higher efficiencies than single-energy investment. 31 However, energy portfolios hide more uncertainties and risks. To address these problems, Baker et al. introduced robust portfolio decision analysis. 32 Botor and Hao et al. studied the impacts of policy tools on power plants and renewable power generation respectively.33,34 Thanks to developers have higher rights, that they decide the investment scale. Thus, WSHS is regarded as the dominant layer (i.e. upper layer) in this paper. Then, taking the operation profit, initial investment volume and investment risk as the optimized goal.
It is also critical to portfolio re-equilibrium in the implementation of WSHS. Because power grid's electricity purchase influences WSHS's power generation.35,36 For instance, Gao et al. proposed different prediction models based on load and price in electricity market. 35 Fang et al. built a bi-level model to solve the distribution network coordination planning problem. 36 Inspired by these successful studies, in this paper, power grid is at the subordinate layer (i.e. lower layer). It makes the operation efficiency, surplus electricity and carbon emissions as the optimal objectives.
Interaction and contradiction of upper and lower layers
In this paper, the upper layer is the planning stage of WSHS. The quantity and installed capacity of power stations in REs portfolio development are taken as the decision variables. The lower layer is the implementation stage of WSHS influenced by power grid. Decision variable is the quantity of electricity purchase.
WSHS influences the purchase schemes of power grid by supplying different quantities and qualities of electricity. However, power grid achieved its operation goal through the reasonable purchase schemes and reacted upon the WSHS's profit. 37 First, upper layer's decision-making is given priority in the planning stage. According to the investment objectives, the initial decision variables are supposed, namely the quantity and installed capacity of wind, solar and hydro power stations. Secondly, they are converted into generating capacity. Then it is regarded as the constraint of electricity purchase in the implementation stage. So as to achieve lower layer's goal. Next, the optimal results obtained in the lower layer are transmitted to the upper layer. The upper layer makes the optimal decision of its own layer according to the feedback results, until the overall optimization is achieved. Finally, Pareto solutions are obtained, namely decision-making schemes satisfying heterogeneous stakeholders. Interaction between the upper layer and the lower layer as shown in Figure 2.
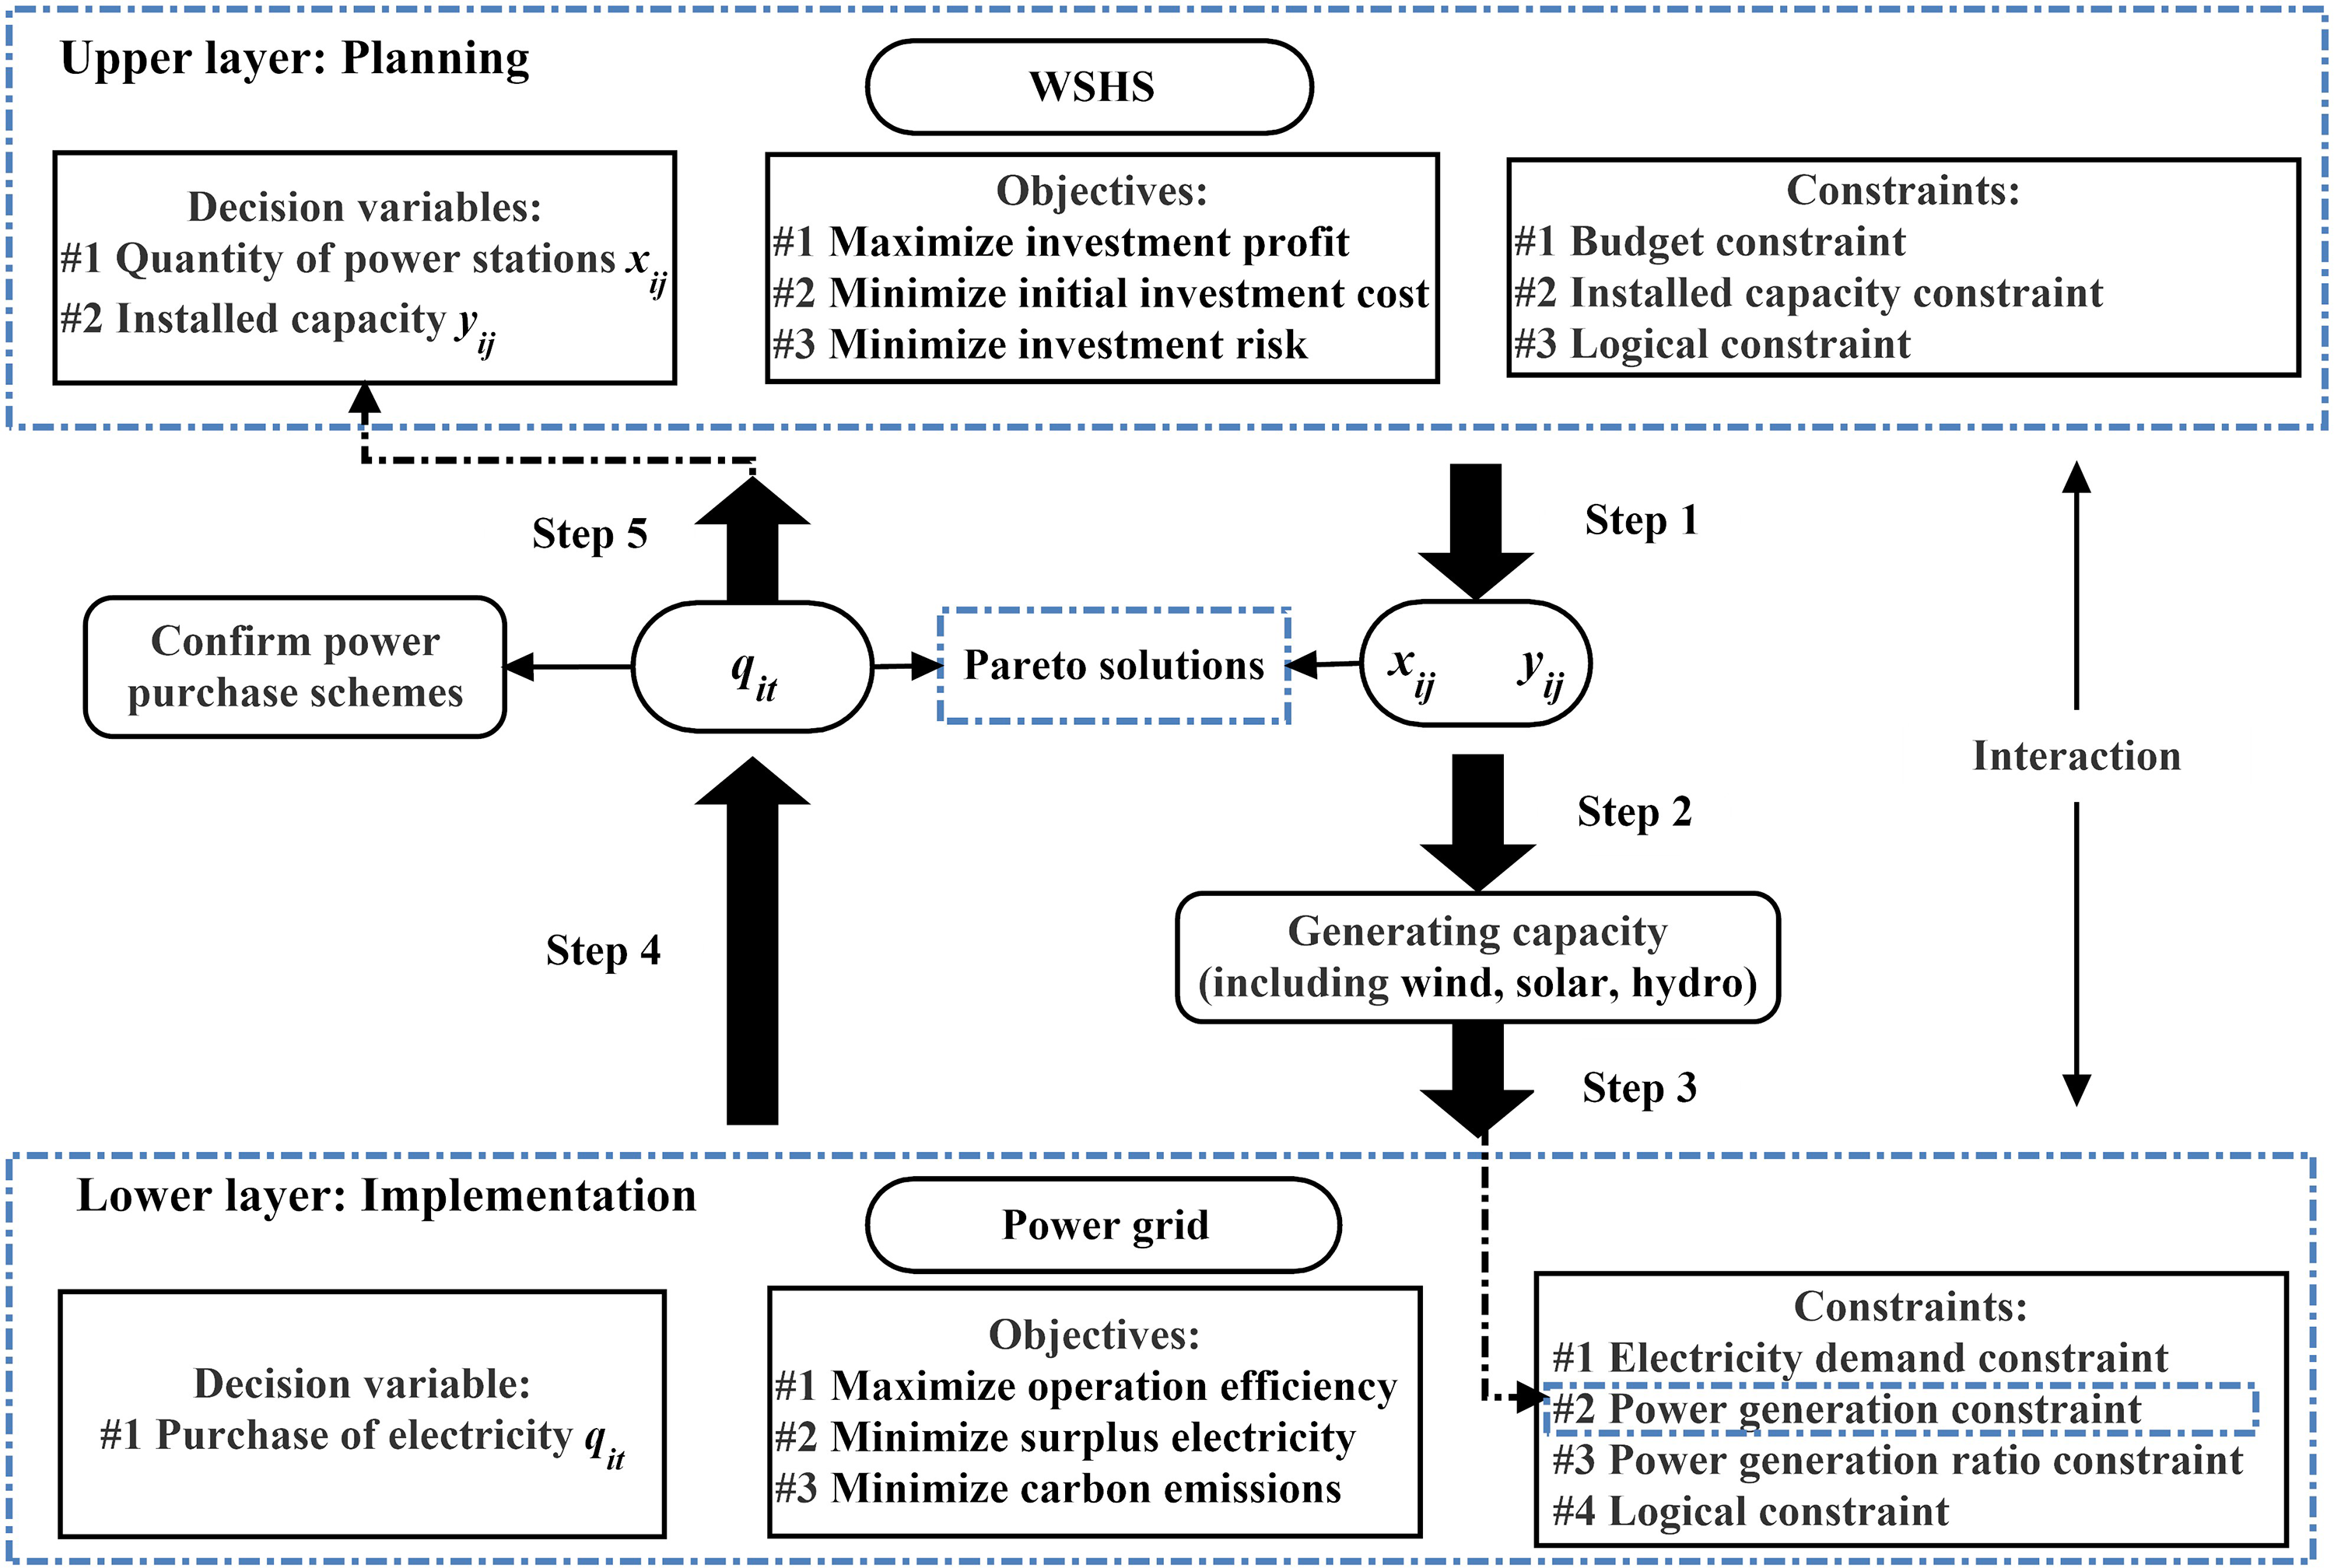
Interaction between the upper layer and the lower layer.
Multi objective conflicts in each layer
This study involves multiple objectives and exists conflicts between different objectives in each layer. For the WSHS, it aims to obtain more profits with limited investment volume. There is an obvious conflict between maximum operating profit and minimum investment amount, and always exists between maximum operating profit and minimum investment risk. In addition, it is necessary to ensure operation efficiency to meet revenue and electricity demand for power grid and to avoid abandoned power. Therefore, surplus electricity is required to be reduced as far as possible. In order to reduce environmental damage, carbon emissions reduction is also one of the goals. Thus, Pareto solution is used to handle these multi-objective conflicts. Multi-objective conflicts in each layer are shown in Figure 3.
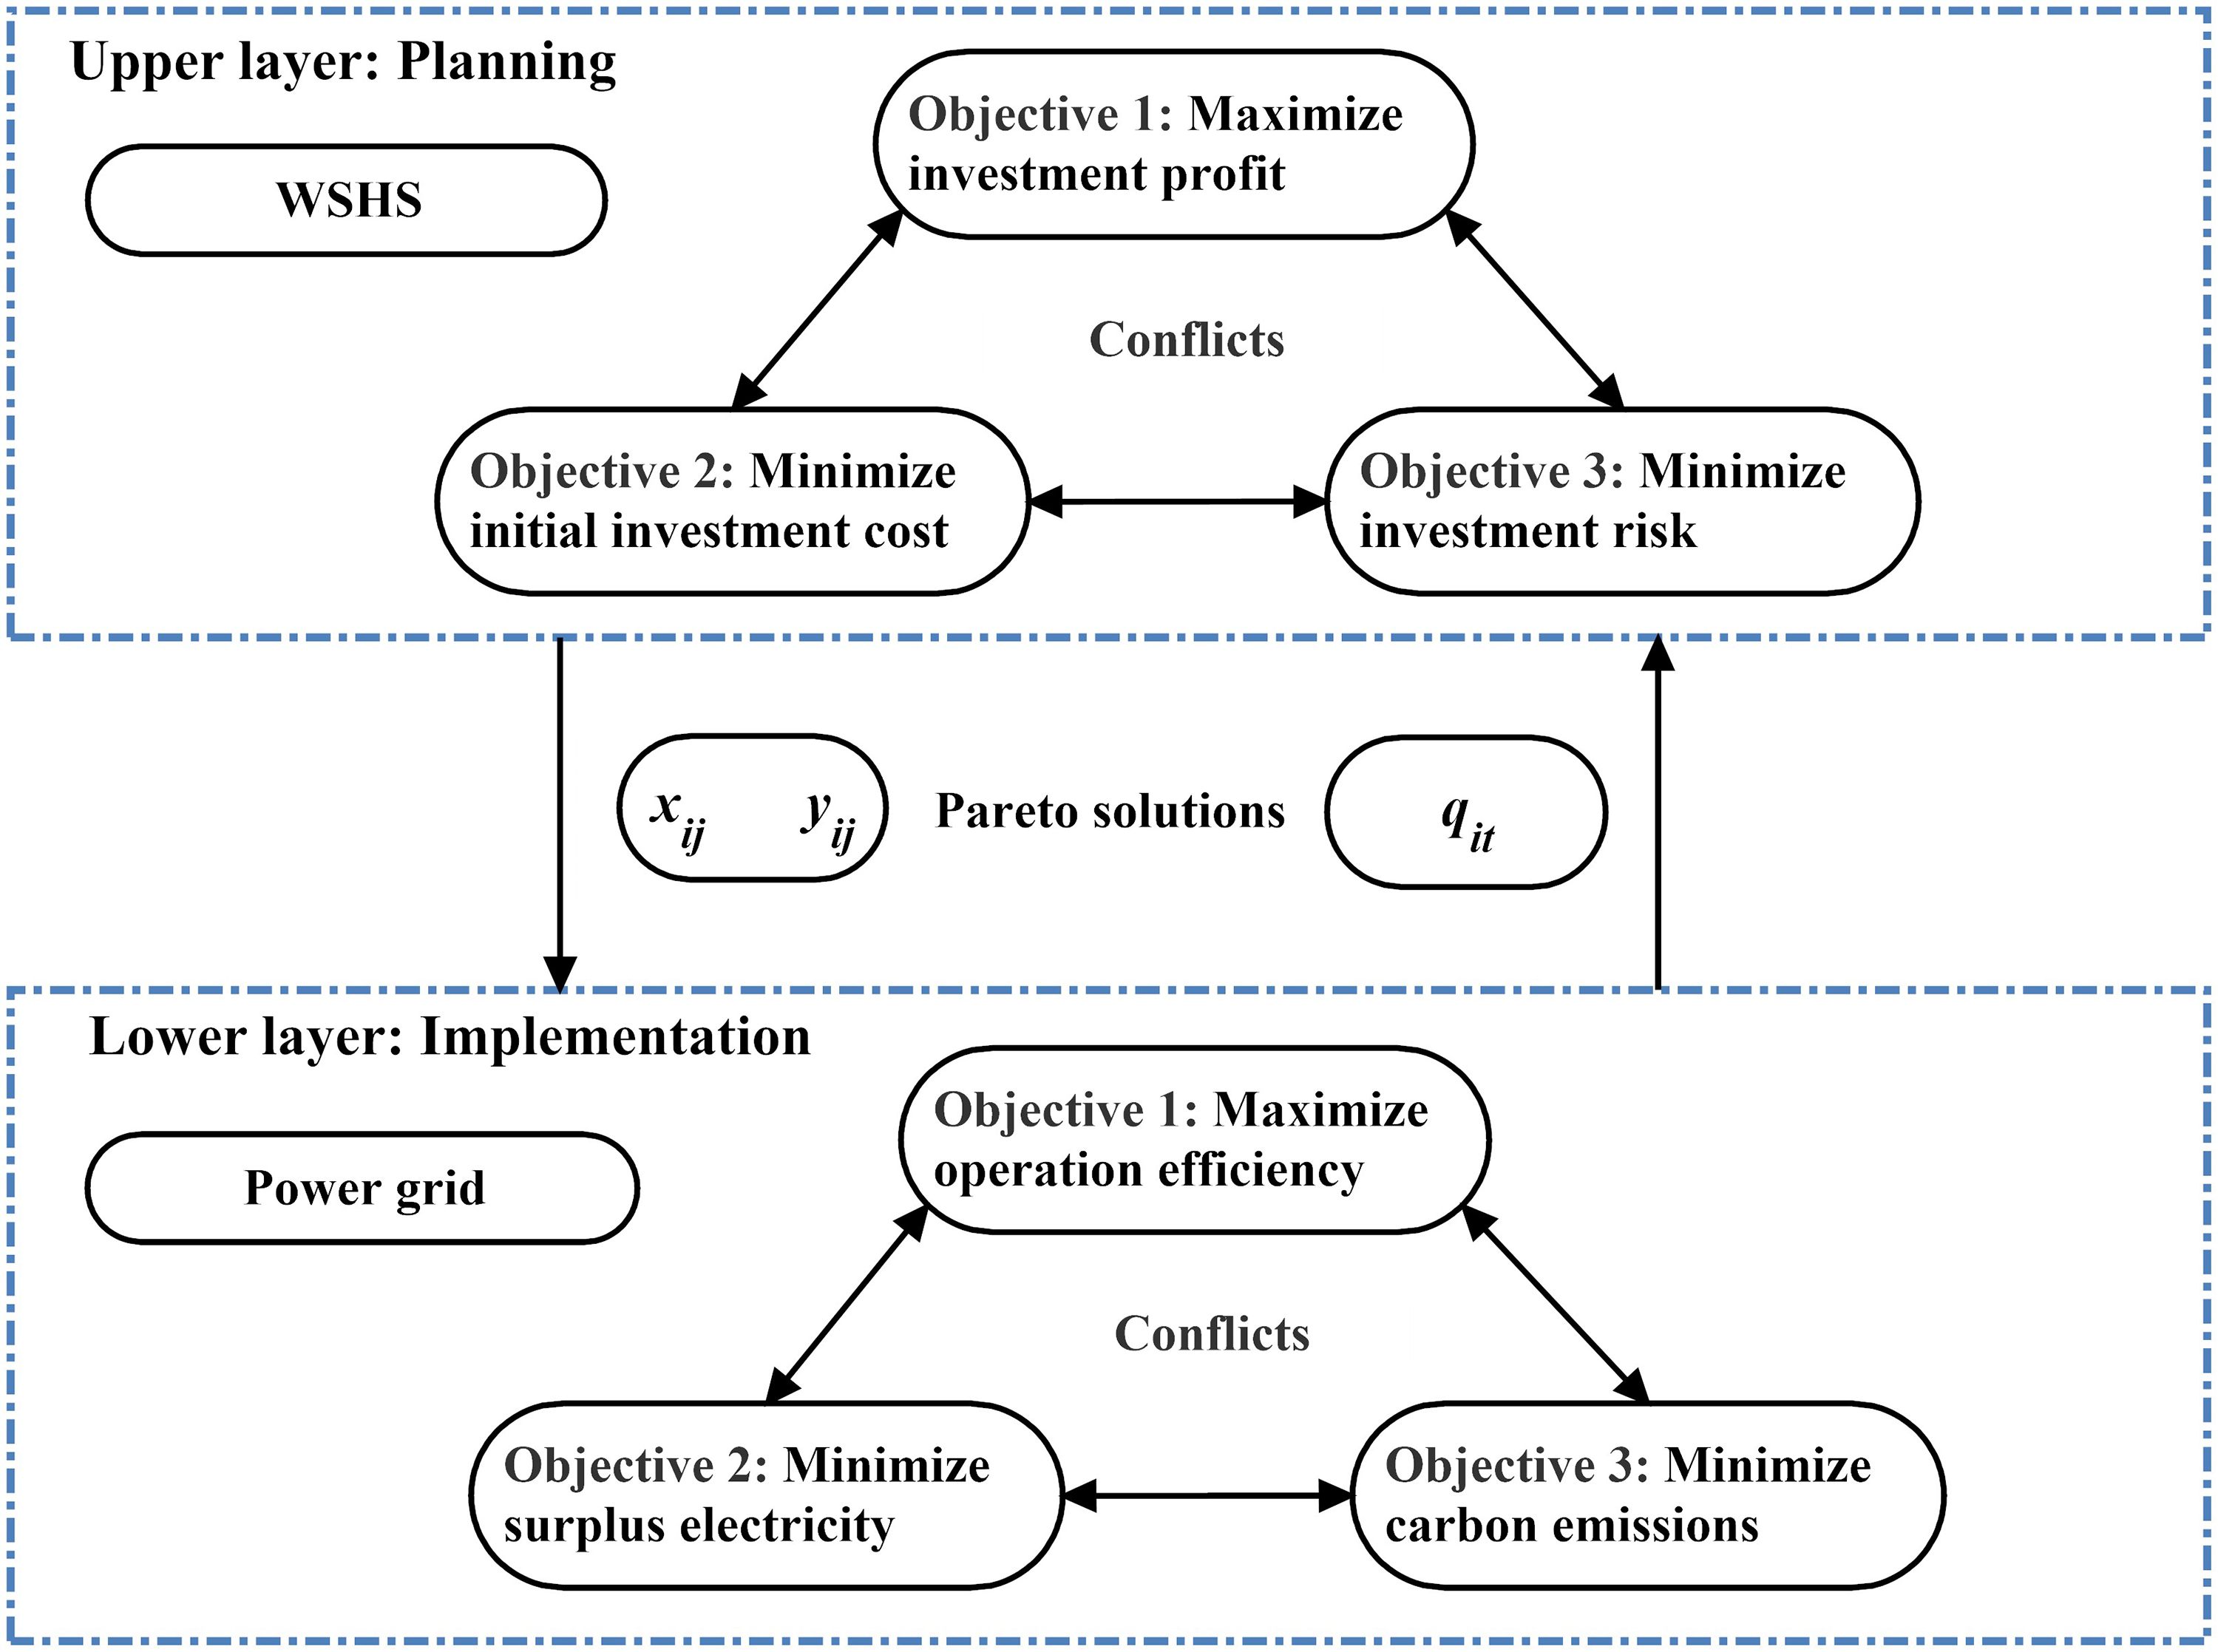
Multi-objective conflicts in each layer.
Hybrid uncertain environment of operation
Fuzzy sets based on numeric membership was used to handle the uncertainty of REs in past research.
38
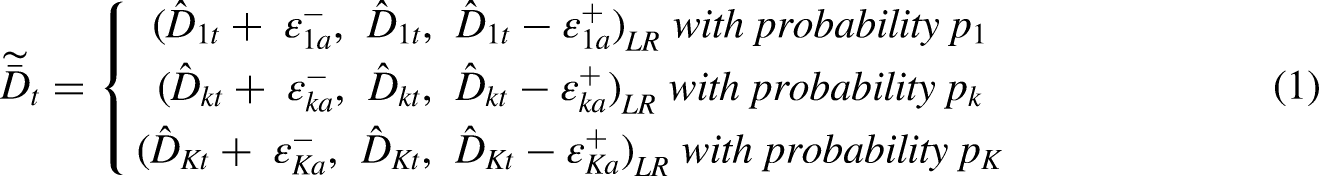
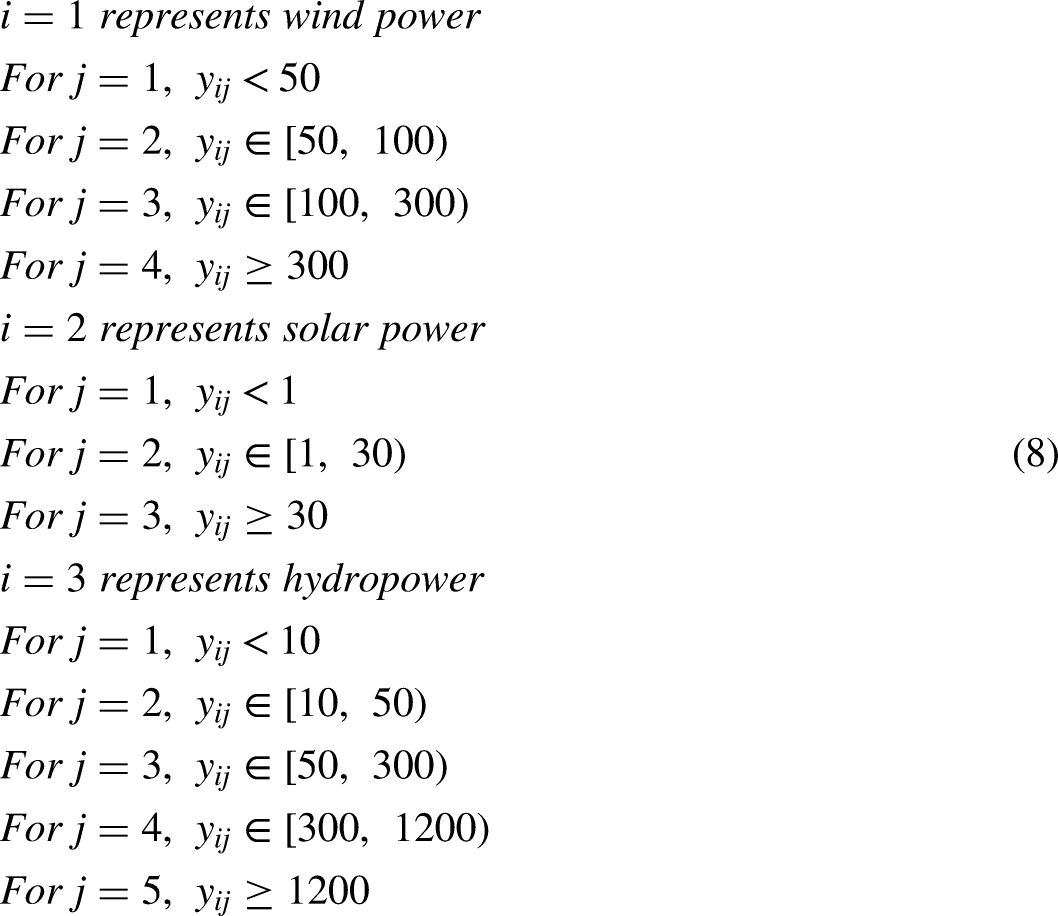
Therefore, this paper defines power demand through fuzzy perception, a clear but unobservable random variable, and proposes an integrated optimization model under mixed uncertain environment, as shown in Figure 4. Furthermore, it is expressed as a typical discrete random distribution with the fluctuation of the lower, middle and upper parameters, as follows:
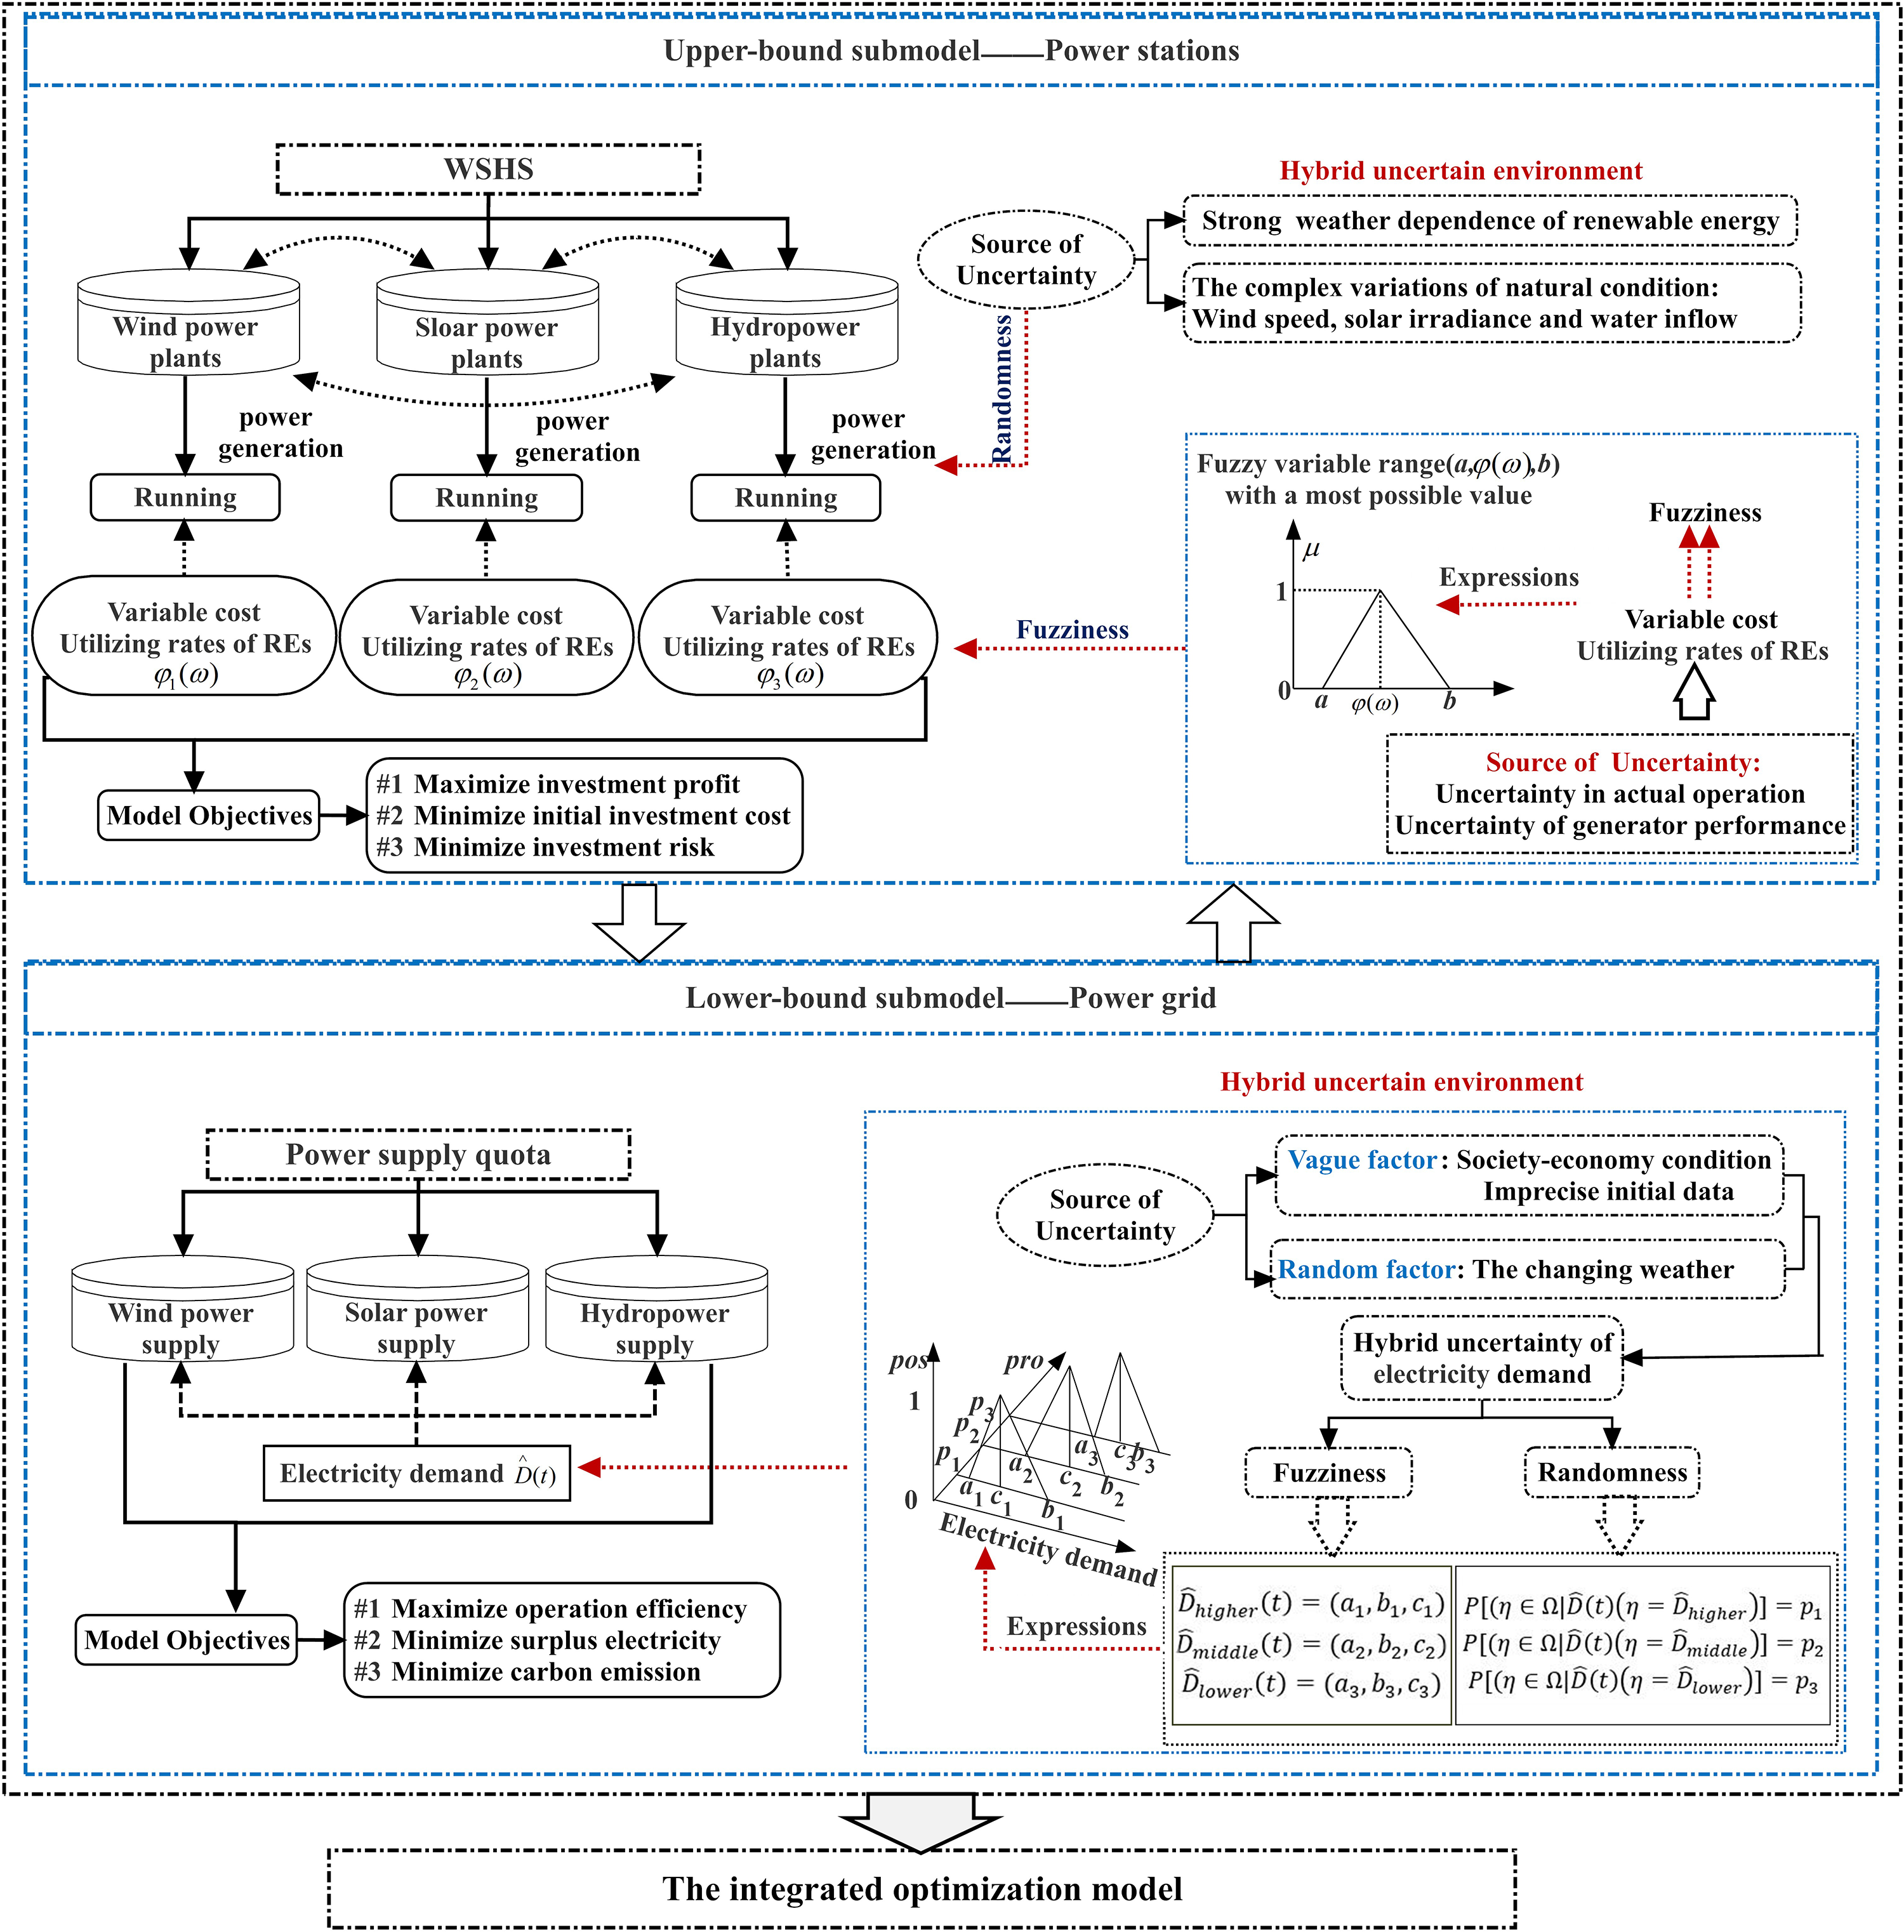
Integrated optimization model in hybrid uncertain environment for WSHS.
Modelling
The structural framework of the bi-level programming model proposed in this paper is shown in Figure 2. In Section 2.2, the internal mechanism is described in detail, which is how the upper layer and the lower layer interact to achieve the purpose of this paper. The objectives and constraints of each layer are further explained as below.
The WSHS's goal
The quantity and installed capacity of different power stations are assumed. The goal is to optimize investment profit, initial investment volume and investment risk.
Objective1: Investment profit. According to Markowitz's portfolio model, WSHS focused on investment return and risk.
39
To ensure sustainable development, the investment revenue of WSHS must be guaranteed. Thus, this paper aspires to maximum investment profit. It is presented as the revenue minus cost in planning stage, as shown in Figure 5. The revenue is the combination of the discounted value of incomes from electricity sales

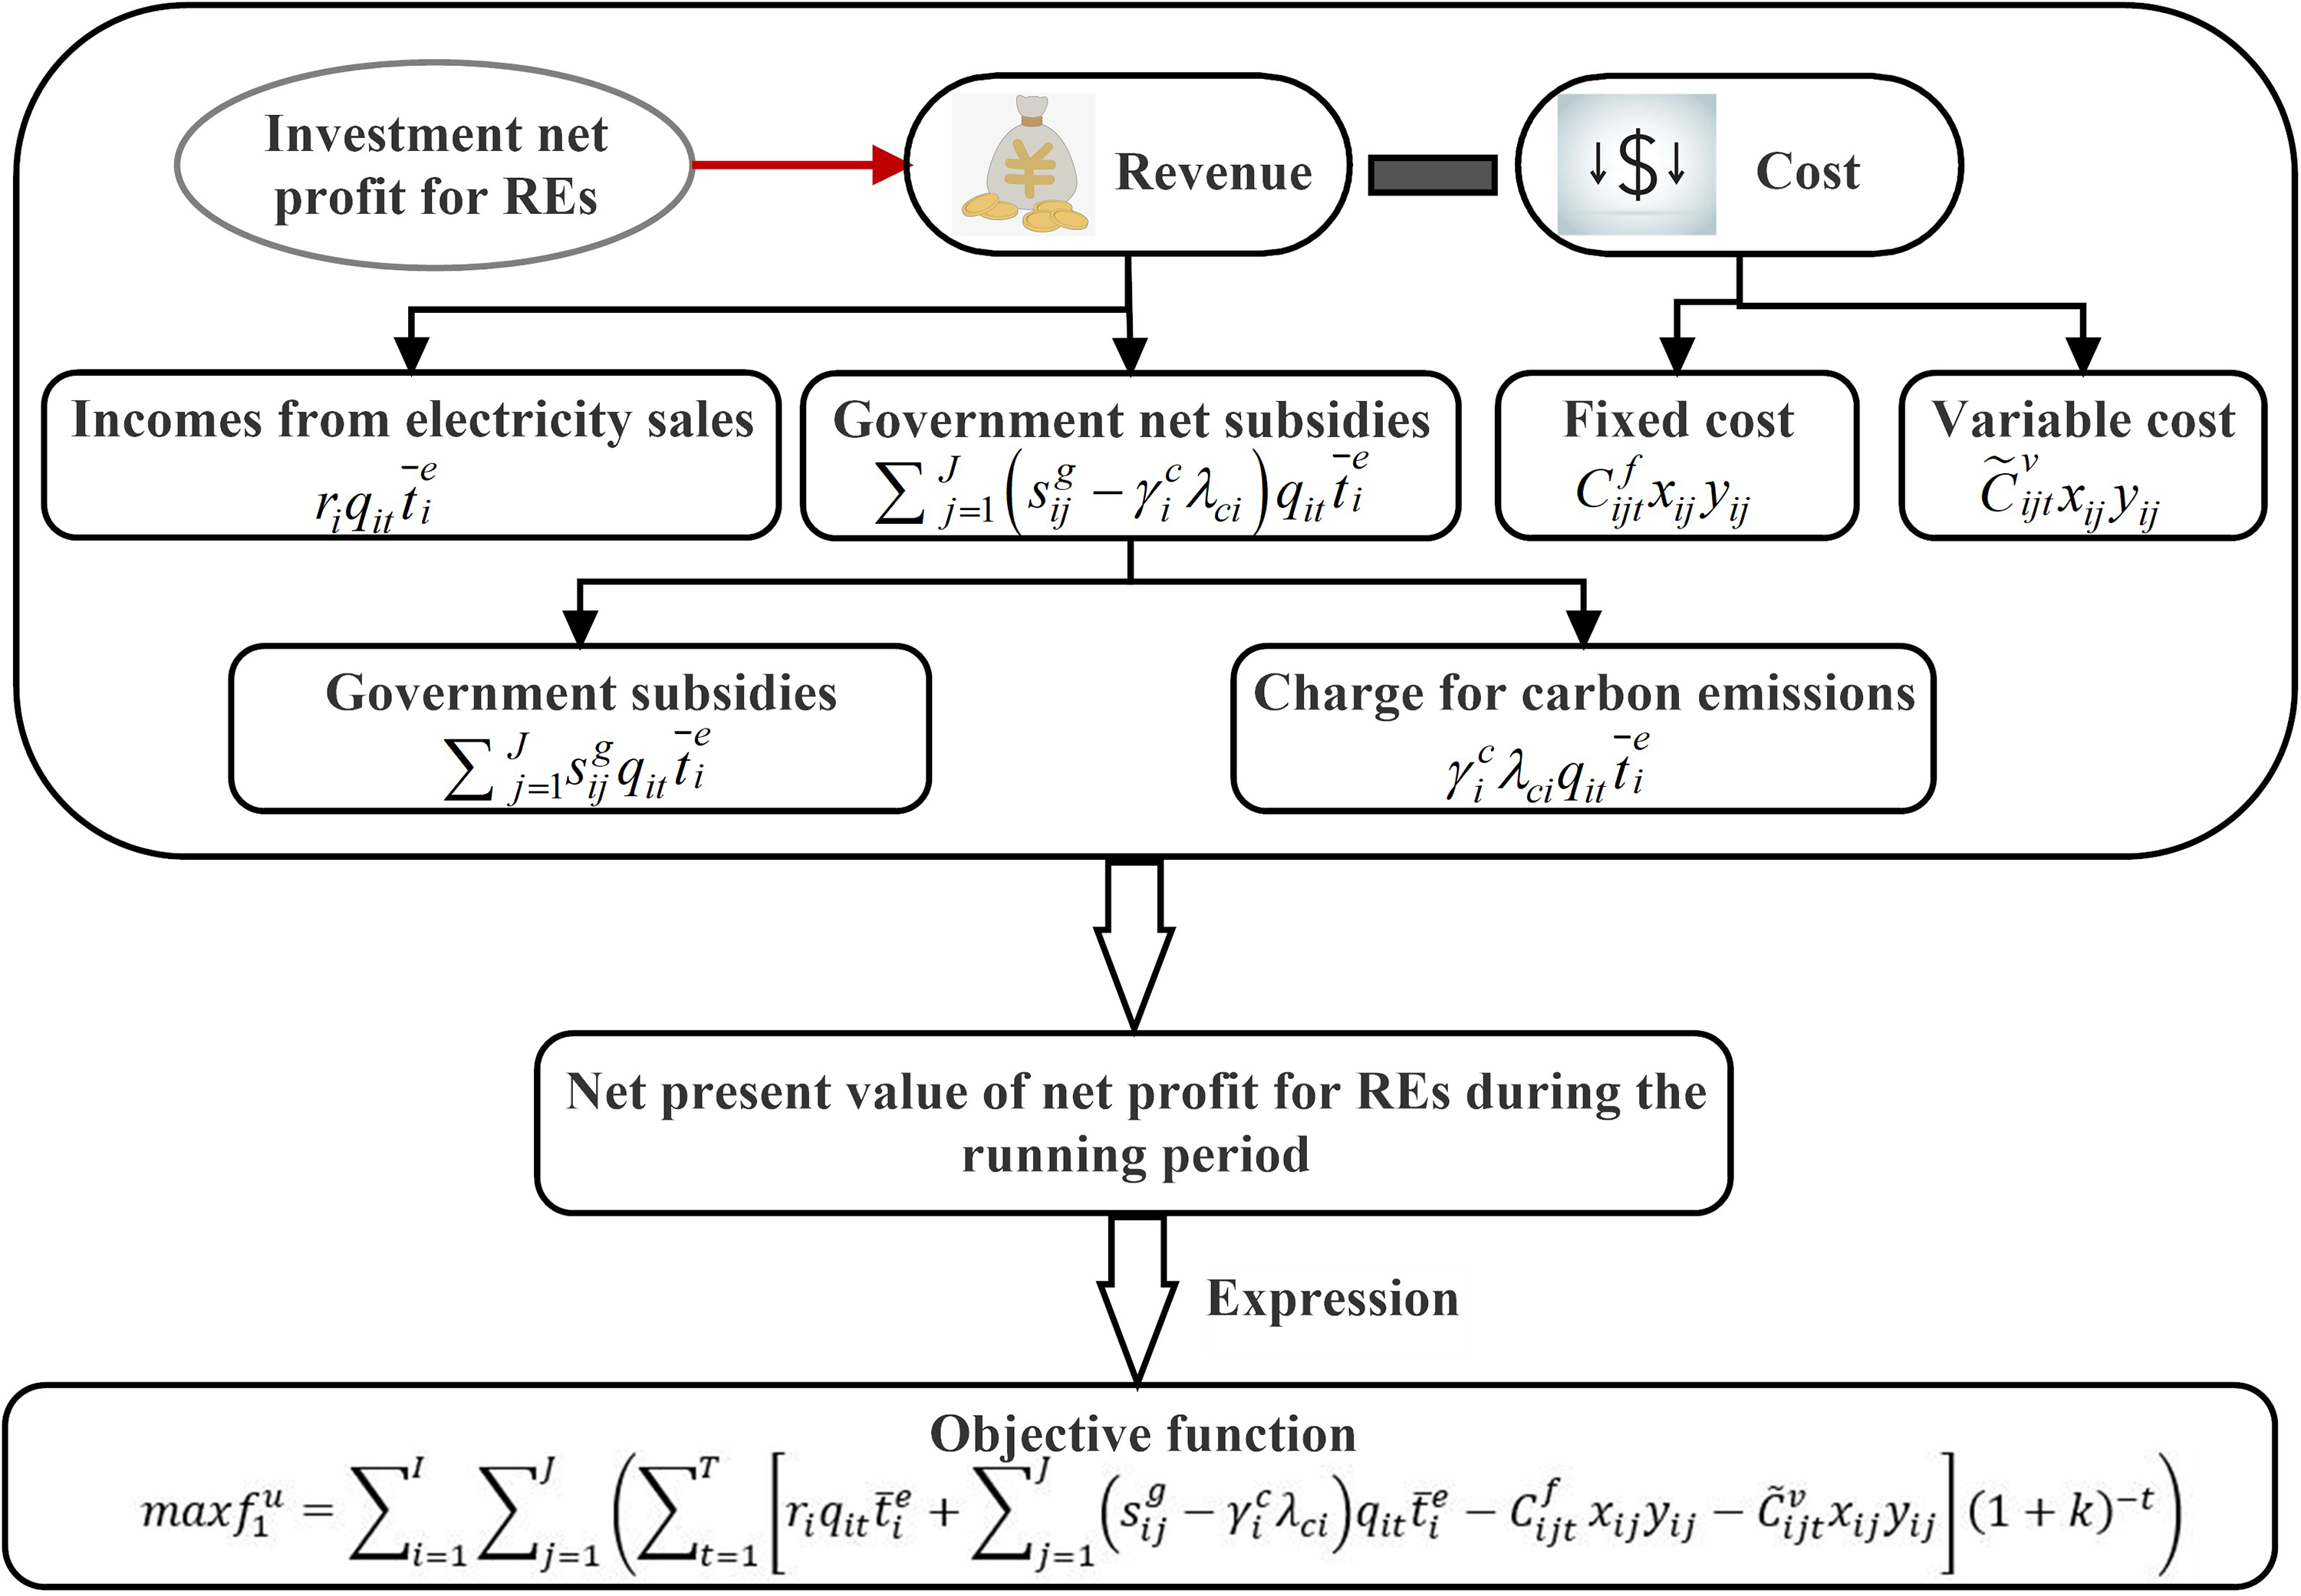
Diagram of investment profit function model for WSHS.
Where
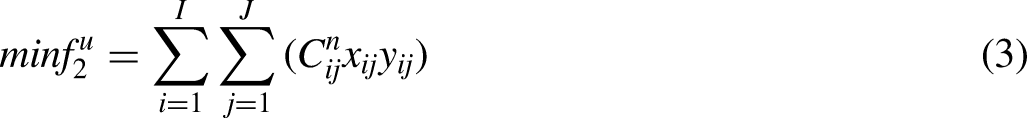
Objective2: Initial investment volume. Here, the initial investment volume needs to be minimized. It is calculated by the sum of the investment of different power stations in construction stage.
Objective3: Investment risk. This paper also seeks to minimize investment risk. Bhandari et al. proposed that the investment risk can be expressed by the ratio of the expected rate of return to development cost correspondingly.
40
The calculation is as follows.


Where
The WSHS's constraints
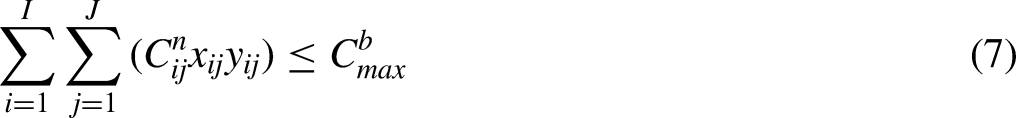
The optimization of WSHS for portfolio re-equilibrium is restricted by the budget, installed capacity and logical constraint. The details are as follows.
Budget constraint. The total investment volume of WSHS should not exceed the budget.

The power grid's goal
To satisfy electricity demand, power grid should decide the quantity of electricity purchase (i.e.
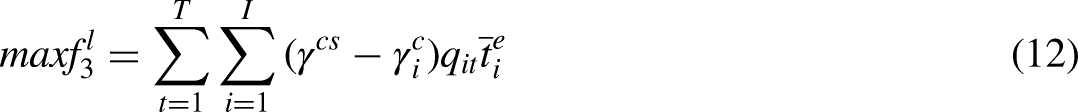
Objective1: Operation efficiency. Power grid's operation efficiency is represented by the minimum operation costs composed of electricity purchase and reliability guarantee as shown in Figure 6. Electricity purchasing cost is the discounted value of the cost of purchasing REs and thermal power generation
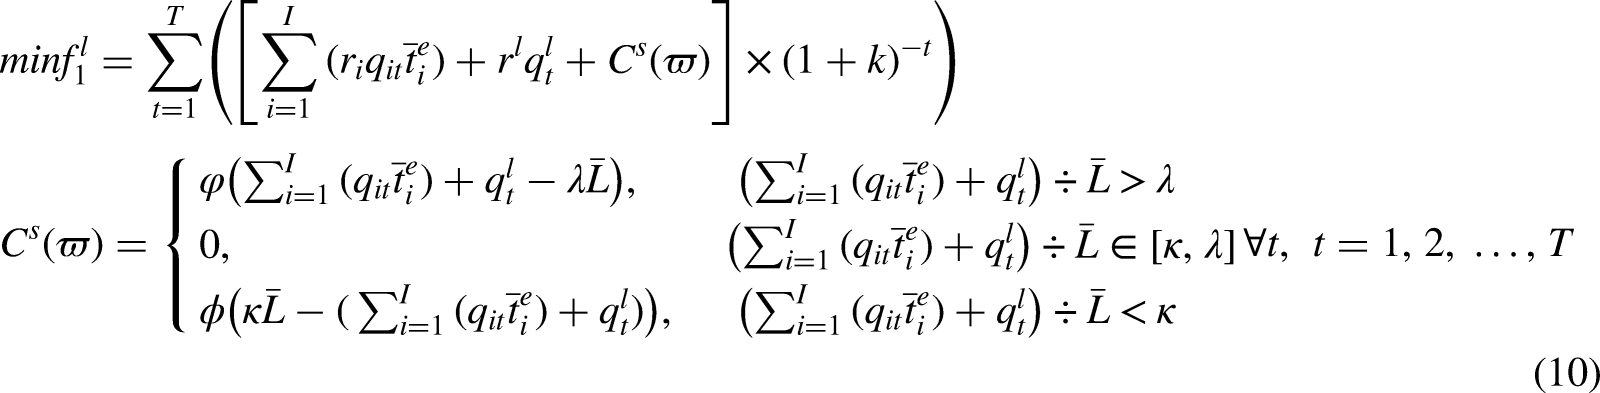
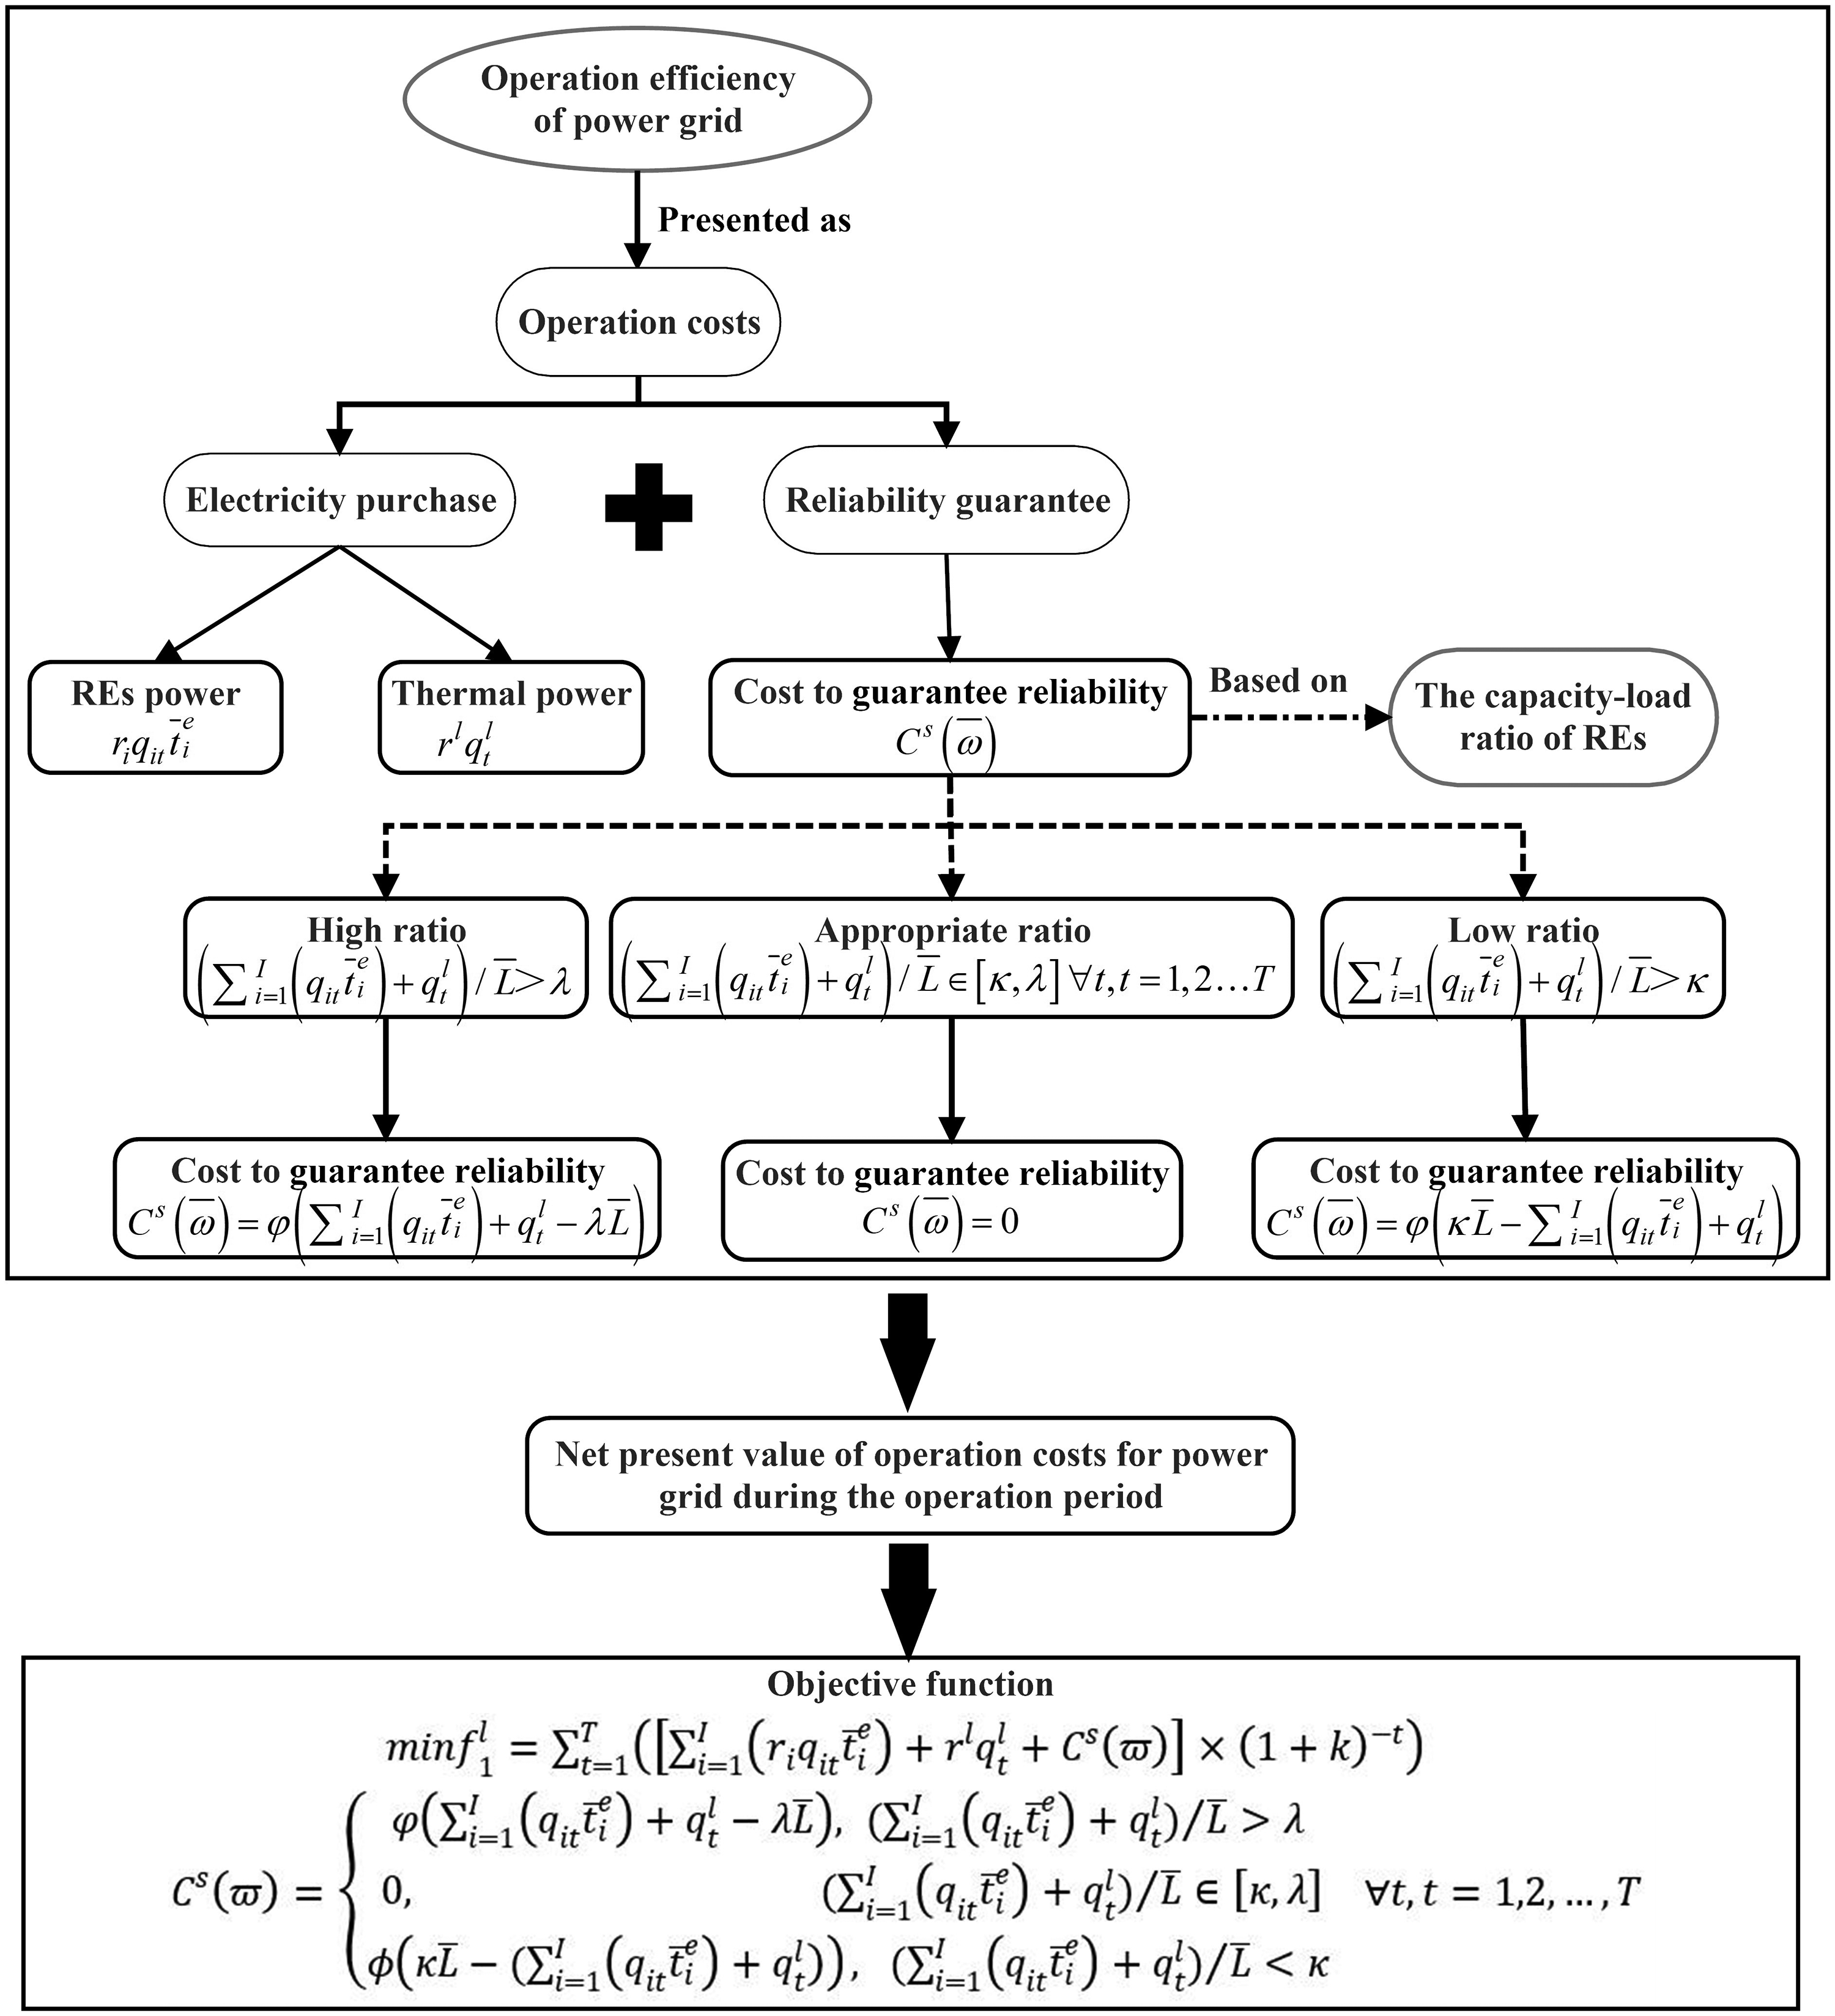
Diagram of operation efficiency function model for WSHS.
Where
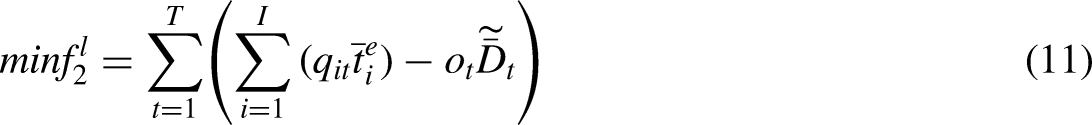
Objective2: Surplus electricity. Due to storage limitation, power grid needs to keep real-time balance for the supply-demand electricity as much as possible. It is necessary to minimize surplus electricity and to avoid wasting resources. Here, electricity demand
Objective3: Carbon emissions. Reducing carbon emissions has been an essential goal. Thus, power grid seeks to maximize carbon emissions reduction. It is calculated by subtracting the carbon emission of REs from standard coal.
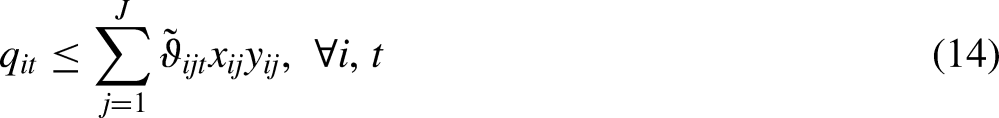
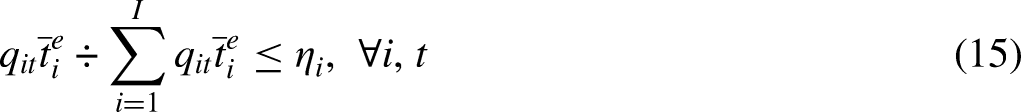
The power grid's constraints
The optimization of power grid's purchase scheme is restricted by the electricity demand, power generation, power generation ratio and logical constraint.
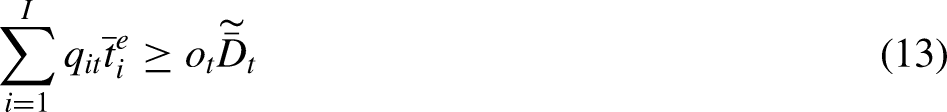
Electricity demand constraint. The purchase electricity should be no less than the demand during operation. Here, electricity demand
Logical constraint. The purchase electricity of power grid should be non-negative.

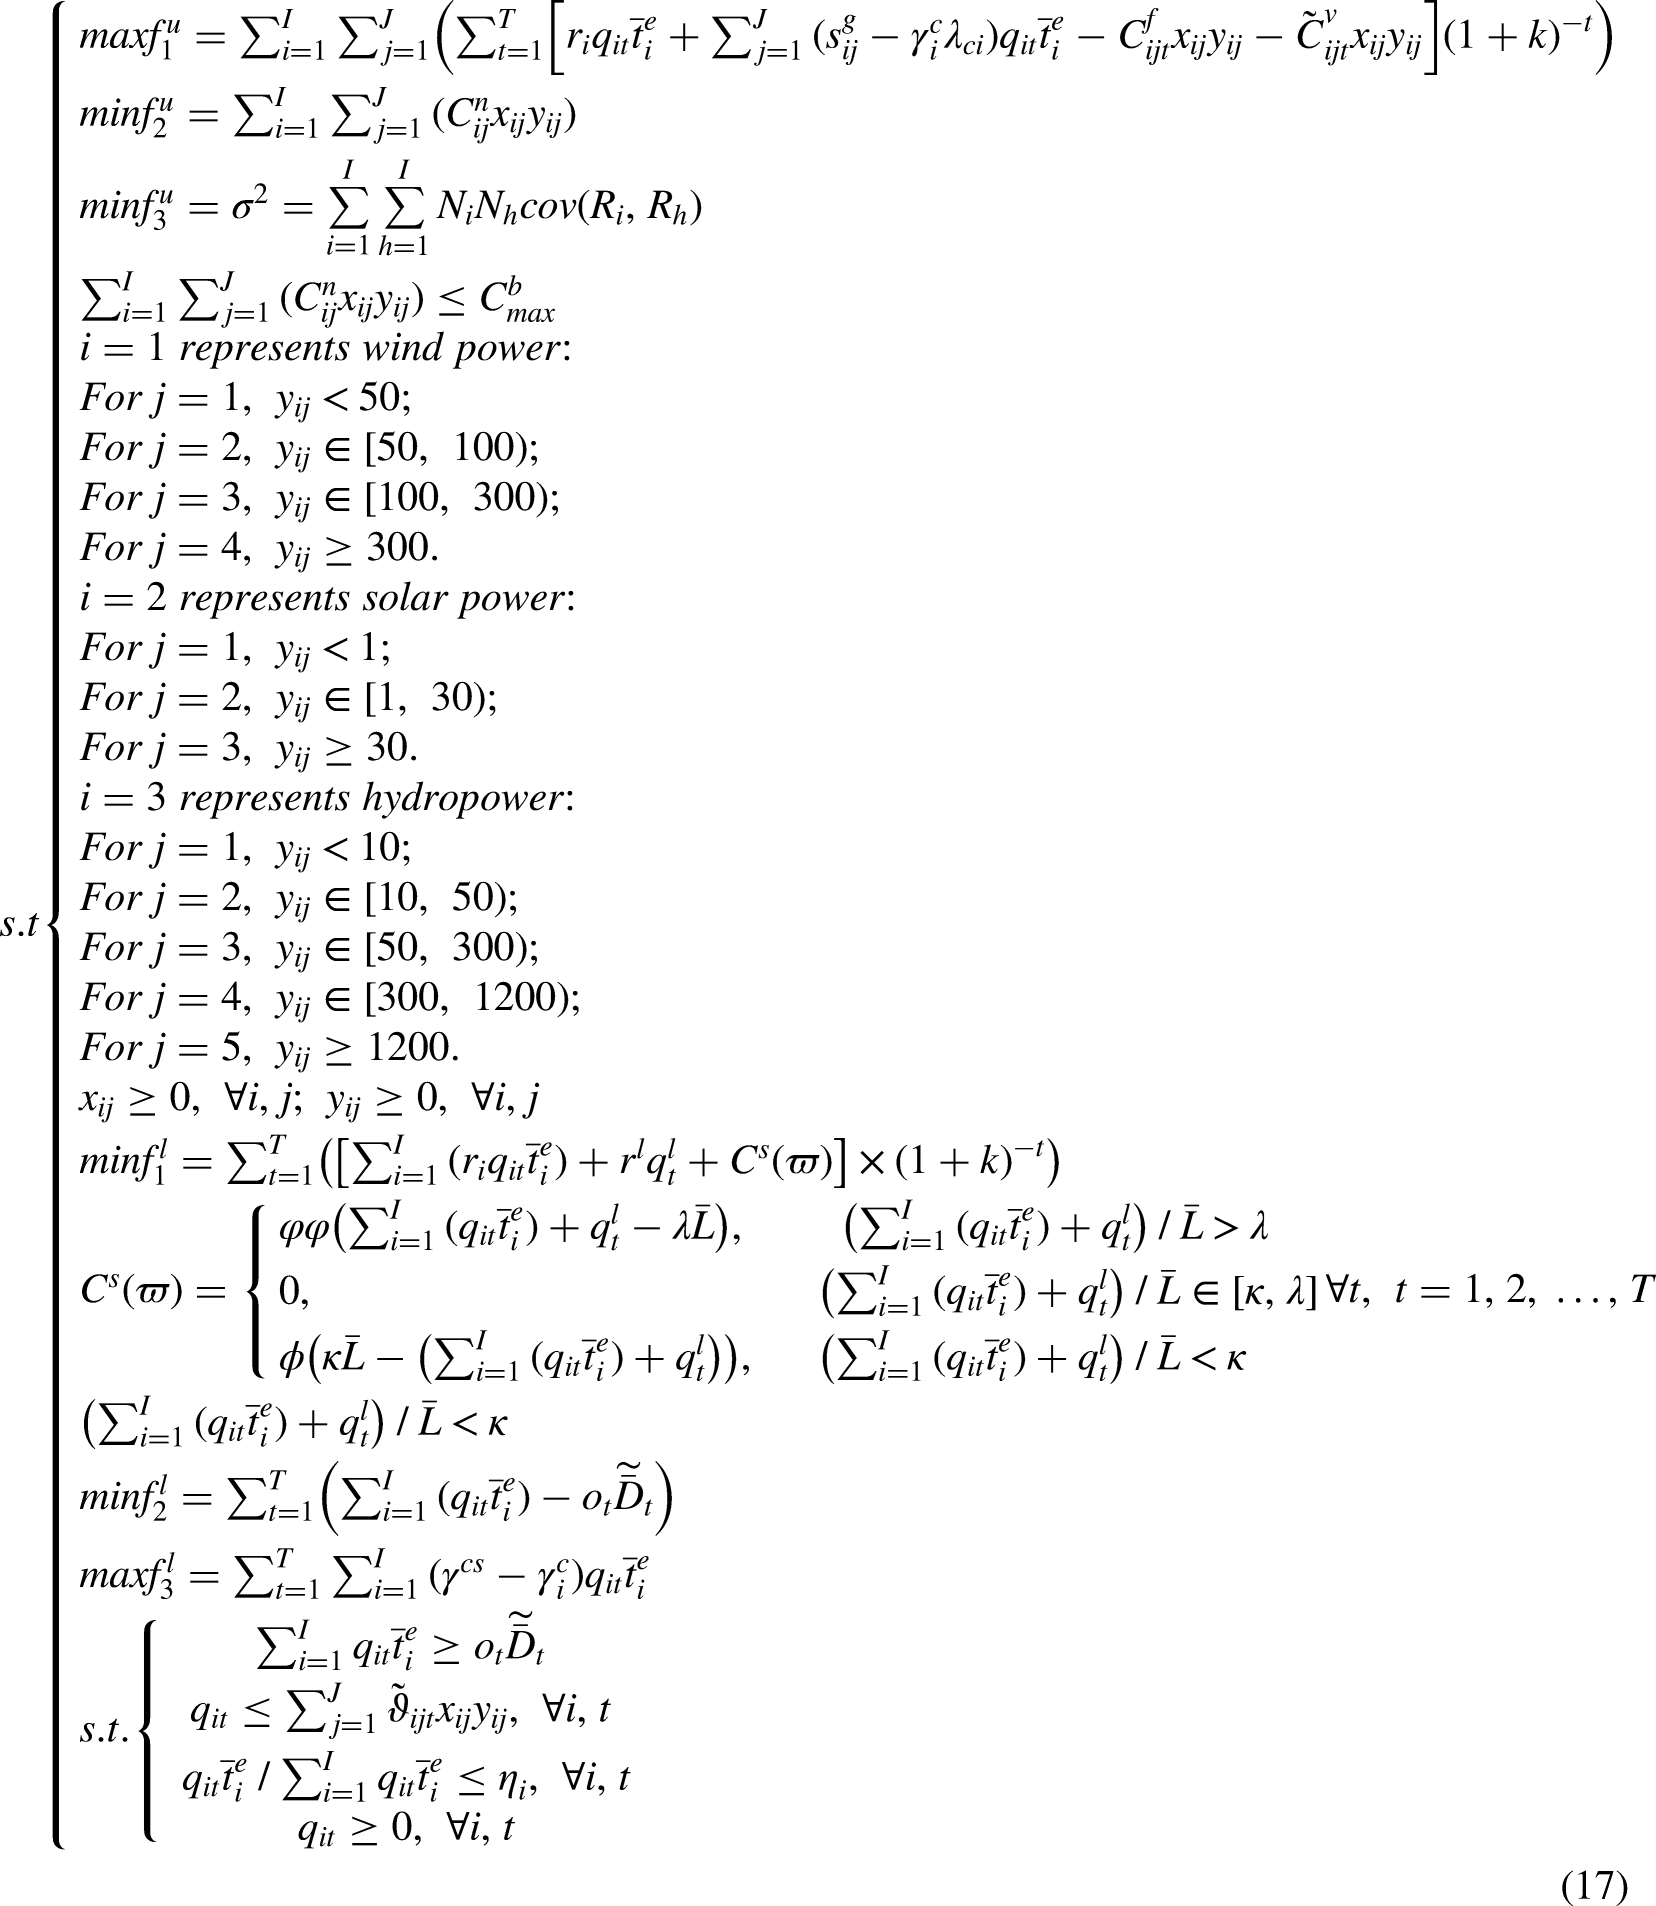
Global model
Based on the above descriptions, the global model is established, as shown in equation (17).
Model decomposition and solution
Transform fuzzy random variable
According to Xu and Liu, 41 this paper transforms fuzzy random variable to trapezoidal fuzzy variable. The discrete random distribution with the fluctuation of the lower, middle and upper parameters is shown in equation (1).
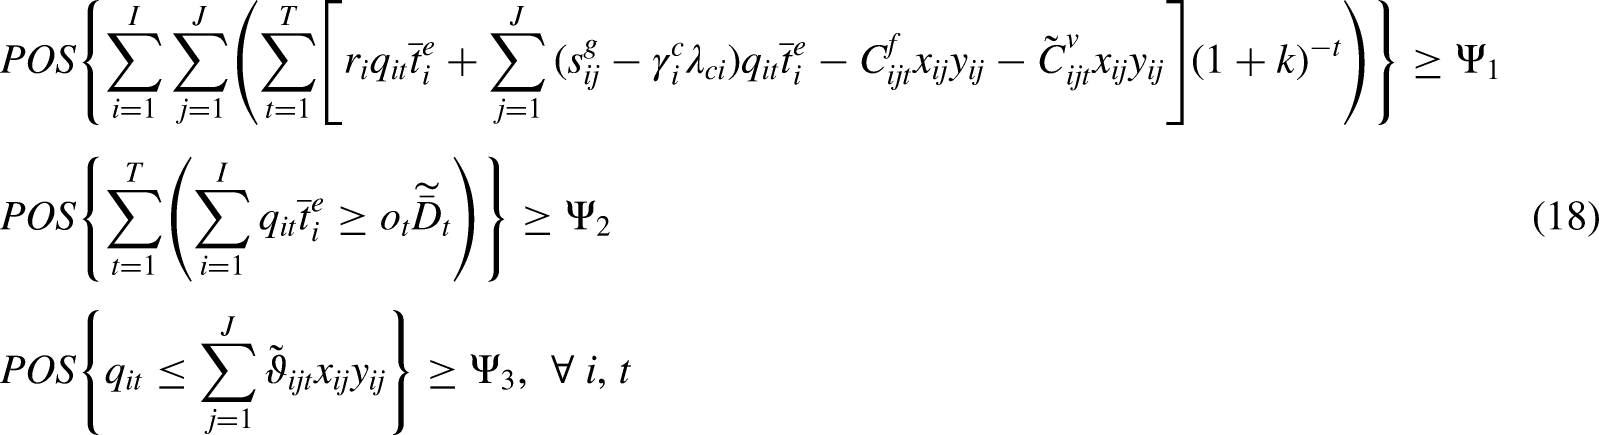
Combined chance constraint
It is necessary to transform the model to have mathematical significance. According to Xu et al.
42
this paper proposes the global model based on chance constraint with the decision-maker's confidence
Combined meta-heuristic approach
PSO algorithm was originally proposed by Kennedy and Eberhart as a common meta-heuristic approach.
43
It has been proved that PSO is useful to solve NP-hard problem in bi-level programming.
44
In this paper, to improve its exploring capacity and avoid falling into local optimum, an adaptive inertia weight strategy is introduced. Through the exponentially decreasing function, the strategy is nonlinear to enable
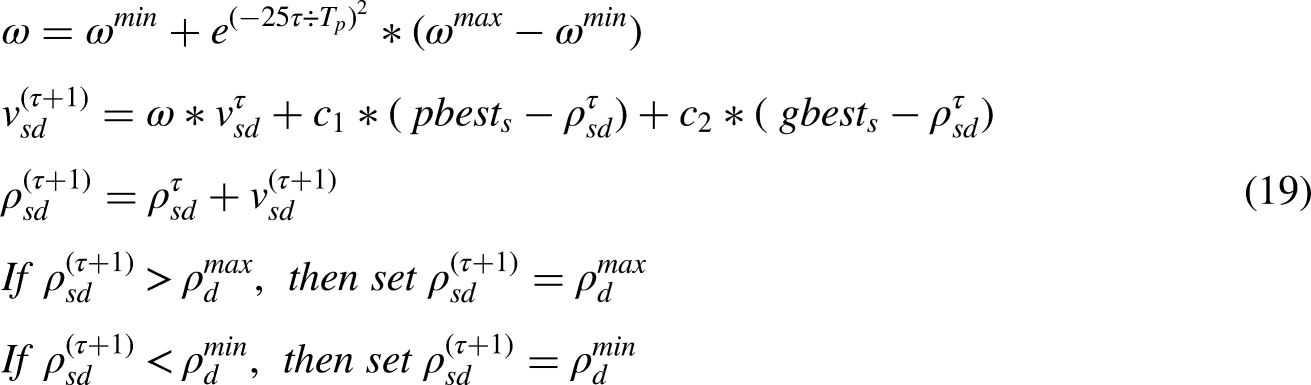
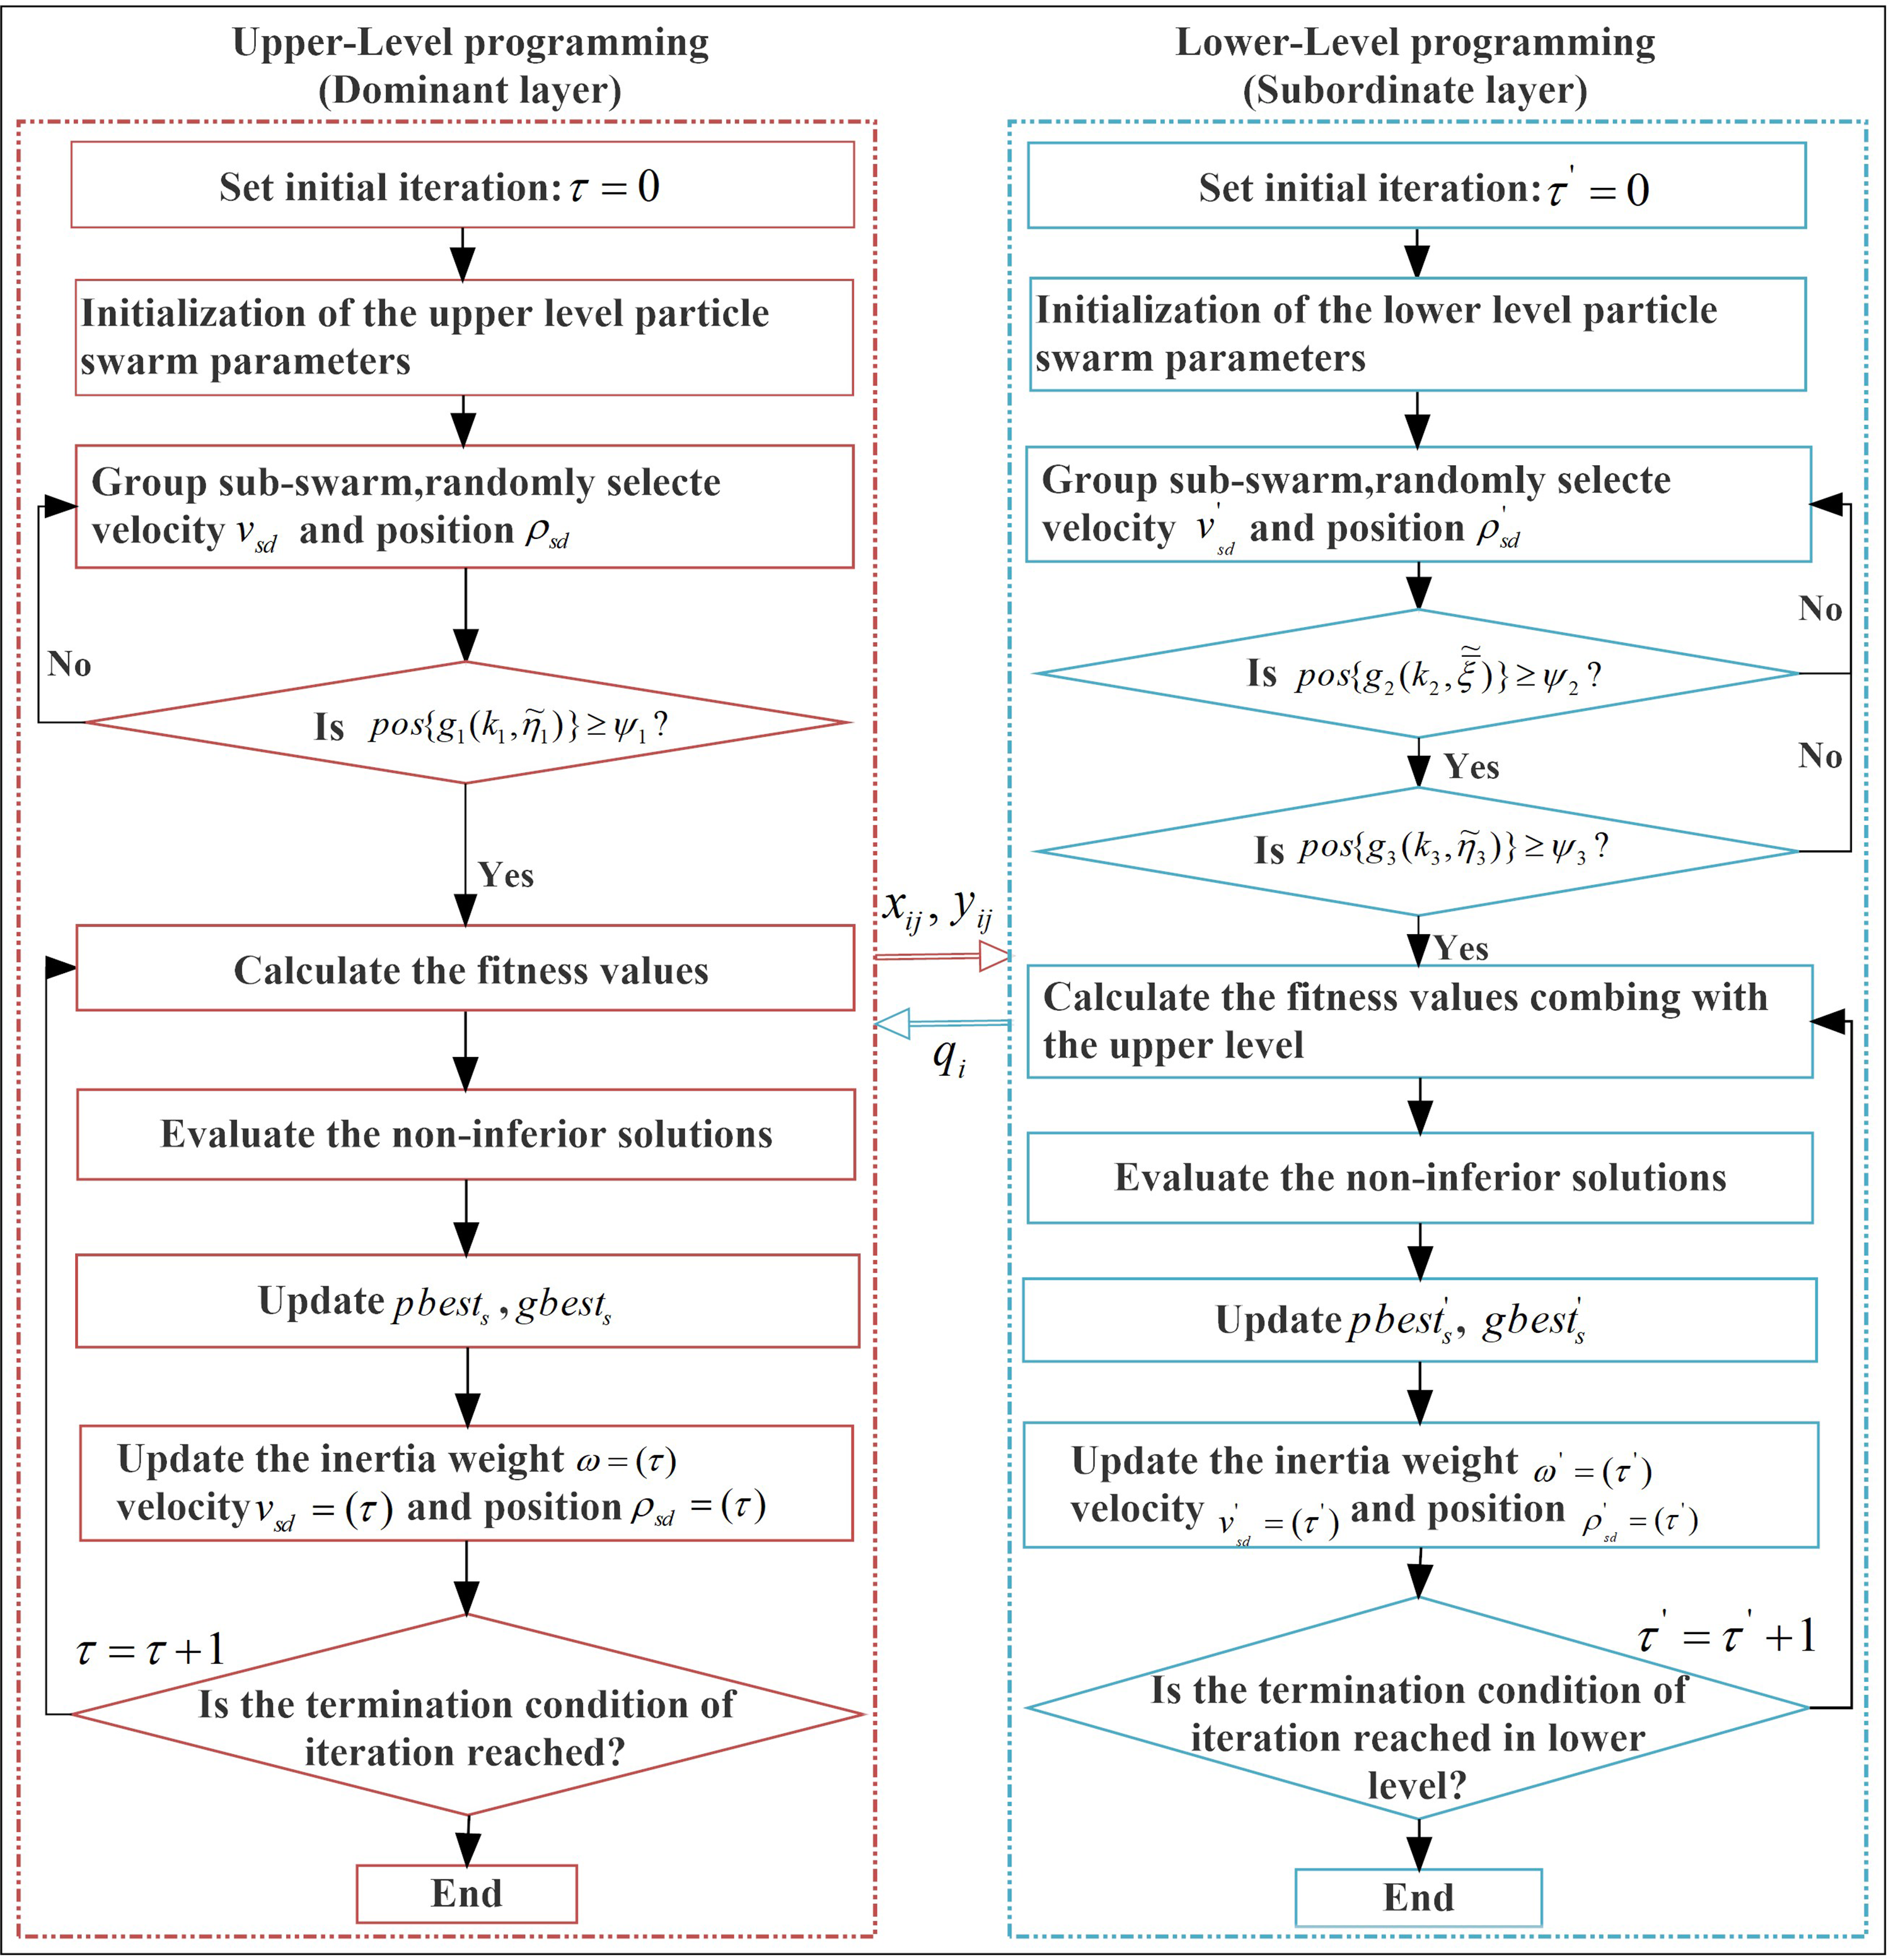
Flowchart of combined meta-heuristic approach.
Where
Case study
Case description
In order to verify the method, this paper takes Panzhihua, Sichuan of China as an example. The main reason is that Panzhihua is one of the typical multi-energy areas in Southwest China. The potential of wind, solar and hydropower resources is huge. Its location and resource reserves are shown in Figure 8.

Distribution of REs in panzhihua.
Data collection
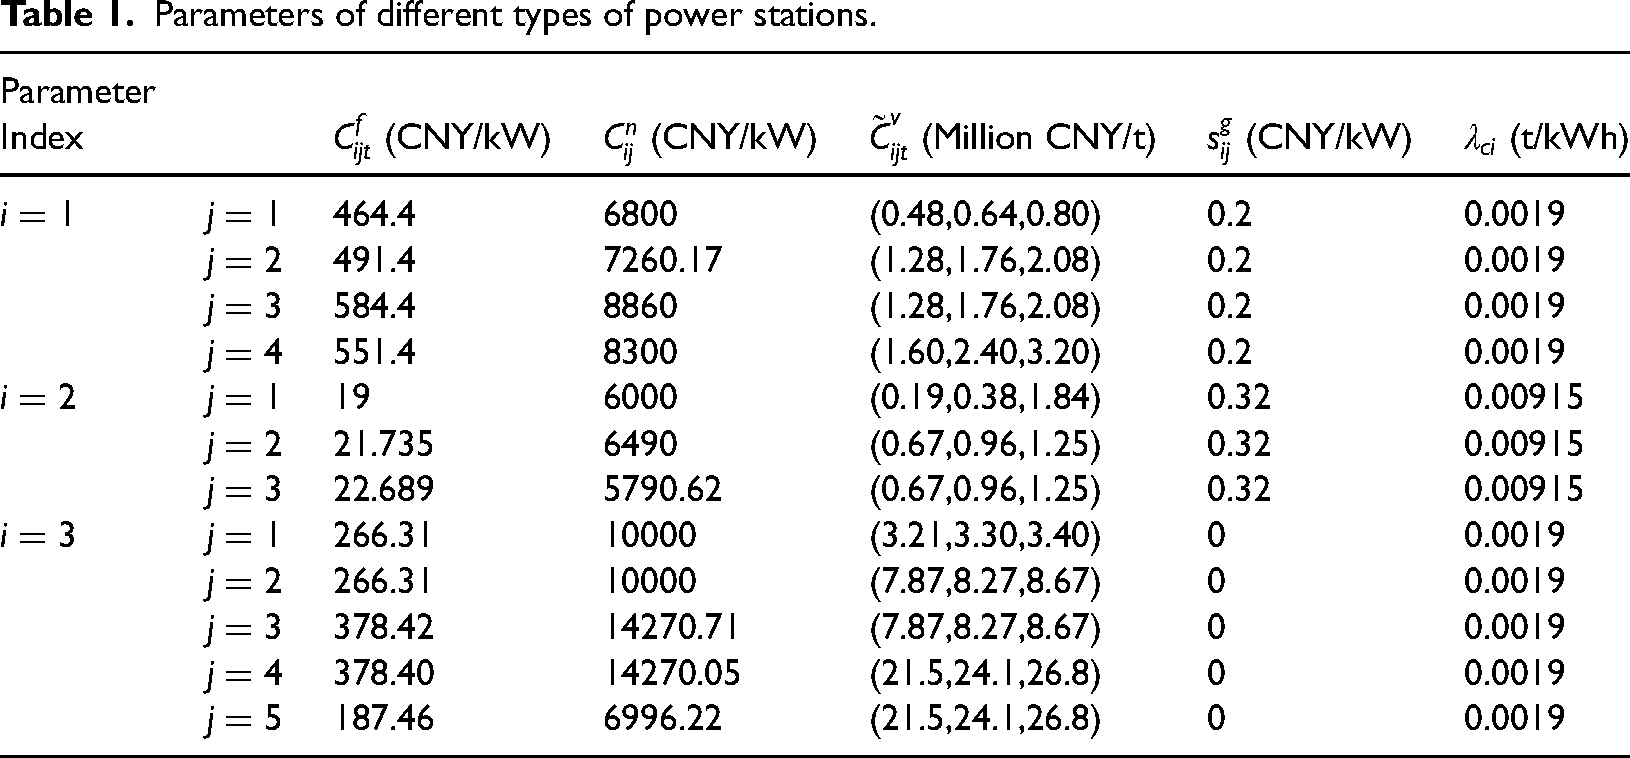
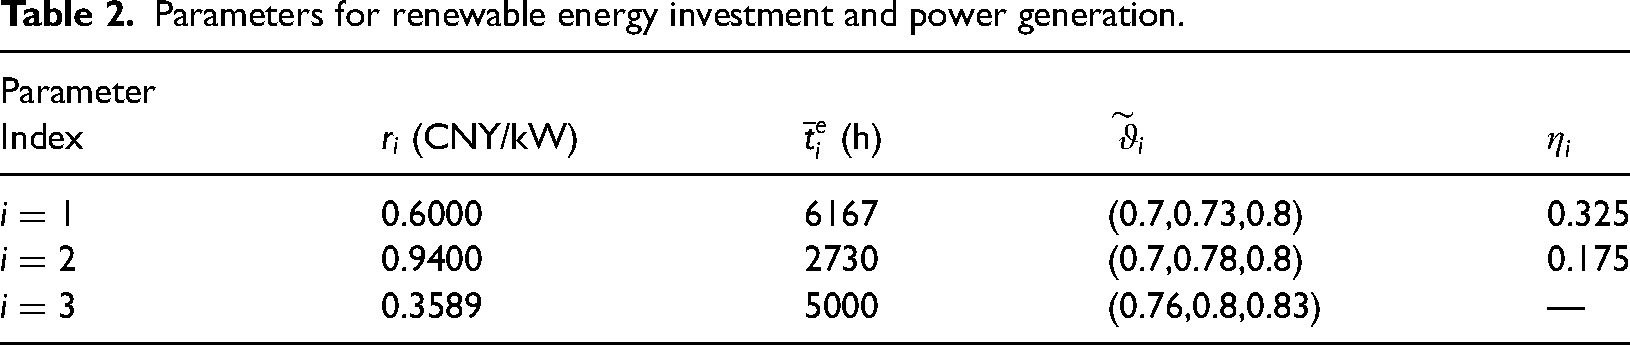
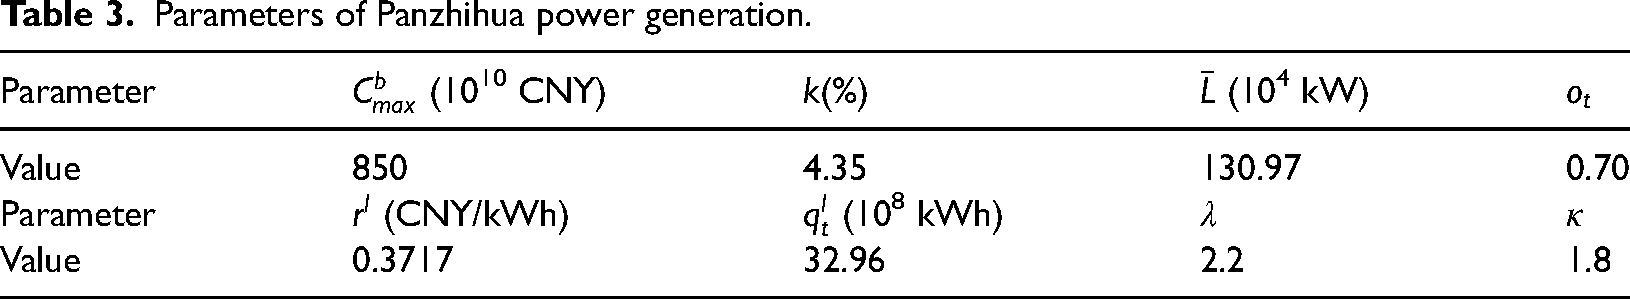
Data in this paper were obtained from Sichuan Statistical Yearbook, Panzhihua Statistical Yearbook, Wind and Solar Power Project Planning Report (2015-2025) of Panzhihua City, China Carbon Emission Trading Network and field surveys. Specifically,
Parameters of different types of power stations.
Parameters for renewable energy investment and power generation.
Parameters of Panzhihua power generation.
Calculation results
The running parameters of PSO were set as: swarm_size
Results under different scenarios
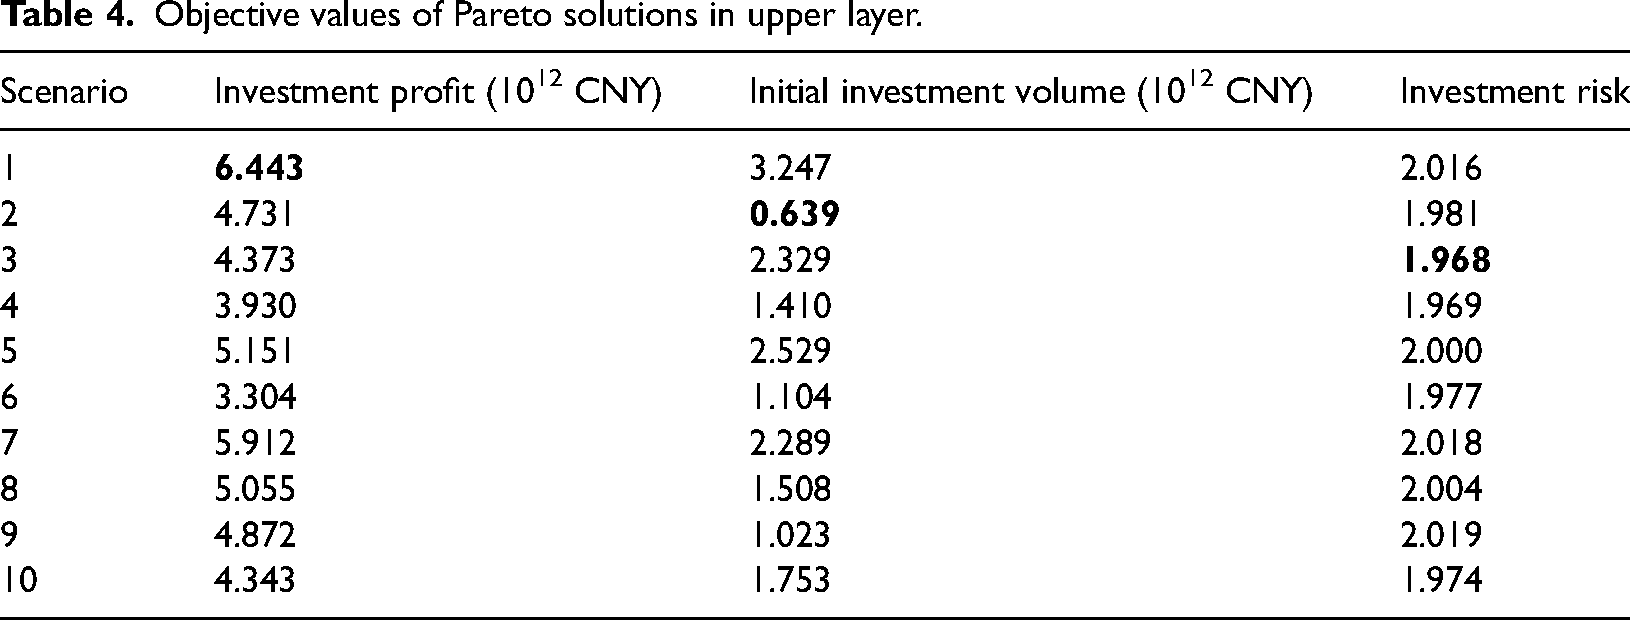
According to the methods described in sections 3 and 4, this paper selected one of the results with 10 scenarios in the upper layer to illustrate the results. To make much clearer for REs planners, the objective values of upper layer are displayed in Table 4. And the quantity and installed capacity of wind, solar and hydro power stations are presented in Supplemental Table A.1 and Table A.2. In each scenario, there are corresponding electricity purchase schemes for power grid.
Objective values of Pareto solutions in upper layer.
Scenarios with typical goals
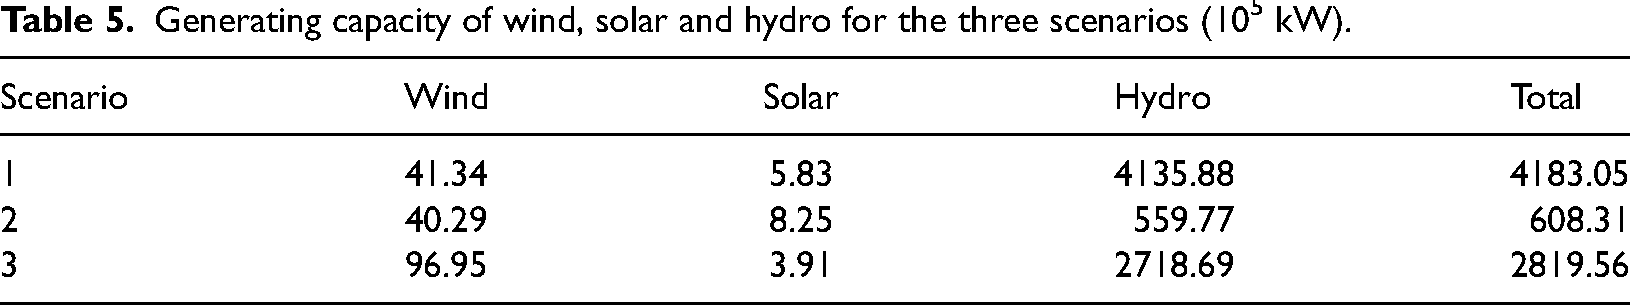
Due to the goals of WSHS are to optimize investment profit, initial investment volume and investment risk, this paper selected three scenarios with typical goals for further analysis. Namely, the scenarios of maximum investment profit, minimum initial investment volume and minimum investment risk in Table 4. According to Supplemental Table A.1 and Table A.2, the generating capacity of wind, solar and hydro for the three scenarios are calculated, as shown in Table 5.
Generating capacity of wind, solar and hydro for the three scenarios (105 kW).
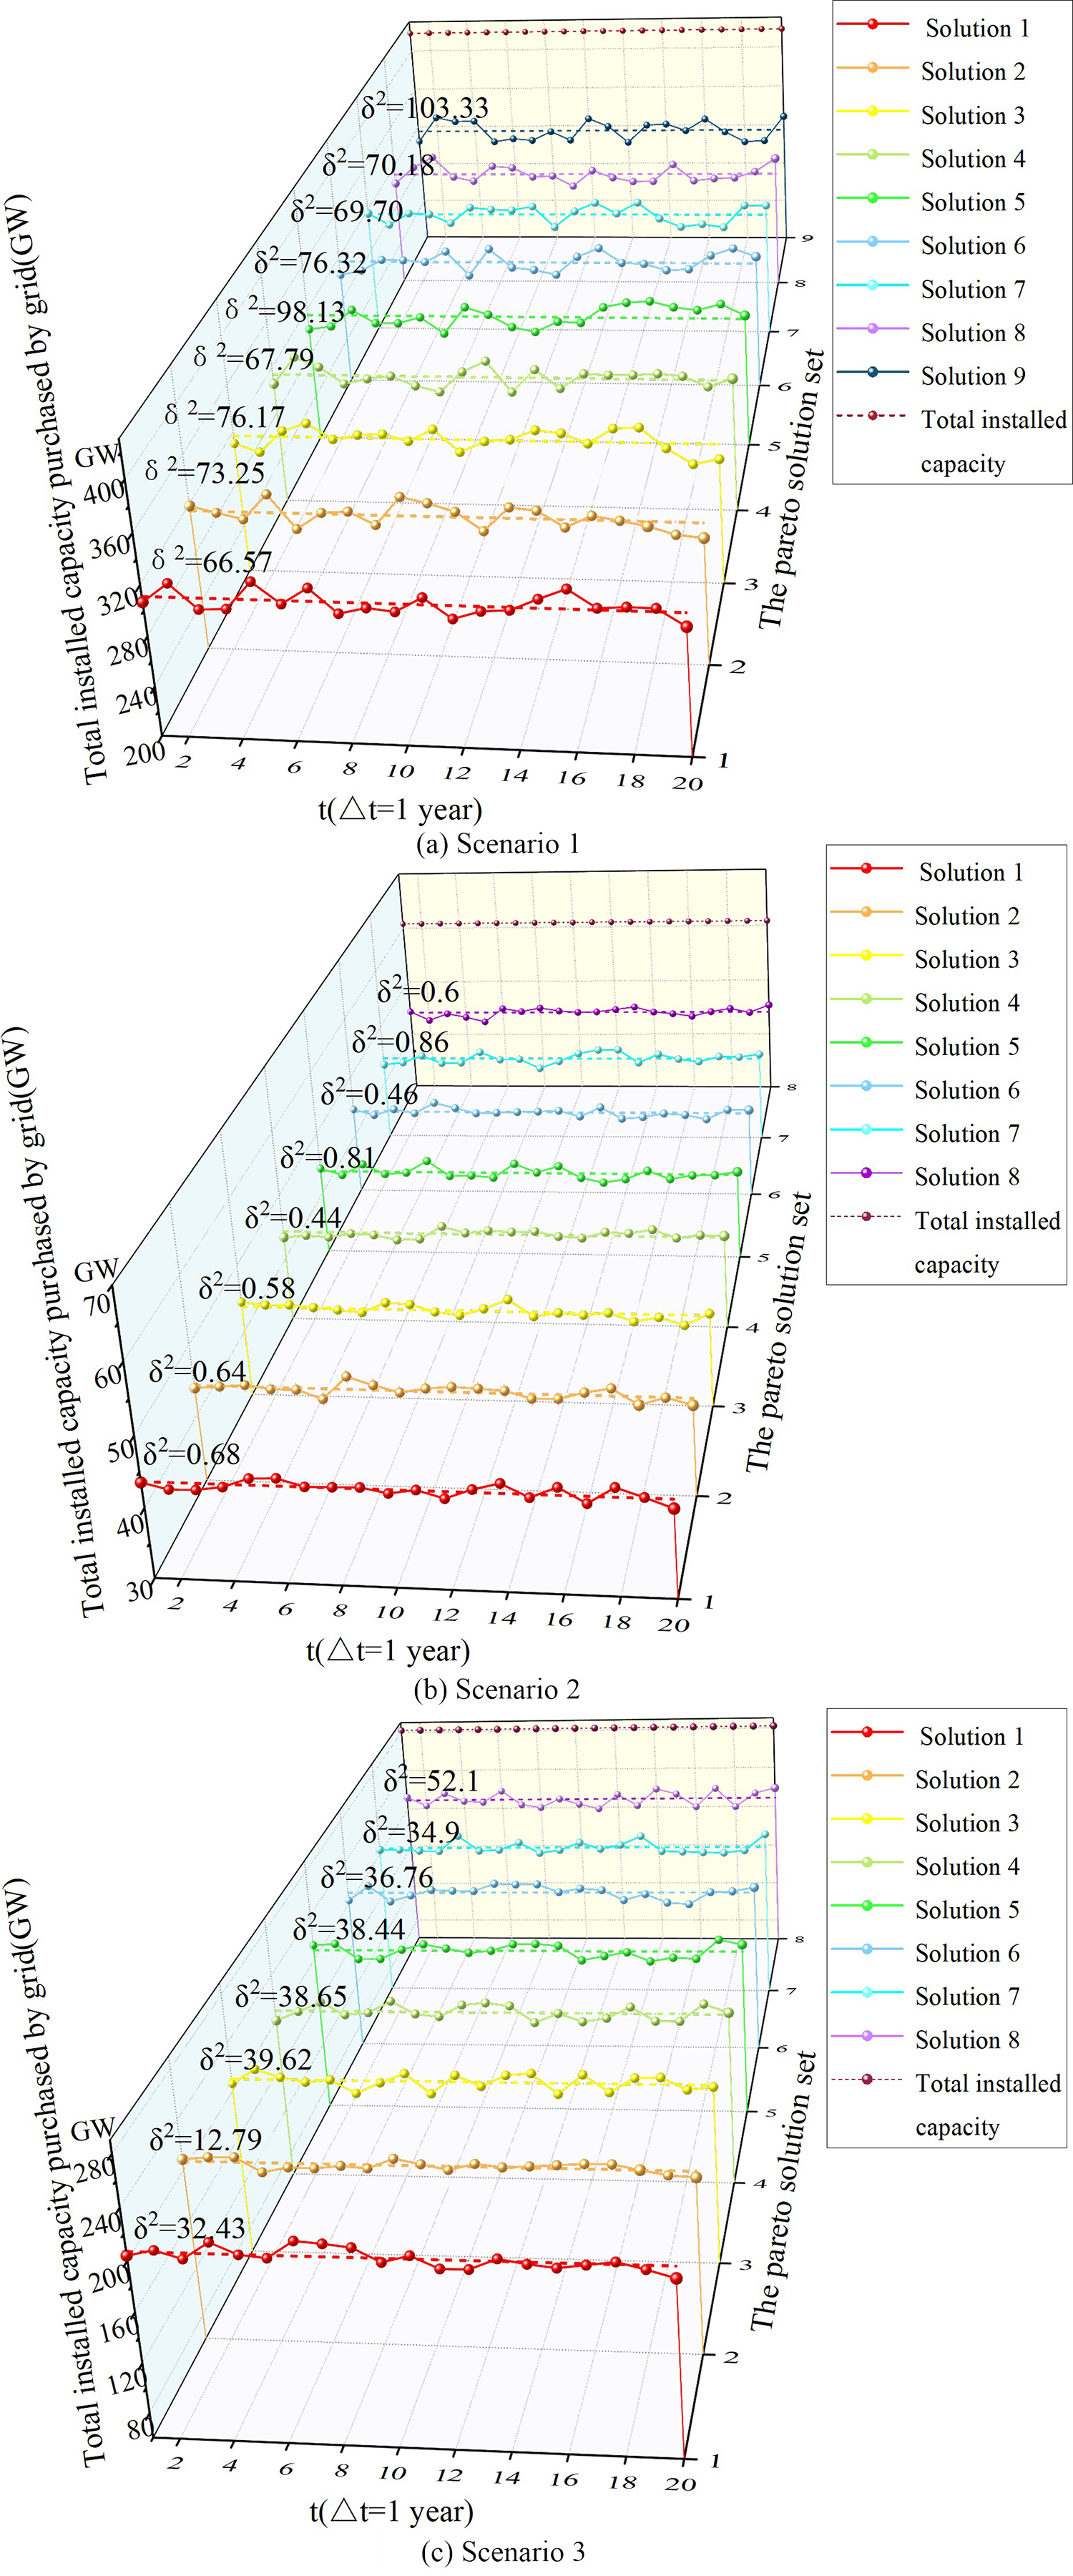
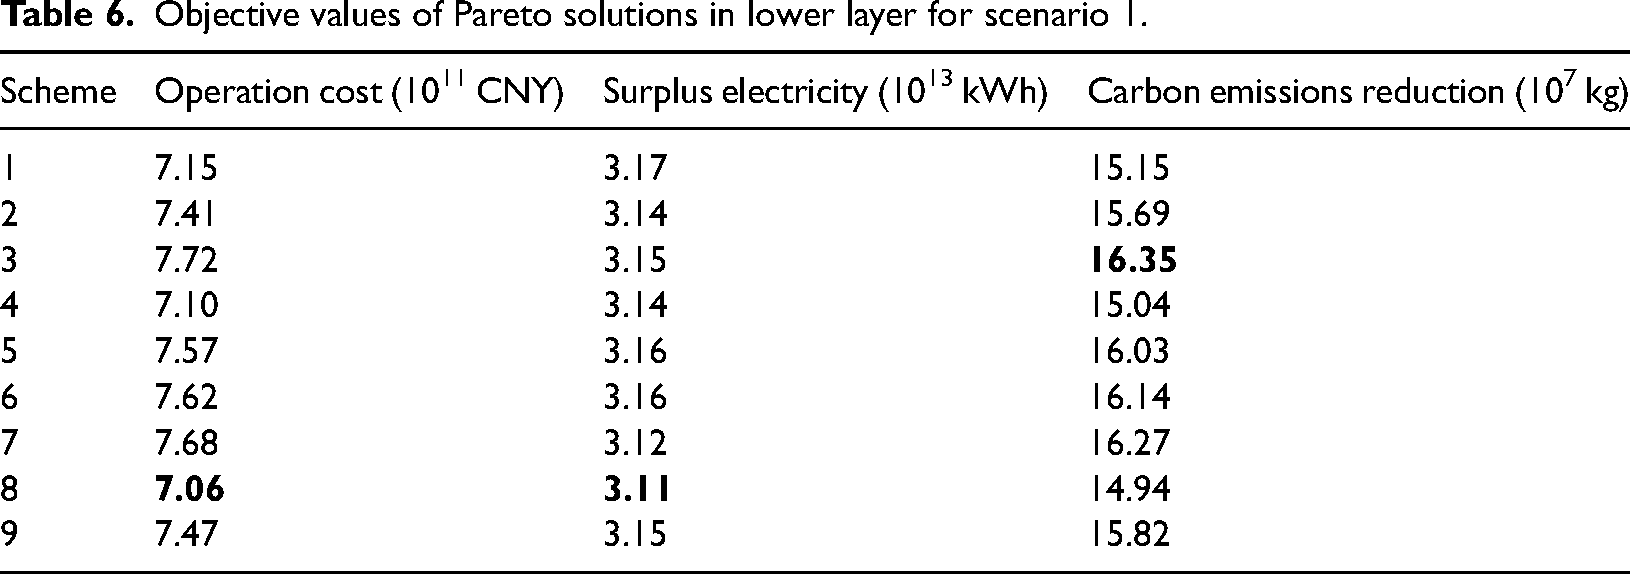
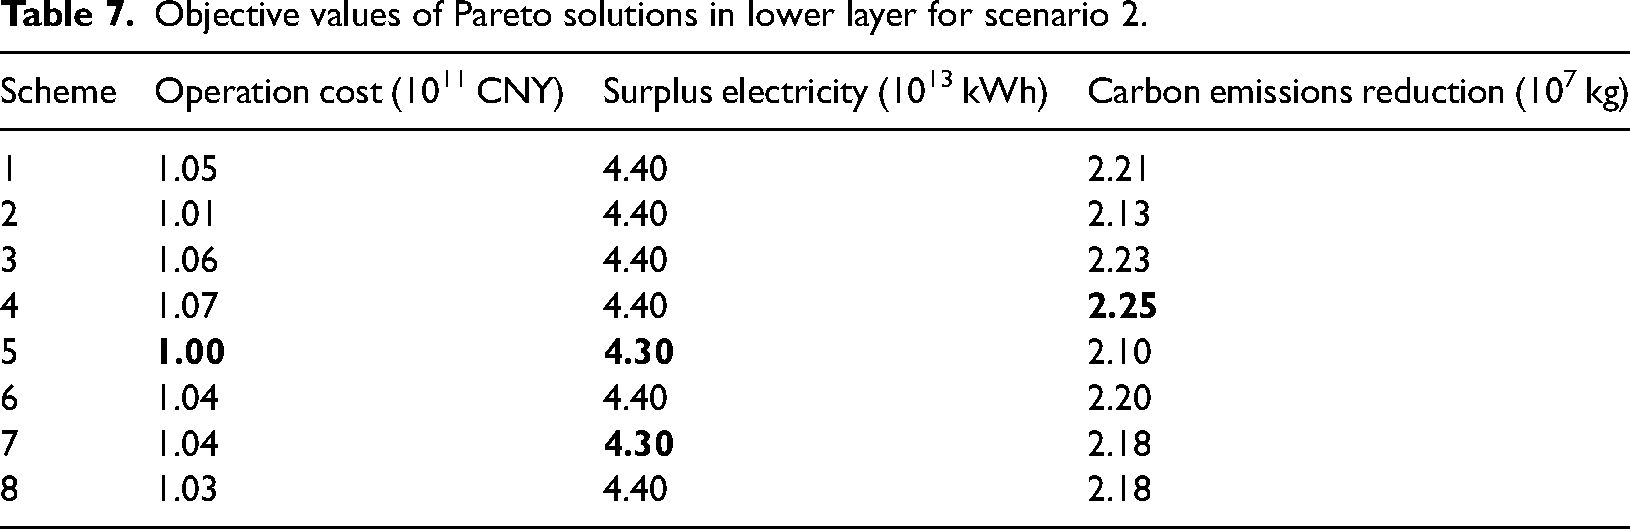
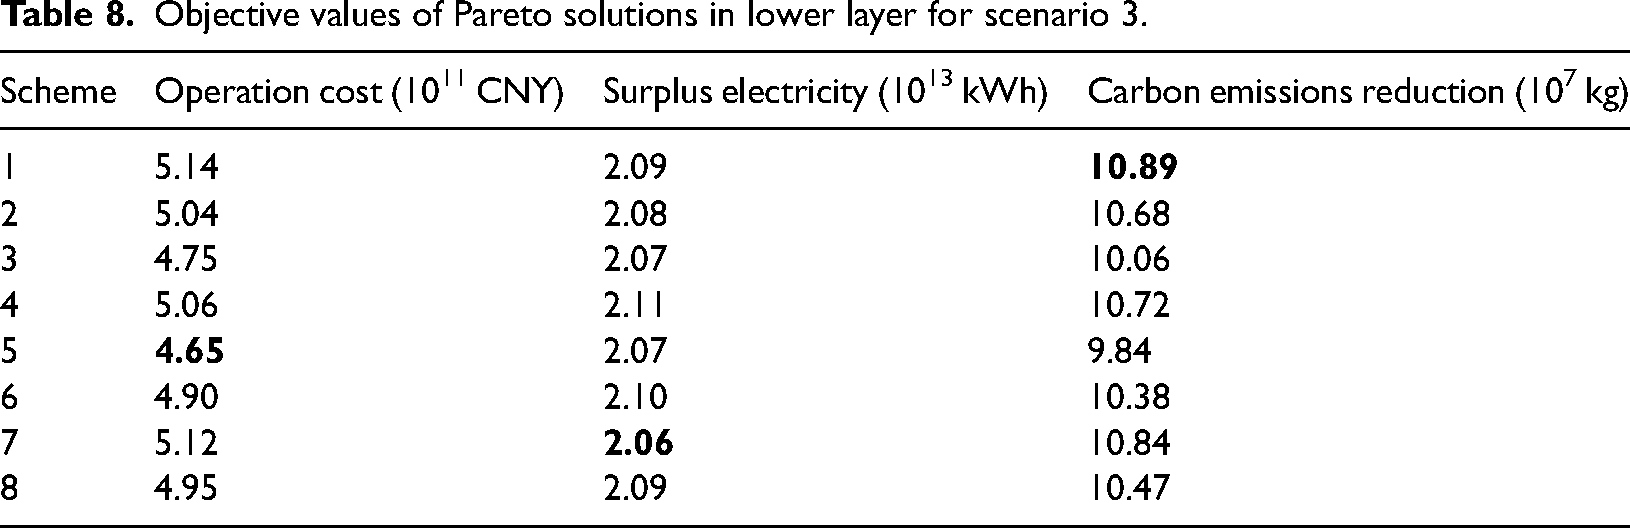
The objective values of Pareto solutions in lower layer for the three scenarios are presented in Tables 6 to 8, respectively. And their corresponding Pareto solutions are shown in Figure 9.
Quantity of electricity purchase by power grid for the three scenarios.
Objective values of Pareto solutions in lower layer for scenario 1.
Objective values of Pareto solutions in lower layer for scenario 2.
Objective values of Pareto solutions in lower layer for scenario 3.
To sum up, the method proposed in this paper can offer satisfactory solutions for decision-makers who pursue different goals. That is, in this case, if decision-makers in upper layer want to achieve maximum investment profit, they can choose scenario 1. If they pursue minimum initial investment volume, choose scenario 2. If they seek minimum investment risk, choose scenario 3. Correspondingly, decision-makers in lower layer can also choose their satisfied scheme. However, some decision-makers always expect to obtain a more compromise between the goals. On the basis of this paper, it can be achieved by setting weight coefficient for each objective and then calculating the expected value. But the weight coefficient needs to be determined by decision-makers in combination with the actual situation.
Comprehensive discussions
Effectiveness evaluation
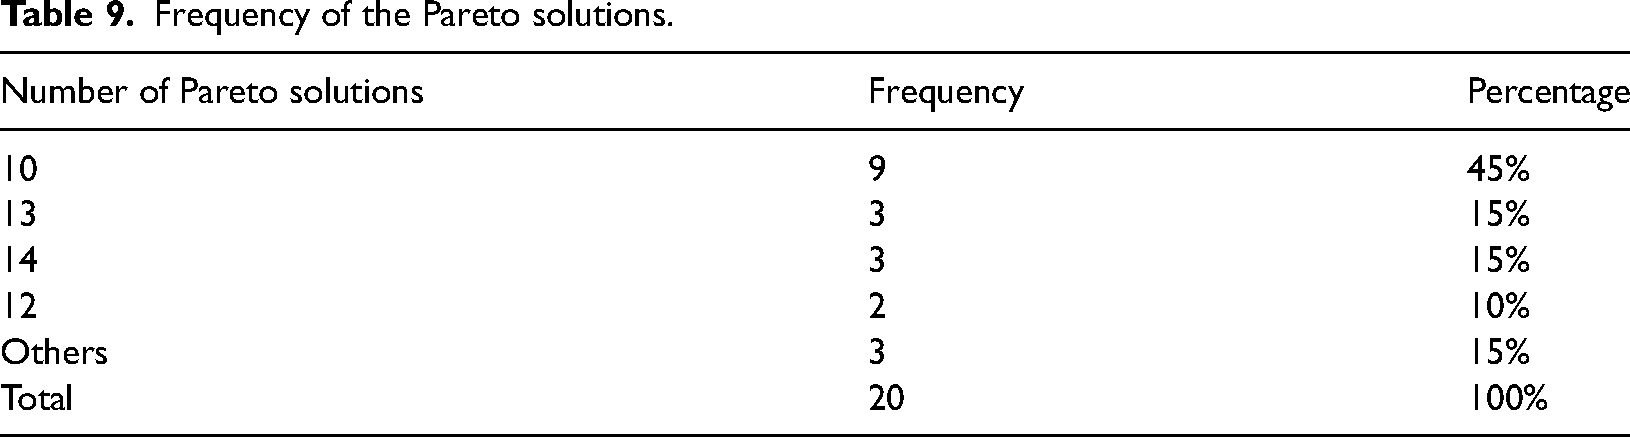
Pareto solutions were selected in this paper based on 20 tests to avoid accidental events. Although other potential situations may arise, this paper selected one of the results that occurred most frequently. The test statistics are recorded in Table 9. It shows that the proportion of Pareto solutions with ten is up to 45%.
Frequency of the Pareto solutions.
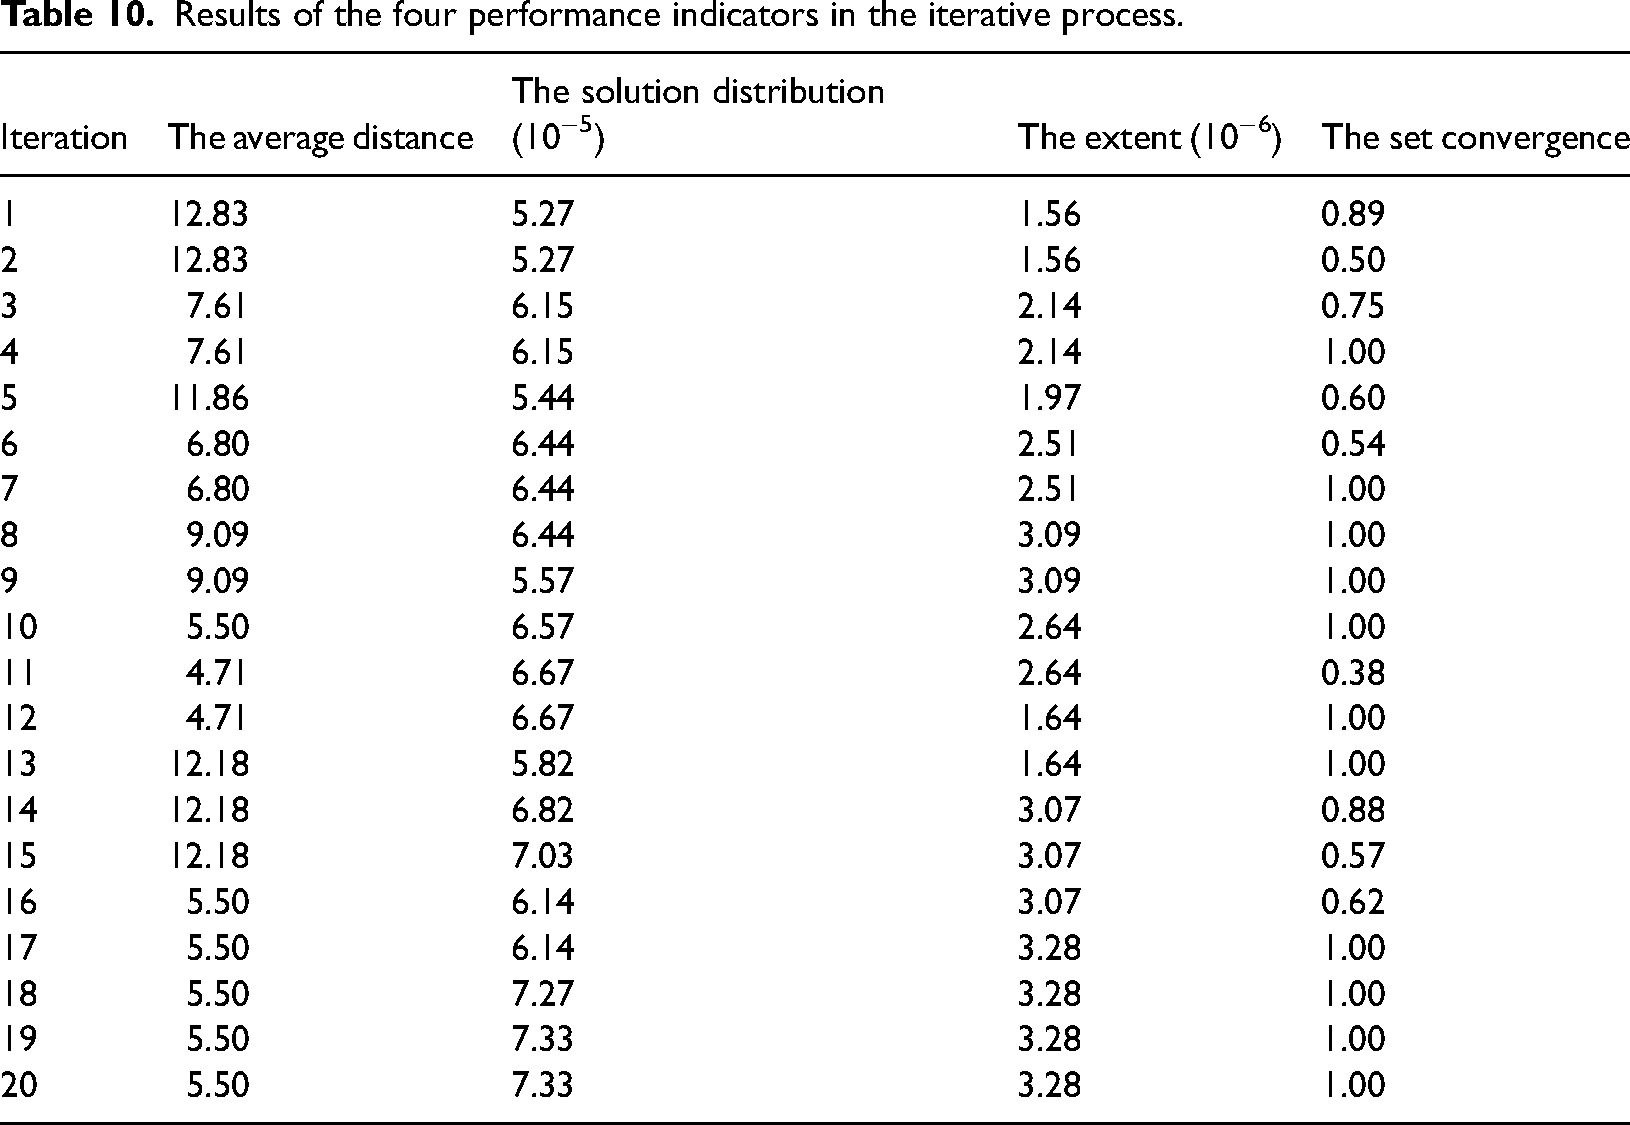
To further demonstrate the effectiveness of the results obtained in this paper, according to the four performance indicators,45,46 a set of valid results with 10 Pareto solutions were selected. The four performance indicators of the iterative process are shown in Table 10. Specifically, with the increasing of iterations, the average distance becomes smaller and smaller, the solution distribution grows larger and larger, the extent gets wider and wider, and the set convergence tends to one. It shows that the solutions acquired in this paper are credible and reasonable.
Results of the four performance indicators in the iterative process.
Related propositions
According to the case results, if power stations pursue lower investment volume or investment risk, higher reliability is easier to be achieved. As shown in Figure 9, the variance of scenarios 2 and 3 within 20 years is much lower than scenario 1. In contrast, in scenario 2 has the smallest change. Additionally, the installed capacities of hydropower station are much higher than the wind and solar, as shown in Table 5. That means even though hydropower has its inherent disadvantages, it still helps control investment volume and investment risk. Nevertheless, to avoid the future hazard, it is essential to mitigate hydro development. People urgently need to improve wind and solar power generation technology, rather than just using hydropower to regulate.
The results show that generating capacity increases with the increase of initial investment volume. Specifically, in Table 4, the initial investment volume of scenario 1 is the largest (3.247 × 10¹² CNY), and scenario 2 is the least (0.639 × 10¹² CNY). In Table 5, the generating capacity of scenario 1 is the highest (4183.05 × 105 kW), and scenario 2 is the lowest (608.31 × 10⁵ kW). However, the investment profit does not rise with the increase of investment risk. For example, the investment profit of scenario 1 is the largest (6.443 × 10¹² CNY), but its investment risk is not the biggest It means the larger investment profit with smaller investment risk can be realized simultaneously for REs investors.
As shown in Tables 6 to 8, carbon emissions reduction of all schemes in scenario 1 are greater than each scheme in other two scenarios. However, surplus electricity of all schemes in scenario 3 are lower than other two. Besides, in scenario 3 has the larger carbon emissions reduction and higher operating capacity with the small fluctuation, as shown in Figure 9. It is doubtlessly better for the operation of both power stations and power grid than other two scenarios. This is caused by the influence on power grid from the power station's decision preference considering risk prevention. Thus, cooperation is a necessary to realize a win-win situation.
Management recommendations
Portfolio re-equilibrium for REs based on WSHS and power grid is an effective way to balance the electricity market. If the portfolio decision is determined only by the power stations’ interests, the utilization efficiency and qualities of REs may not meet expectations. Because of considering power grid's electricity demand helps to reduce surplus electricity and increase the stability of the power purchase schemes. Therefore, it is meaningful to balance power market through portfolio re-equilibrium.
Technological improvements in WSHS and power grid need to be continued. Especially wind and solar power generation, thanks to their unstable output, power grid's acceptable proportion is relatively low. Although hydropower can be combined to regulate the power supply, it has inherent disadvantages that is required to be mitigated from a long-term perspective. Consequently, it is necessary to improve the technologies of wind and solar electricity generation.
Policy support is essential to realize sustainable portfolio re-equilibrium on WSHS. To replace fossil fuels and promote sustainable development, developing REs should be encouraged in multi-energy areas. According to the discussions in section 5.4.2, the investment profit did not completely rise with the grow of investment risk. It implies larger investment profit and smaller investment risk can be realized simultaneously. What's more, profit-oriented strategies help to reduce carbon emissions. Therefore, it is necessary to encourage REs development. Secondly, preferential treatment for off-peak power consumption should be strengthened to decrease surplus electricity and improve energy efficiency. Thirdly, advocate the sustainable portfolio of REs and promote the construction of energy complementary system.
Conclusion
To realize sustainable portfolio re-equilibrium on WSHS, this paper proposed an integrated optimization model and verified its feasibility by a case. Then Pareto solutions were obtained for power stations and power grid. According to the three typical scenarios of WSHS, it was found that portfolio strategies provided the potential to advance sustainable development. Secondly, the results showed that generating capacity increased with the increase of initial investment volume. However, the investment profit did not rise with the grow of investment risk. Finally, the results demonstrated that profit-oriented strategies of WSHS contributed to carbon emissions reduction. But its risk-oriented strategies can decrease surplus electricity, and enhance the stability of power purchase schemes.
The paper is original, but there are still some areas worthy of further research. Firstly, it is an important way to optimize power transmission line to improve the electricity generated of REs. Secondly, providing the priority for Pareto solution set is useful to reduce the decision-making burden. Thirdly, as for the project with short investment period, the shorter payback can be taken as the research period. Finally, combined with professional algorithm research, add experimental design.
Supplemental Material
sj-docx-1-eae-10.1177_0958305X221083253 - Supplemental material for Sustainable portfolio re-equilibrium on wind-solar-hydro system: An integrated optimization with combined meta-heuristic
Supplemental material, sj-docx-1-eae-10.1177_0958305X221083253 for Sustainable portfolio re-equilibrium on wind-solar-hydro system: An integrated optimization with combined meta-heuristic by Lu Gan, Dirong Xu, Xiuyun Chen, Pengyan Jiang, Benjamin Lev and Zongmin Li in Energy & Environment
Footnotes
Declaration of conflicting interests
The author(s) declared no potential conflicts of interest with respect to the research, authorship, and/or publication of this article.
Funding
The author(s) disclosed receipt of the following financial support for the research, authorship, and/or publication of this article: This work was supported by the National Natural Science Foundation of China, Sichuan Province Cyclic Economy Research Center, Research Center of Sichuan County Economy Development, Chengdu Science and Technology Bureau, (grant number 72104165, XHJJ-2105, xy2021012, 2019-RK00-00311-ZF).
Supplemental material
Supplemental material for this article is available online.
References
Supplementary Material
Please find the following supplemental material available below.
For Open Access articles published under a Creative Commons License, all supplemental material carries the same license as the article it is associated with.
For non-Open Access articles published, all supplemental material carries a non-exclusive license, and permission requests for re-use of supplemental material or any part of supplemental material shall be sent directly to the copyright owner as specified in the copyright notice associated with the article.