
Abstract
This paper constructs a unique dataset of clean energy and adopts static panel models and dynamic panel specifications to explore the correlation between clean energy and CO2 emissions. Furthermore, this paper employs the interaction term of pilot areas and pilot time as the proxy of emission trading policy to examine the effect of China’s emission trading pilot on clean energy. Then, this paper conducts quasi-natural experiments on CO2 emissions. Our findings show a negative correlation between CO2 emissions and clean energy. We also find that China’s emission trading pilot has a significant impact on promoting clean energy. In addition, empirical results affirm that emission trading market pilots can help decrease CO2 emissions. Finally, we put forwards relevant policy recommendations.
Introduction
China has had rapid and sustained growth at the expense of excessive energy consumption and environmental pollution since its economic reforms in the late 1970s. 1 By the early 1980s, China was suffering from black smoke from heavy industry. In the 21st century, the rapid advancement of industrialization and economic development has led to increased energy use and greenhouse gas emissions. Thus, China’s air pollution problem has become more acute. Fossil energy use is a core source of carbon dioxide emissions, and approximately 80% of carbon dioxide emissions are caused by fossil energy. 2 The extreme climate change and environmental crisis caused by carbon emissions have attracted the Chinese government’s attention. China’s central and local governments have already planned to replace fossil energy use and reduce emissions of greenhouse gases in response to environmental pollution and global warming. 1 On the one hand, the China Energy Administration has said that China would vigorously develop clean energy during the 14th Five-Year Plan period. Clean energy refers to energy that does not emit pollutants and can be directly used for production and life. It includes nuclear energy and renewable energy. 3 In addition, the definition of clean energy has three aspects: one, clean energy describes the technical system of energy utilization, which is not a simple classification of energy; two, clean energy values cleanliness and economy; and three, clean energy complies with certain emission standards. 4 According to the China Energy Administration, clean energy consumption in China will account for 80% of the total energy consumption in the next five years. 2 On the other hand, the carbon emission trading mechanism based on the market mechanism effectively reduces CO2 and other greenhouse gas emissions. In October 2011, the China Nation Development and Reform Commission issued the Notice on Carbon Emission Trading Pilot Work, which approved Chongqing, Beijing, Shenzhen, Shanghai, Hubei, Guangdong, and Tianjin to launch carbon trading pilots. 5 After nearly ten years of piloting, on July 16, 2021, the emissions trading market was officially launched in China. 3 The emissions trading market allows firms with lower carbon emissions to trade on the premise that the total emissions specified by carbon emissions trading are not exceeded. A firm’s right to emit a certain amount of carbon dioxide turns into a trading commodity. Carbon emissions trading is an important mechanism for employing a market economy to reduce emissions of greenhouse gases and promote environmental protection. Thus, research on emission trading policies, clean energy, and CO2 emission reduction has crucial strategic significance.
In the following research, we use the following methods: One, we employ static panel models and dynamic panel specifications to study the correlation between clean energy and CO2 emissions; two, we use the interaction term of pilot areas and pilot time as the proxy of emission trading policy; and three, we exploit the difference-in-differences (DID) model and the propensity score matching-DID (PSM-DID) method to study the impact of the emission trading pilot on CO2 emissions.
This paper is dedicated to finding effective ways to reduce carbon emissions, thereby protecting the environment. First, we exploit static panel models and dynamic panel specifications to study the correlation between clean energy and CO2 emissions. We prove that clean energy development can help reduce carbon dioxide emissions. Since clean energy can help reduce carbon dioxide emissions, we further study how to accelerate clean energy development to reduce carbon dioxide emissions effectively and whether the emission trading policy is conducive to reducing carbon emissions. Thus, in the next sections, we use the interaction term of pilot areas and pilot time as the proxy of emission trading policy to study the effects of emission trading policy on clean energy and the policy effect of emission trading policy on CO2 emissions. We prove through empirical analysis that the carbon emissions trading policy can promote clean energy development. In addition, we further find that the carbon emissions trading policy can not only directly reduce CO2 emissions but also indirectly reduce carbon emissions by promoting the development of clean energy. The innovations in this paper are as follows: First, this paper combines clean energy, emissions trading policy, and CO2 emission reduction to explore the relationship between energy use and environmental protection, providing a new perspective for related research. Second, this paper uses the interaction term of pilot areas and pilot time as the proxy of emission trading policy and introduces it into the fixed effects model, providing a way to measure specific policies. Third, this paper uses PSM-DID methods and employs (difference and system) GMM to estimate the dynamic panel model, reducing the impact of endogeneity on the results.
Related literature
Emission trading scheme, energy, and Co2 emissions
Several studies have been published on the correlation between emission trading policy, energy, and renewable energy. Streimikiene and Roos 6 found that the emission trading policy would increase investments in renewable energy sources. Möst and Fichtner 7 indicated that the promotion of renewable energy led to a decrease in the scarcity of CO2-emission allowances. Lin and Jia 8 used a dynamic recursive computable general equilibrium model with multiple sectors to examine different emission trading scheme (ETS) revenue distribution strategies and found that an ETS with no renewable energy subsidy would reduce energy demand, increase the cost of renewable energy sources, and reduce generation. Ma et al. 9 developed an analysis of the dynamic linkage mechanism of China’s carbon emission trading market, energy market, and capital market based on the DCC-MVGARCH model. Many recent studies have shown ETS’s impact on traditional energy and renewable energy; however, minimal attention has been devoted to the impact of ETS on clean energy.
Some scholars have mainly been interested in questions concerning CO2 emissions from energy use. Al-mulali and Binti Che Sab 10 indicated that energy consumption enables high economic and financial development. However, high levels of development increased CO2 emissions. Shahbaz et al. 11 pointed out that financial development and trade openness shrink CO2 emissions, while economic growth and energy consumption increase CO2 emissions. Mahdi Ziaei 12 used panel vector autoregression models to explore how financial indicators can affect energy consumption and CO2 emissions, highlighting the role of both variables in explaining deviations, with only the degree of impact varying. Shahzad et al. 13 revealed an inverted U-shaped relationship between carbon emissions and energy consumption. Ehigiamusoe and Lean 14 found that energy consumption, economic growth, and financial development negatively affect carbon emissions in 122 countries. Khan et al. 15 exploited the dynamic ARDL simulation model to examine how globalization, economic issues, and energy use affect CO2 emissions in Pakistan. According to them, energy consumption in Pakistan positively impacts CO2 emissions.
Clean energy and Co2 emissions
Some recent studies16–18 have shown that clean energy favours CO2 emission reduction. Maji 17 studied the effect of clean energy on CO2 emissions using the renewable energy index as a clean energy measure. They analysed data for 42 sub-Saharan countries using the system generalized method of moments (GMM), indicating that increased renewable energy usage in the area would dampen CO2 emissions. Ahmed et al., 16 used the ARDL technique to show that an increase in clean energy consumption reduces per capita CO2 emissions. Ummalla and Goyari 18 investigated the economic growth and CO2 emissions effects of clean energy consumption within the environmental Kuznets curve hypothesis framework. The results showed that clean energy consumption and economic growth significantly negatively impact CO2 emissions. However, 19 employed a newly developed bootstrap ARDL bounds test and found no cointegration among real GDP per capita, clean energy consumption, and CO2 emissions in Canada, France, Italy, the US, and the UK. In addition, using data for Norway and New Zealand, 20 revisited the energy-growth nexus by taking into account the effect of clean energy, CO2 emissions, and technological innovations. Clean energy use does reduce emissions of greenhouse gases at the expense of economic growth, according to researchers. Rahman and Alam 21 found that the use of clean energy improved the environmental quality.
Emission trading scheme and Co2 emissions
Researchers have attempted to assess the effect of ETCs on CO2 emissions. Anger 22 found that the European Emission Trading Scheme would result in a 7.4% reduction in air transport CO2 emissions based on the Energy-Environment-Economy Model for Europe. Dutch power production and generation portfolios have relatively small and late effects on CO2 emissions from emission trading. 23 Jiang et al., 24 concluded that Shenzhen’s ETS was designed with a mechanism for postadjustment caps, which minimizes the impact of economic fluctuations on the scheme’s stability by slowing emission growth. Nguyen et al., 25 identified that the carbon trading scheme of Japan could engender a 42% reduction in emissions without resilience constraints and 34% incorporating a best-mix, resilient approach. Gu et al., 26 studied the effect of the Maritime Emissions Trading Scheme (METS) on fleet operations and their CO2 emissions. In the short term, they found that low bunker prices, high allowance costs, or global METS coverage can all lead to a significant decrease in CO2 emissions. Using the DID approach, Hu et al., 1 examined how China’s CO2 ETS affects energy conservation and emissions. According to the study, the carbon ETS reduces the energy use and CO2 emissions of the regulated industries in pilot areas by 22.8% and 15.5%, respectively, compared to nonpilot areas. Shen et al., 27 employed the PSM-DID to explore the causal effect of ETS. They suggested that ETS is conducive to carbon emissions reduction, but the effect attenuates over time. Zhang et al., 5 developed the full DEA evaluation model for estimating the efficiency of carbon ETMs. They showed that implementing the carbon trading policy significantly reduces the emissions (24.2%) of industrial CO2. Zhang et al., 28 found that China’s ETS pilot policy significantly improves regional carbon equality. Chen and Lin 29 identified the role of China’s ETS in promoting and reducing emissions, which is regarded as a valid policy tool to facilitate carbon neutrality.
Discussion
In summary, most scholars are concerned about the impact of traditional energy use on CO2 emissions. A few scholars have studied the association between emission trading policy and investments in renewable energy use, the influence of renewable energy on CO2 emission allowances, and the relationship between the ETS’s renewable energy subsidy and energy demand. In addition, little research has explored the influence of CO2 emissions under China’s clean energy and emission trading policy. On the one hand, very few researchers are devoted to the impact of ETCs on clean energy. Existing research shows that much of the energy literature omits clean energy, which can be directly used for production and life. Some scholars conduct related research on renewable energy as a proxy indicator of clean energy. More energy studies mention only renewable and fossil energy use rather than clean energy use. Current research is not mature in this area, requiring more reliable research. On the other hand, the literature on ETCs and CO2 emissions pays attention to specific industries, such as shipping, power production, and air transport.22,23,26 However, literature related to the association between ETC and regional CO2 emissions is scant. Thus, this paper devotes itself to the literature on the correlation between emission trading policy, clean energy, and regional CO2 emissions.
The contribution of this paper is as follows: we first manually collect a unique dataset of clean energy and employ static panel models and dynamic panel specifications estimated by the (difference) and (system) GMM to explore the correlation between clean energy and CO2 emissions. Second, we use the interaction term of pilot areas and pilot time as the proxy of emission trading policy to explore whether China’s current emission trading policy has a significant promoting effect on clean energy. Third, we study the impact of emission trading on CO2 emissions and explore whether China’s current policy can help CO2 emissions reduction. Finally, we make policy recommendations to policy-makers.
Data description
Main variables
(1) Clean energy (CE). We use the product of the total energy output of each province (municipalities and autonomous regions) and the proportion of clean energy to express clean energy production, which measures the scale of clean energy production (100 million kWh). Because the statistical yearbooks of China’s provinces (municipalities and autonomous regions) contain the total energy production of each region over the years, primary energy (hydropower) accounts for the proportion of total energy production, and other energy sources (nuclear energy, wind energy, geothermal energy, and other clean energy) account for the total energy production proportion. Given the incomplete clean energy data in the statistical yearbooks of some provinces (municipalities and autonomous regions), for the missing data, we use the clean energy production data calculated from the hydropower, nuclear power, wind power, solar, and other clean energy generation data of the provinces (municipalities and autonomous regions) in the China Energy Statistical Yearbook instead.3,30
(2) Carbon dioxide emissions (CO2). The total carbon dioxide emissions include natural gas emissions, raw coal emissions, crude oil emissions, and emissions during cement production. We obtain carbon dioxide data from the Carbon Emission Accounts and Datasets (CEADs). 31
(3) Interaction term
Control variables
(1) Real GDP per capita (RGC). The level of economic development in each region is different. Understanding and grasping a region’s macroeconomic operation can be done effectively by the real GDP per capita. We divide each province’s actual GDP by its total population to determine its real GDP per capita.
(2) Research and development (R&D). A region’s scientific and technological strength and core competitiveness can be evident in the R&D activities it undertakes, including basic research, applied research, and experimental development. The indicator calculation method
33
is
(3) Education level (EDU). Regional energy mix transformation and carbon emission reduction are influenced by the amount of talent a region can provide, and differences in education levels affect the efficiency of regional energy efficiency and emission reduction. As a proxy for education level, we exploit the ratio of the population with a college degree or higher (6 years old and over). 32
(4) Government intervention (GIN). As a proxy for government intervention, we exploit the ratio of local government budget expenditure to GDP as a measure. Local governments can use taxation and subsidies to influence the carbon emissions trading market and clean energy development. The degree of government intervention and regulation on the market varies from region to region, so we use it as a control variable.
According to the data availability, this paper employs panel data from 28 provinces (municipalities and autonomous regions) in China from 2000 to 2016 and takes the logarithm of all variables. Because Ningxia, Hainan, and Tibet data are seriously lacking, these three provinces are not included in the 28 provinces in the sample of this paper. The specific databases used in this paper include the Chinese Statistical Yearbook, CEADs, and the China Energy Statistical Yearbook. Table 1 displays the descriptive statistics and correlation matrix.
Descriptive statistics and correlation matrix of variables.
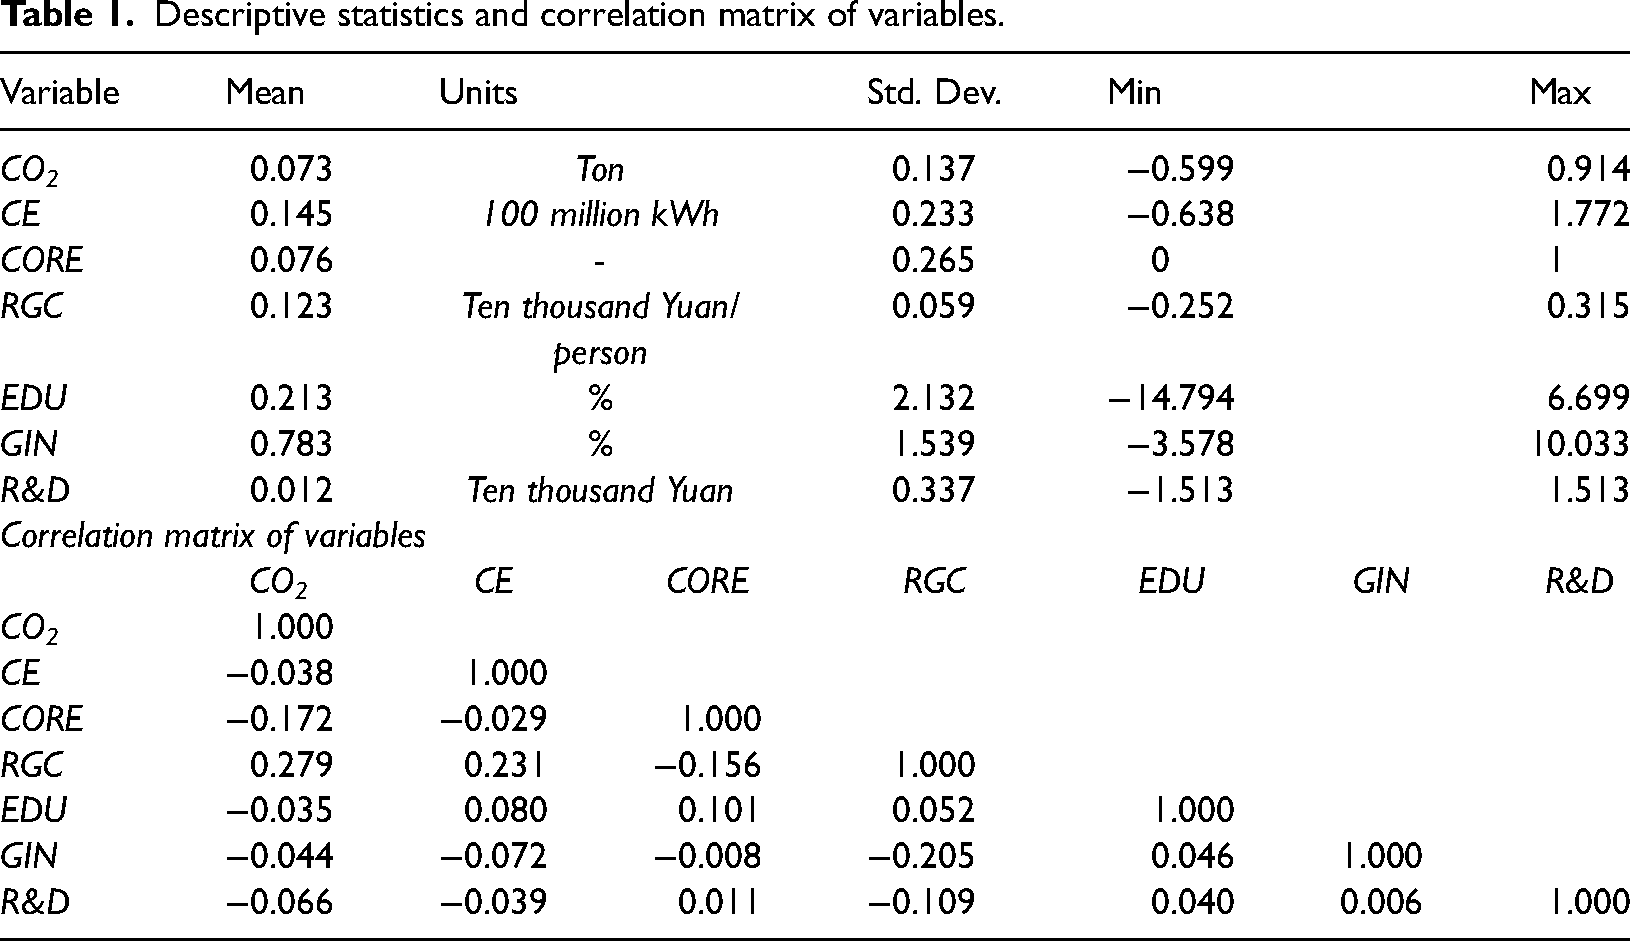
Descriptive statistics and correlation matrix of variables.
Economic data often have nonstationary problems. Using nonstationary data for research will cause pseudoregression problems. Therefore, the data should be tested for stationarity before studying panel data. For nonstationary panel data, it is necessary to make the first difference smooth. 34 The results are shown in Table 2, which uses the Levin-Lin-Chu (LLC) and the Im-Pesaran-Shin (IPS) unit-root tests.
Panel-data unit-root tests.
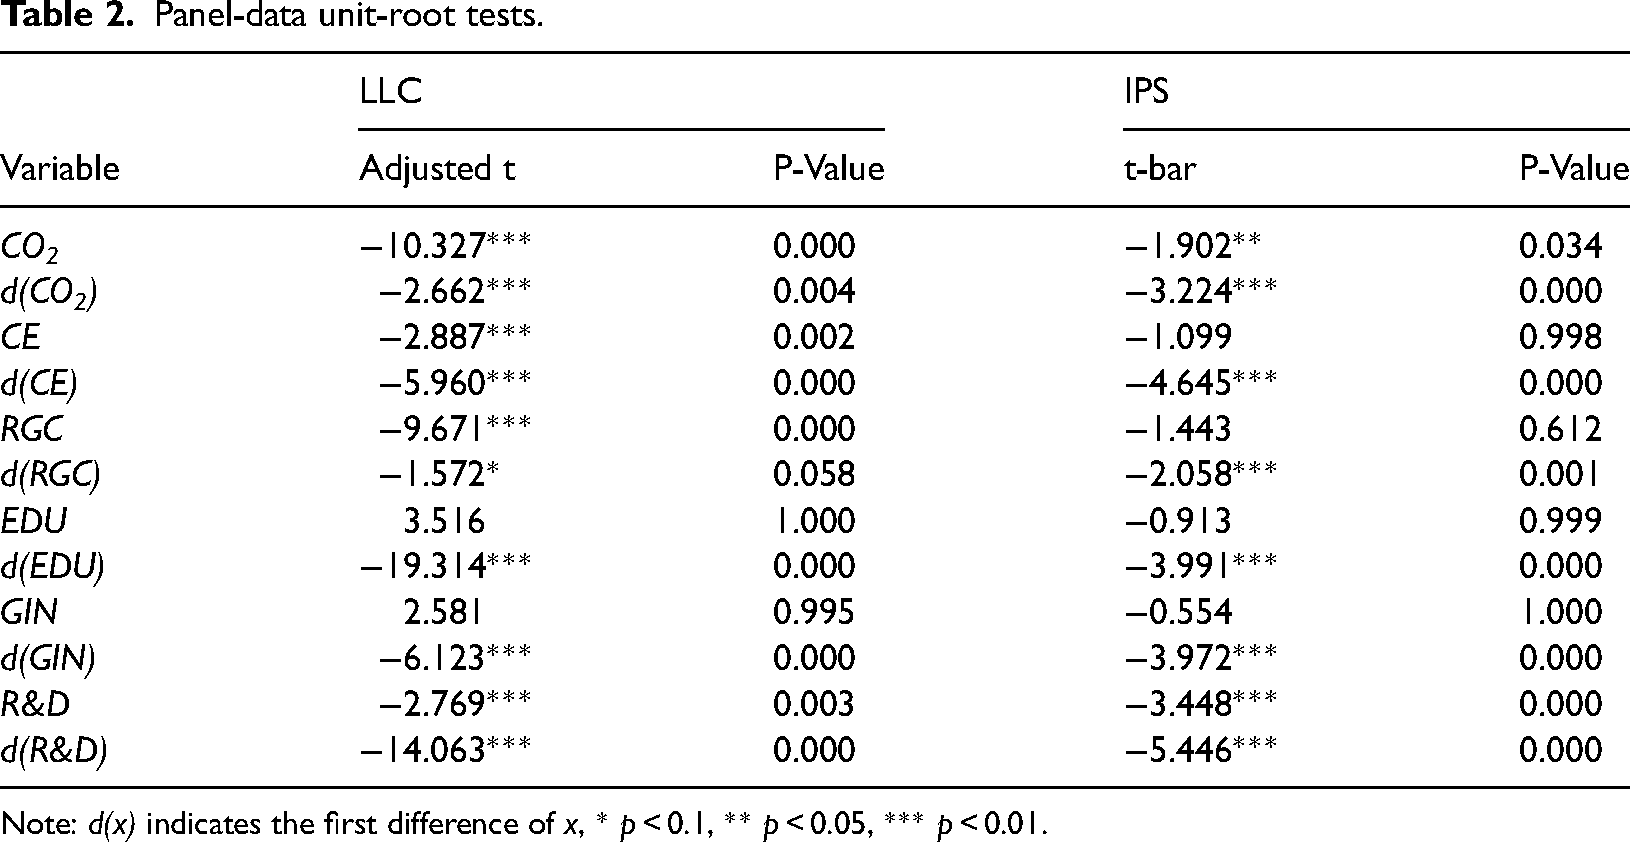
Note: d(x) indicates the first difference of x, * p < 0.1, ** p < 0.05, *** p < 0.01.
Clean energy promotes Co2 emission reduction
As shown in Table 3, a negative relationship is found between carbon dioxide emissions and clean energy. Columns 1 and 3 denote the random and fixed effects model without adding control variables. The coefficients of CE in Columns 1 and 3 are −0.269 and −0.286, respectively. Columns 2 and 4 denote the random and fixed effects model by adding control variables. The coefficients of CE in Columns 2 and 4 are −0.225 and −0.236, respectively. Column 5 represents a dynamic panel specification estimated by the (difference) GMM methodology. Column 6 represents a dynamic panel specification estimated by the (system) GMM methodology. The coefficients of CE in Columns 5 and 6 are −0.124 and −0.134, respectively. The results of Columns 5 and 6 are significant at the p = 0.01 level. First, we consider the results of static panel regression. For the fixed effects and random effects in the static panel, it can be seen from the results of the Hausman test in Column 4 that the p value is 0.002, which refuses the null hypothesis that the random effects are better, so the fixed effects are better than the random effects. Next, we consider the results of dynamic panel GMM regression. The consistency of the difference and system GMM estimators relies on the assumption that the error term does not have a serial correlation problem and the validity of instrument variables. 35
The effect of clean energy on CO2 emissions.
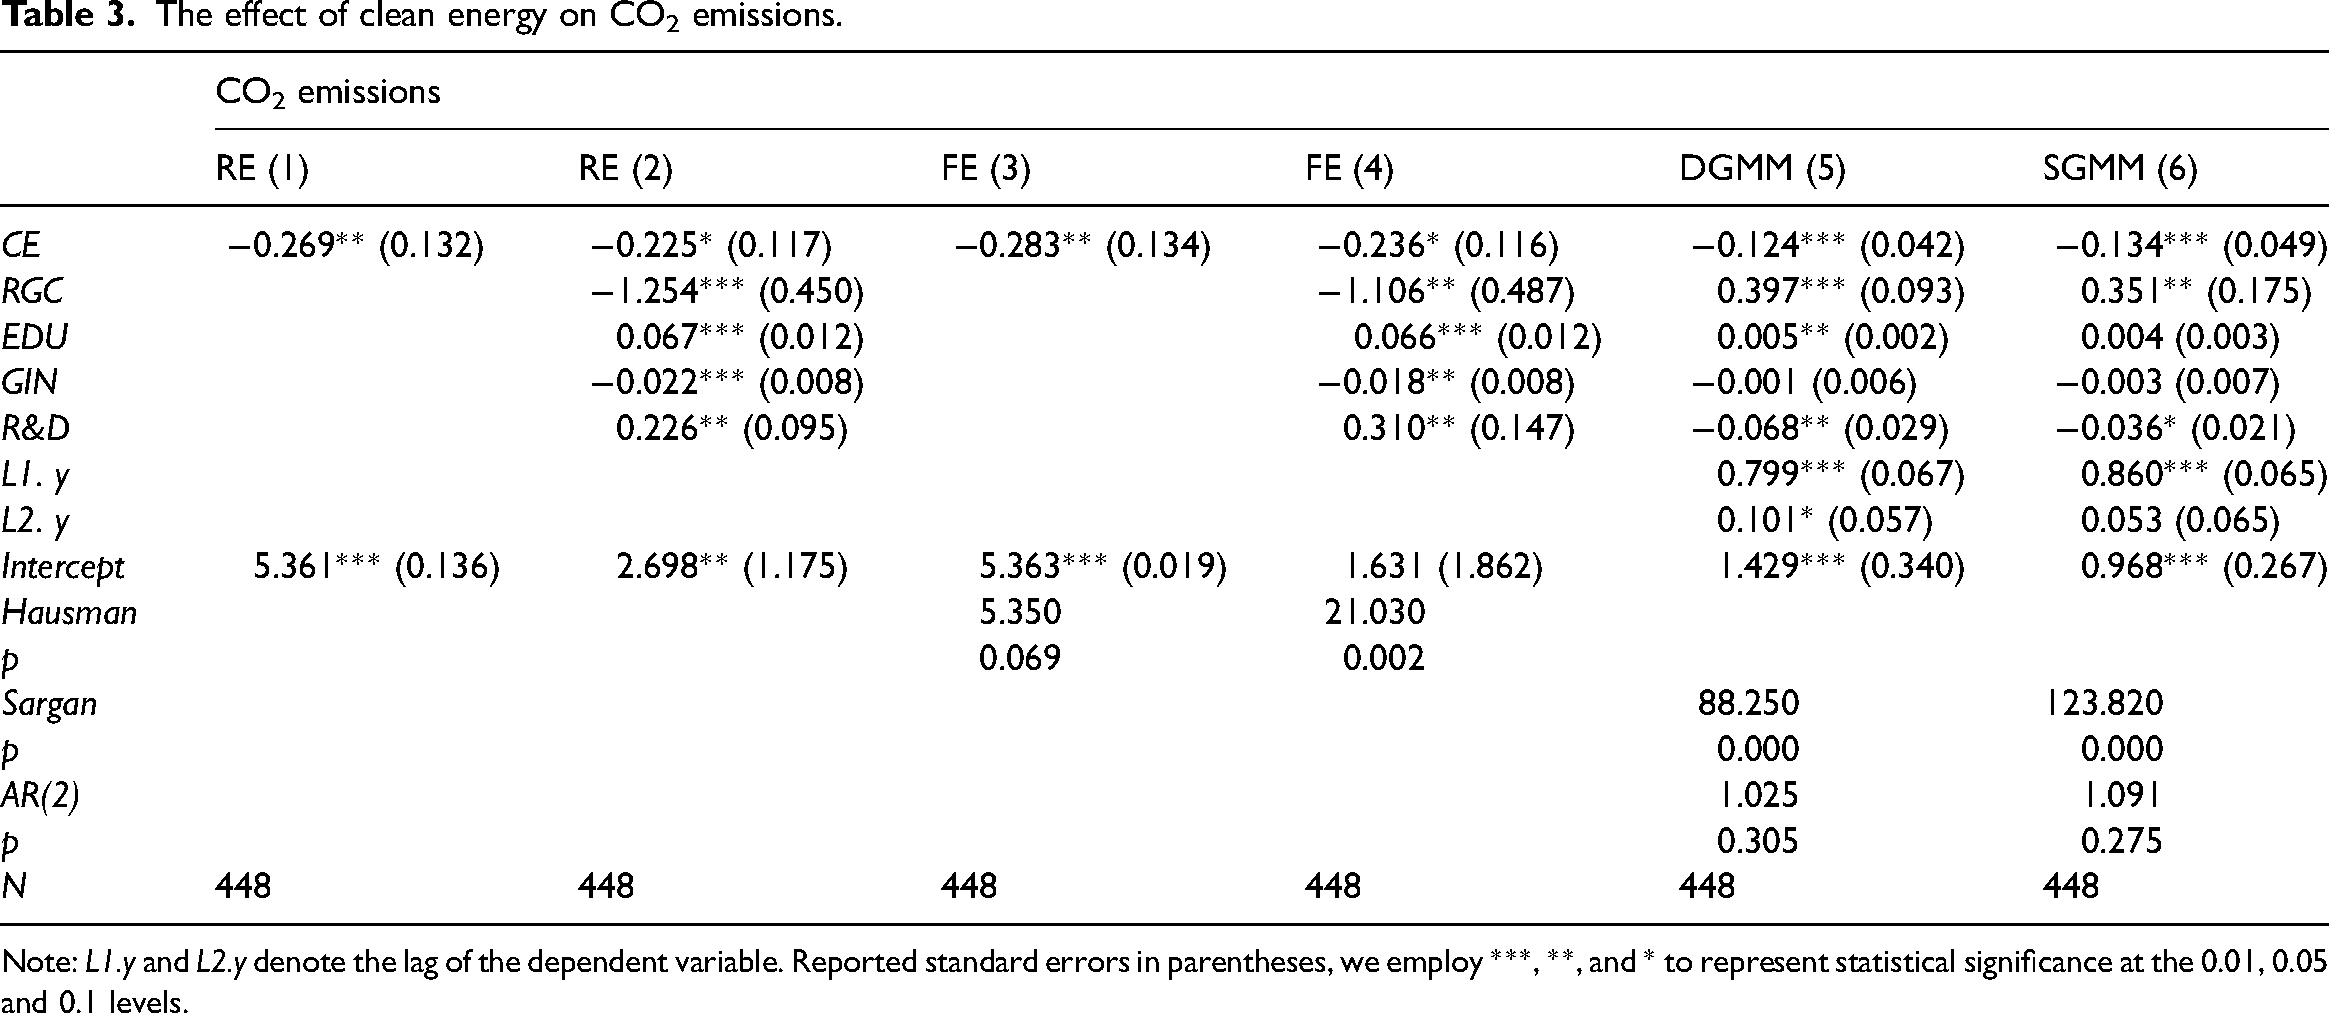
The effect of clean energy on CO2 emissions.
Note: L1.y and L2.y denote the lag of the dependent variable. Reported standard errors in parentheses, we employ ***, **, and * to represent statistical significance at the 0.01, 0.05 and 0.1 levels.
The Arellano–Bond test is employed to detect no serial correlations in the error terms, and the Sargan test is employed to detect instrument variables. 35 At the bottom of Table 3, we display Arellano–Bond and Sargan test results for the difference and system GMM estimations. The results of the Arellano–Bond test indicate that the p value of AR (2) is greater than 0.1, accepting the null hypothesis of “no autocorrelation of disturbance items.” The p values of the Sargan test are all equal to 0, rejecting the null hypothesis that “all instrumental variables are valid” at the 1% significance level, so the instrumental variables selected by the (difference) and (system) GMM method are not valid. Therefore, the fixed effect regression of the static panel is more reliable than the other regression results.
However, it can be seen in Table 3 that regardless of the model, the coefficients of CE are significant and negative in all specifications, implying that the negative correlation between clean energy and CO2 emissions is robust Taken together, the results in Table 3 indicate that there is an association between clean energy and carbon dioxide emissions. Our empirical findings confirm that advancing clean energy use can help reduce carbon dioxide emissions. The results in Table 3 imply important policy implications for conducting clean energy-use strategies in fighting carbon dioxide emissions.
Table 3 shows that the fixed effect regression of the static panel is more reliable than the other regression results. Thus, in Table 4, we exploit the fixed effect regression of the static panel to explore the correlation between emission trading policy and clean energy. As the control variable increases, the coefficient value of the CORE gradually decreases. Table 4 compares the summary statistics for the relationship between emission trading policy and clean energy. The CORE coefficients in Table 4 are 1.278, 1.072, 0.950, 0.945, and 0.926. The results of Table 4 display that the CORE coefficients are significant and positive in all specifications. The interaction term
The impact of emission trading policy on clean energy.
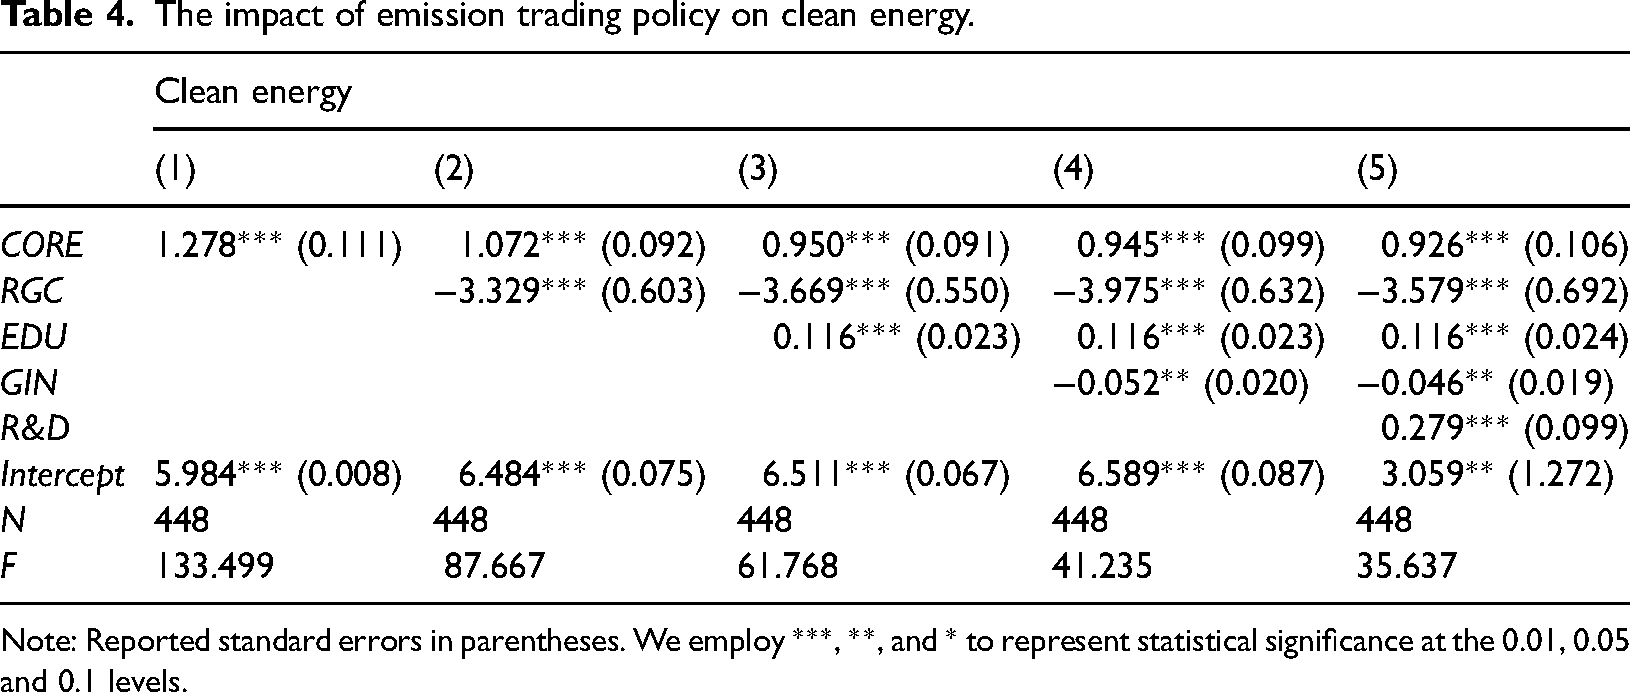
The impact of emission trading policy on clean energy.
Note: Reported standard errors in parentheses. We employ ***, **, and * to represent statistical significance at the 0.01, 0.05 and 0.1 levels.
Our findings indicate a positive correlation between clean energy and the emission trading policy, implying that the emission trading policy promotes clean energy development. The policy pressure of carbon trading in the pilot areas promotes the development of clean energy technologies in these areas, gradually changing the traditional energy consumption structure and accelerating the replacement of traditional energy by clean energy. Therefore, the trading policy is conducive to the development of clean energy. In addition, this paper has proven that clean energy can be conducive to carbon dioxide emissions reduction, as shown in Table 3. Thus, we find that the carbon emissions trading policy can indirectly reduce CO2 emissions by promoting clean energy development. In the next section, this paper further uses the DID model and the PSM-DID method to examine the effect of China’s current emission trading policy on carbon dioxide emissions and explore whether the trading policy can help mitigate carbon dioxide emissions. Our empirical findings are helpful for the government in making decisions regarding carbon dioxide emissions based on greenhouse gas control.
The carbon emission trading system in China has made significant progress.
36
In 2011, China approved seven provinces and cities to carry out carbon trading pilots and started emissions trading pilot work.
5
In policy effects research, the DID model can identify the “policy effect.” In this section, provinces (or municipalities) launching carbon trading pilots are chosen as the treatment group; others are chosen as the control group.
37
If a province (or a municipality) belongs to the pilot areas, then 

The key premise of the DID model is the parallel trend hypothesis. This paper conducts a parallel trend test on the selected treatment group and control group of CO2 emissions, and the method is as follows:
① Graphical method of intuitive judgement. A time trend graph of CO2 emissions in pilot and no pilot areas was drawn.
② Annual dynamic effect analysis. The event research method is employed to test the annual dynamic effects of policy. The specific approach is to take the previous period of 2011 as the base period, construct period dummy variables, multiply each period dummy variable with the policy dummy variable, and incorporate it into the DID model for estimation. The empirical results are shown in Figure 1, Figure 2, and Table 5. The above two inspection methods both indicate that the carbon dioxide emissions of the treatment group and the control group have no difference with the year before the emission trading policy is issued.
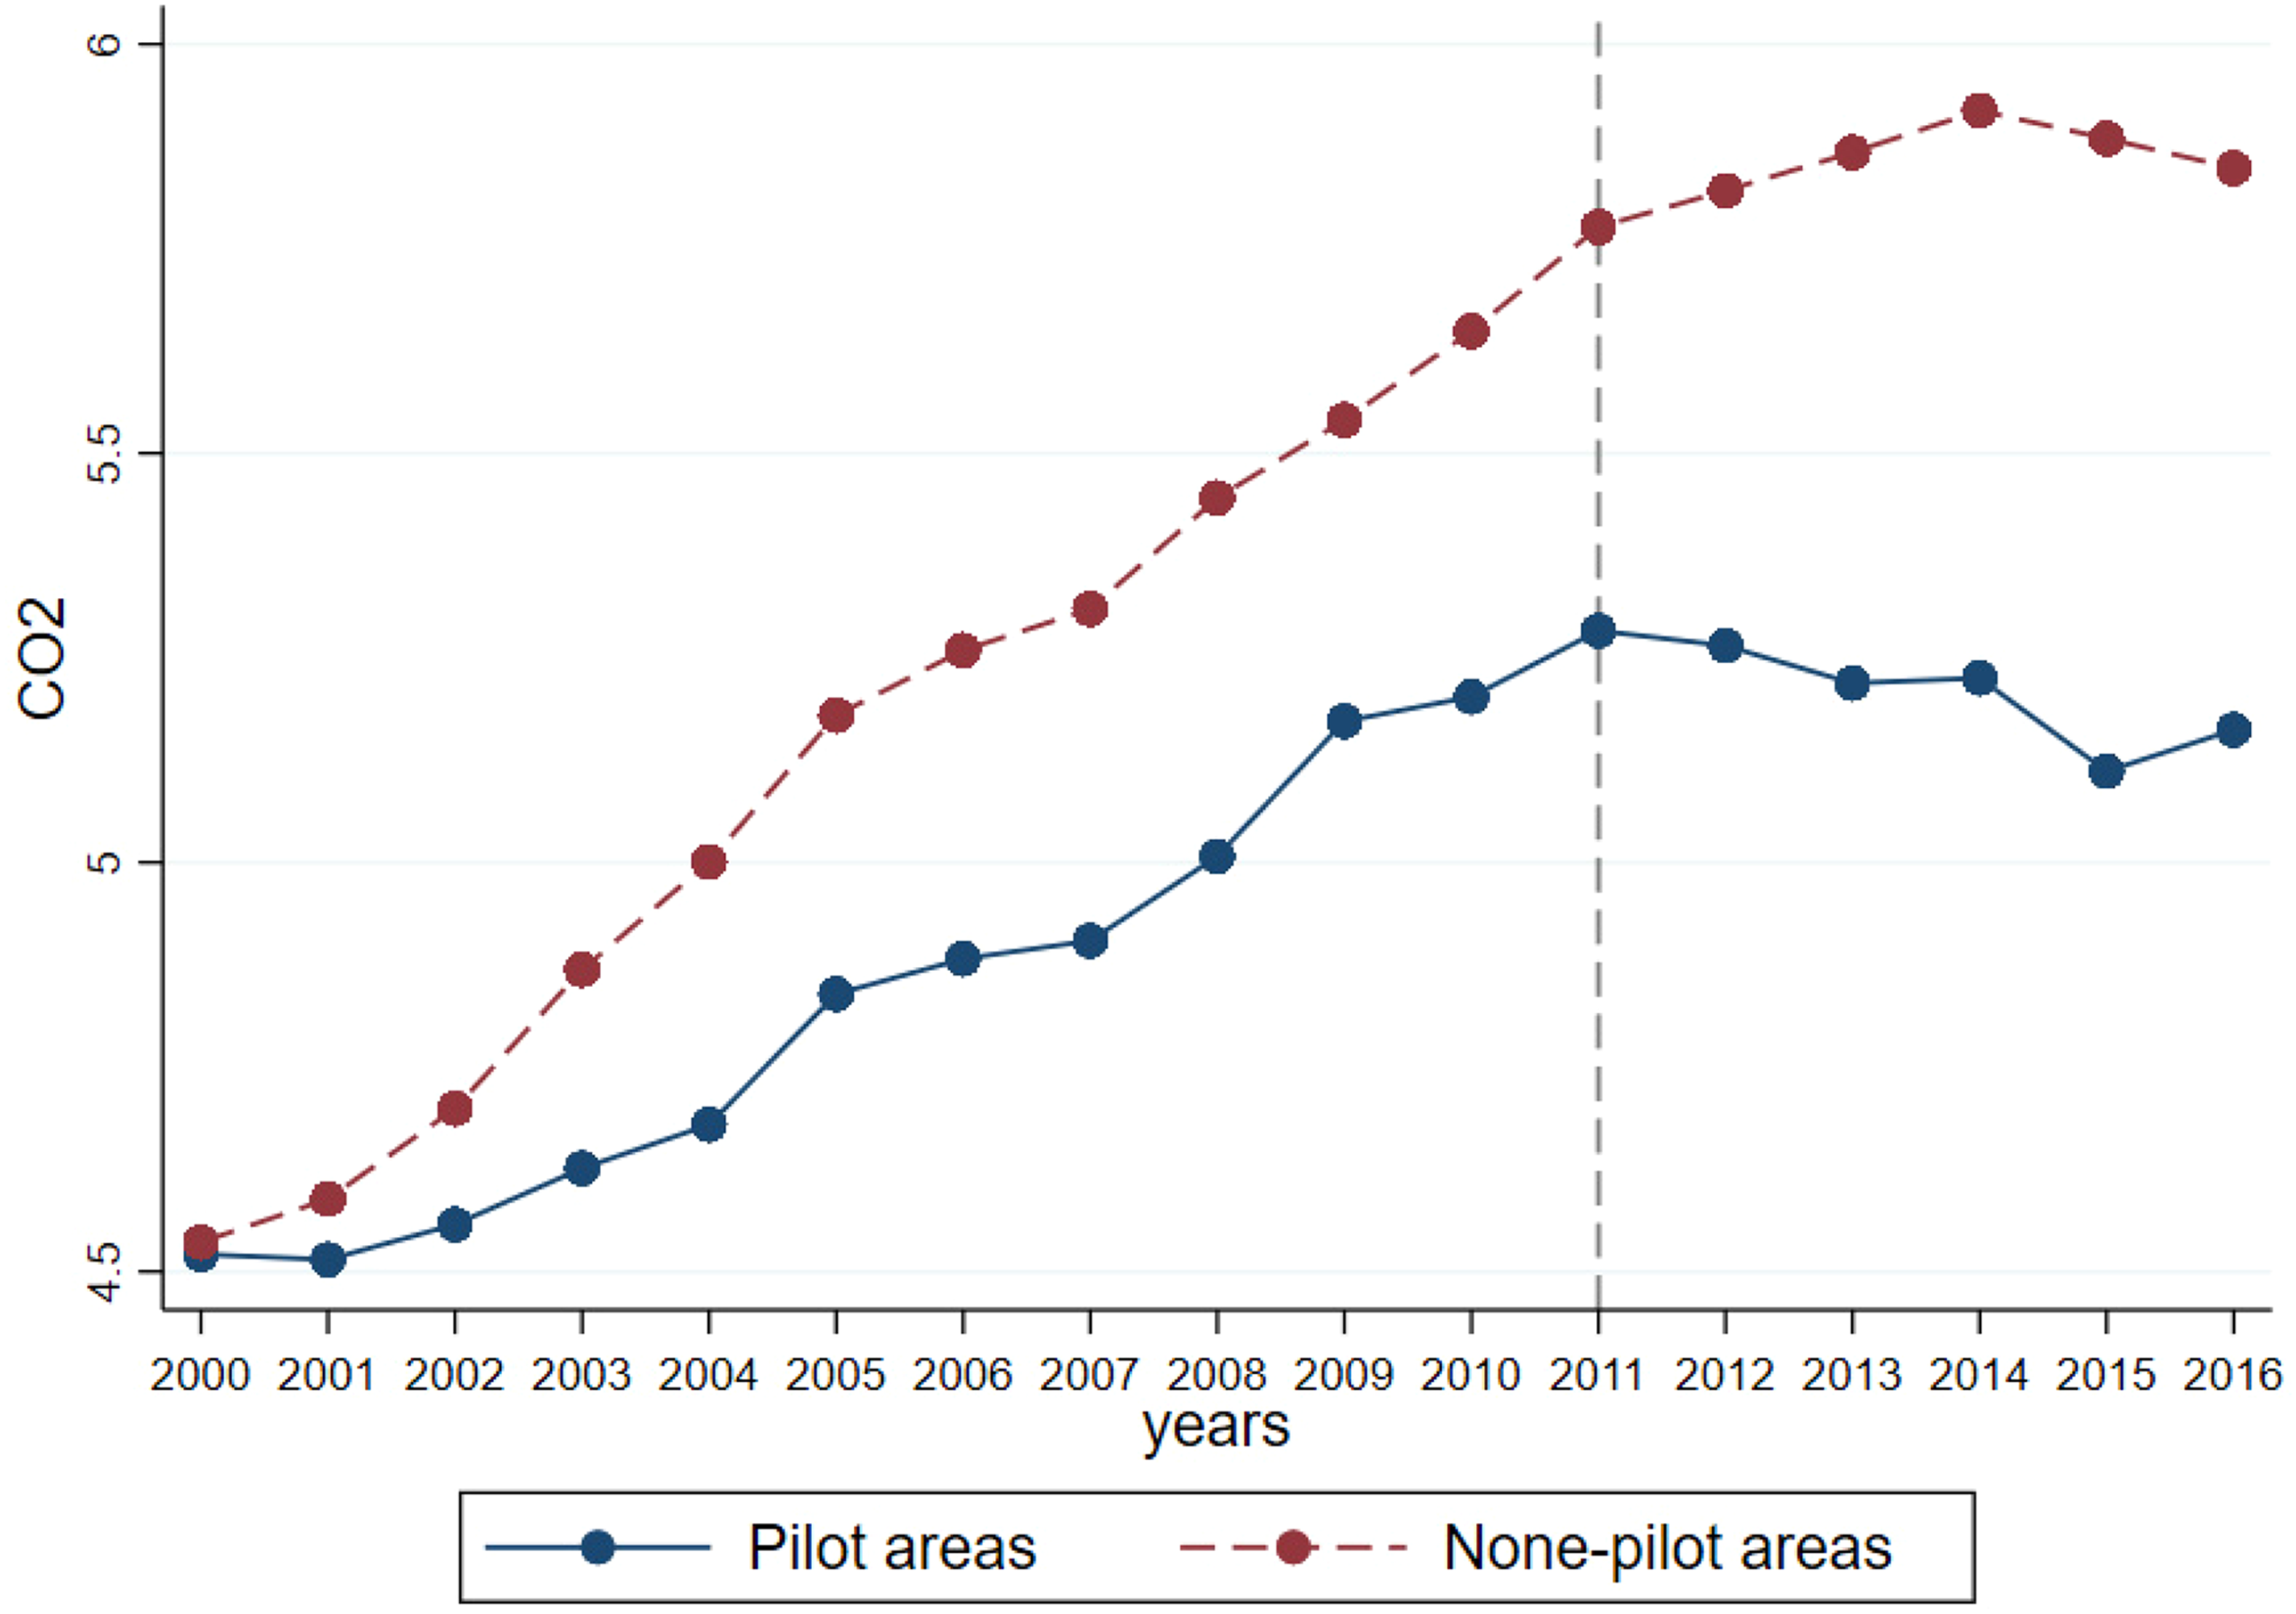
Parallel trend chart.
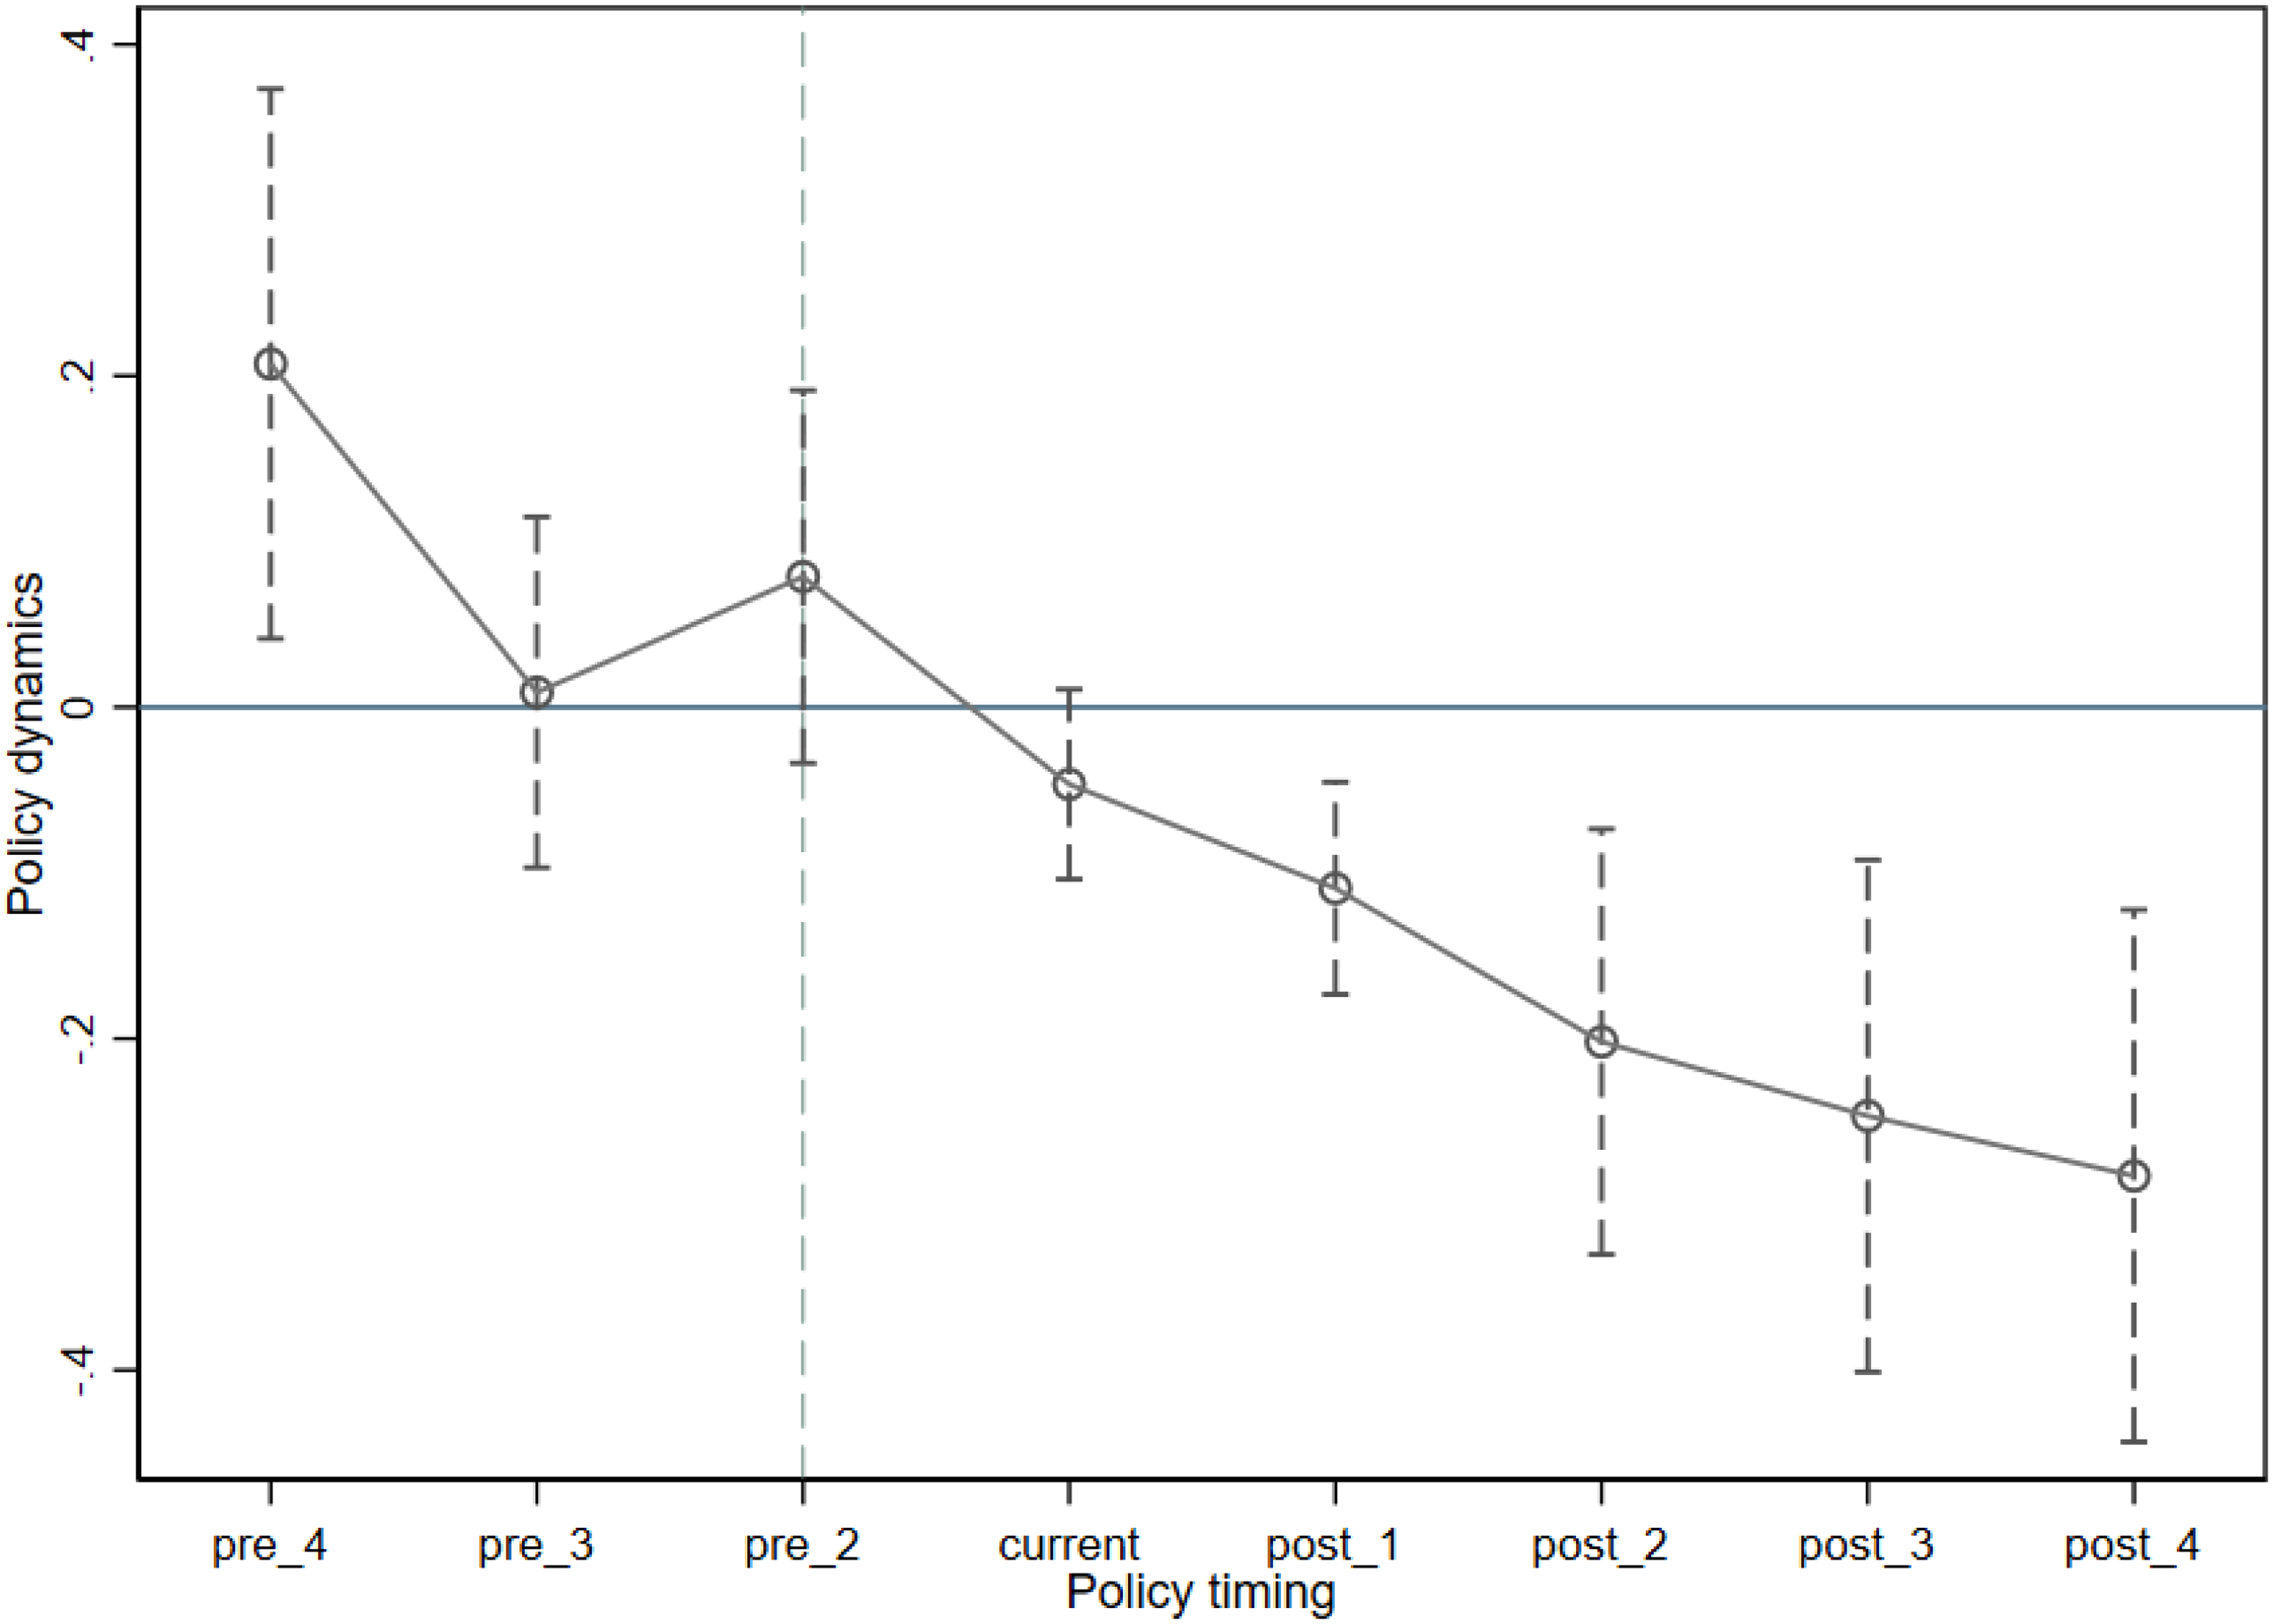
Annual dynamic effect.
Annual dynamic effect test.
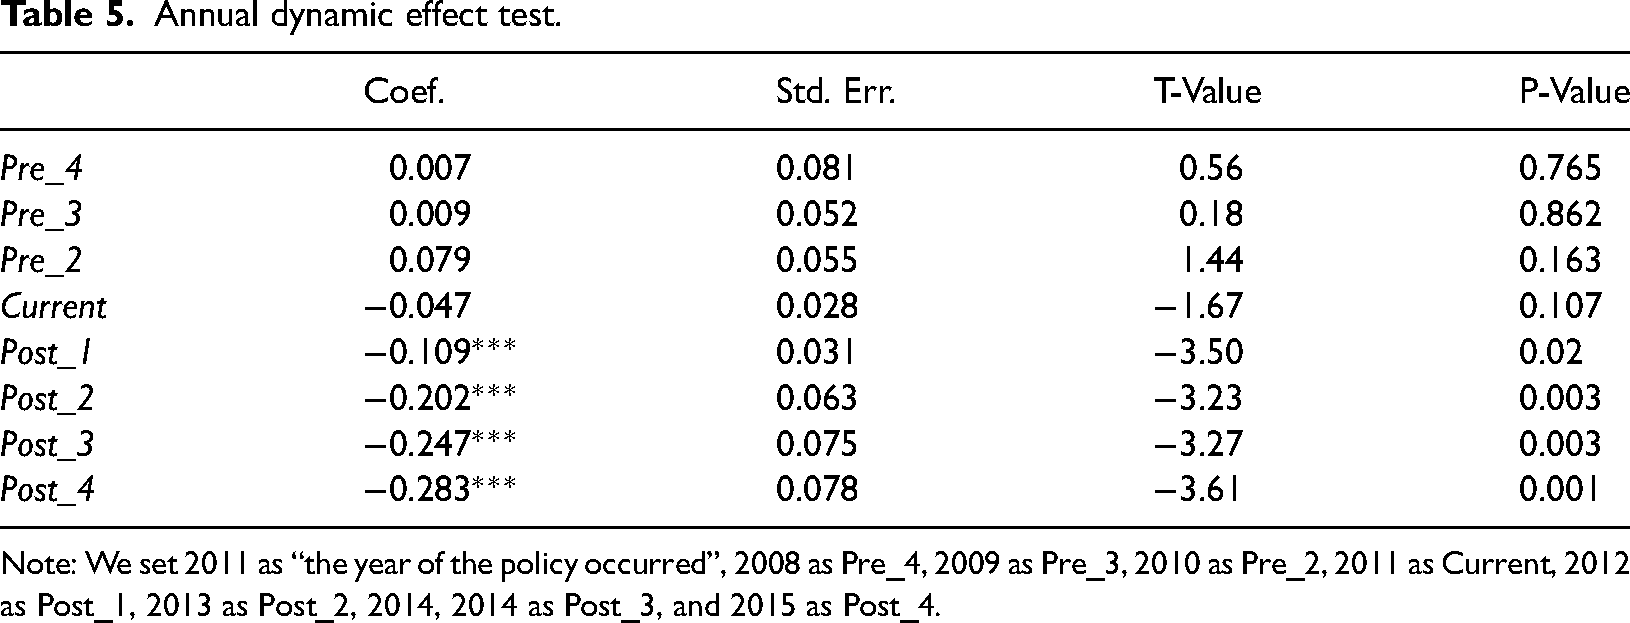
Note: We set 2011 as “the year of the policy occurred”, 2008 as Pre_4, 2009 as Pre_3, 2010 as Pre_2, 2011 as Current, 2012 as Post_1, 2013 as Post_2, 2014, 2014 as Post_3, and 2015 as Post_4.
Table 5 displays that the regression results before 2011 (current) are not significant, which meets the assumption that the treatment group and the control group have a similar trend before the policy begins. The treatment group after 2011 shows that the coefficients are −0.109, −0.202, −0.247, and −0.283. The results of Table 5 verified the basic regression results. Before 2011, the treatment group and control group had similar development trends.
The dependent variable of Models (1) to (5) is carbon dioxide emissions. Table 6 indicates that the coefficients of
Difference in differences (DID) regression results.
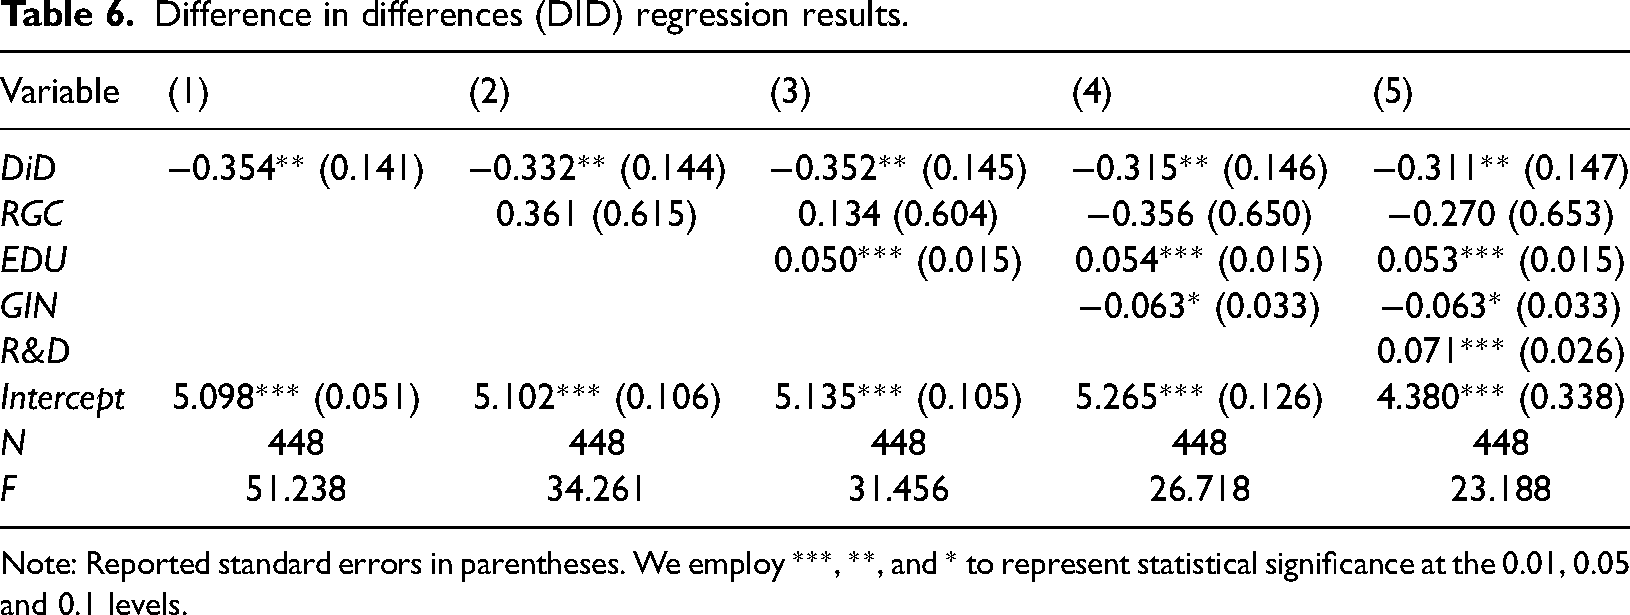
Note: Reported standard errors in parentheses. We employ ***, **, and * to represent statistical significance at the 0.01, 0.05 and 0.1 levels.
This paper uses the PSM-DID method for further robustness tests to address sample selection bias. The PSM approach was employed to look for the control group with the features closest to the treatment group. First, this paper matches samples from 2011 to 2016 and creates the different groups. Second, by exploiting grouping variables and characteristic variables, this paper matches the data. Third, this paper employs “kernel matching” and uses the logit model to appraise propensity scores. R&D, GIN, EDU, and RGC are set as the matching characteristic variables.
Figure 3 (a) depicts the core density map of the different groups’ propensity scores before matching. Figure 3(b) depicts the propensity scores of the two groups after matching. By comparing Figure 3(a) and (b), we find that the common tendency hypothesis can be met. Because the different groups’ propensity scores overlapped after matching, their distribution trends tend to be consistent.
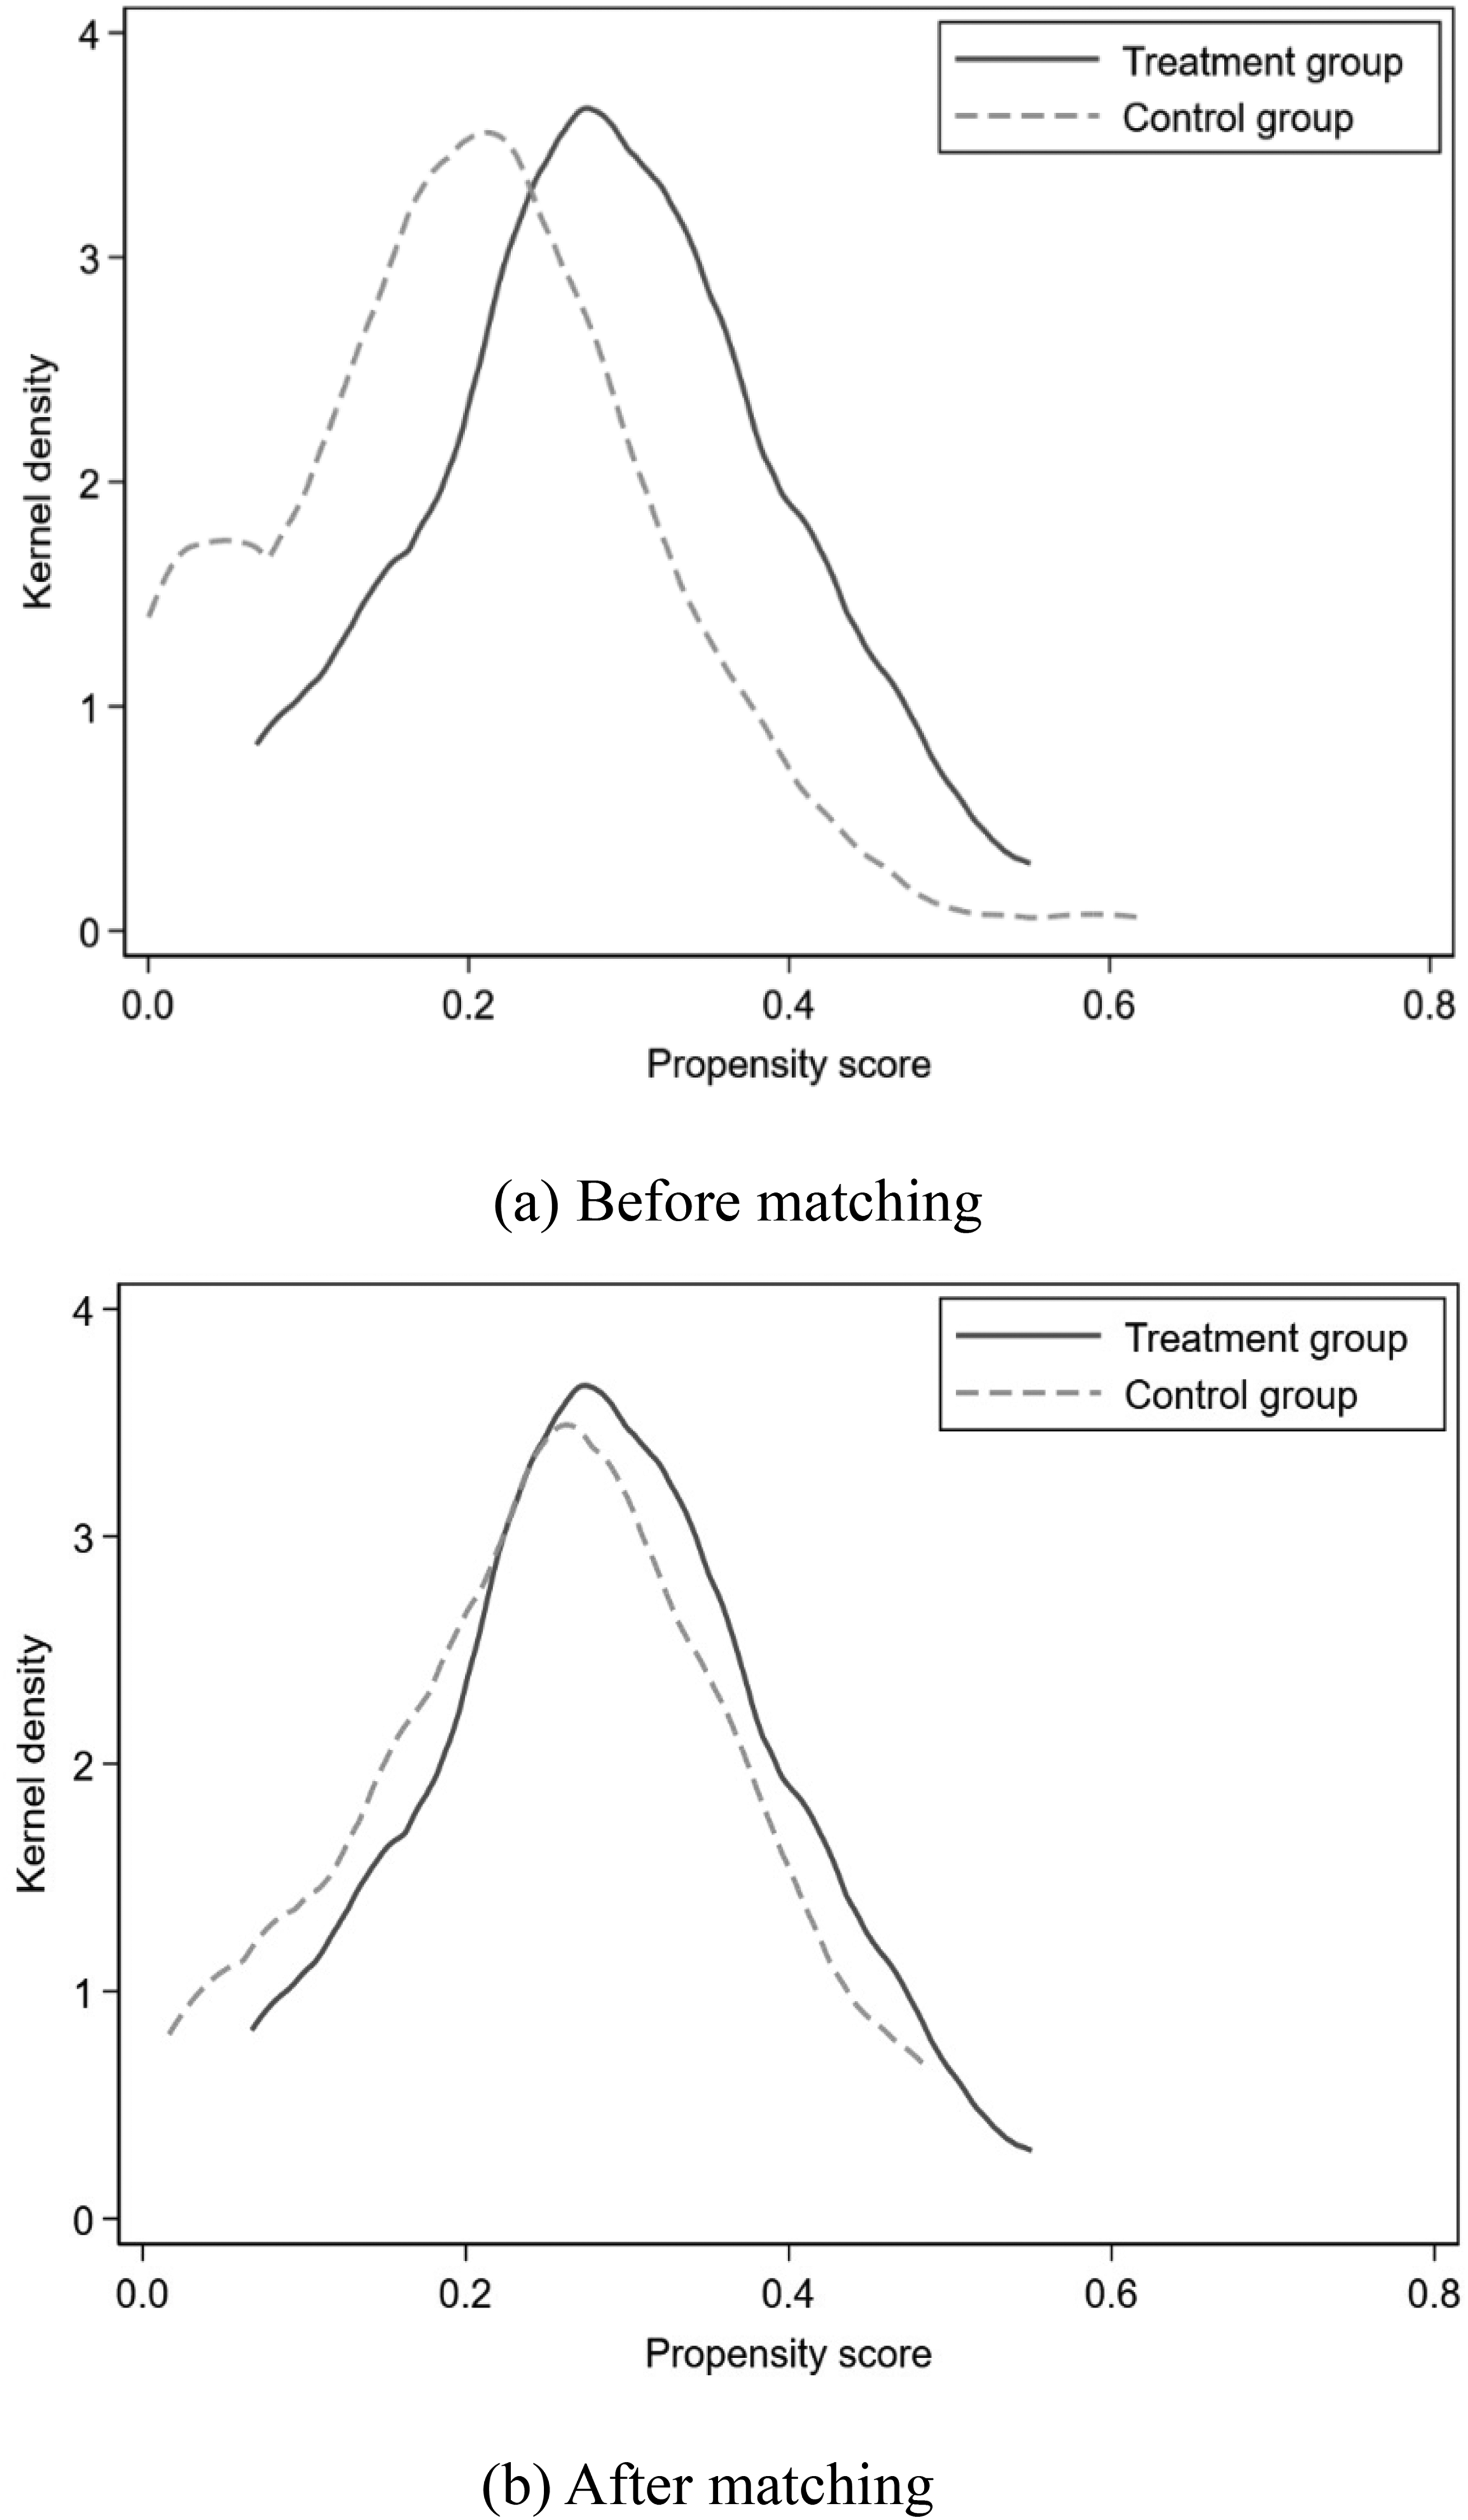
Kernel density distribution.
In Table 7, the PSM-DID results display a significant negative correlation between carbon dioxide emissions and China’s emissions trading policy (t = 3.32, p = 0.001). We compare the results of Table 7 and Table 6 and find that the DID results in Table 6 are robust The results of Table 6 and Table 7 show that the emission trading policy has indeed achieved CO2 emissions reduction effects. Considering China’s current situation, the empirical findings might be caused by the following factors. The emission caps in pilot provinces are strict, which would deliver pressure to reduce emissions more directly to policy receivers. Regulated industries face tremendous pressure to decrease emissions in pilot provinces. In addition, the trading policy would facilitate the withdrawal of companies with severe pollution and accelerate the flow of capital to industries with high efficiency, thus realizing carbon dioxide emission reduction and energy conversion. Firms are granted agility in their compliance strategy to achieve carbon dioxide reduction missions through purchase quotas, and these efforts could optimize the allocation of factors and resources between different industries.
Propensity score matching-DID.
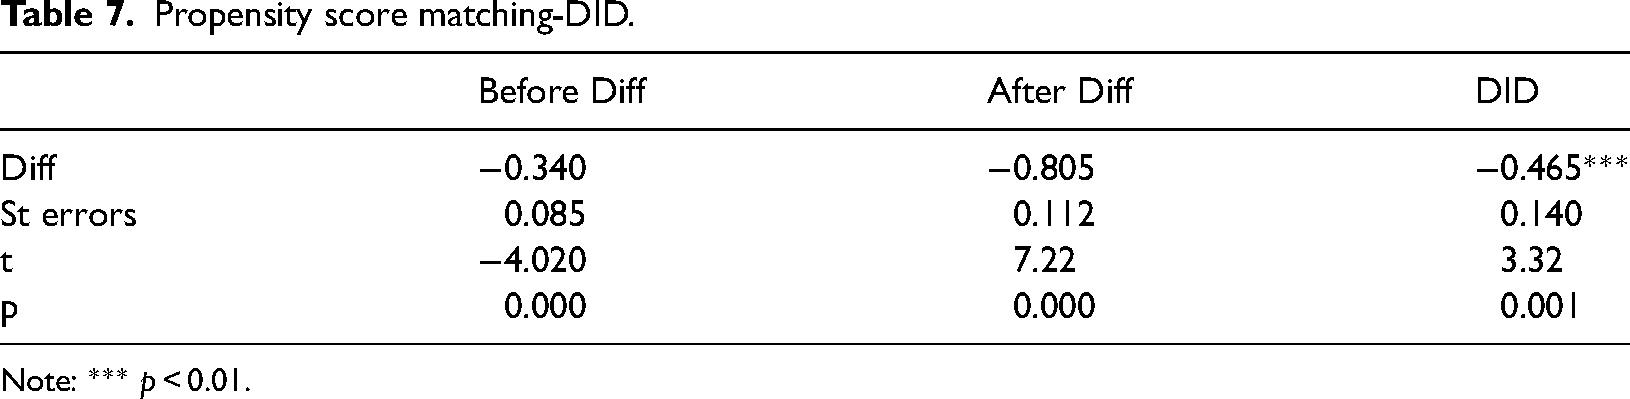
Note: *** p < 0.01.
Conclusion
The empirical results of static and dynamic models show a negative association between clean energy and CO2 emissions. Our findings imply that clean energy use validly controls CO2 emissions and positively impacts environmental protection. Empirical results further indicate a positive association between clean energy and emission trading policy, implying that emission trading promotes clean energy development. The empirical results of quasi-natural experiments show a negative correlation between the “policy treatment effect” and CO2 emissions; the emission trading policy has indeed achieved CO2 emissions reduction effects.
Overall, the unique finding of this paper is that not only does the ETS pilot policy reduce carbon dioxide emissions, but it can reduce carbon dioxide emissions by stimulating clean energy development. In addition, both emission trading policies and clean energy use can mitigate carbon dioxide emissions. The results of this paper can provide useful inspiration for the formulation of emission trading policies and the development of clean energy, helping the government to build a carbon trading market and promote green energy transition, as well as helping green innovation for high-polluting enterprises, so as to achieve a low-carbon economy and green environmental protection target. Our findings are helpful for gaining insight into the trade-off among clean energy use, ETCs, and a low-carbon economy.
Policy implications
Enterprises should actively respond to the government’s carbon emission trading policies and clean energy policies, promote green technology innovation, exploit energy-efficient technologies, and employ clean energy sources to reduce carbon dioxide emissions. The Porter hypothesis states that environmental regulations that are rigid and flexible may create an incentive for firms to innovate. As a result of the compliance pressure on the carbon emissions trading policy and the additional income generated from the sale of emission allowances, enterprises might be more motivated to invest in clean energy technologies, leading to a reduction in traditional energy use and carbon dioxide emissions. In addition, enterprises can optimize resource allocation through energy conversion and allowance trading, thereby affecting the energy structure to achieve emission reduction targets.
The government should implement emission trading policies reasonably, encourage clean energy, develop a low-carbon economy, protect the environment, and take the path of sustainable development. Next, we put forward the following policy recommendations for the government: First, the government should reduce emission trading market risk, improve emission trading market efficiency, implement a more efficient emission trading policy, exploit a low-carbon economy, and take the path of sustainable development. Second, government departments should strengthen the management and guidance of the carbon emission trading market. In further improving the design and supporting policies of the carbon emission trading market, attention should be given to the coordinated development of carbon emission trading policies and clean energy policies. The synergy between the two should be effectively utilized to avoid potential policy conflicts. Third, a developed clean energy system that can promote CO2 emissions reduction should be encouraged in each region and the surrounding areas. Government departments should heighten energy use efficiency and expand clean energy provision channels to relieve the pressure on the energy demand of individuals or enterprises. Finally, government departments should optimize their energy consumption system, reduce the dependence on traditional energy sources, and vigorously develop clean energy.
Footnotes
Declaration of conflicting interests.
The author(s) declared no potential conflicts of interest with respect to the research, authorship, and/or publication of this article.
Funding.
The author(s) received no financial support for the research, authorship, and/or publication of this article.