
Abstract
The development of foreign trade and industrial pollution control is an important theme of government governance today. Based on the institutional background of rising international trade protectionism, this study examines the impact of trade barriers on industrial pollution emissions by using different measurement methods and data from 16 industrial sectors in 10 major countries. The results show that lowering trade barriers can significantly reduce industrial pollution emissions, considering the impact of potential endogenous problems. Heterogeneity analysis shows that reducing trade barriers in developed countries can reduce industrial SO2-emission intensity, while the opposite is true in developing countries. Trade barriers have the greatest effect on the pollution-emission intensity of technology-intensive industries, followed by labor-intensive and capital-intensive industries. Mechanism analysis shows that trade barriers affect industrial pollution-emission intensity through both pollution emission and industrial output and that energy-use intensity and biased technological progress are important mechanisms. This study provides a useful reference for governments to promote foreign trade development and ecological and environmental protection.
Keywords
Introduction and literature review
Since the 1990s, countries worldwide have accelerated trade liberalization and introduced many policies to cut tariffs and reduce non-tariff trade barriers, which stimulated the development of import and export trade and promoted world economic integration. 1 Human society's production and consumption activities have brought about an important impact on the resources and environment, and environmental pollution has become a prominent problem plaguing the world's economic development. Studies have shown that 30% of environmental pollution emissions emanate from international trade. Industries with high energy consumption and pollution concentrate in developing countries. 2 Therefore, countries worldwide are paying more and more attention to assessing and managing the environmental effects of trade liberalization. The environmental effects have become an important part of the behavioral effects of international trade.
Reverse globalization has gradually emerged with decreasing global economic and trade growth rates in recent years. For example, developed countries, represented by the United States, have adopted anti-dumping and other measures to protect their key industries, especially the Trump administration's series of trade protection measures since the launch of the “301” investigation against China in August 2017. It reflects its transformation from an advocate of trade liberalization to an implementer of unilateral trade protectionism. 3 It has become an academic consensus that lowering trade barriers and promoting trade liberalization can help realize regional comparative advantages and enhance regional economic welfare. 4 However, when examining the effect of trade barriers on environmental governance, the existing literature is still highly controversial. It is important to explore the impact of trade barriers on pollution emissions for countries worldwide to coordinate the relationship between trade development and environmental protection.
Currently, scholars have developed two opposing views on the environmental consequences of trade liberalization (lowering of trade barriers). Based on factor endowment theory and the “pollution refuge” hypothesis, one group of scholars found that trade liberalization provided favorable conditions for transferring pollution-intensive industries from developed to developing countries, effectively reducing the environmental pollution in developed countries.5,6 Developing countries rely on their rich resource endowment advantages and lower environmental regulations to take over the polluting products transferred from developed countries. Although these developing countries have achieved faster economic growth, they have caused serious environmental problems.7,8 Based on technological progress, another group of scholars argues that trade liberalization helps developing countries engage in technological innovation, achieve industrial transformation and upgrade, and reduce pollution emission levels.9,10
On the issue of trade liberalization and environmental pollution effects, scholars have mainly followed Grossman and Kruger's (1992) 11 decomposition of three types of environmental effects in NAFTA (North American Free Trade Agreement), namely, the scale effect of increased factor inputs, the technology effect of income enhancement, and the structural effect of economic restructuring, but the findings are inconsistent. For example, Wu et al. (2022) 12 examined the industrial development approach based on an international trade perspective and found that international trade promotes technological progress in reducing major pollutants and exerts a positive structural effect, while Raza et al. (2021) 13 showed that the positive effect of technology is lower than the negative effect of scale effect on carbon emissions, resulting in an upward trend of carbon emissions. Le et al. (2016) 14 divided countries by income level and found that while trade liberalization reduced environmental pollution in high-income countries, it elevated pollution levels in low- and middle-income countries, with an overall increase in pollution levels at the global level.
The above literature review reveals that scholars have carried out rich research on the relationship between trade and environmental pollution, but there is still some room for expansion. First, the existing literature mostly uses indicators with strong endogeneity, such as import and export trade volume and foreign direct investment, to characterize the degree of trade liberalization (trade barriers), which affects the reliability of the research results. Second, the existing literature does not distinguish between neutral and biased technological progress in examining the technological effects of trade affecting environmental pollution. According to Lyubich et al. (2018), 15 differences in environmental efficiency between industries are much higher than differences in total factor productivity, implying that biased technological progress may be more useful than neutral technological progress in revealing the technical effects of trade affecting environmental pollution.
The potential contributions of this study to the existing literature are as follows: First, this study combines data from the World Bank's WITS (World Integrated Trade Solution) and WIOD (World Input-Output Database) databases and regresses industry-level tariff data to measure a country's trade barriers on industrial pollution emissions. Robustness tests were conducted from various perspectives, such as replacing pollution indicators, adding environmental regulations, and replacing models and estimation methods, to enhance the accuracy and reliability of the study results. Second, this study thoroughly examines the transmission mechanism between trade barriers and industrial pollution emissions. The study focuses on the following questions: Is the reduction in industrial pollution emission only due to increased industrial output? What is the dominant force in the technological effects of trade barriers on industrial emission? The effects of neutral technological progress and biased technological progress are considered, representing a useful supplement to the existing literature. Third, this study investigates the relationship and influence mechanism between trade barriers and industrial pollution emissions through various statistical and quantitative methods. It also conducts comparative studies at the national and industrial levels, which provide rich and reliable evidence for governments to formulate precise policies.
The remainder of the paper is structured as follows: The second part is a theoretical analysis, while the third describes the econometric model, indicators, and data. The fourth part analyzes the regression results, while the fifth part deals with the mechanism analysis. The sixth part concludes with policy implications.
Theoretical analysis
We review the existing literature to analyze the internal logic of the effect of trade barriers on industrial pollution emissions from three perspectives: total output, energy intensity, and technological progress.
First, trade barriers can indirectly affect industrial pollution emissions by influencing the total output. 16 Countries fully exploit their advantages to participate in international trade to exchange goods and services, accompanied by environmental resources and pollution. 17 Generally, through the exchange and division of labor, countries can maximize their advantages, thus effectively improving their production efficiency, expanding their production scale, and reducing industrial pollution intensity. When trade barriers are implemented, the reduced trade between countries inevitably leads to a decline in industrial output and corporate profits. 18 On the one hand, the low-profit rate will restrict enterprises’ research and development (R&D) investment in energy conservation, emission reduction, and clean technology, thus hindering the sustainable development of industrial enterprises. 19 When enterprises are under great pressure to survive, they usually exhibit a low sense of social responsibility and evade environmental responsibility through rent-seeking and other low-cost avenues. 20 Among individual countries, there may be considerable variation in industrial pollution reduction due to trade barriers between developed and developing countries. 21 In developed countries, reducing trade barriers facilitates a transfer of polluting industries and improves their environmental quality. However, to promote their economic development, developing countries readily embrace polluting industries from developed countries and may become the latter's “pollution haven” while raising their total output.22,23 According to a study of developing countries, the rapid expansion of China's exports of industrial energy products between 1987 and 2006 led to a rapid rise in domestic energy consumption and the sulfur content of exports. Developed countries enjoy a deficit of pollution emissions and effectively reduce their industrial pollution emissions by importing energy-consuming products produced by developing countries. 5
Second, through energy-use intensity, trade barriers can also affect domestic industrial pollution emissions. An increase in trade barriers reduces the efficiency of industrial output and increases the demand for energy use, thus leading to increased industrial pollution emissions. Therefore, improved trade openness is conducive to reducing industrial pollution. 24 For example, in China, the tariff reduction resulting from the opening trade policy stimulates a rapid growth of exports, which changes the industrial structure and improves the energy utilization efficiency and domestic industrial pollution. 25 Industrial structure determines the energy consumption structure, thus affecting energy intensity. 26 The energy-use intensity of the secondary industry is much higher than that of the primary and tertiary industries. The corresponding pollution emission in the secondary industry is also higher than that of the primary and tertiary industries. 27 As the degrees of freedom of world trade increase, trade cooperation between countries will drive the adjustment and optimization of the national industrial structure and promote it from labor-intensive to capital-intensive and technology-intensive industries. Therefore, the energy consumption structure of various countries is improved, while the emission of industrial pollution is reduced. 28 In case domestic cooperation on environmental policies cannot be achieved, reducing bilateral tariffs and replacing trade barriers with domestic policy tools can significantly reduce energy intensity, thus realizing the double dividend effect of environmental improvement and trade growth. 29
Third, trade barriers can also affect domestic industrial pollution emissions. Nowadays, an excellent enterprise is highly profitable, has a large market share, good customer experience, and production without a severe impact on the surrounding environment. 30 Given the continued improvement of trade openness, countries will face more intense market competition. Such competitive pressure will force countries to improve their technological level and promote the R&D of clean and environmental protection technologies, improving production efficiency and environmental quality. 31 Therefore, lowering trade barriers will produce a “competitive effect,” promote technological progress in each country, and improve industrial pollution. Reducing trade barriers will significantly increase the trade cooperation between countries and produce the “learning effect.” 32 Close trade between developed and developing countries will produce technology spillovers. Initially, developing countries with relatively backward technology can improve their products’ technological content and added value by imitating and learning from developed countries’ production experience and clean energy technology. Such emulation would help to reduce unnecessary energy waste and pollution emissions. 33 With mature technology and rich experience, developing countries can gradually implement independent innovation based on imitation, to realize clean and efficient production and reduce the pressure of industrial pollution. 34
What is worth paying attention to is that technological progress has non-neutral characteristics. Hicks (1932), 35 in his Theory of Wage, suggested a substitution relationship between input factors and that when there is technological progress, the proportion of demand for each factor changes. This theory became the basis for the study of biased technological progress. Many scholars have pointed out that biased technological progress can better reflect energy inputs and pollution emissions and is the key to resolving the contradiction between economic growth and environmental pollution.36,37 Therefore, when studying whether trade barriers can affect industrial pollution emissions through the path of technological progress, it is helpful to draw more scientific and reliable research conclusions by distinguishing between neutral and biased technological progress based on each country's industrial capital, energy, and labor factor endowments.
Lower trade barriers can reduce industrial emissions by increasing total output, reducing energy intensity, and promoting technological progress.
Econometric model construction and data description
Econometric model construction
We construct the following econometric regression model to empirically test the impact of trade barriers on industrial pollution emissions at the industry level:

Indicator description
The core issue in this study is the impact of trade barriers on industrial pollution emissions. Therefore, the explained variable in the econometric model is industrial pollution emissions, while trade barriers are the core explanatory variable. Sulfur dioxide is the most important and representative air pollutant in countries’ industrial pollution emissions globally; it is also an important indicator that countries use to measure the degree of air pollution in controlling industrial pollution emissions. 38 For example, the U.S. National Emissions Inventory and China's National Bureau of Statistics regularly publish annual SO2 emissions. Therefore, the log value of SO2-emission intensity is selected to measure industrial pollution emissions, while SO2-emission intensity is measured by the ratio of SO2 emissions to the total industrial output value. The data were obtained from “Environmental Accounts and Socio-Economic Accounts” in the WIOD database. To eliminate the influence of the price factor, this study uses the price index to deflate industrial output values to 1995 levels.
It is difficult to define and empirically measure trade barriers, considering that the non-tariff barriers represented by technical barriers are obscure and controversial. Therefore, this study examines the tariff barriers in the industry import tariff rates obtained from the World Bank's WITS database. Since the tariff data in the WITS database are classified at the product-level, while the industries in the WIOD database (2013 edition) are classified according to the International Standard Classification of Industries (ISIC/Rev.3), we need to transform the product-level tariffs to industry level. First, this study uses the different HS-code comparison standards published in the United Nations Trade database to unify all HS codes from 1996 to 2009 into the HS2002 standard. Then, through HS2002 and ISIC/Rev.3, the product-level tariffs correspond to the industry level; the two industries’ product tariffs are simply averaged to obtain each country's import tariff rates according to the ISIC/Rev.3.
To overcome the influence of omitted variables on the empirical results, we select the following control variables based on trade and environment-related theories and empirical research results: ①
On the one hand, smaller industries produce less and emit less pollution; on the other hand, large-scale industries, with elevated levels of environmental technology and strong, comprehensive pollution control capability, can reduce pollution emission intensity.
40
Therefore, the sign of the regression coefficient for industry size cannot be predetermined. ③
Description of data sources
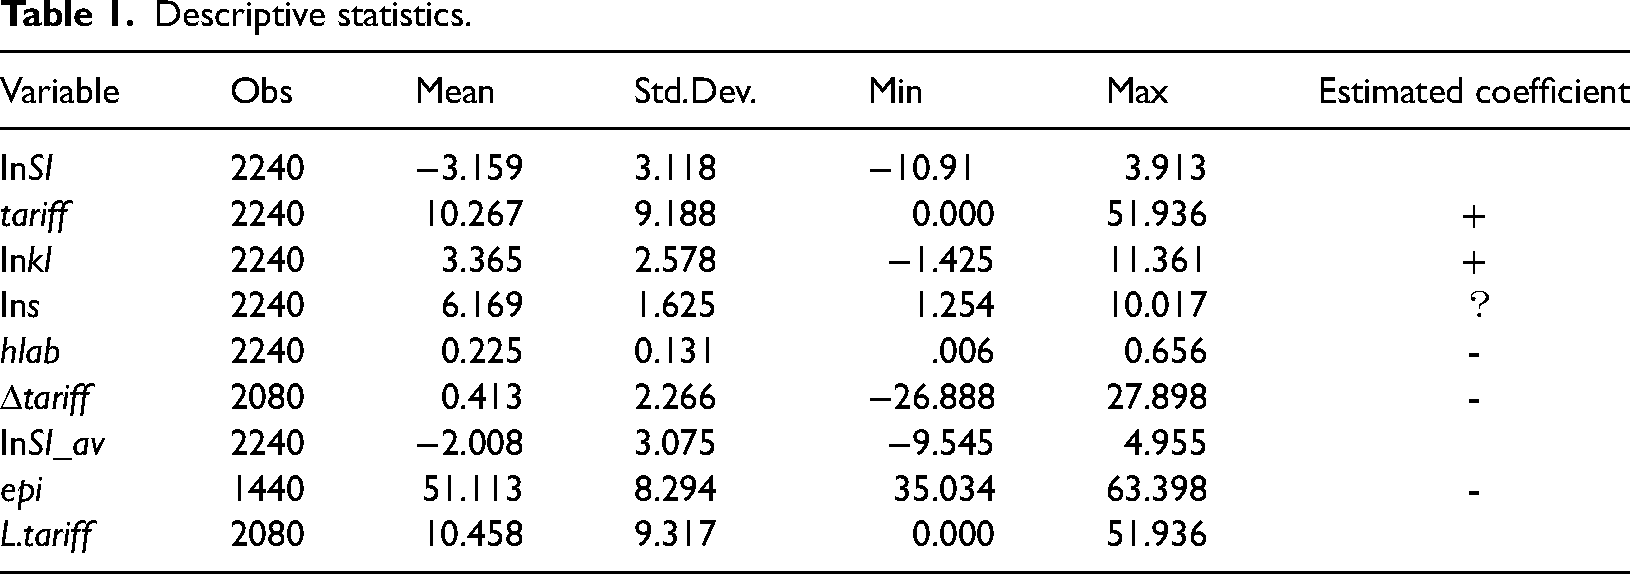
This study involves two datasets: the WIOD 2013 and WITS databases. Due to the lack of environmental accounting tables in the newly released WIOD 2016 database, the empirical research mainly utilizes the WIOD 2013 database. As the input-output table in the WIOD 2013 database is only updated to 2011, while the relevant pollution emission and energy consumption data in the environmental accounting table are only updated to 2009, the research sample range is limited to the period 1996-2009. The WIOD database is based on officially published available data from national statistical agencies and high data quality. The database currently covers input-output and socio-economic and environmental-index data of 27 EU countries and 13 other major countries globally. It is one of the widely-used databases by scholars. However, tariff data for 27 EU countries, Indonesia, and Turkey are missing in this database, so this paper selects 10 major countries with more complete industry-level tariff data for empirical analysis. These include five developed countries, namely the U.S., Australia, Canada, Japan, and South Korea, and five developing countries, namely China, Brazil, India, Mexico, and Russia. In 2020, for example, the aggregate economic volume of these 10 countries was approximately US$56.6 trillion, accounting for approximately 70% of the global economy, which was highly representative. The tariff data on the core explanatory variable were obtained from the WITS database, which mainly provides the import and export trade data and tariff and non-tariff measures of various countries globally; the database is widely used in current academic research. In addition, a few countries’ tariff data that were missing for individual years were obtained from the World Trade Organization's (WTO) tariff “Download Facility” database. Finally, the sample comprises 16 industries in 10 major countries from 1996 to 2009. The descriptive statistics of the variables are shown in Table 1.
Descriptive statistics.
Statistical analysis
Figure 1 is drawn for an in-depth study of industrial pollution emissions within each country. Each color represents the sulfur dioxide emissions of different countries. Some colored areas are further subdivided by industry category and year; thus, each country's share of pollutant emissions is indicated. From Figure 1, it is evident that China and the U.S. have the largest SO2 emissions, commensurate with the two countries’ industrial scale, economic development level, population, and geographical situation. India is the third-largest emitter of SO2, but emissions are much lower than China and the United States. Considering that China and the U.S. have the highest share of industrial pollutant emissions, these two countries are the most representative developing and developed countries. It is necessary to further examine the SO2 emissions in these two countries to compare and analyze the patterns of pollution emissions among the countries and different industries.
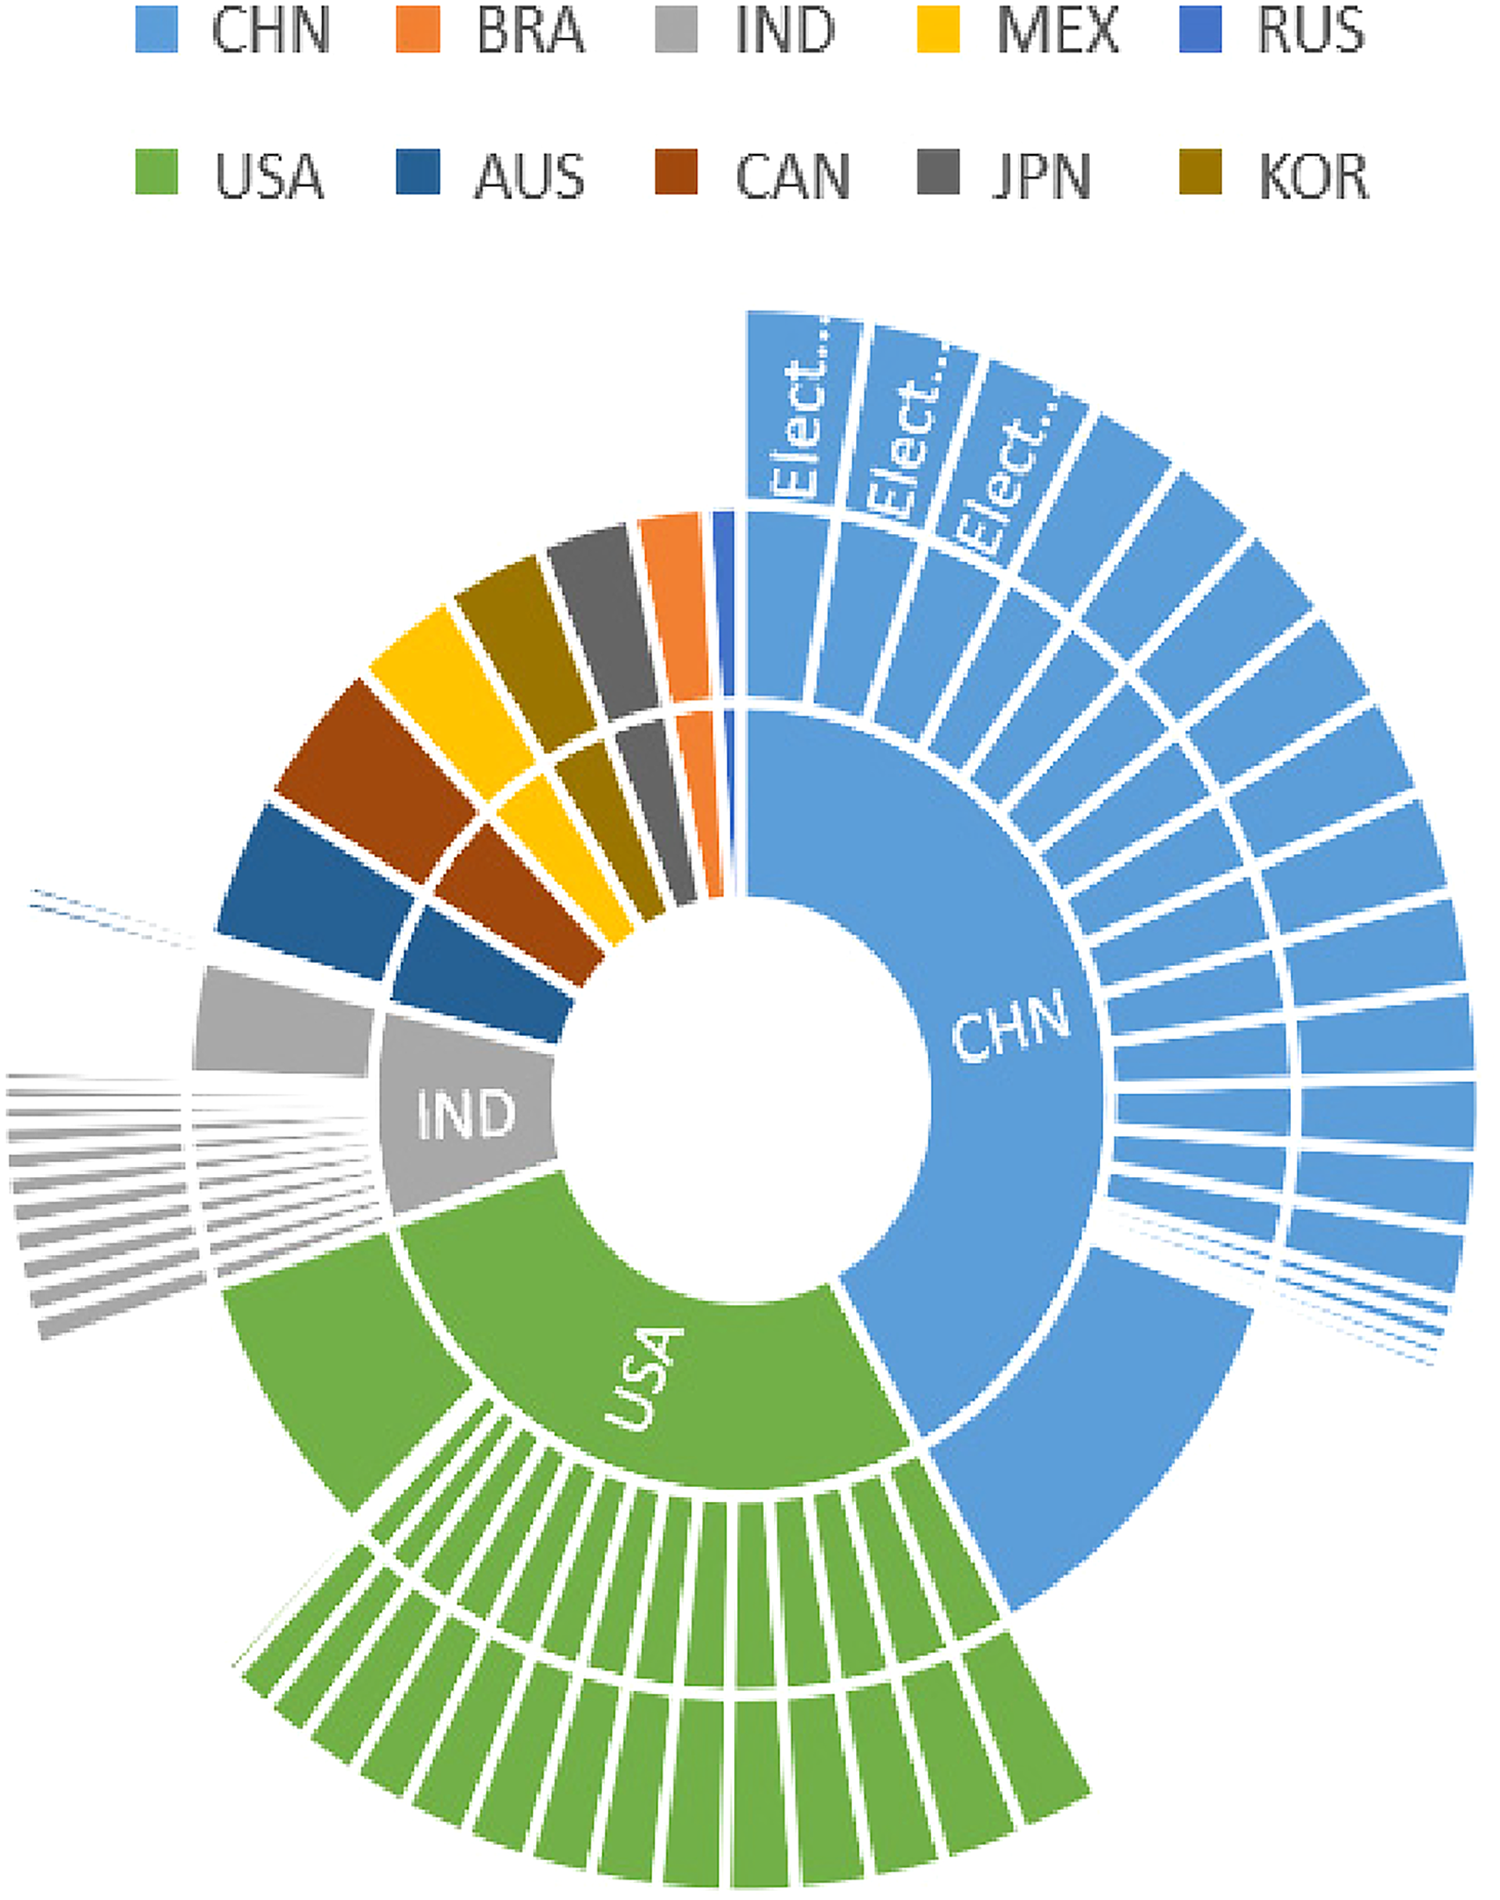
Sulfur dioxide emission of different industries in 10 countries.
Referring to the industry classification standard proposed by Wang et al. (2021),, 41 we divide the 16 industries studied into labor-intensive, capital-intensive, and technology-intensive (see Table 2 for a detailed classification). Based on this division, we plot the average changes in SO2 emissions for labor-intensive, capital-intensive, and technology-intensive industries in China and the U.S. from 1996 to 2009. Figures 2 and 3 show the mean change trend of SO2 emissions by different industry types in China and the U.S, respectively. Different colors represent different industries in the figures. By observing different points’ trends and color distribution, we can establish the year-to-year variation trends of pollutant emissions in the two countries and the differences in pollutant emissions between different industries.
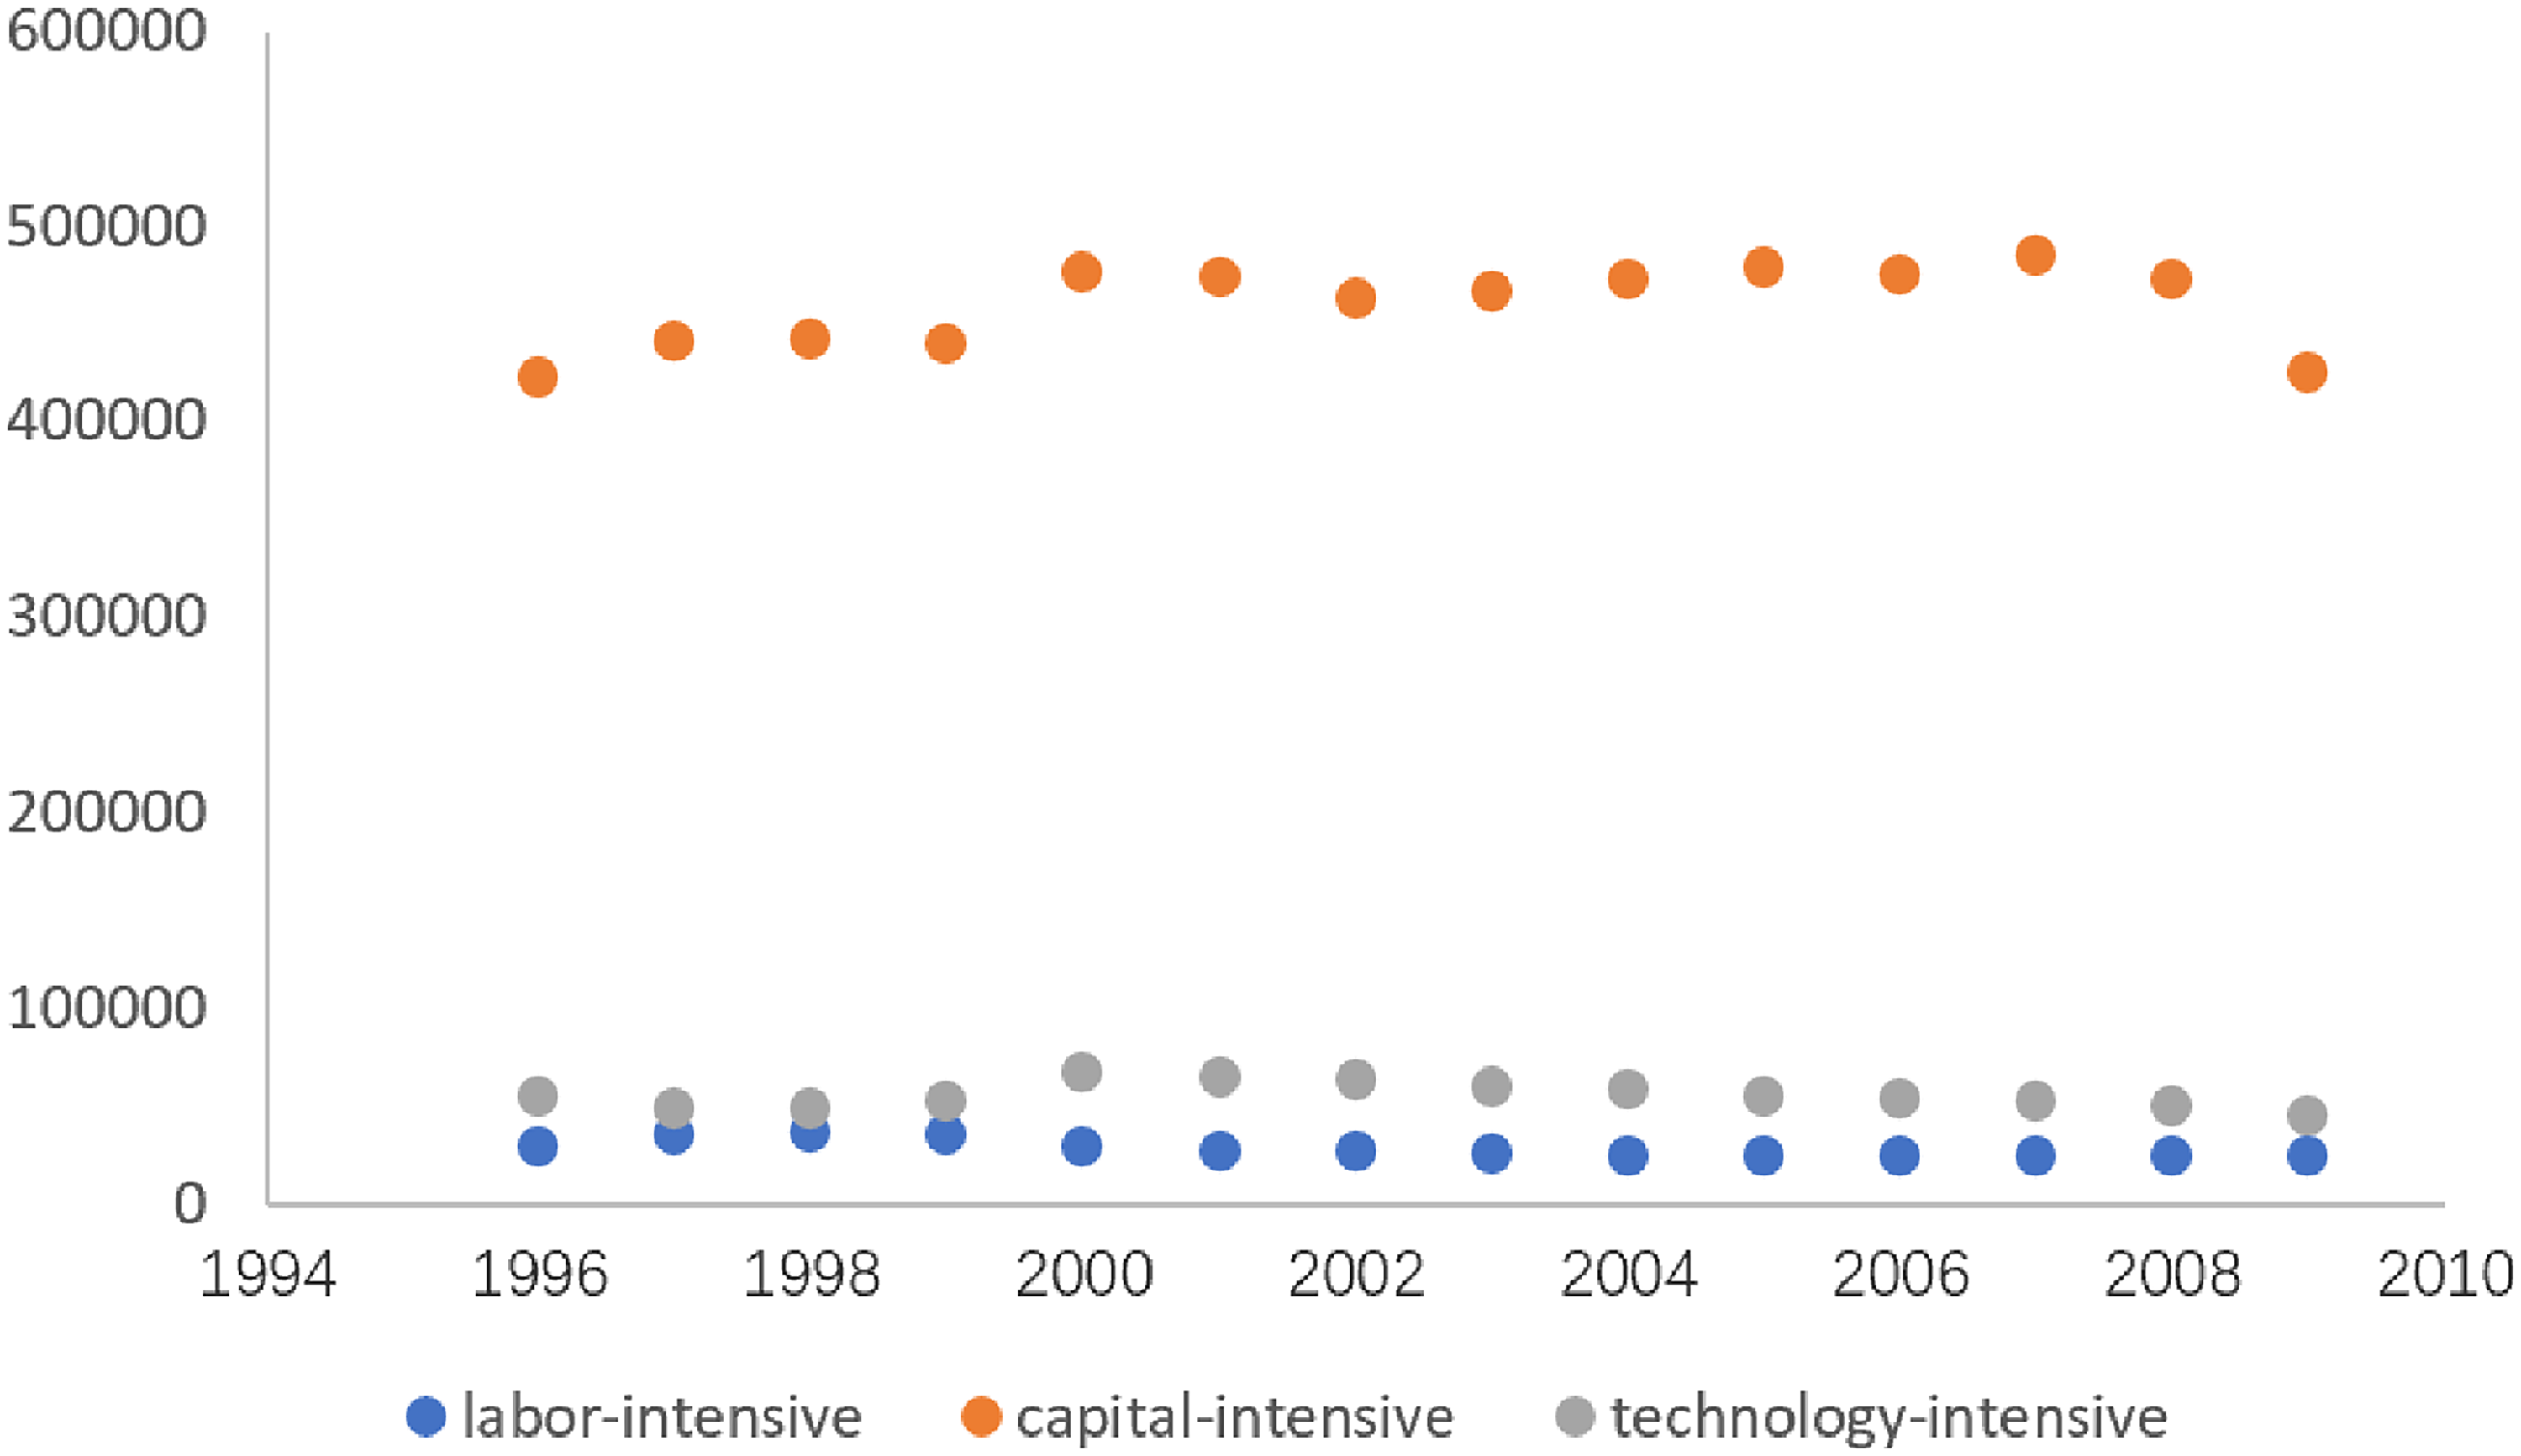
China's sulfur dioxide emissions.
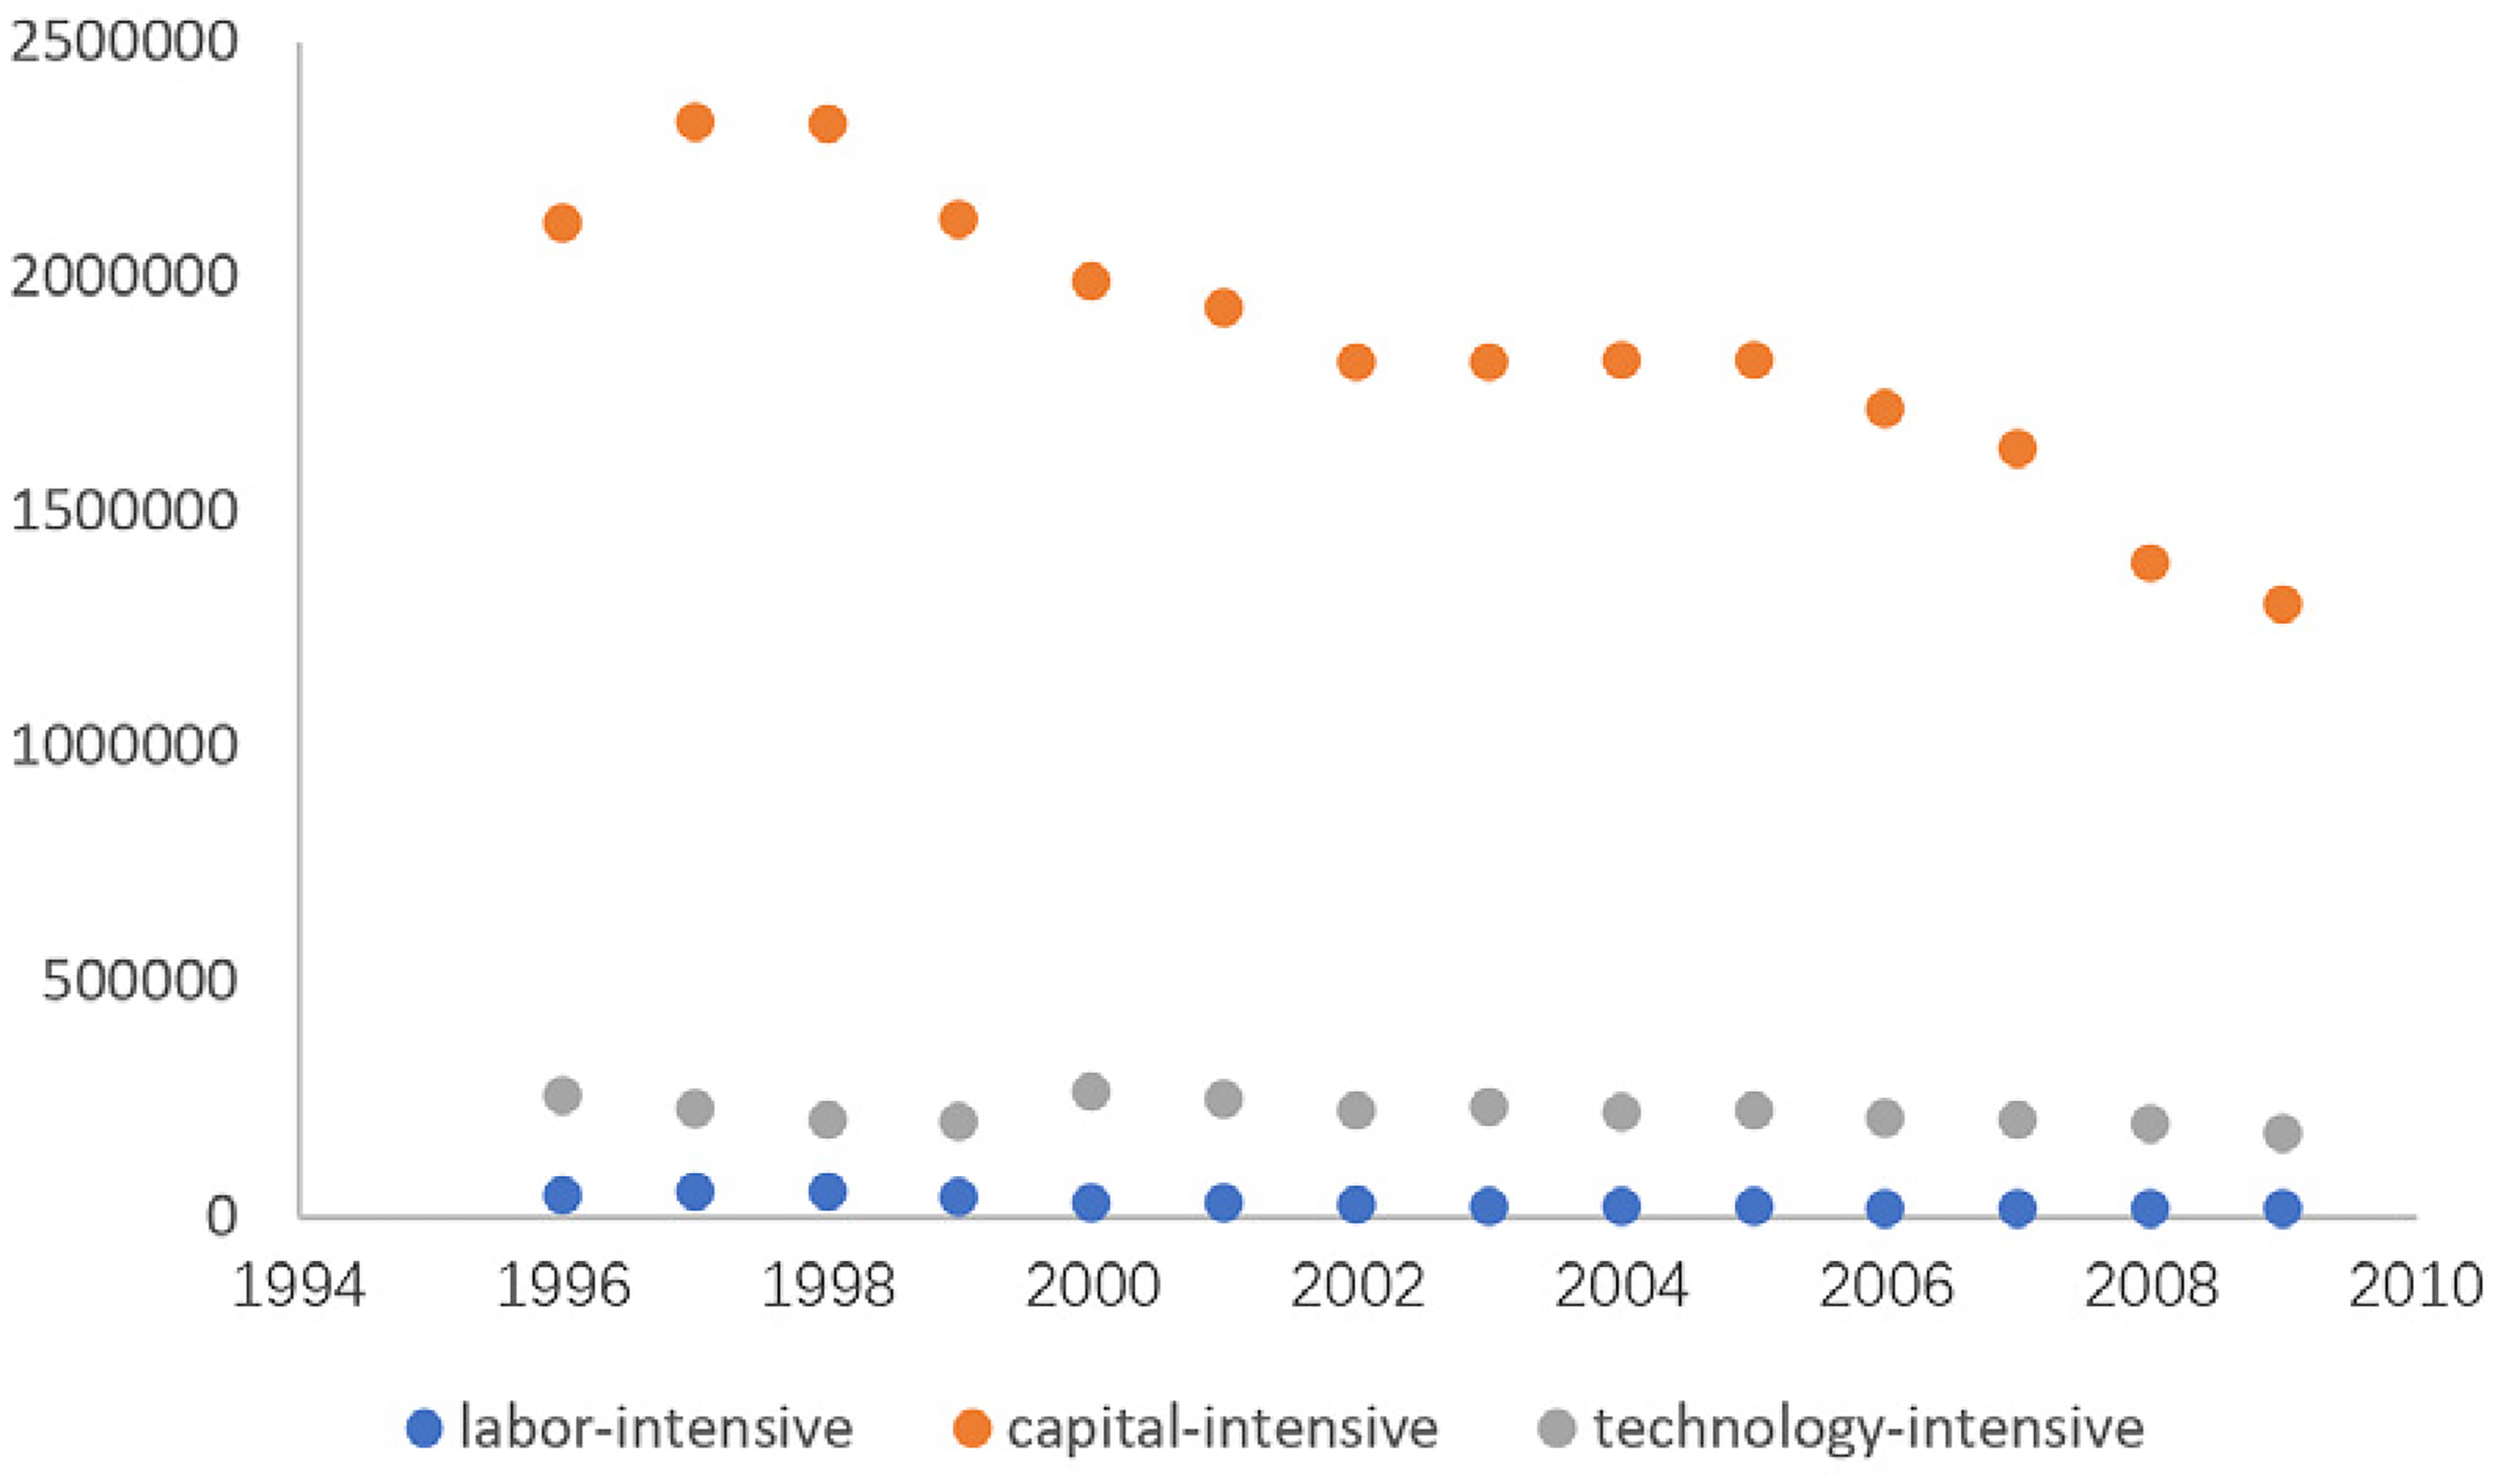
U.S. sulfur dioxide emissions.
Industry type division.
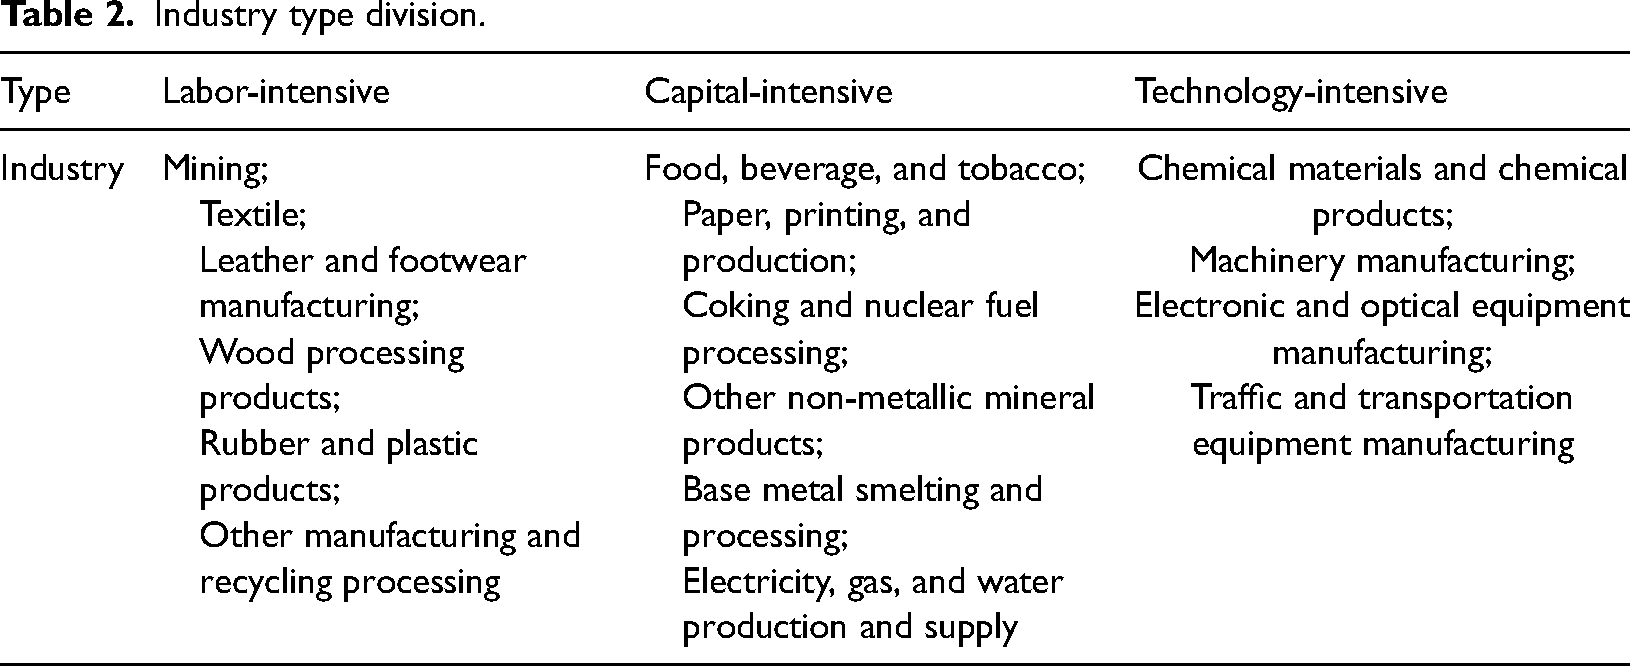
From Figure 2, the change in SO2 emissions in China is relatively gentle, but it still shows an overall growth trend. The specific emissions of the three types of industries show that the pollutant emissions of capital-intensive industries are much higher than those of technology-intensive and labor-intensive industries. Pollution emissions from capital-intensive industries vary more by year, confirming our prediction of the sign of the coefficient for the capital-intensity variable, i.e., industries with high capital intensity are also pollution-intensive. From Figure 3, the SO2 emissions in the U.S. show a significant downward trend over the sample interval, in contrast to the situation in China. This is related to the fact that the U.S. attaches considerable importance to the control of SO2 emissions and moves polluting manufacturing activities out of the country. The situation for SO2 emissions also indicates the possibility of a “pollution haven.” In terms of the internal emissions of the three industries, the situations in the U.S. and China are similar. For both, capital-intensive industries emit more pollution than technology-intensive and pollution-intensive industries. From the analysis above, free trade is statistically likely to increase emissions in developing countries and improve environmental quality in developed countries.
Empirical analysis
Baseline regression
To avoid missing the factors of year, country, and industry that do not change with time, we empirically investigated the influence of trade barriers on industrial SO2-emission intensity by gradually adding control variables for the fixed effects of year, country, and industry. Meanwhile, considering the possible correlation between the pollution emissions of different industries in a country in the same year, we adopted the standard error of clustering at the level of country _ year; the baseline regression results are shown in Table 3. From Table 3, introducing control variables one at a time showed that the coefficient signs of the core explanatory variable, tariff, were positive and significant at the 1% level. In contrast, the coefficient did not change significantly, indicating that the higher the trade barrier, the more severe the industrial pollution emission. In the regression results of Column 3, the tariff coefficient was 0.011 and passed the significance level test of 1%, indicating that an increase of one unit in trade barriers would significantly increase industrial SO2-emission intensity by 1.1%. This preliminary finding suggests that the higher the tariff level, the more severe the industrial pollution. Reducing trade barriers is conducive to improving the environmental pollution situation of each country. This shows that, in the face of the instability and uncertainty of the current world trade pattern, countries should abandon the idea of trade protectionism, firmly implement free trade, and maintain an open world economy. This is beneficial to the economic development of each country and can enhance the social welfare level of each country by improving the environment.
Baseline regression results for the impact of trade barriers on industrial SO2-emission intensity.
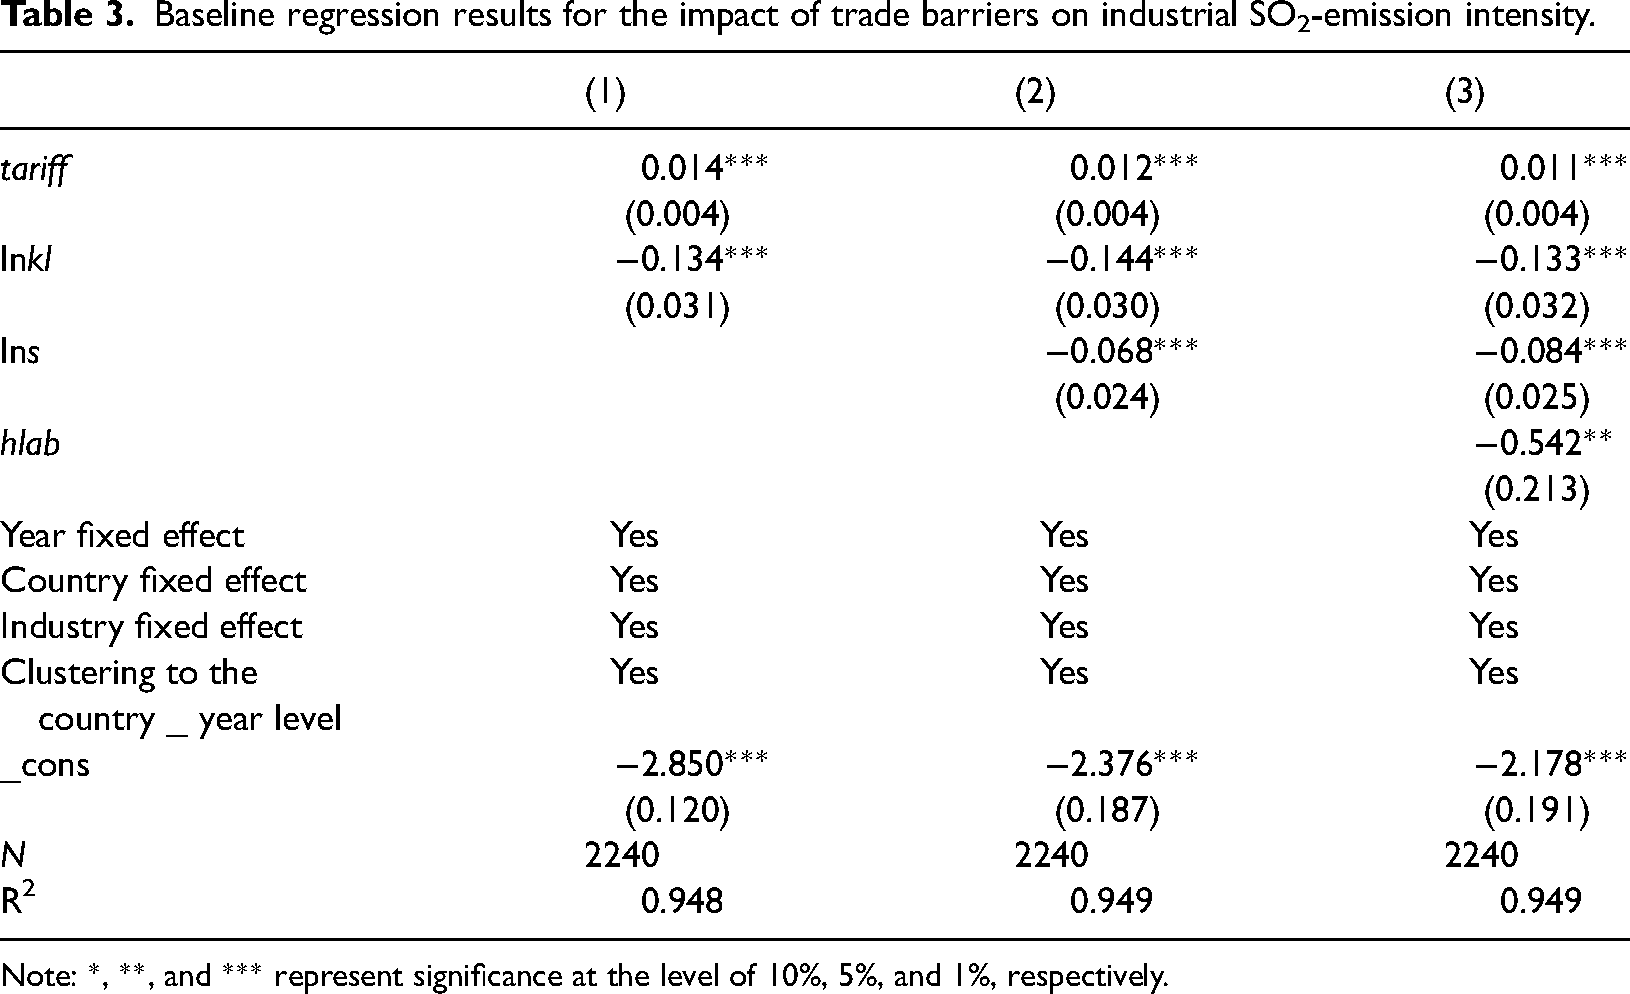
Note: *, **, and *** represent significance at the level of 10%, 5%, and 1%, respectively.
In terms of the control variables, the coefficient of the industry scale is negative and significant, indicating that the expansion of the industrial scale has a positive effect on industrial pollution. Copeland and Taylor (2004) 22 believed that the expansion of the economic scale of each country would increase the input of production factors and that the environmental pollution would increase in the same proportion under the condition that the pollution intensity of the production activities and the layout of the industrial structure remained unchanged. However, our research argues that industrial-scale can improve the environment if production shifts to cleaner products or technologies are adopted. The coefficient of the proportion of high-skilled personnel is negative and significant, indicating that, with a continuous increase in the proportion of high-skilled personnel, the pollution level of industrial sectors in each country is significantly reduced, consistent with our expectation. Noteworthily, the impact of capital intensity on industrial SO2-emission intensity is negative and significant at the 1% level, indicating that increasing industrial capital intensity is conducive to reducing industrial SO2-emission intensity, which is inconsistent with expectations. This may be, owing to the large differences in industrial scale and capital stock between developed and developing countries. In contrast, the impact of capital intensity on industrial pollution emissions in countries with different development levels varies.
Sub-sample regression
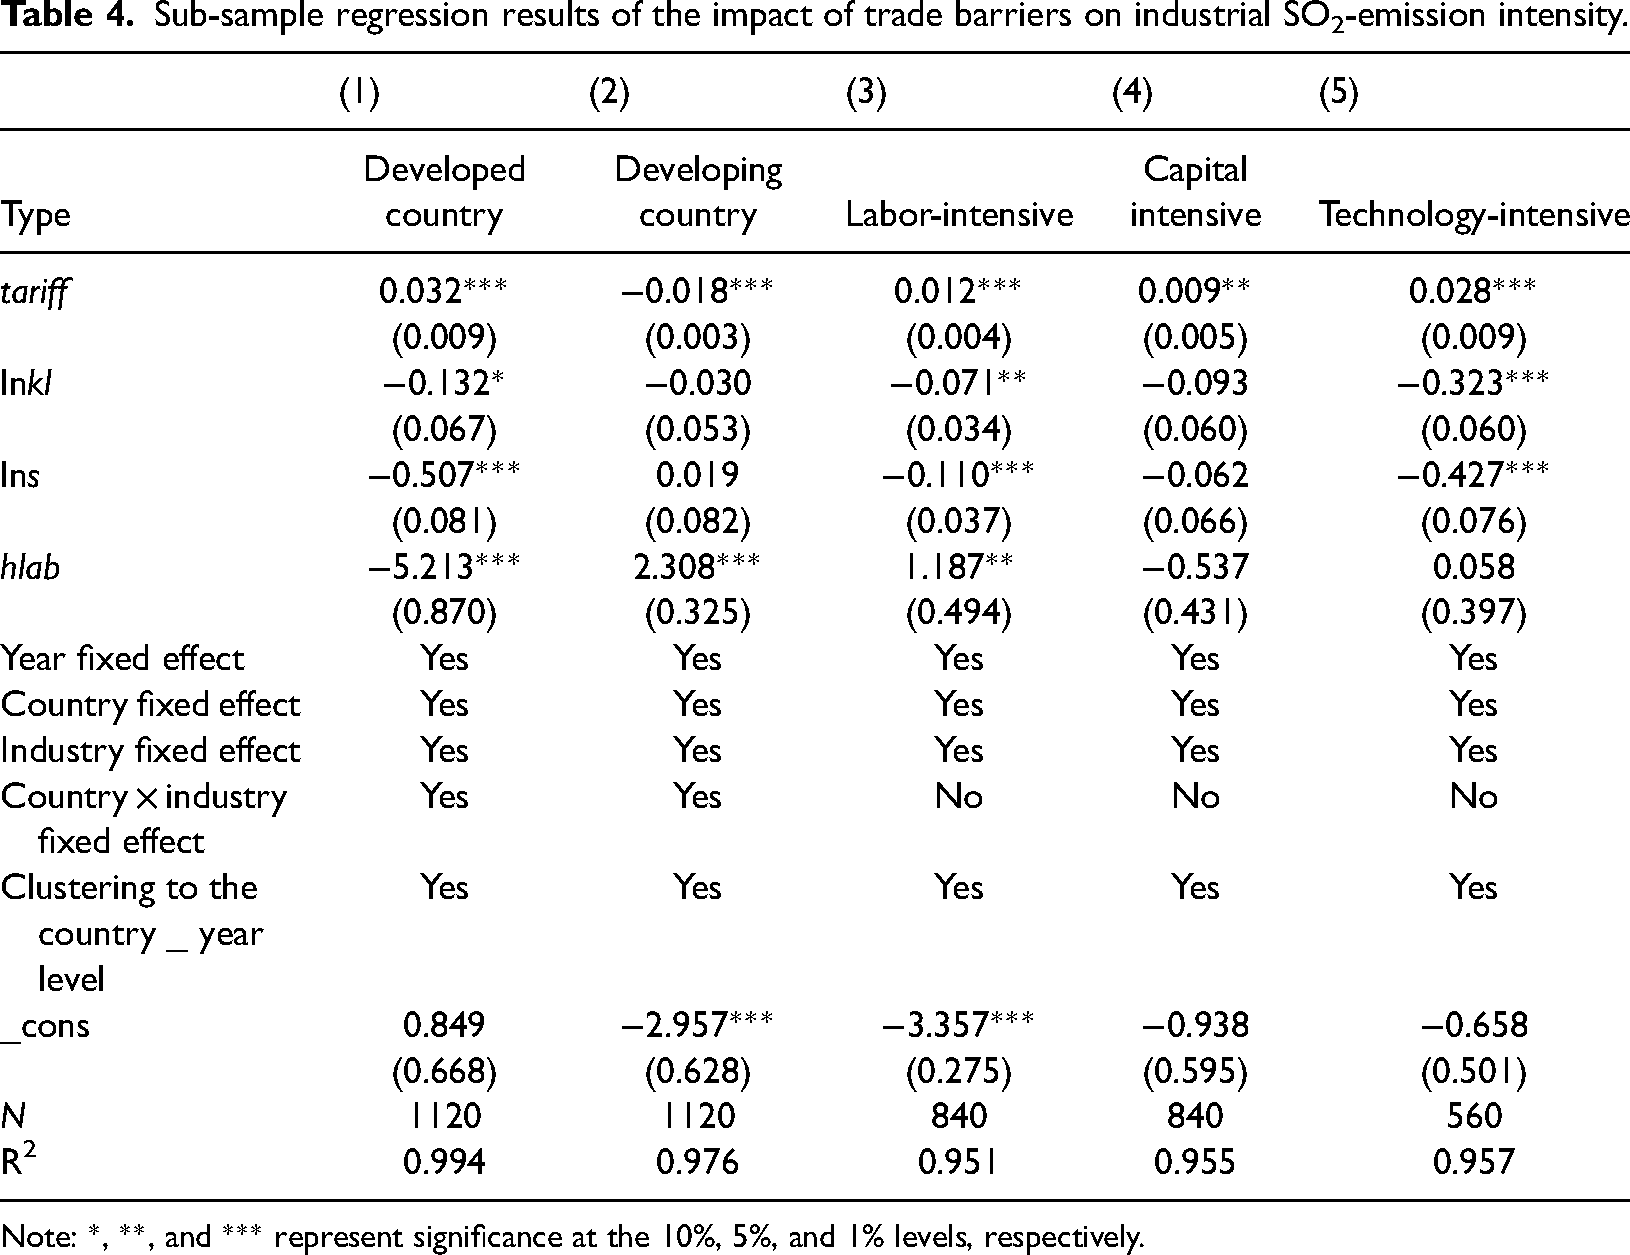
To further explore why the coefficients of capital intensity variables are contrary to expectations and simultaneously compare and analyze the relationship between trade barriers and industrial pollution emissions in different countries and industries. We conducted a sub-sample regression analysis for developed and developing countries using labor, capital, and technology-intensive industries. The regression results are reported in Table 4.
Sub-sample regression results of the impact of trade barriers on industrial SO2-emission intensity.
Note: *, **, and *** represent significance at the 10%, 5%, and 1% levels, respectively.
The regression results of Columns 1 and 2 in Table 4 show that reducing trade barriers in developed countries reduces their industrial SO2-emission intensity, whereas reducing trade barriers in developing countries will increase their industrial SO2-emission intensity. This may be because developed countries are mainly importers of polluting products. Reducing trade barriers can replace domestic production of pollution-intensive products, thus reducing domestic industrial pollution emissions. Developing countries are mainly exporters of pollution-intensive products. Raising trade barriers can constrain the export of pollution-intensive products, thus reducing the intensity of industrial pollution emissions in developing countries. Based on this test result, we suggest that developing countries shift their blind pursuit of trade scale and focus on improving trade quality while actively learning from developed countries’ management experience and advanced technology to reduce environmental pollution to alleviate the negative effects of environmental pollution. Comparing the absolute values of the core explanatory variables, tariff, in Columns 1 and 2 (0.032 > 0.018), the reduction in industrial SO2-emission intensity due to a reduction of one unit of tariff barriers in developed countries is greater than the increase in the intensity owing to a reduction of one unit of tariff barriers in developing countries. Therefore, although lowering trade barriers and enhancing trade liberalization will increase industrial pollution-emission intensity in developing countries, it has positive environmental effects from a global perspective, significantly improving industrial pollution emission and enhancing social welfare.
Comparing the coefficients of the capital intensity variables in Columns 1 and 2, the capital intensity index is negative and significant for developed countries but not significant for developing countries, indicating that improving the capital intensity of industries in developed countries can significantly reduce the industrial SO2-emission intensity. However, the change in developing countries is not obvious. It may be because developed countries have a sound industrial foundation and advanced production, energy conservation, and emission-reduction technologies. Presently, if the capital level of the industry were improved, it would encourage the industry to go green and clean to reduce industrial pollution. However, the economic development of the developing countries is relatively backward, while the industry has not advanced sufficiently. Currently, the developing countries may be more inclined to invest their increased capital in the transformation and reforms of the production technology instead of saving energy and reducing pollution. Therefore, for developing countries, raising the capital concentration does not significantly affect the intensity of the industrial SO2 discharge. This corroborates our conjecture that the coefficients of capital intensity are contrary to our expectations due to the heterogeneity between developed and developing countries.
Columns 3 to 5 of Table 4 show the regression results for labor, capital, and technology-intensive industries. The regression coefficients of the core explanatory variable are positive and significant. Regardless of the type of industry, reducing trade barriers will help reduce industrial SO2-emission intensity, while trade liberalization will help reduce industrial pollution emissions. There is no significant difference between the different industries. The basic conclusion that trade liberalization reduces industrial pollution emissions remains valid for different industries. This means that international division of labor and international trade can improve each country's economic benefits through improved labor productivity, as demonstrated by classical theories such as comparative advantage. However, it can also improve the welfare level of people in all countries by reducing pollution emissions. Comparing the return factors of the tariff in Rows 3 to 5, the technology-intensive industry is the most sensitive to the effect of the customs barrier, followed by the labor-intensive industry and, finally, the capital-intensive industry. Comparing the magnitude of the tariff regression coefficients in Columns 3 to 5 reveals that technology-intensive industries are the most sensitive to tariff barriers, followed by labor-intensive industries and, finally, capital-intensive industries. Combined with the previous research results, this may be because the trade volume between countries will increase significantly when tariff barriers are lowered. With increased trade, the advanced production and environmental technologies in technology-intensive industries will spill over commensurately. The technology-intensive industries have stronger learning and absorption capacity for advanced technologies. Thus, reducing tariffs has a more obvious effect on emission reduction for technology-intensive industries, while the emission reduction effect for labor-intensive and capital-intensive industries is relatively small.
Robustness test
The benchmark model adopts the import tariff rate as a proxy variable for trade barriers; initially, the model verifies the basic conclusion that reducing trade barriers can significantly reduce industrial SO2-emission intensity. The possibility of some measurement error in the absolute value indicators of import tariff rates means that the regression results may be biased and inconsistent. To observe whether such measurement error would substantially impact the regression results, we further adopt the relative value of import tariff rate reduction, Δtariff, to conduct a robustness test The regression results are shown in Column 1 of Table 4. The regression coefficient of Δtariff is negative and significant at the 1% level, indicating that the greater a reduction in import tariff rate, the lower the industrial SO2-emission intensity. A comparison of the results of this regression with the previous one shows that the basic conclusions remain robust to the measurement error of core explanatory variables. In addition, the output index used in calculating the explained variable, industrial SO2-emission intensity, is the gross industrial output value. Industrial added value is an important indicator of industrial production activities and has been widely used in the literature. Therefore, we alternatively use industrial added value as output to replace the industrial SO2-emission intensity index. The regression results in Column 2 of Table 5 show that raising trade barriers is not conducive to reducing industrial SO2-emission intensity, irrespective of whether gross industrial output value or industrial added value is used to calculate industrial SO2-emission intensity.
Robustness tests for the effect of trade barriers on the intensity of industrial SO2 emissions.
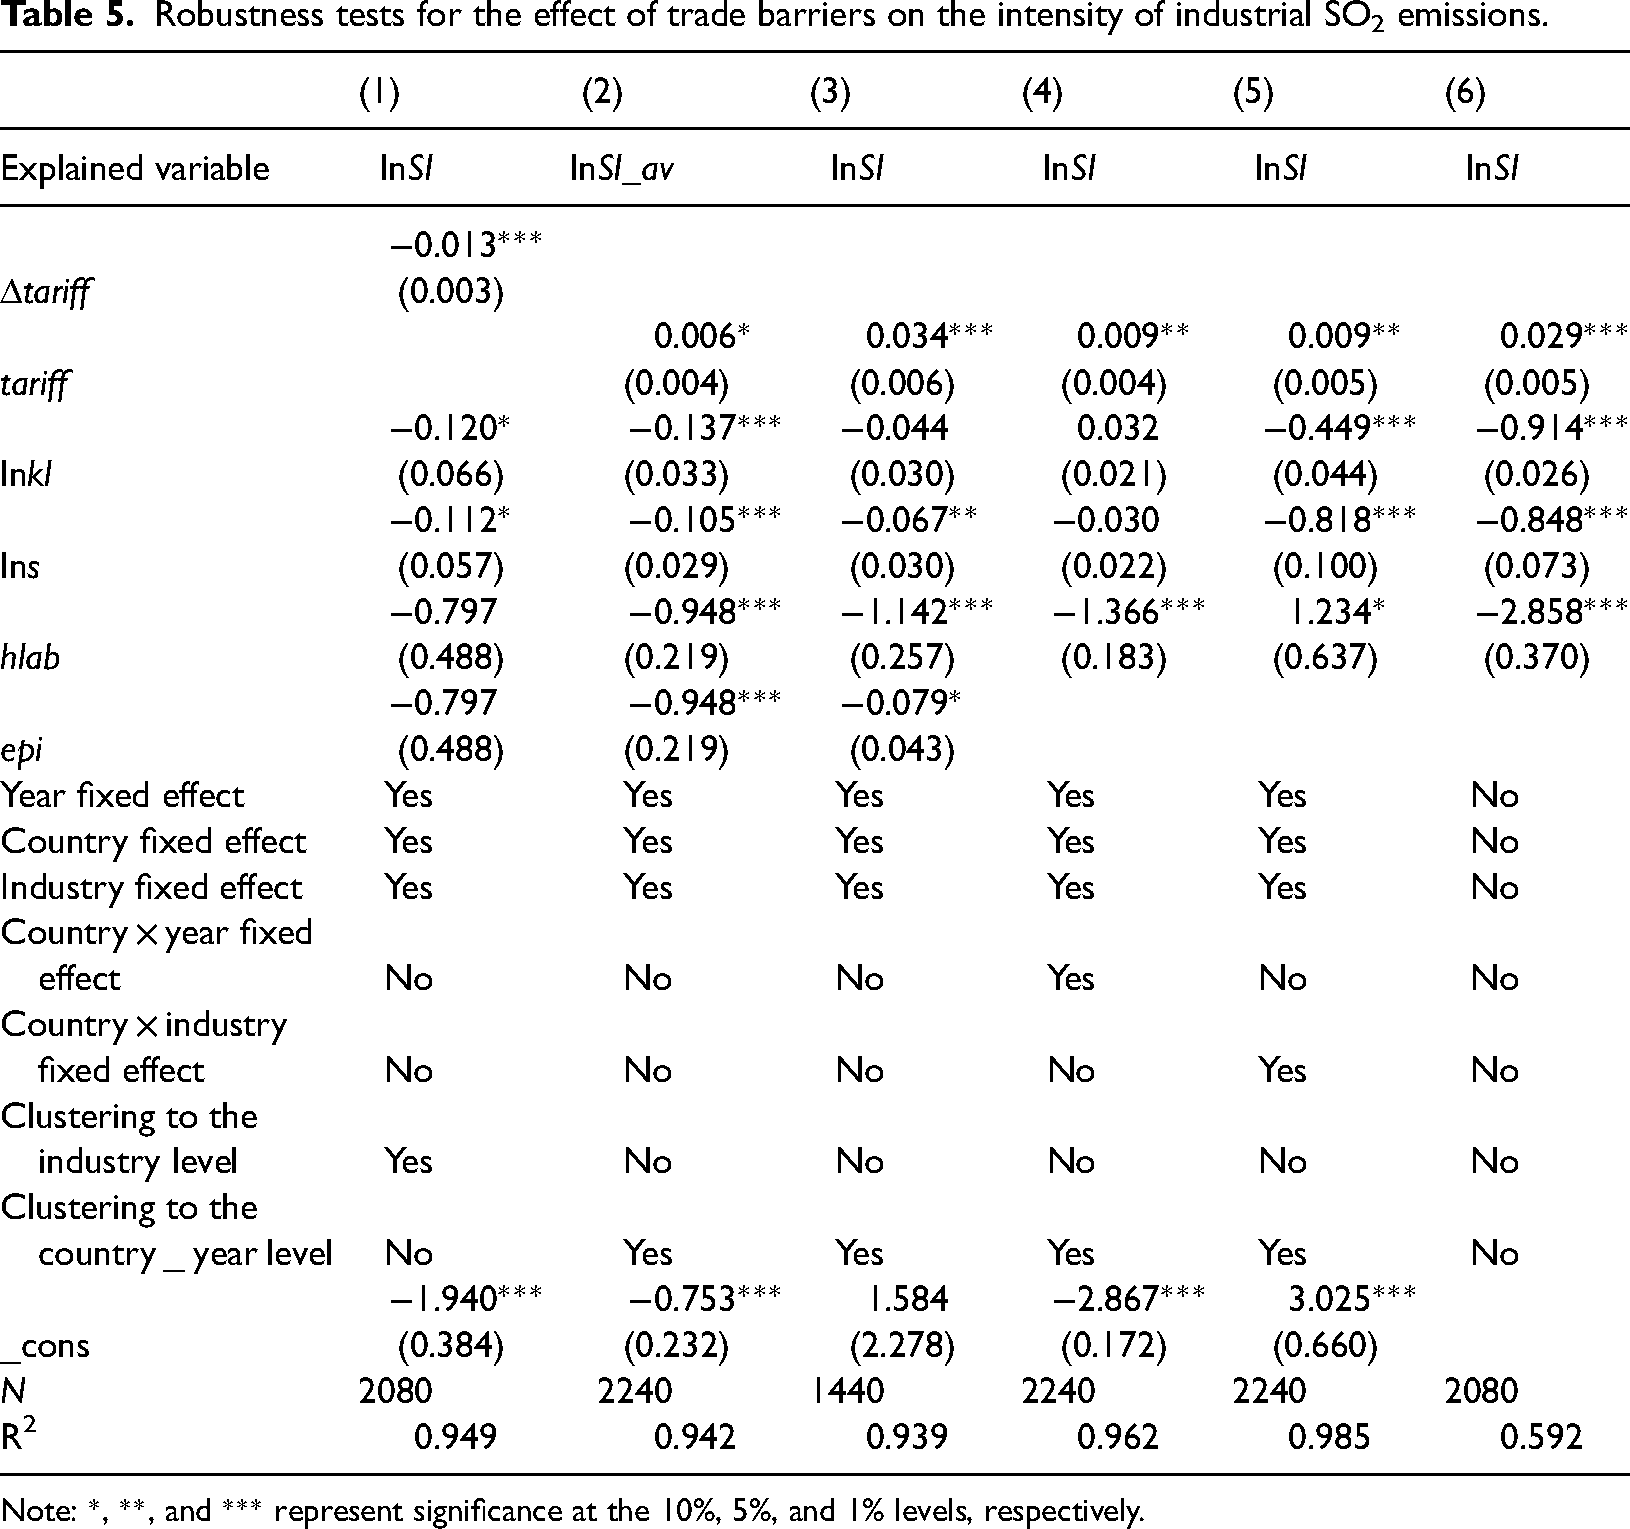
Note: *, **, and *** represent significance at the 10%, 5%, and 1% levels, respectively.
Another concern regarding the previous findings is that the effect of environmental regulation may have been omitted from the effect of trade barriers on the intensity of industrial SO2 emissions. Environmental regulation means the government aims to protect the environment by regulating various actions that pollute it, thus converting the social costs of environmental pollution, a negative externality, into private costs. 42 Within the sample range of this study, all the countries have implemented a wide range of environmental regulatory policies. For example, in 2003, the Chinese government promulgated Management Regulations of Pollutants Discharge Fee Collection and Usage, which was reformed. It improved the charging standards and management methods for the discharge of industrial “three wastes.” Since the 1990s, the U.S. government has gradually established and improved the toxic substances emission inventory system to encourage enterprises to improve their environmental performance through information disclosure. Existing studies show that environmental regulations significantly impact industrial pollution emissions, while the level of trade barriers is also closely related to environmental regulations. 39 Therefore, the omission of environmental regulation may discredit the regression results.
However, measuring the intensity of environmental regulation in each country's industrial sector has been a major challenge for existing research. Academic metrics for environmental regulation can be divided into two main categories: input-based indicators (e.g. the amount of investment in treating the environment and sewage charges) and performance-based indicators (e.g. SO2-removal rate and wastewater-discharge compliance rate). 43 Since it is difficult to collect environmental regulation data at the industrial-sector level in different countries, data consistency and comparability are difficult to ensure. We first use the environmental performance index (EPI) at the national level to construct environmental regulation indicators for robustness analysis. The EPI, jointly published by the Center for Environmental Law and Policy at Yale University and the Center for International Earth Science Information Network at Columbia University, specifically includes two basic objectives, ten policy categories, and 22 sub-indicators of environmental health and ecosystem vitality. The indicators cover air, water, ecosystems, energy, and climate change and can effectively reflect each country's intensity of environmental regulation. 44 The regression results of adding environmental regulation variables at the national level are shown in Column 3 of Table 5.
The regression results in Column 3 of Table 5 show that the regression coefficient of the import tariff rate variable remains positive and significant after accounting for the effects of environmental regulation, indicating that the higher the trade barriers, the higher the intensity of industrial SO2 emissions. As the EPI only characterizes the intensity of environmental regulation at the country level and fails to capture the state of environmental regulation at the industry level, we further validate the robustness of the basic findings by controlling for the fixed effects at the implementation level of environmental regulation policies. Considering that environmental regulation policies are mostly implemented and regulated by countries or industries, the cross-product term of the country and year fixed effects and the cross-product term of the country and industry fixed effects are included in the regressions to control for environmental regulation factors. The regression results are shown in Columns 4 and 5 of Table 5. The regression results remain consistent with the baseline regression results. In summary, the baseline regression results remain robust after considering the impact of potential environmental regulation.
The discussion on the robustness of the regression results in the previous section is not comprehensive, which is reflected in the possible two-way causality problem between trade barriers and industrial SO2-emission intensity: On the one hand, the level of trade barriers may affect the industrial SO2-emission intensity. The industrial pollution situation may also influence national settings regarding tariff barriers; for example, developed countries may reduce import tariffs on polluting products and expand the imports to replace the domestic production of polluting products, thus transferring industrial pollution to exporting countries. The existence of the two-way causality may render the benchmark regression results inconsistent. To solve this problem, we further use the instrumental-variable method. The selection of instrumental variables must satisfy the two conditions of relevance and exogeneity; thus, we select the one-period lagged import tariff rate as the instrumental variable. Its rationality lies in that, on the one hand, the import tariff rate lagging for one period is a historical variable that has been determined. In contrast, the factors in the industrial SO2-emission intensity in the current period are unrelated to it. Thus, the assumption of the externality of instrumental variables is satisfied.
On the other hand, the import tariff rate of the previous period is strongly correlated with the current import tariff rate. Generally, the higher the import tariff rate of the previous period, the higher the current import tariff rate, which satisfies the correlation hypothesis of instrumental variables. The regression results in Column 6 of Table 5 show that the effect of trade barriers on the intensity of industrial SO2 emissions remains positive and significant, while the coefficient is larger. This indicates the robustness and reliability of the finding that lowering trade barriers can curb industrial pollution emissions.
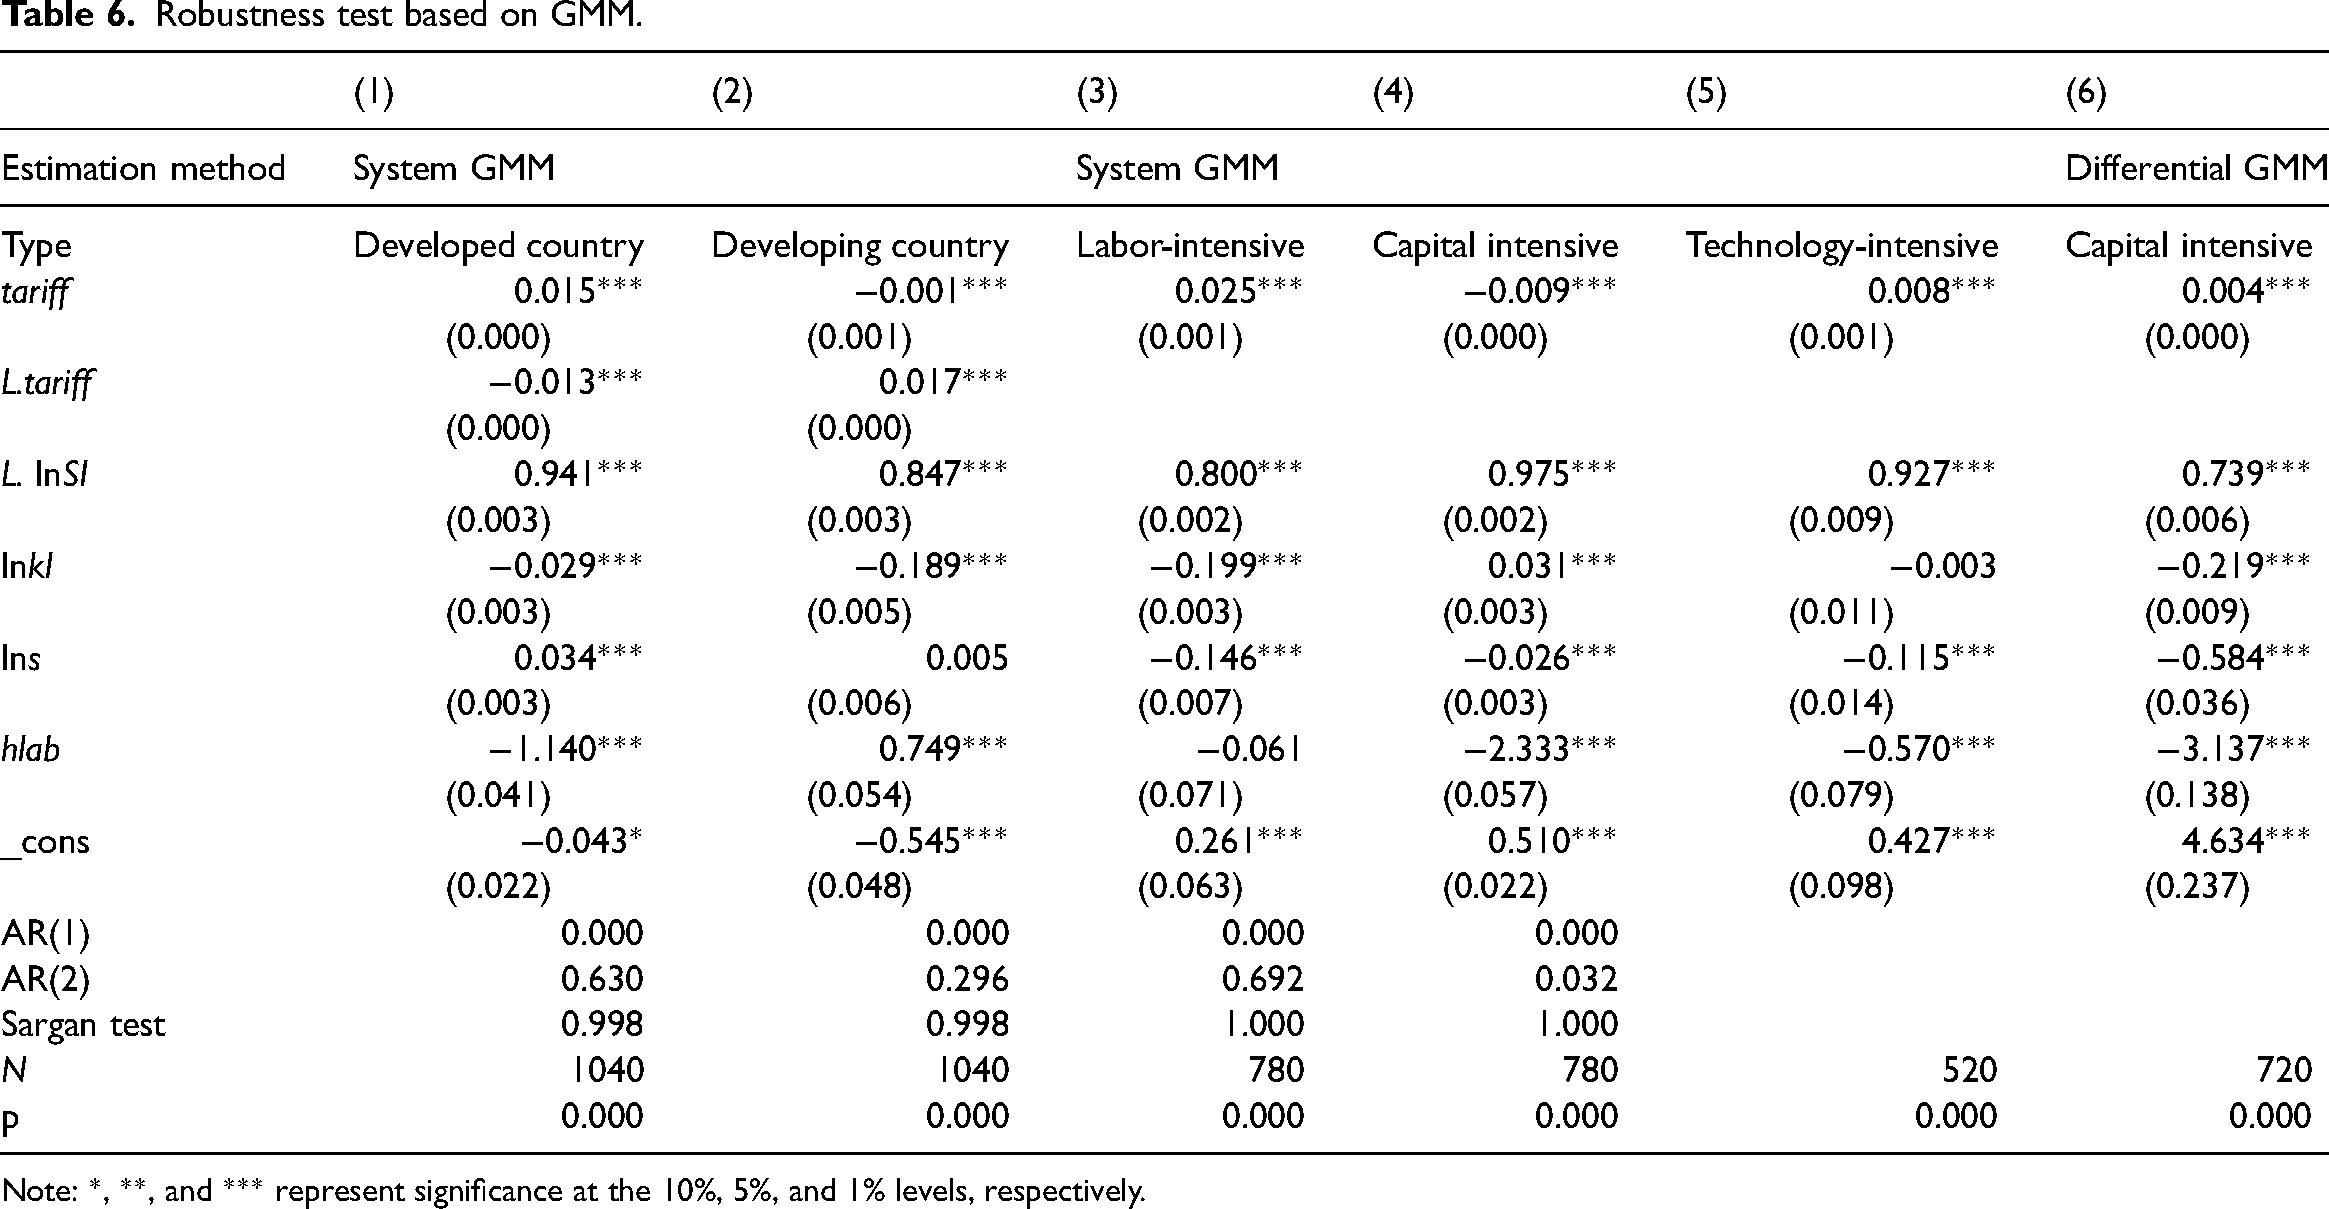
The basic conclusions of this study have been verified by analyzing endogeneity sources such as measurement error, omitted variables, and bidirectional causality. However, the robustness of the sub-sample regression results has not been tested. In addition, the fixed-effect model was mainly used for empirical study in the previous section, while the potential model-setting bias has not been discussed. Considering the continuity of enterprises’ pollution discharge behavior, we introduce the first-order lag term, L.lnSI, of the explained variable as the explanatory variable to perform a dynamic panel estimation based on the static model. System generalized method of moments (GMM) is widely used in dynamic panel-data estimation to deal with endogeneity problems. Therefore, we adopt the GMM model to verify the robustness test results for different countries and industries. The regression results are shown in Columns 1 to 5 of Table 6.
Robustness test based on GMM.
Note: *, **, and *** represent significance at the 10%, 5%, and 1% levels, respectively.
The rationality of the dynamic panel setting was tested by the significance of the explanatory variables with a one-period lag, the results of the AR(1) and AR(2) tests of the system GMM, and the results of the Sargan test The results show that the coefficient of L.lnSI is positive and significant at the 1% level, reflecting that the industrial SO2-emission intensity has path dependence and dynamic characteristics. The industrial SO2-emission intensity of the previous period has a significant and positive impact on the current industrial SO2-emission intensity. The Arellano-Bond and the over-identification tests in Columns 1, 2, 3, and 5 all passed, indicating that the disturbance terms are not auto-correlated, the instrumental variables are all valid, and the model setting is reasonable. The results of the Arellano-Bond test in Column 4 show that the disturbance term has an autocorrelation problem. To solve this problem, we re-adopt the differential GMM model for regression and show the results in Column 6 of Table 6. According to the Arellano-Bond and the overidentification test results, adopting the differential GMM model for regression is reasonable. From Table 6, the sub-sample regression results after the change of estimation methods remain consistent with the above. A reduction in trade barriers in developed countries can reduce the industrial SO2-emission intensity, while a reduction in trade barriers in developing countries will increase the industrial SO2-emission intensity. For labor-capital-and technology-intensive industries, lower trade barriers are conducive to reducing pollution emissions.
Mechanism analysis
The previous section answered whether trade barriers affected industrial pollution-emission intensity through robust analysis; however, it did not clarify how they affected it. Therefore, based on the previous analysis, this section investigates the specific transmission mechanism through which trade barriers affect industrial pollution-emission intensity.
Considering pollution emissions and industrial output
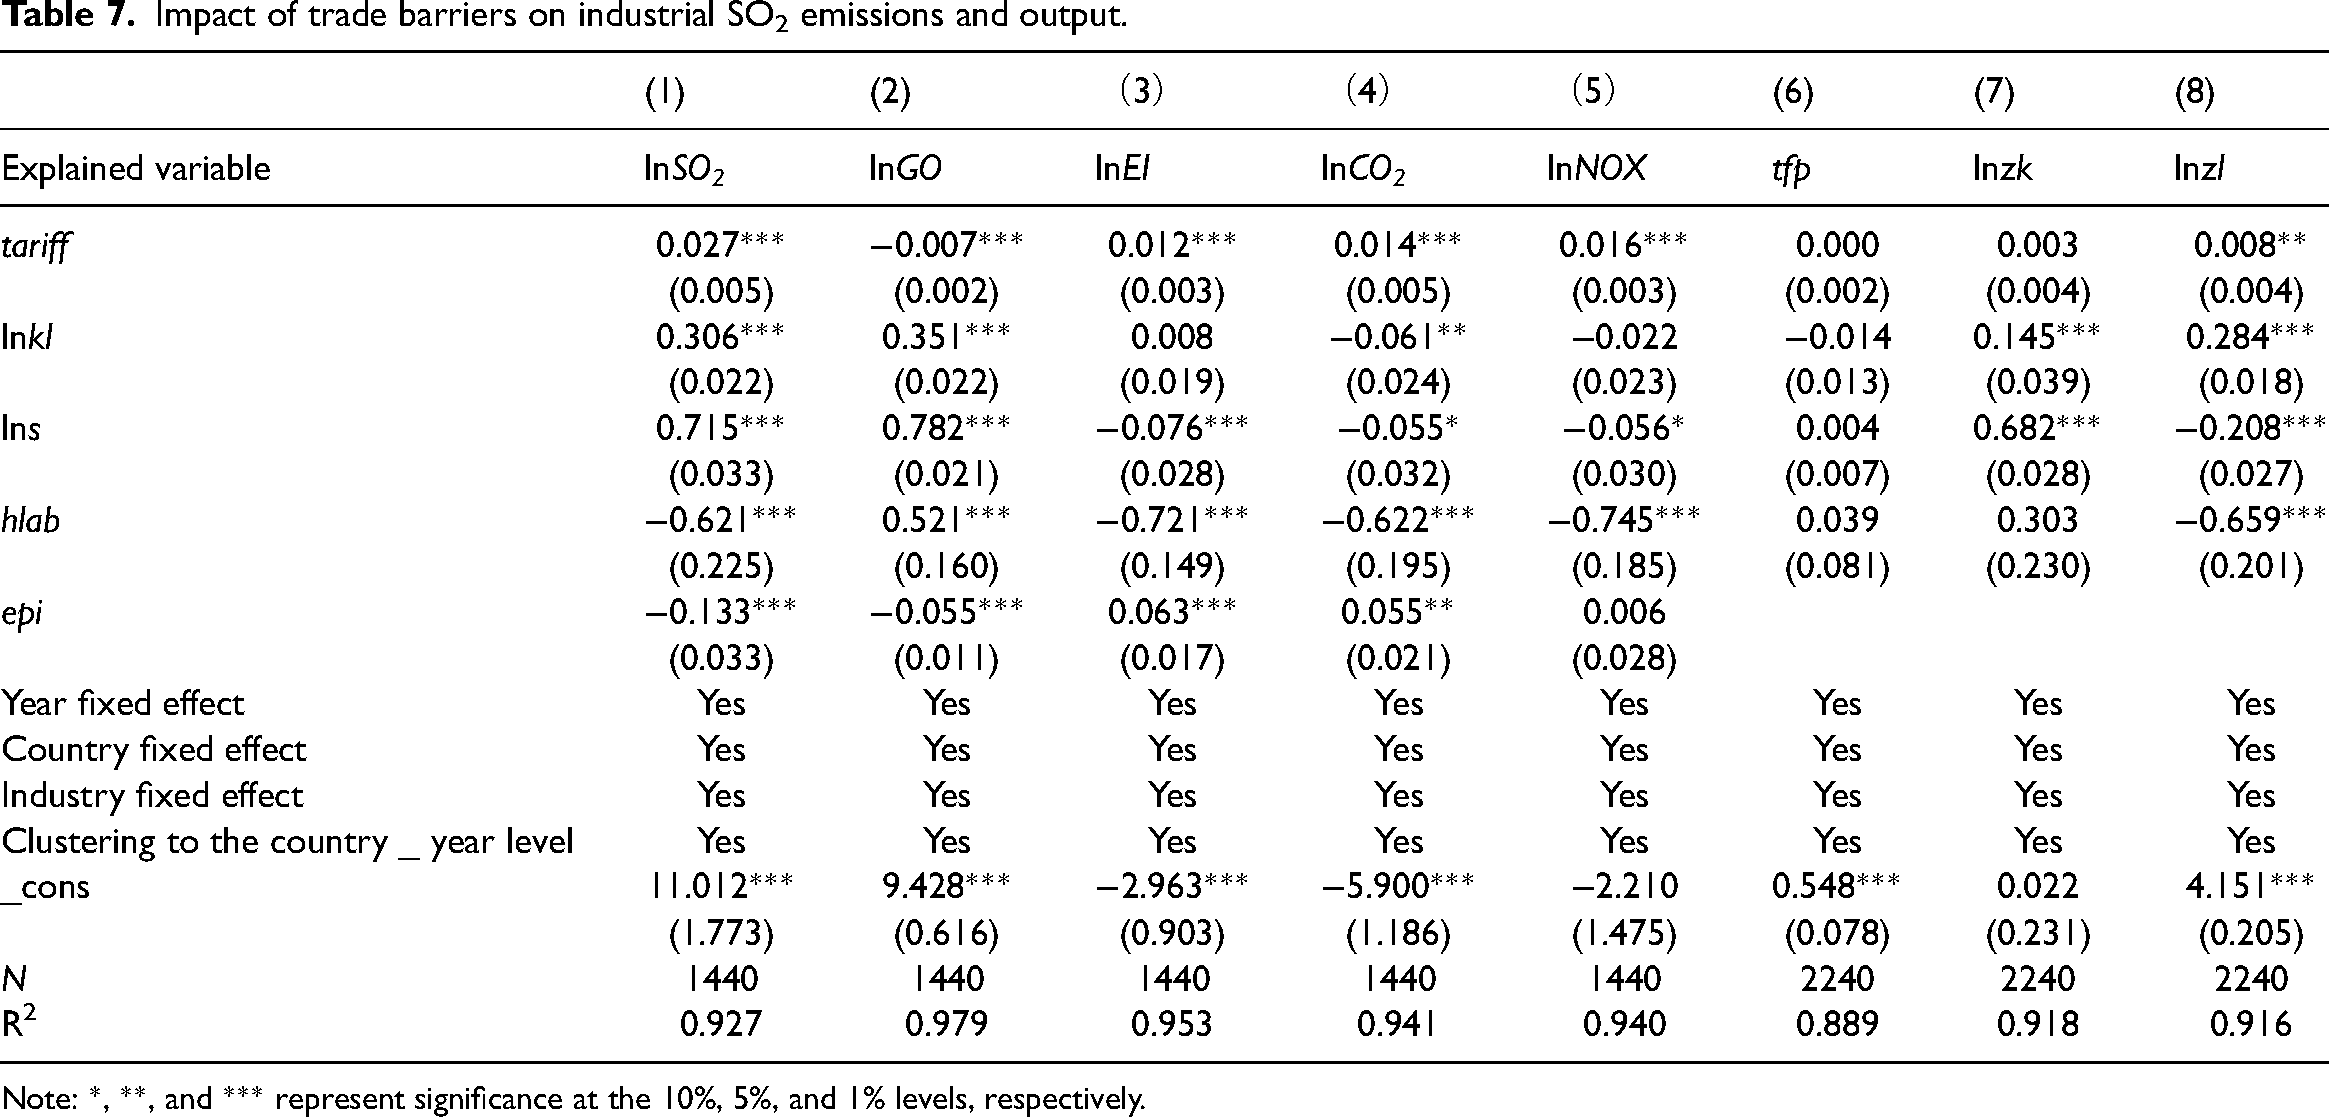
An analysis of the above results shows that lowering trade barriers reduces industrial SO2 emissions. This intensity is the ratio of SO2 emissions to total industrial output value; thus, the change in industrial SO2-emission intensity may be due to a change in SO2 emissions, industrial output, or both. We used the logarithms of SO2 emissions (lnSO2) and gross industrial output (lnGO) to clarify this mechanism as explanatory variables in the regressions. The results are shown in Table 7. Column 1 of Table 7 reports the logarithm of SO2 emissions as the explained variable against tariff barriers. The regression coefficient of tariff is positive and significant at the 1% level, indicating that an increase in trade barriers significantly increases SO2 emissions. Column 2 of Table 7 reports the regression result when the gross industrial output value is the explained variable against tariff barriers; the result shows that the regression coefficient of tariff is negative and significant at the 1% level, indicating that the higher the trade barriers, the less the industrial output. The impact of trade barriers on industrial SO2-emission intensity, as is suggested, is transmitted through both SO2 emissions and industrial output. Reducing trade barriers is conducive to reducing industrial pollution and is also conducive to increasing output and promoting economic growth. Improving trade liberalization can bring about the dual effects of economic growth and environmental improvement.
Impact of trade barriers on industrial SO2 emissions and output.
Note: *, **, and *** represent significance at the 10%, 5%, and 1% levels, respectively.
Considering energy use
According to the above research, raising trade barriers will increase industrial SO2-emission intensity, while industrial SO2 emission is mainly generated by energy use, represented by coal and oil. Therefore, if raising trade barriers increases SO2-emission intensity, the corresponding energy-use intensity will also increase. The explained variable is replaced by the energy-use intensity in the regression analysis to verify this mechanism. The energy-use intensity index is expressed as the ratio of energy use to the industrial gross output value. The regression results are shown in Column 3 of Table 7. The results show that the regression coefficient of the core explanatory variable, tariff, is 0.012, which is positive and significant at the 1% level. Indicating that energy-use intensity would increase by 1.2% when trade barriers were raised by one unit, i.e., trade barriers would increase industrial SO2-emission intensity by increasing energy-use intensity. This means that the higher the degree of trade liberalization, the more conducive to the comprehensive mobilization of trade resources, optimizing the energy structure of each country, improving the energy utilization efficiency of each country, and thus achieving better energy conservation and emission reduction.
The above analysis preliminarily verified that trade barriers might affect industrial SO2-emission intensity through industrial sectors’ energy-use intensity. To further demonstrate the rationality of this mechanism, the explained variables were replaced by logarithmic values of CO2-emission intensity (lnCO2) and nitrogen oxide-emission intensity (lnNOX) in the regression. The underlying logic is that if trade barriers affect industrial SO2-emission intensity through energy-use intensity, then other exhaust-pollution emissions associated with energy use should also be affected by trade barriers. From the results in Columns 4 and 5 of Table 7, the coefficient values of lnCO2 and lnNOX are positive and significant at the 1% level. Indicating that the higher the trade barriers are, the higher the emission intensity of CO2 and nitrogen oxide will be, which further confirms that energy-use intensity is an important channel through which trade barriers affect industrial SO2-emission intensity.
Mechanism of technology effect
Economic entities’ participation in international trade can generate technology spillover and learning effects, stimulate the progress of green technology, and thus reduce environmental pressure. A study by Wamba et al. (2019) 45 confirms that investing in core R&D technologies can help reduce environmental pollution, which will reverse the pollution inherited by developing countries participating in international trade. Therefore, on the premise that technological progress can reduce environmental pollution, it is necessary to consider the impact of technological progress in studying the relationship between trade barriers and environmental pollution. Since Acemoglu (2002) 46 proposed the concept of “biased technological progress,” many scholars have emphasized the importance of distinguishing neutral technological progress from biased technological progress when studying economic phenomena. Therefore, we distinguish neutral technological progress from biased technological progress when we explore the mechanism of trade barriers affecting industrial SO2-emission intensity.
In this study, we use the Malmquist-Luenberger index to calculate environmental total factor productivity, which measures neutral technological progress, referring to the methods of Chung and Fare (1997).
47
The specific formula is:
Columns 6-8 of Table 7 report the regression results for different technological progress and trade barriers in the 10 countries, with Column 6 showing the regression results of neutral technological progress and Columns 7 and 8 showing the results of biased technological progress. From column 6, the regression coefficient of tariff is close to 0 and insignificant, indicating that trade barriers do not significantly affect neutral technological progress. Column 7 shows the impact of trade barriers on capital-biased technological progress. Capital-biased technological progress is positively correlated with trade barriers, while the relationship is insignificant. This change may be because our study includes five developing and five developed countries, while there are large differences in capital stock among different governments.
Column 8 reports the regression results for trade barriers on labor-biased technological progress. The results show that the regression coefficient of tariff is positive and significant, indicating that raising trade barriers is conducive to promoting labor-biased technological progress. This is mainly because, on the one hand, the establishment of tariff trade barriers can block the entry of some low-quality, low-technology products, while high-technology products entering a country through trade transactions will generate technological spillover and learning effects, thus contributing to the improvement of the country's technological level. The rise in tariffs will raise the price of the products exported to other countries’ markets. In contrast, the low-technology, labor-intensive products in the international market will lack a competitive advantage. This will force countries with lower technology levels to improve the technological content of their products and form core technological advantages to mitigate the adverse effects of the tariffs. Based on the above analysis, we find that biased technological progress is the key technological effect mechanism through which trade barriers affect industrial pollution emissions. Based on the above research results, we believe that the government should play a guiding role in the process of enterprise technological innovation, prompting industrial enterprises to get rid of their dependence on energy and environmental factors, prioritize the use of labor and capital factors to improve production methods, optimize the direction of technological progress, and achieve the ultimate goal of reducing energy consumption, protecting the environment, and promoting sustainable industrial development.
Conclusions and policy recommendations
Based on the current institutional context of rising international trade protectionism, this study examines the relationship and heterogeneity characteristics between trade barriers and industrial pollution emissions by matching data from the World Bank's WITS and WIOD databases and obtaining industry-level panel data for 10 major countries. It also identifies the influence mechanism of trade barriers on industrial pollution emissions from total industrial output, energy intensity, and technological progress, which provides a theoretical basis and decision reference for governments to formulate trade and environmental policies and carry out industrial pollution prevention. Compared with the existing studies, this study considers the strong endogeneity of trade liberalization (trade barriers) indicators such as total import and export trade and foreign direct investment, so using import tariff rate as a proxy variable for trade barriers can alleviate the endogeneity problem to a certain extent and enhance the reliability of the research results. This study identifies the impact mechanisms of trade barriers acting on industrial pollution emissions and, in particular, distinguishes neutral technological progress from biased technological progress in examining the mechanisms of technological progress of trade barriers affecting industrial pollution emissions, which makes a useful addition to the existing literature.
First, lowering trade barriers reduces industrial pollution emissions, which remain robust after accounting for measurement errors, omitted variables, and bidirectional causality. This means that countries worldwide can improve the environment by cutting tariffs, lowering tariff barriers, encouraging the development of foreign trade and other ways that are conducive to economic growth, and achieving a win-win situation for both the economy and the environment. Second, there is some heterogeneity in the impact of trade barriers on industrial SO2-emission intensity. Reducing trade barriers in developed countries can significantly reduce industrial SO2-emission intensity, while reducing trade barriers in developing countries will increase industrial SO2-emission intensity. Technology-intensive industries are the most sensitive to trade barriers, followed by labor-intensive and capital-intensive industries. This indicates that countries should fully consider their factor endowment, trade structure, and technology level when formulating trade policies, especially developing countries should gradually change their blind pursuit of trade quantity and focus on trade quality improvement instead, striving to narrow the gap between energy-saving and emission reduction technologies with developed countries, and play a positive role of trade liberalization on environmental protection. Third, the impact of trade barriers on industrial SO2-emission intensity is transmitted through both SO2 emissions and industrial output, while energy-use intensity is an important mechanism. Compared with neutral technological progress, biased technological progress is the leading channel through which trade barriers affect industrial SO2-emission intensity. This indicates that countries should gradually eliminate their dependence on energy and environmental elements, improve energy use efficiency, vigorously develop green and clean technologies, and reduce pollution emissions.
The results of this study facilitate an understanding of the environmental effects of trade barriers on important policy implications. First, against the complex backdrop of the global spread of COVID-19 and rising trade frictions between China and the U.S., unswerving global trade liberalization can effectively promote economic growth and improve environmental quality. To this end, developed and developing countries should implement differentiated international trade strategies. Specifically, developed countries can achieve win-win economic growth, energy conservation, and emission reduction through trade liberalization measures, such as tariffs and non-tariff barriers. Based on careful consideration of the country's economic development and industrial structure, developing countries should appropriately assess the environmental carrying capacity and comparative advantages of the countries that transfer and receive industries. A gradual reduction of the tariff level and non-tariff restrictions by stages and industries should follow this and selecting suitable industries for transfer or receipt to fully realize the coordinated development of the economy, environment, and resources.
Second, when formulating environmental policies, governments should make energy efficiency improvement and energy structure optimization one of their main goals, transform the backward development model of “high energy consumption, low output,” and reduce industrial pollution emissions. They should enhance the industrial sector's scientific and technological innovation level by strengthening the construction of scientific and technological personnel and promoting the transformation of scientific and technological achievements. This would enhance the absorption capacity of the industrial sector to the advanced energy-saving and emission reduction technologies of developed countries and give full play to the technological effects of trade liberalization on environmental pollution.
Third, governments should pay attention to the impact of technological progress on environmental pollution and actively take policy measures to guide technological progress to be invested more in energy-saving to reduce pollution emissions. The government can improve the factor price system of capital and labor through market-oriented reforms, reduce the fluctuation of the relative price of energy factors, and promote enterprises to carry out energy-saving technological innovation; the government can also implement an import-tariff preference for energy-saving and emission-reduction technology and equipment, reduce non-tariff restrictions, and promote the learning, R&D, and application of advanced energy-saving and emission-reduction technologies by domestic industrial departments.
In studying the relationship between trade barriers and industrial pollution emissions, we attempted to collect index data from the WTO, World Bank, UN Comtrade, and UNCTAD databases to construct a full sample of over 200 countries and regions for the empirical research. However, on the one hand, limited by the openness and difficulty of access to industry-level data in each country, and considering the different data sources and statistical scope of different databases, the comparability and consistency of data are poor, which may easily cause large regression bias. Thus this paper finally selects only the industry-level indicator data of 10 major countries from 1996 to 2009. In the future, with the gradual establishment and opening of trade and environment-related databases in various countries, we will continue to collate full sample data at the industry and enterprise levels of all countries to test the research conclusions and theoretical mechanism of this study comprehensively and insightfully over a longer period.
Footnotes
Declaration of conflicting interests
The author(s) declared no potential conflicts of interest with respect to the research, authorship, and/or publication of this article.
Funding
The author(s) disclosed receipt of the following financial support for the research, authorship, and/or publication of this article: This work was supported by the National Natural Science Foundation of China [grant numbers 71934001, 71471001, 41771568, 71533004, 71601170]; and the Fundamental Research Funds for the Central Universities [grant number 201961046].