
Abstract
In this paper, a genetic algorithm is applied to optimize the sizing of an autonomous renewable energy multi-source system for reliable and economical supply of energy. The multi-source system is composed of a photovoltaic generator, a pumped storage hydropower system and a battery. The system will power public lighting and operate a garden fountain in the Botanical Garden, located in the Alexandre Aibéo Park in Covilhã (Portugal). Solar irradiance is initially simulated for a reference photovoltaic capacity (25 kWp) over one year by the PVsyst software for the city of Covilhã. Two objective functions are used for sizing optimization: the loss of power supply probability (LPSP) and the levelized cost of energy (LCE). The LCE takes into account the capital cost, the replacement cost and the cost of operation and maintenance. The genetic algorithm is used to determine the best configuration of the different subsystems (photovoltaic generator capacity, upper water reservoir capacity and battery capacity). The originality of this work lies in the combination of two storage elements with different dynamics, the introduction of an adapted energy management strategy (EMS) allowing to manage energy flows between the different subsystems and to control the process of charging/ discharging storage elements, and multi-objective optimization (considering technical and economic criteria) of the sizing of the autonomous photovoltaic/pumped storage hydropower/ battery hybrid system using genetic algorithm.
Keywords
Introduction
The ambitious Global Energy Transition Plan aims to achieve a low-carbon climate-resilient future in a safe and cost-effective manner. In many countries, the phasing out of nuclear and coal-fired power plants generation has started with a shift towards new renewable sources including primarily solar energy for power generation. However, solar has variable energy supply and difficult to match with energy demand. Hydroelectricity, with untapped potential, has all the characteristics to support the integration of solar energy into microgrids through the flexibility of production via turbine as well as the vast potential for pumped storage.
High-performance stand-alone PV microgrids typically take advantage of a combination of hydroelectric and battery storage to ensure reliable and affordable energy supply: this combination is used according to the excess/ deficit of the amount of net energy (the difference between PV energy generation and consumption), to balance production demand and mitigate the intermittency of the photovoltaic source.
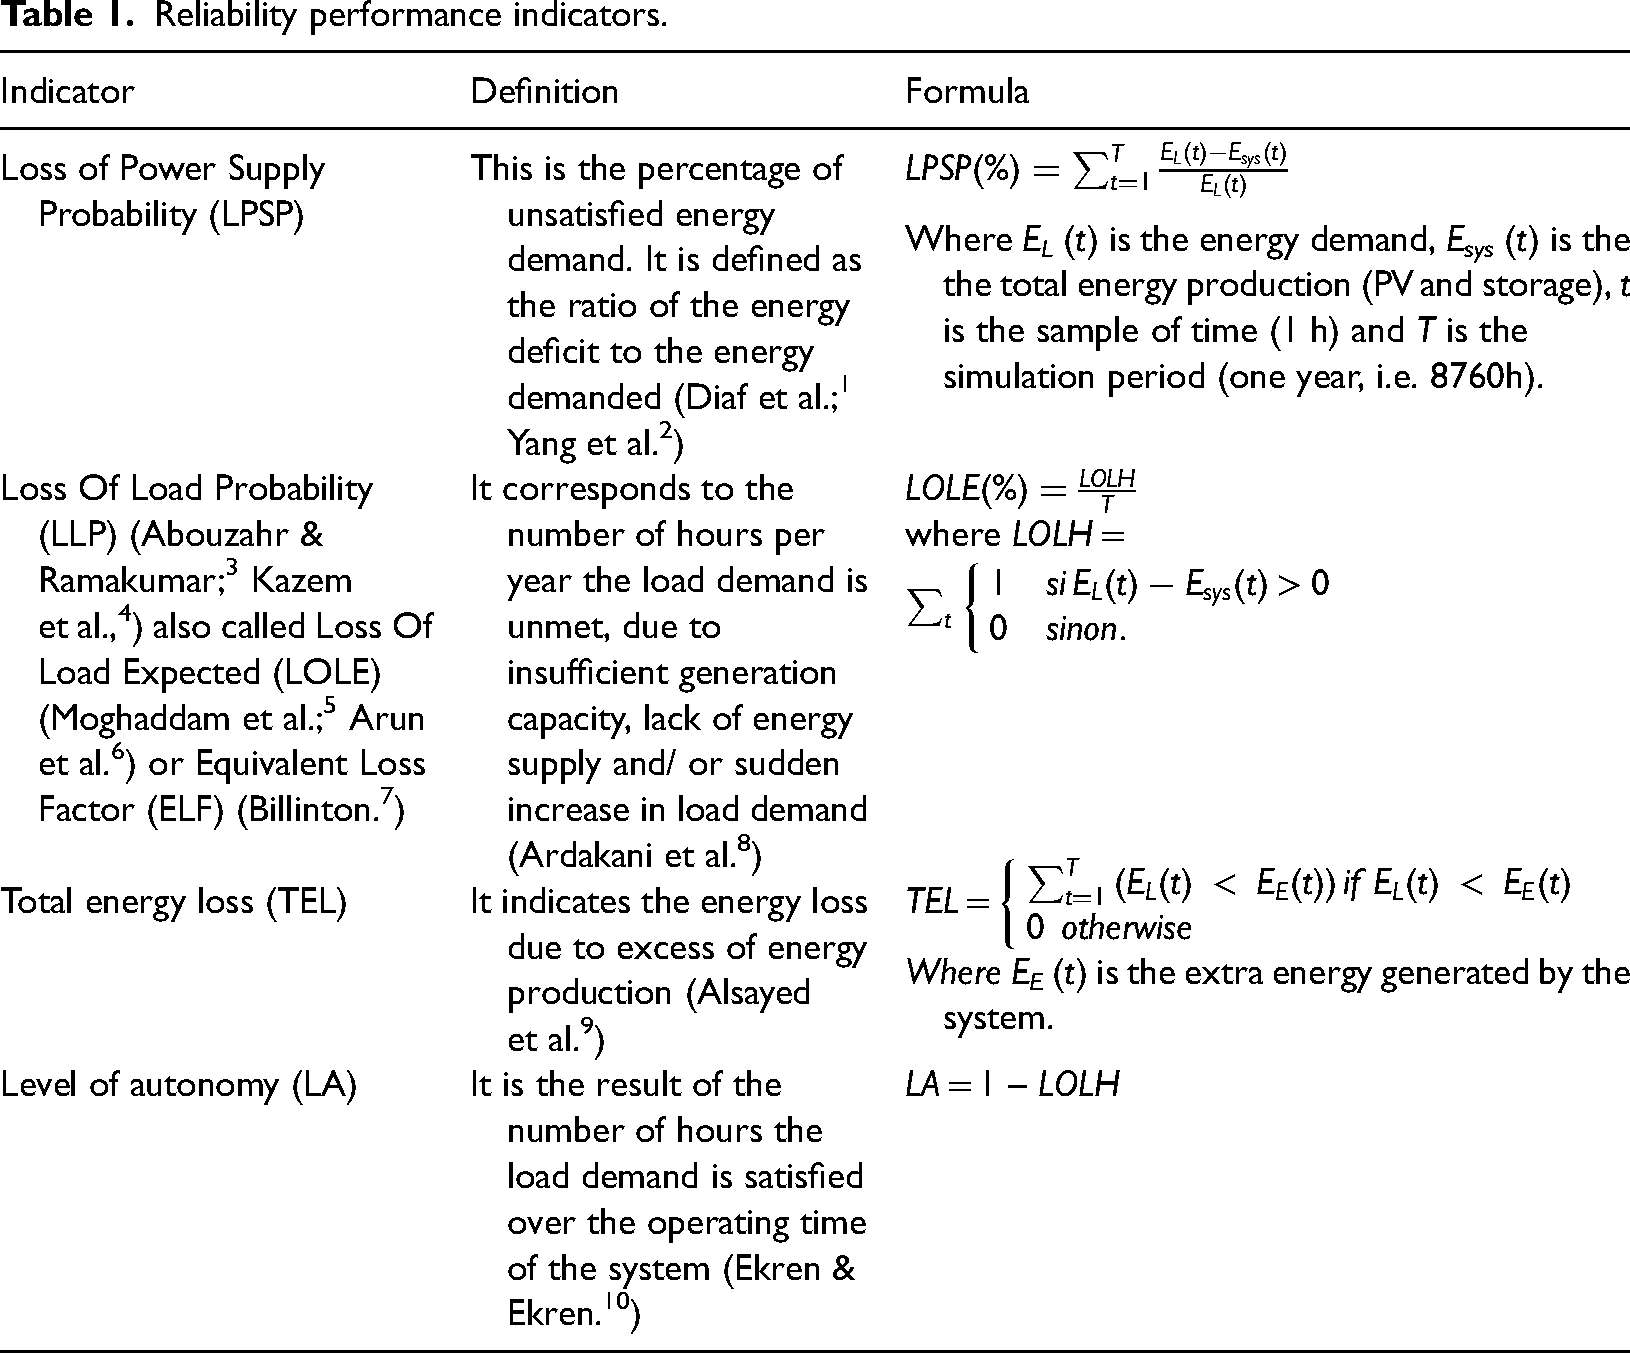
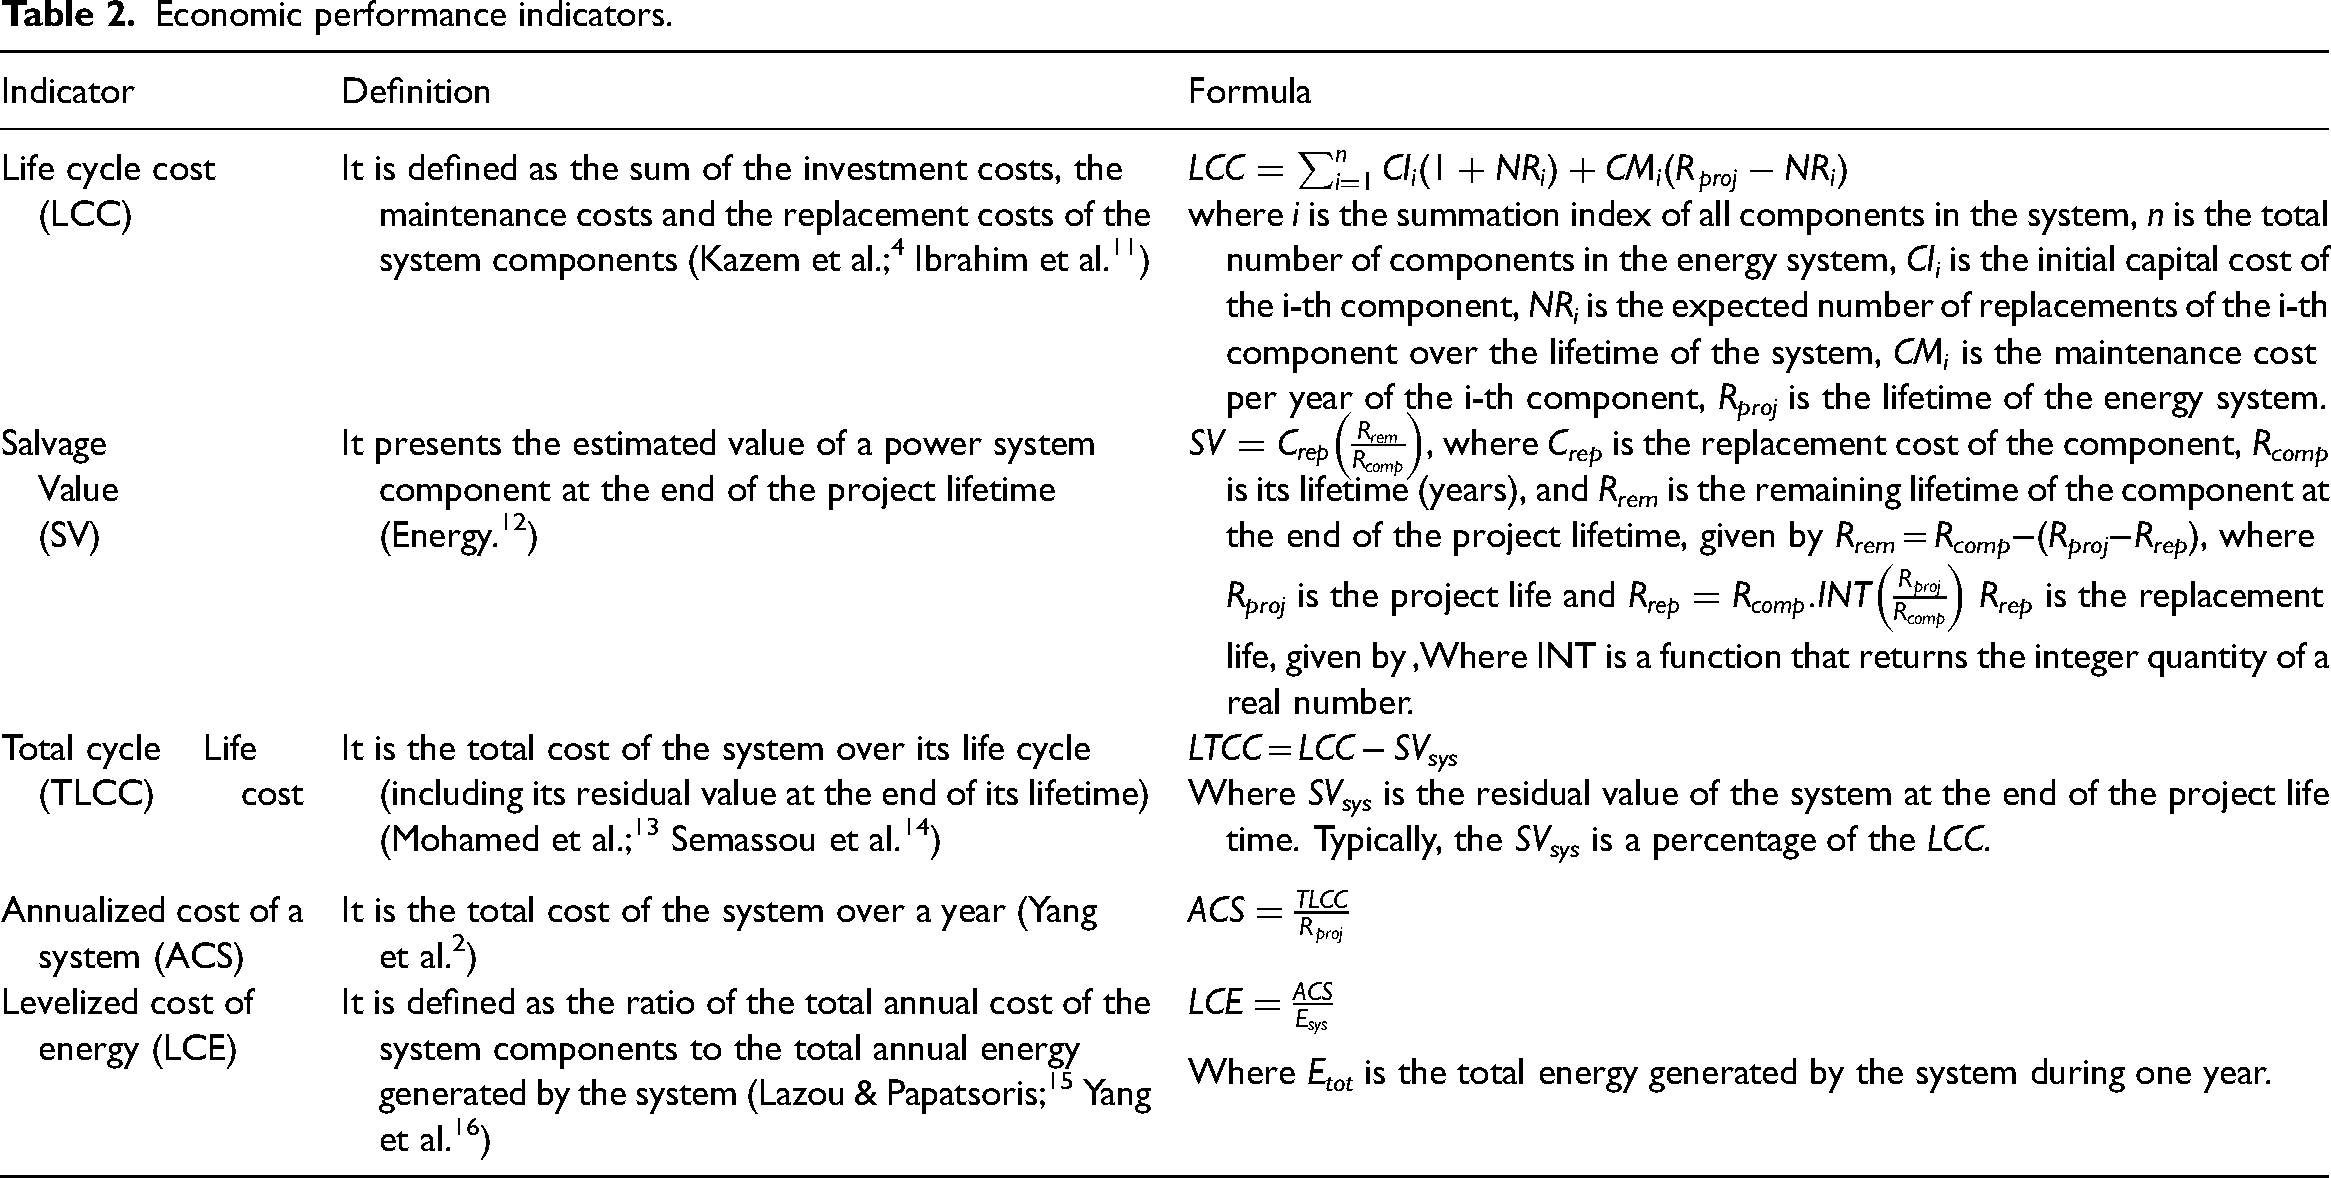
A stand-alone hybrid renewable energy system must be optimally designed to cover the desired load demand at a defined level of availability. This requires knowing certain parameters such as the potential of each energy source, mathematical models of system components, sizing methodologies and end-user requirements. This data helps designers reliably improve system efficiency to meet end-user needs at a desired level of availability and an acceptable cost range. Thus, the selection of evaluation criteria is one of the important steps in the optimal design of a multi-source systems. Several research works have introduced a multi-criteria approach making the process of selecting the optimal system design more flexible and transparent. This approach is based on criteria covering both technical and economic aspects. In Tables 1 and 2, we review several formulations of reliability and economic performance indicators.
Reliability performance indicators.
Economic performance indicators.
Many studies have been carried out to develop different algorithms to optimize the design of stand-alone hybrid PV systems in order to select the optimum capacities of the PV generator and storage systems. These algorithms can be classified into two categories: evolutionary numerical and analytical algorithms.
Evolutionary algorithms (EA), inspired by Darwin's biological evolution, are optimal numerical research techniques based on the concepts of natural selection and survival of the fittest They work with a fixed-size population of possible solutions to a problem, called individuals, which evolve over time to converge to an optimal solution that meets identified criteria. There are three main steps in all EAs. The first step is the initialization process where the initial population of individuals is randomly generated according to an initial estimate. Each individual represents, directly or indirectly, a solution. In the second step, each solution in the population is evaluated according to the performance criteria. This evaluation process is used to calculate the suitability of the population or to rank the individual solution within the population. The third step is the generation of a new population by disturbing the solutions in the existing population (e.g. setting a reliability criteria). Evolutionary numerical methods offer the advantage of accuracy and the ability to improve by incorporating more complex models of the system components. In these methods, reliability is defined in a systematic way as a predetermined range of PV/ storage system capacities is linearly swept. Numerical algorithms provide accurate results when using rigorous stand-alone PV system models, small step changes, and hourly profiles for weather and load data.
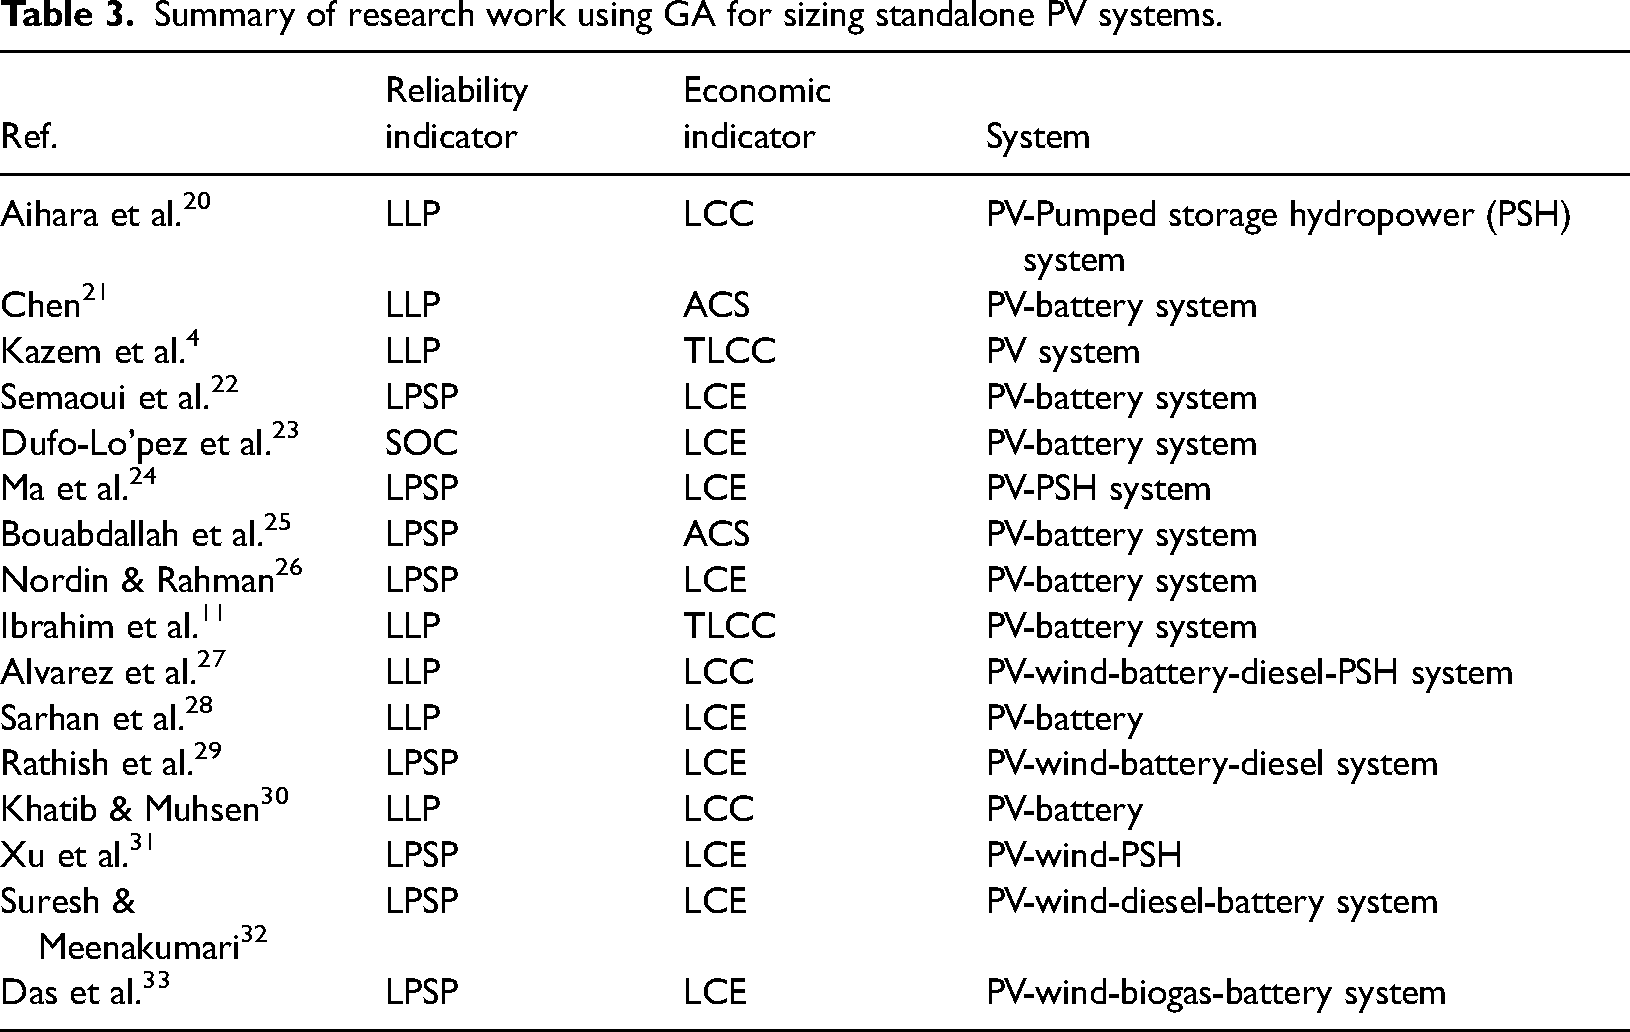
Artificial intelligence (AI) is the latest concept in numerical algorithms, used to overcome the unavailability and non-linearity of weather data in the design of multi-source systems. The most widespread AI techniques for PV system sizing are (Mellit et al. 17 ): Particle Swarm Optimization (PSO), artificial neural networks, genetic algorithms (GA), Artificial bee colony algorithms (ABC) and Ant colony optimization algorithms (ACO). It has been shown, in Fadaee & Radzi; 18 Fezai & Belhadj, 19 that GAs are the most appropriate optimization techniques to apply when designing multi-source renewable energy systems. It has also been shown that these scalable algorithms are very effective in solving nonlinear optimization problems with discrete and continuous variables offering a number of exclusive advantages: robust and reliable performance, global search capability, no information requirements and reduced computational time. A summary of some research works for the sizing of a stand-alone hybrid PV system using GA is listed in the Table 3.
Summary of research work using GA for sizing standalone PV systems.
In this paper, multiobjective optimization using the GA is applied for optimal sizing of a hybrid stand-alone PV/ PSH/ battery system. The performance indicators LPSP and LCE are employed for energetic and economic evaluation of the system. An energy management strategy (EMS) is also developed in order to maintain the balance between energy production and consumption and to improve energy efficiency: reduce storage and production losses, guarantee energy availability and optimize the system sizing to reduce installation and maintenance costs.
Methodology
System modelling
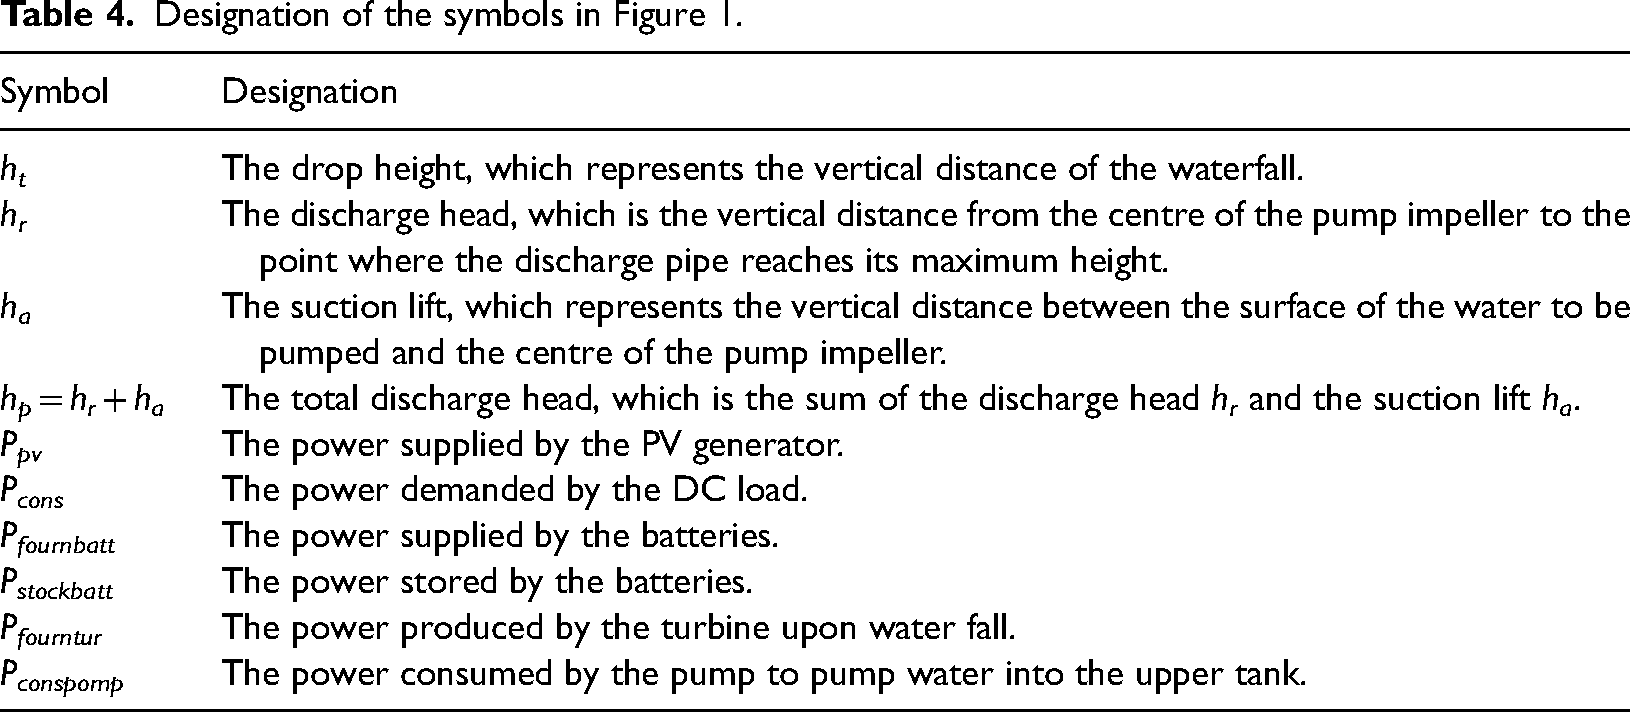
The implemented autonomous hybrid electricity production system is mainly composed of a solar photovoltaic generator, a PSH power plant and batteries. The main objective of the implementation of such a system is to optimize the efficiency of the energy produced in regard to the energy consumed. During the day, solar energy is produced to operate a garden fountain from 8am to 2pm. The excess of solar energy is stored by hydraulic pumping and batteries. The stored energy is used to power the public lighting of a park during the night from 9pm to 5am and to operate the fountain in case of a deficit in solar production during the day. Figures 1 and 2 illustrate the energy system implemented in the Alexandre Aibéo Park (Botanical Garden) and the daily energy consumption profile. The designations of the symbols in Figure 1 are listed in Table 4. To simplify this study, we have assumed the case where ht = hp.
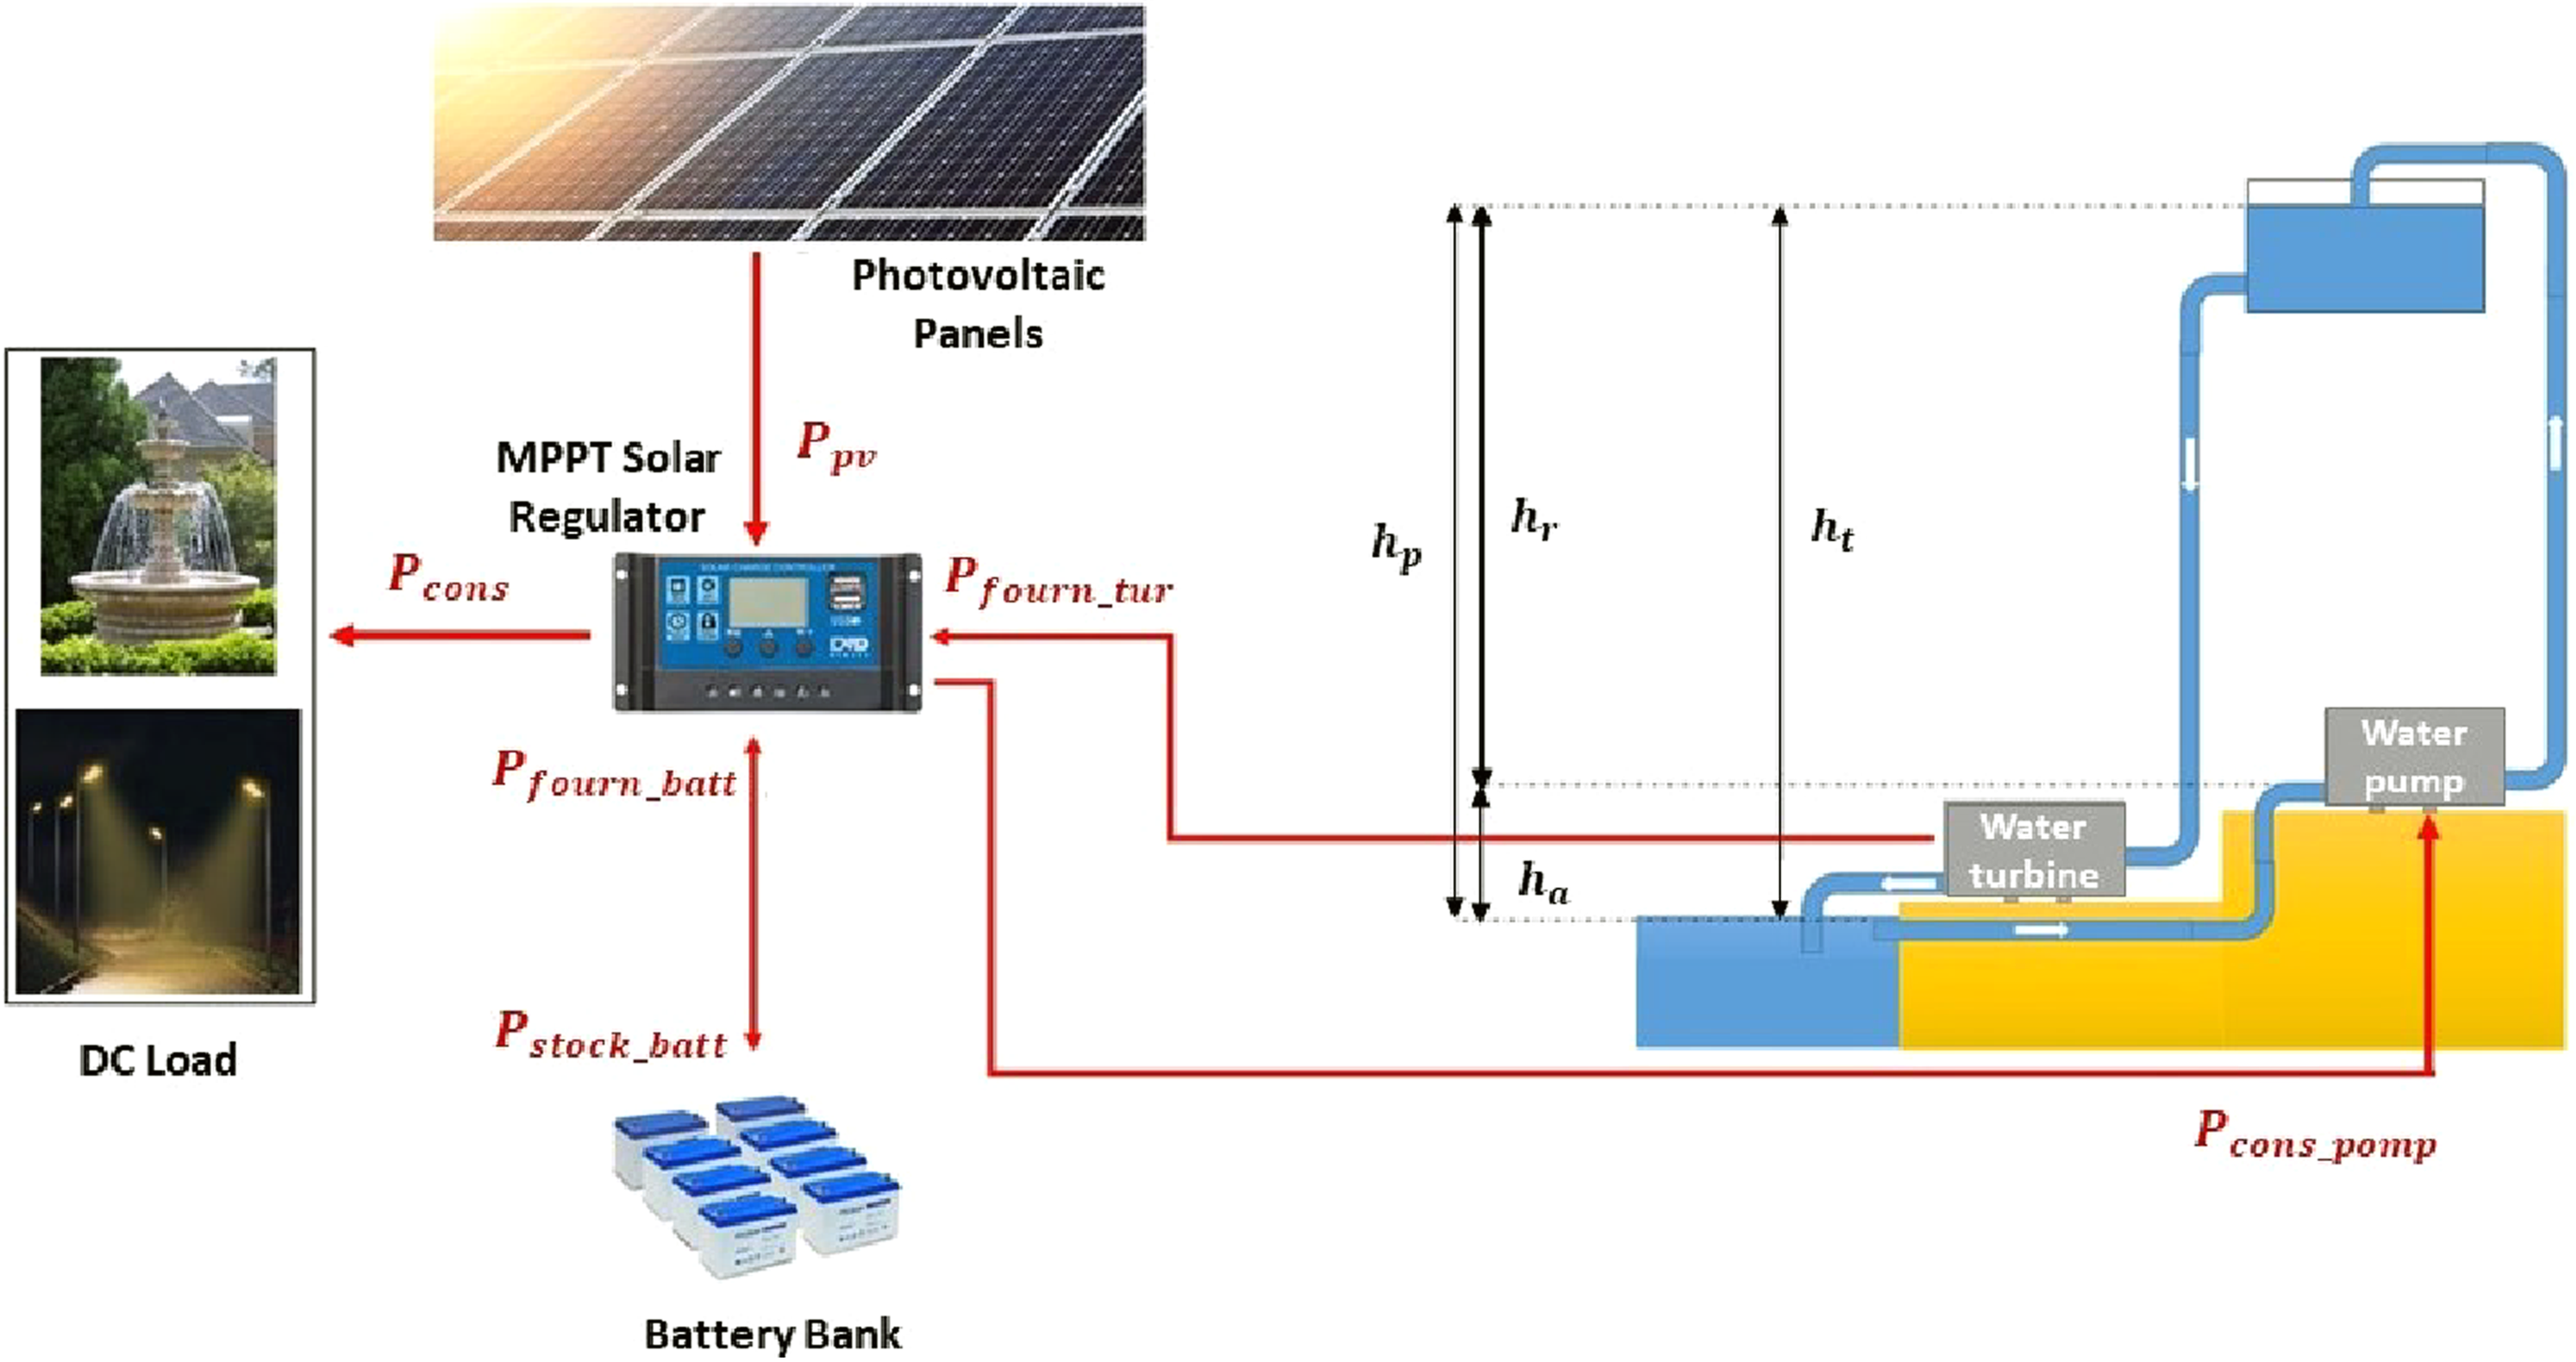
Basic architecture of the implemented energy system in the Alexandra Aibeo Park (Botanical Garden).
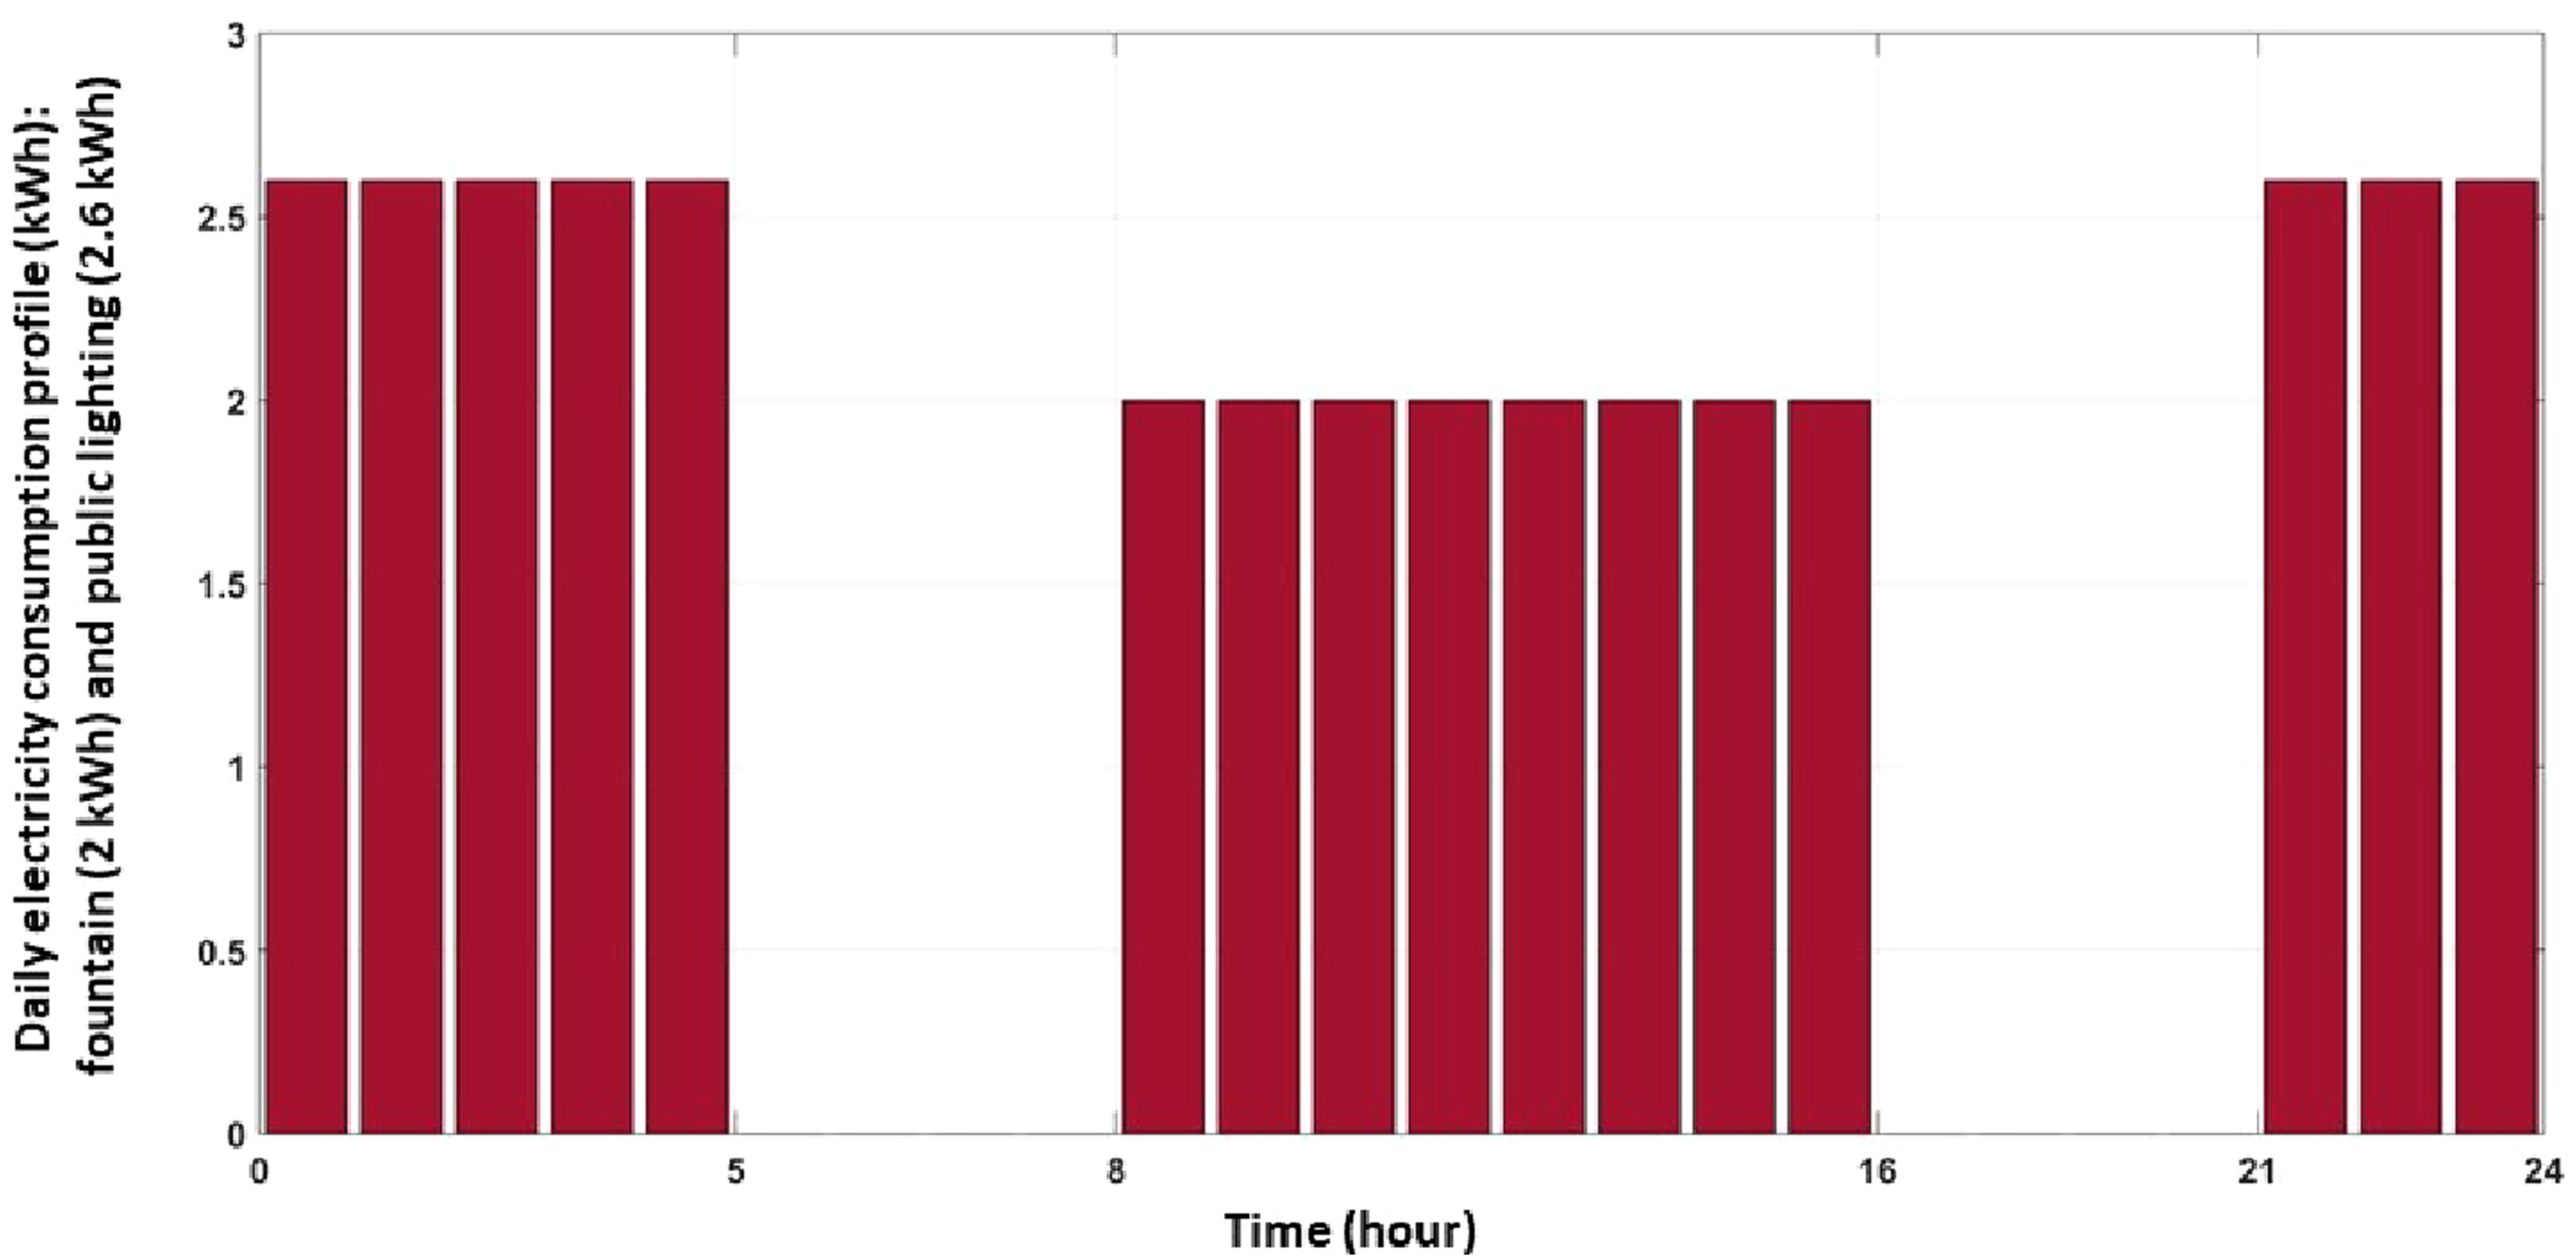
Daily electricity consumption profile (kWh): fountain (2 kWh) and public lighting (2.6 kWh).
Designation of the symbols in Figure 1.
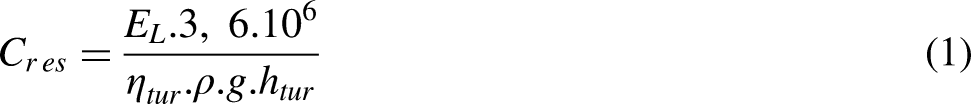
Estimation of the hydraulic storage potential
The required capacity of the upper water reservoir is described by the following equation (Ma et al.
34
):
Estimation of the solar potential
The capacity of the photovoltaic generator required to power the entire system can be estimated using the following equation (Ma et al.
35
):
Estimation of the electrochemical potential
The storage capacity of batteries can be described by the following equation (Chel et al.
36
):
Energy management strategy
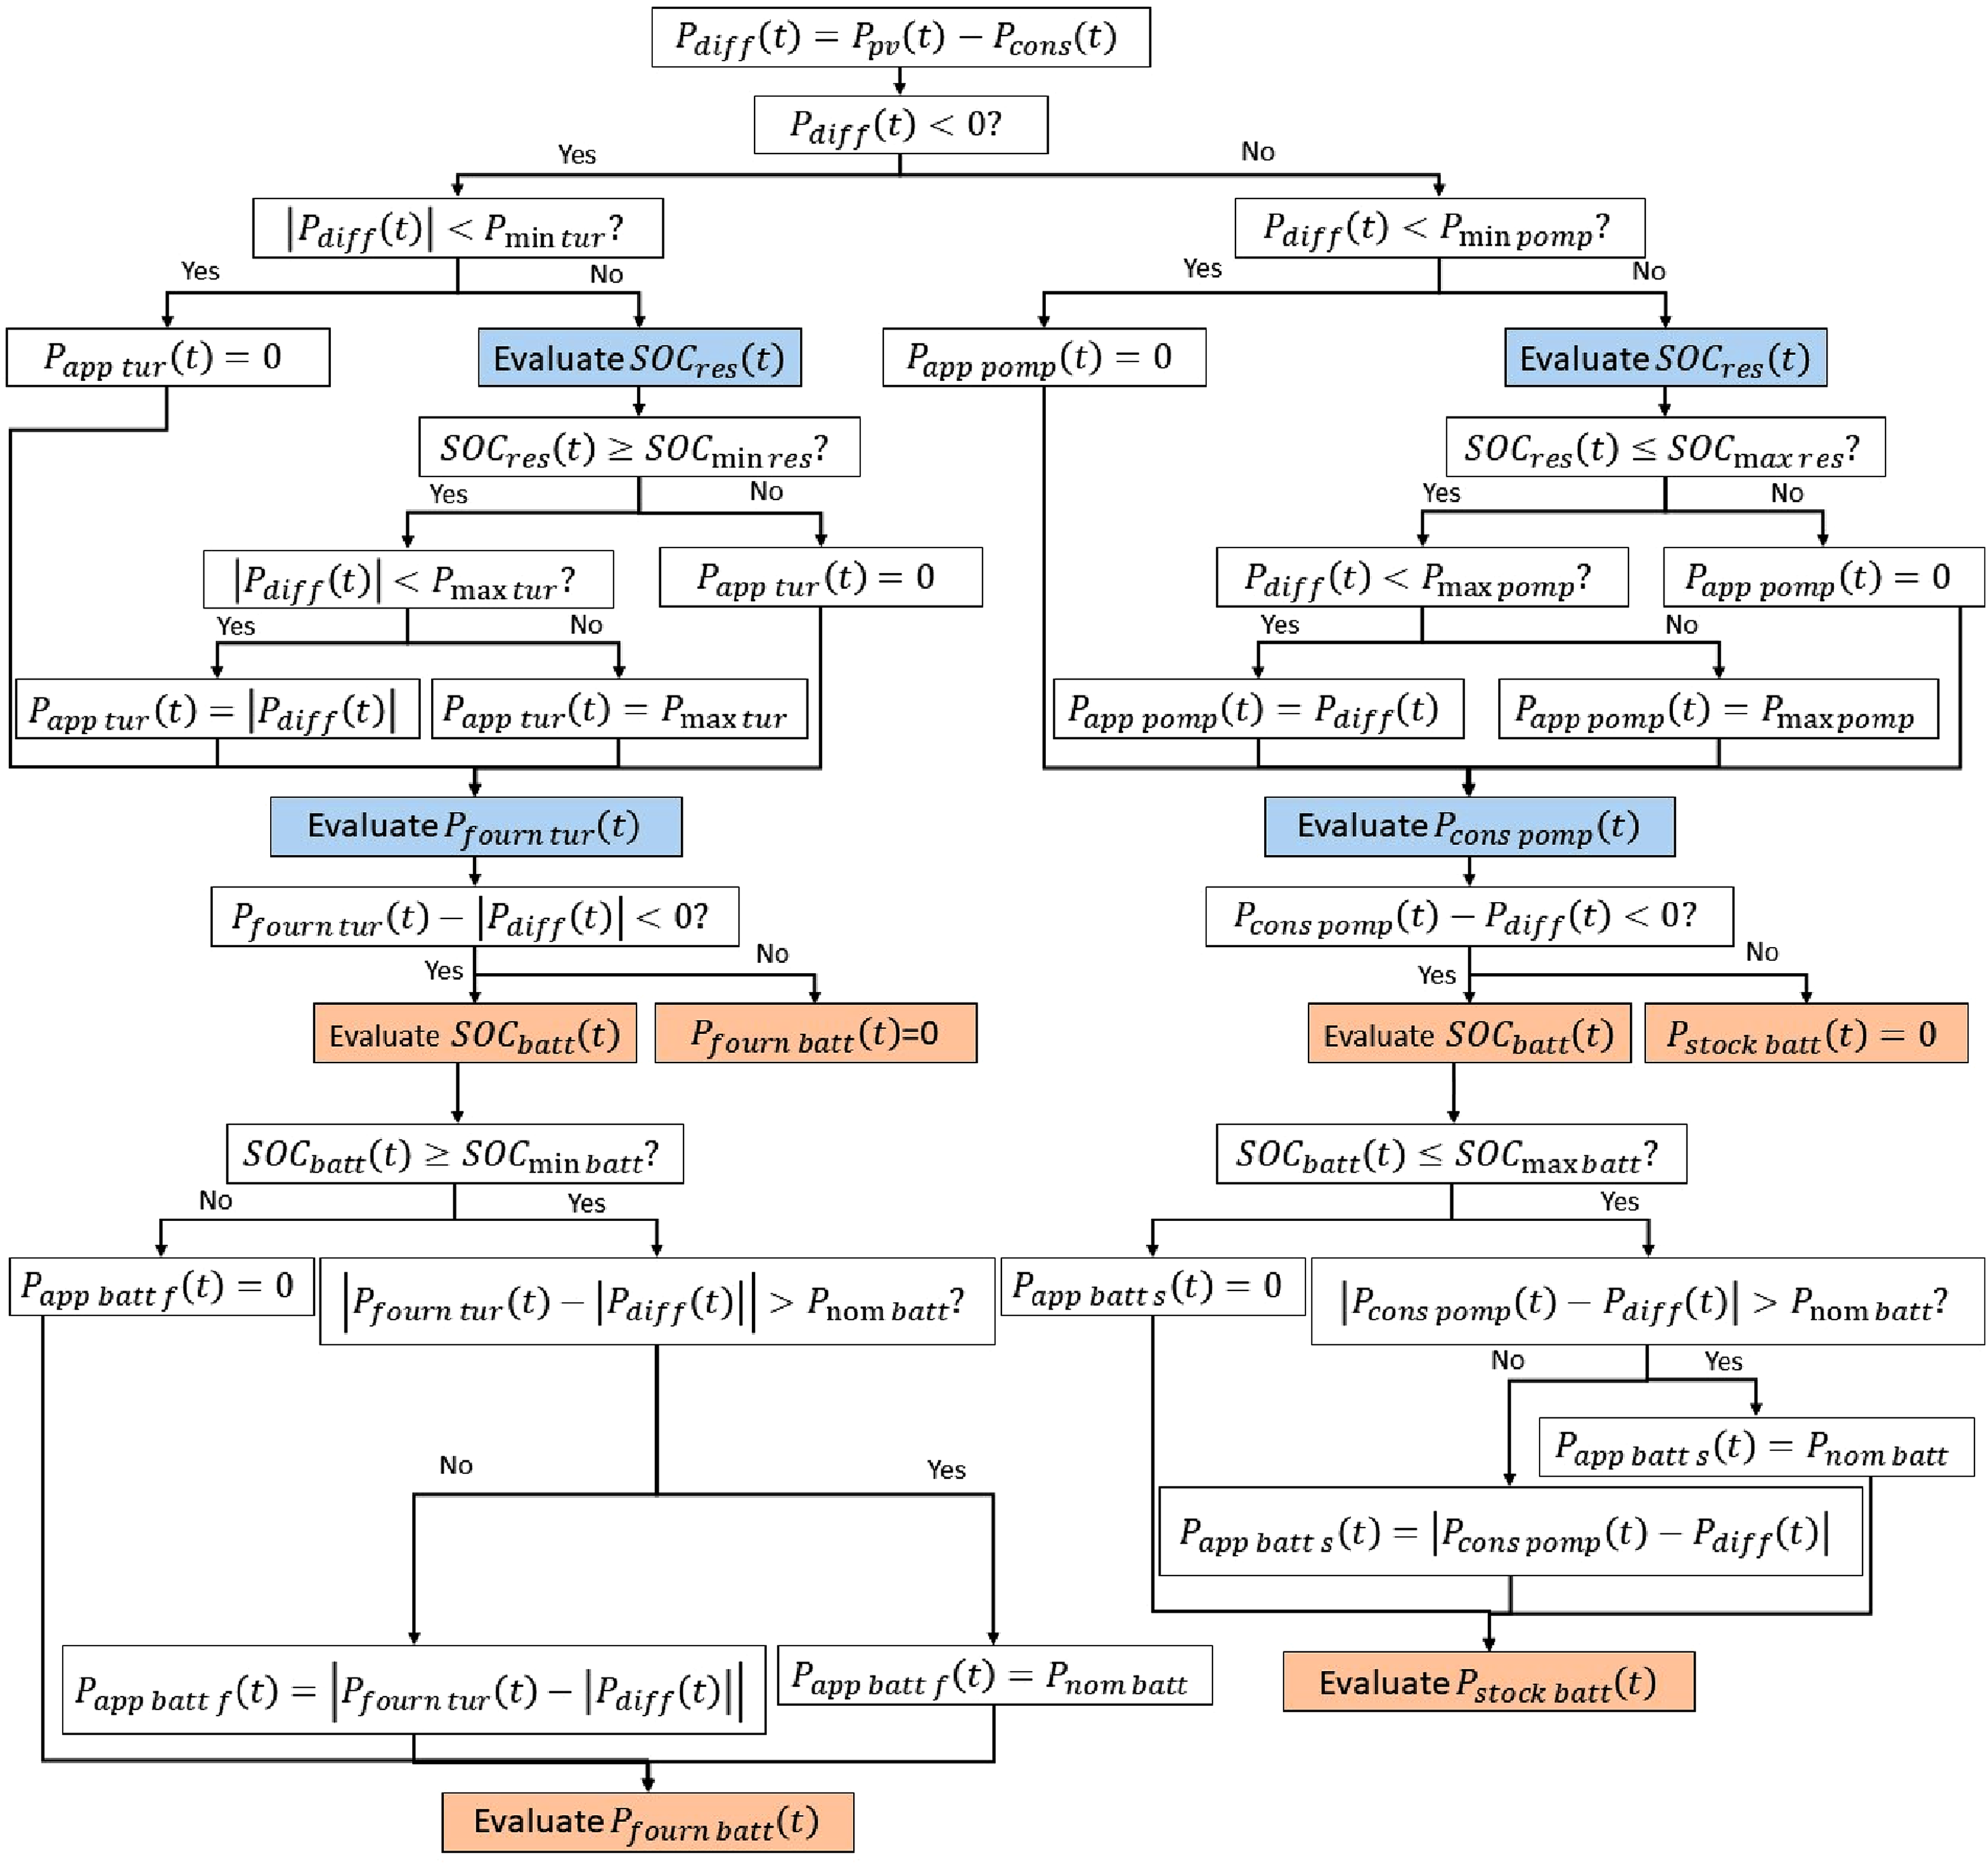
First, the hourly power difference Pdiff between the hourly power supplied by the PV generator Ppv and the hourly consumption power Pcons will be calculated. Depending on its state of charge, nominal operating range and the sign of Pdiff, the storage system is called to supply (Pdiff > 0) or store (Pdiff < 0) energy. In our study, there are two strategies:
Strategy 1: Storage and production priority to the PSH system; Strategy 2: Storage and production priority to the battery system. If Pdiff (t) < 0, the PSH system is called to provide |Pdiff (t)| by water turbining. There are two possible cases:
In case the power demand |Pdiff(t)| is greater than the minimum turbine operating power Pmintur = 0.59kW and the upper reservoir is filled with water, then water is turbined down to produce Pfourntur(t), which is less than or equal to the maximum turbine operating power Pmaxtur = 3 kW. The state of charge of the upper reservoir SOCres(t) must not reach the minimum state of charge SOCminres = 10%. In case the demand is not fully satisfied by the turbine, the battery system is called to provide |Pfourntur (t) − Pdiff (t)|. If the batteries are full, then they will be discharged to provide Pfournbatt(t), Which is less than or equal to the nominal power of the battery system Pnombatt = DODmax.Cb. The state of charge of the battery system SOCbatt (t) must not reach the minimum state of charge SOCminbatt = 20%. If Pdiff > 0, the PSH system is called to store Pdiff (t) by pumping water. There are two possible cases:
In case the power to be stored Pdiff (t) is greater than the minimum pump operating power Pminpomp = 7.5 kW and the upper reservoir is empty, then the pump will consume the power Pconspomp (t), which is less than or equal to the maximum pump operating power Pmaxpomp = 12.19kW, in order to pump water to the upper reservoir. The state of charge of the upper reservoir SOCres (t) must not exceed the maximum state of charge SOCmaxres = 90%. In case the PSH system is unable to store all the available energy Pdiff (t), the battery system will be called upon to store |Pconspomp (t) − Pdiff (t)|. If the batteries are empty, then they will be charging to store power Pstockbatt (t), which is less than or equal to the nominal power of the battery system Pnamebatt. The state of charge of the battery system SOCbatt (t) must not exceed the maximum state of charge SOCmaxbatt = 90%.
In this paper, we propose to discuss only strategy 1. Here we assign the priority of energy storage and production to the PSH system. The principle of this EMS is summarized in the diagram of Figure 3.
Energy management strategy 1: priority to the PSH system.
The system cost
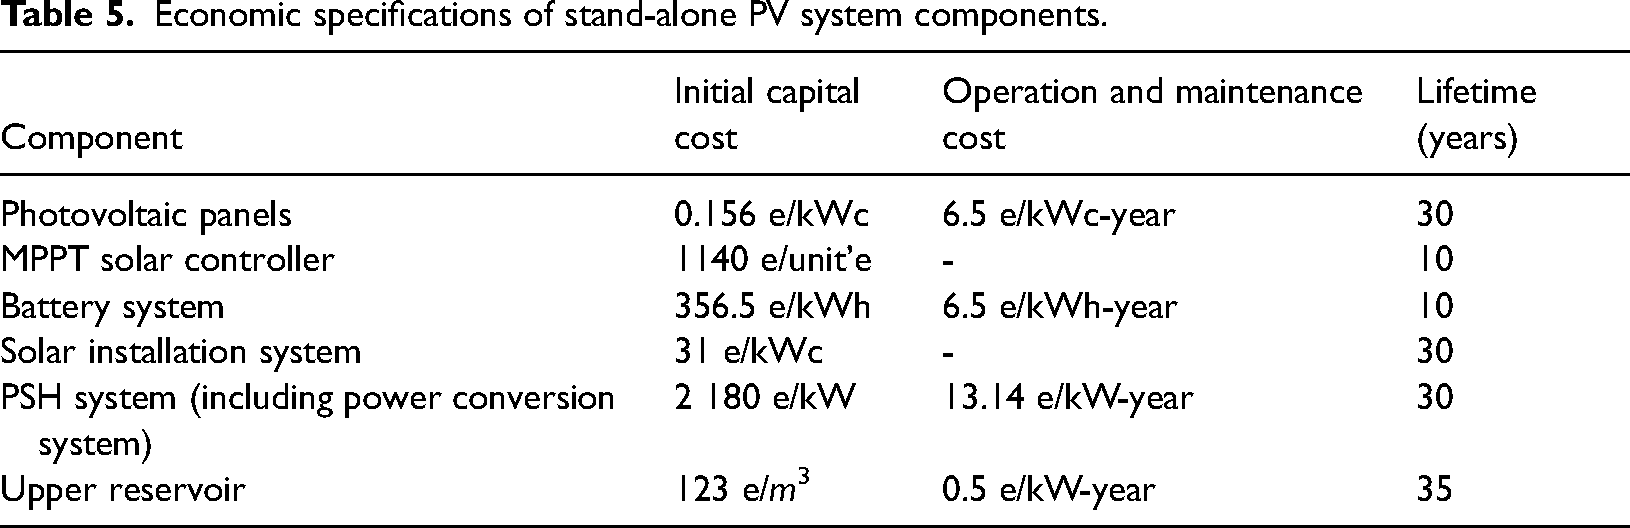
In this work, the project lifetime is fixed at Rproj = 25 years. Table 5 presents the economic specifications for each component of the studied standalone hybrid system (Solar; 39 HydroWires; 40 OpenEI.org. 41 )
Economic specifications of stand-alone PV system components.
Optimization algorithm: Ga
The proposed methodology for the optimal sizing of the PV/PSH/battery stand-alone system of Figure 1, consists in using the genetic algorithm and the combination of tools (LPSP, LCE) to evaluate the energetic and economic aspects of the system. This methodology is given by the flowchart in Figure 4.
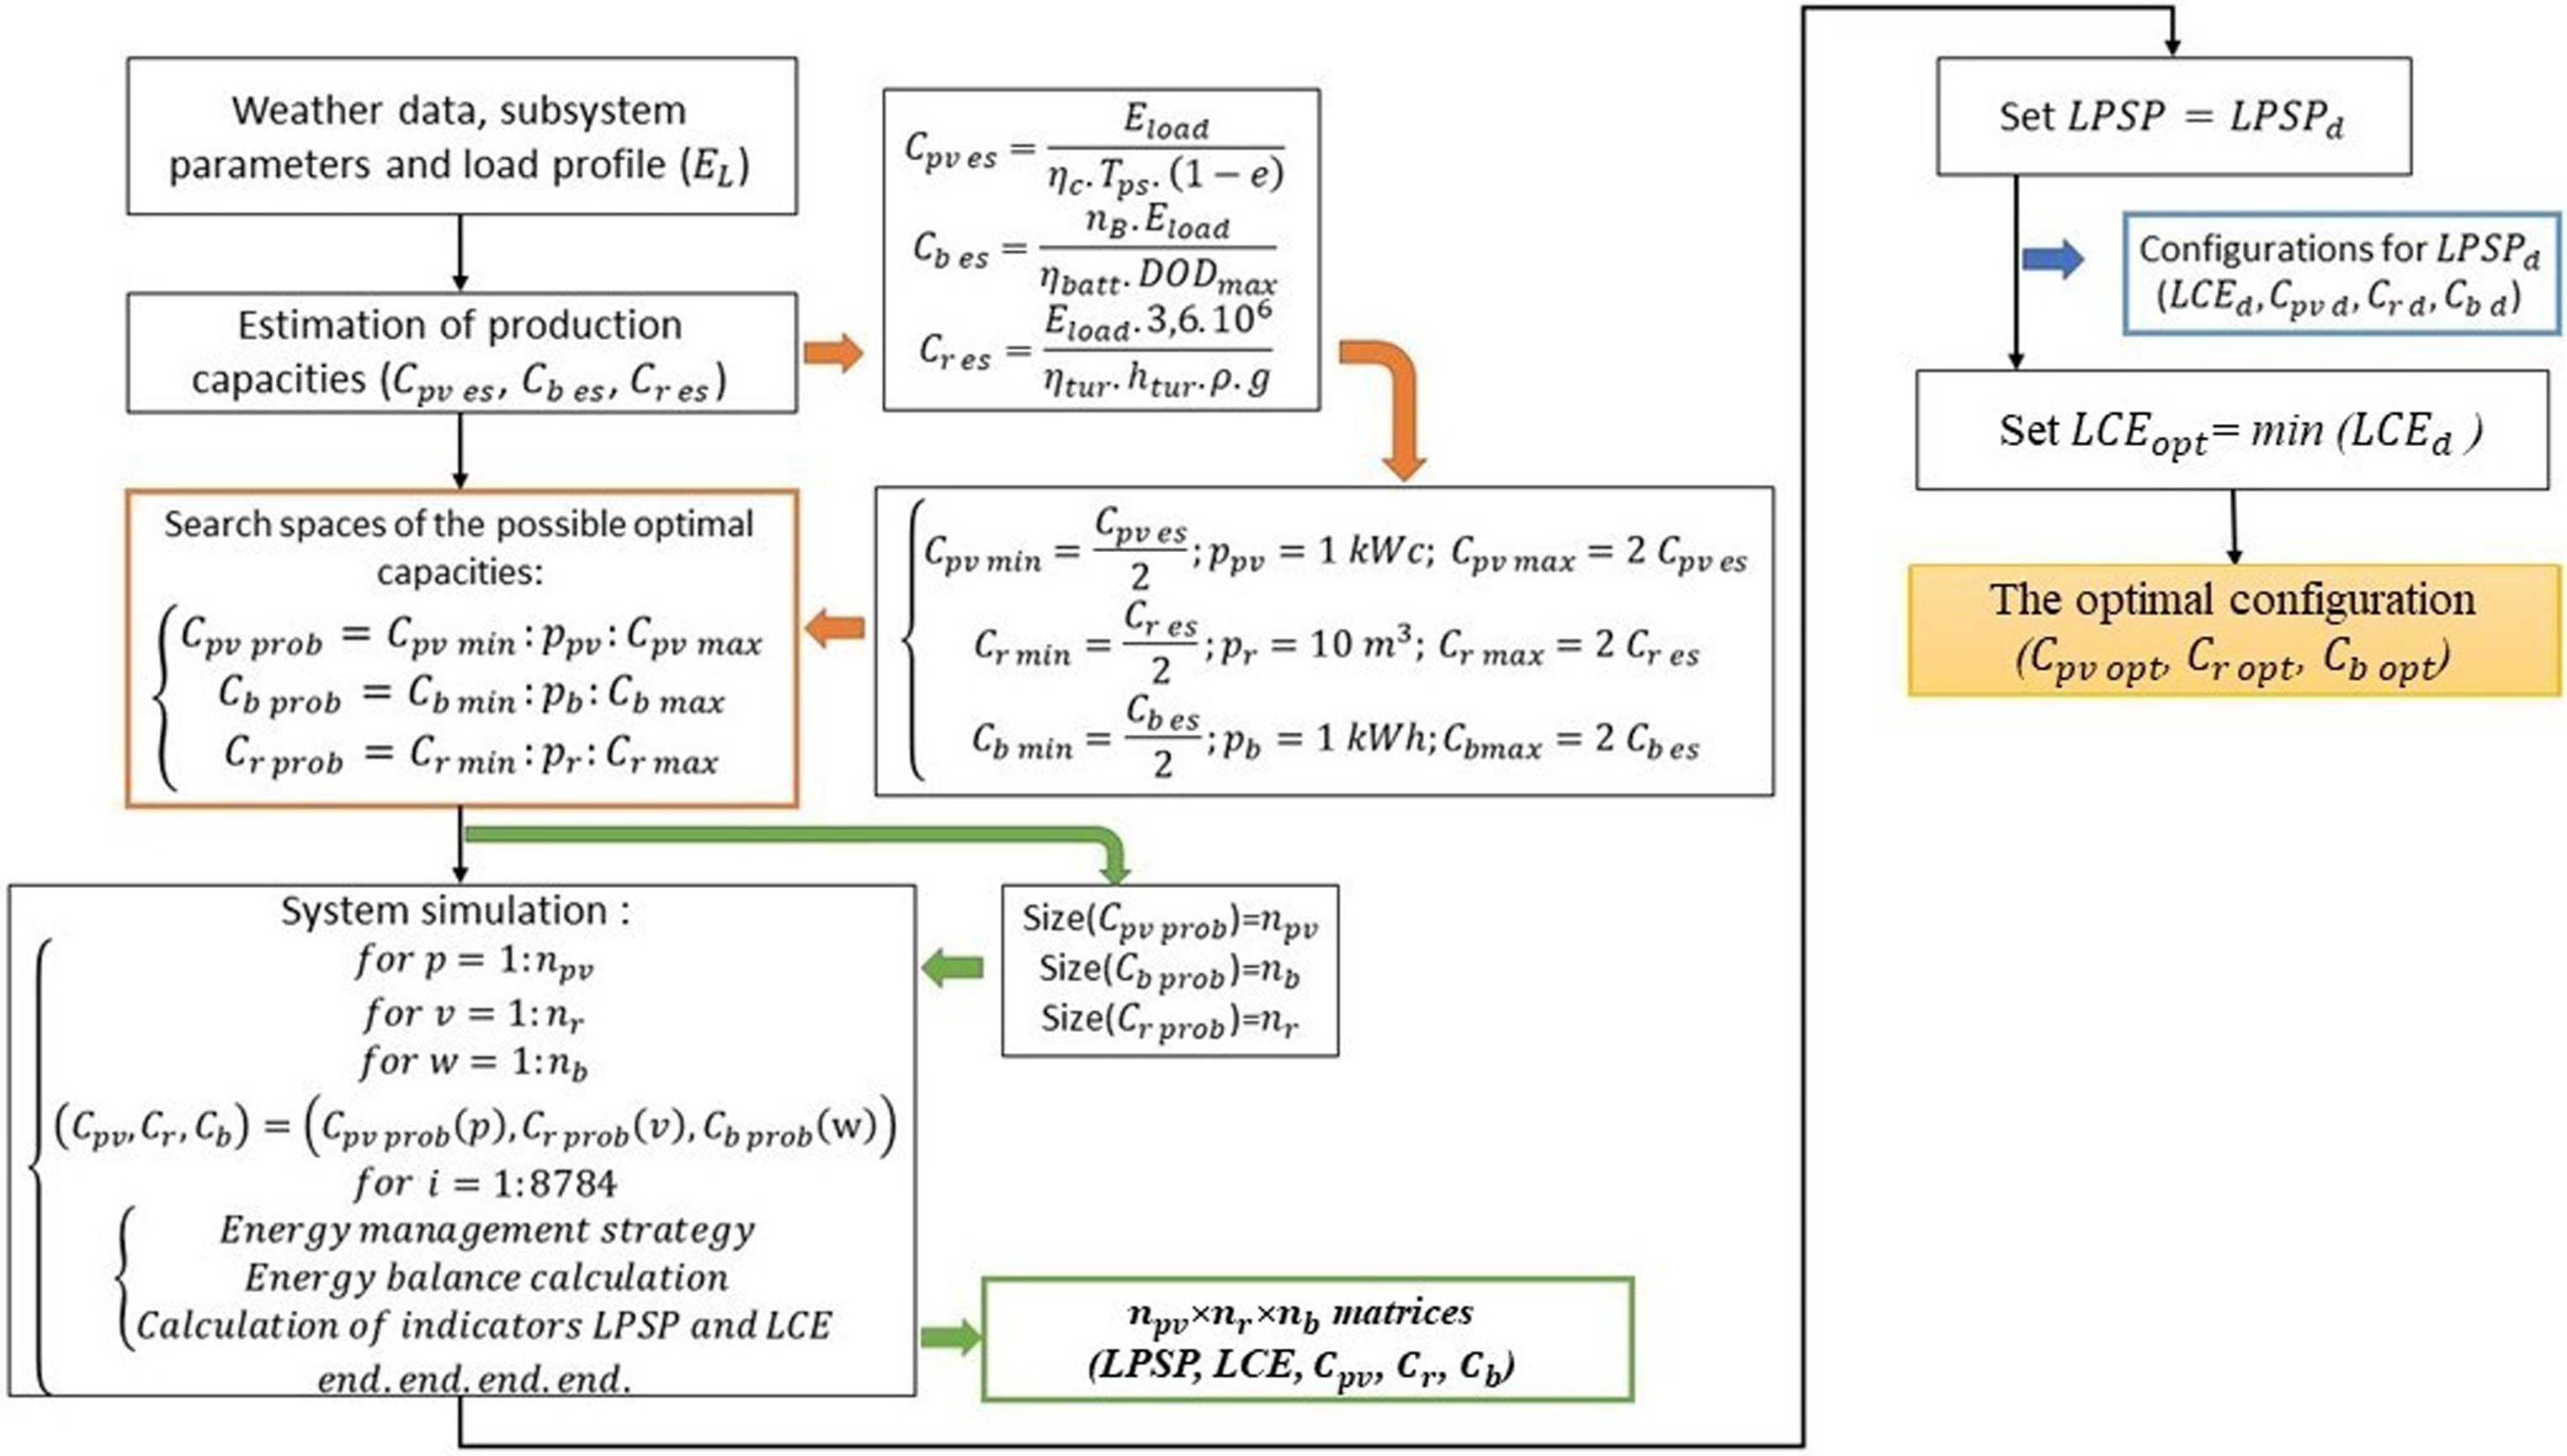
Flowchart of the optimization of the PV/PSH/battery autonomous system sizing using the genetic algorithm.
We have previously estimated in a preliminary step the capacities of the PV generator CPV es, of the batteries Cb es, and of the upper water tank Cr es. From those estimated capacities, we have built, for each energy source, a search space of optimal capacities, namely Cpv prob, Cb prob and Cr prob respectively. Each search space is delimited by two max and min values given respectively by twice the capacity of the considered energy source and half capacity of the considered energy source. To cover the search spaces, we have set a variation step for each search space. This step is called the selection operation.
From these 3 search spaces, we have determined several possible combinations called possible configurations of the system. A possible configuration is marked by 3 parameters (the capacity of the PV generator, the capacity of the batteries, and the capacity of the upper water tank). For each configuration, the EMS is simulated over a year (equivalent to 8784 h), the hourly energy balance of the system is calculated and ranked and the performance indicators (LPSP and LCE) are calculated and stored in matrices. At this stage, we obtain two matrices having the same size and containing respectively the possible values of the LPSP and LCE indicators according to the possible configurations. This step is called crossover and mutation operations.
If we set the LPSP to a desired value LPSPd (for example an LPSP = 5%, which corresponds to an annual energy satisfaction of 95%), several configurations will meet this desired criteria. This step is called the generation of a new and more suitable population. Among the configurations meeting the desired reliability LPSPd, only one configuration (Cpv, Cr, Cb) allows to have a minimum cost LCEopt = min (LCEd). This configuration is thus chosen as the optimal configuration of the system.
Results and discussion
The hourly PV power profile Ppv ref over the year 2016 is provided by the PVsyst software for a reference capacity of 25 kWp (Figure 5). Thus, for each capacity CPV es in the first search sub-space, the PV output profile will be given by:

Annual profile of photovoltaic production.
The stand-alone hybrid PV/PSH/battery system is simulated in MATLAB for the EMS prioritizing storage and generation for the PSH system. In the following, the variations of the system parameters with LPSP are represented up to LPSP = 15% with a variation step of 1%.
The variation of the LCE indicator with LPSP is shown in Figure 6. According to this figure, the minimum of energy unsatisfaction (LPSP) that can be reached is 4.32%. It can also be observed that the LCE decreases exponentially with increasing LPSP. However, according to Figure 6, the LCE has increased for LPSP of 14% and 15%. This result shows that there is only one minimum cost of the system, which corresponds to the value of LPSP = 13%. Beyond this value, the LCE increases very slightly with increasing of LPSP.
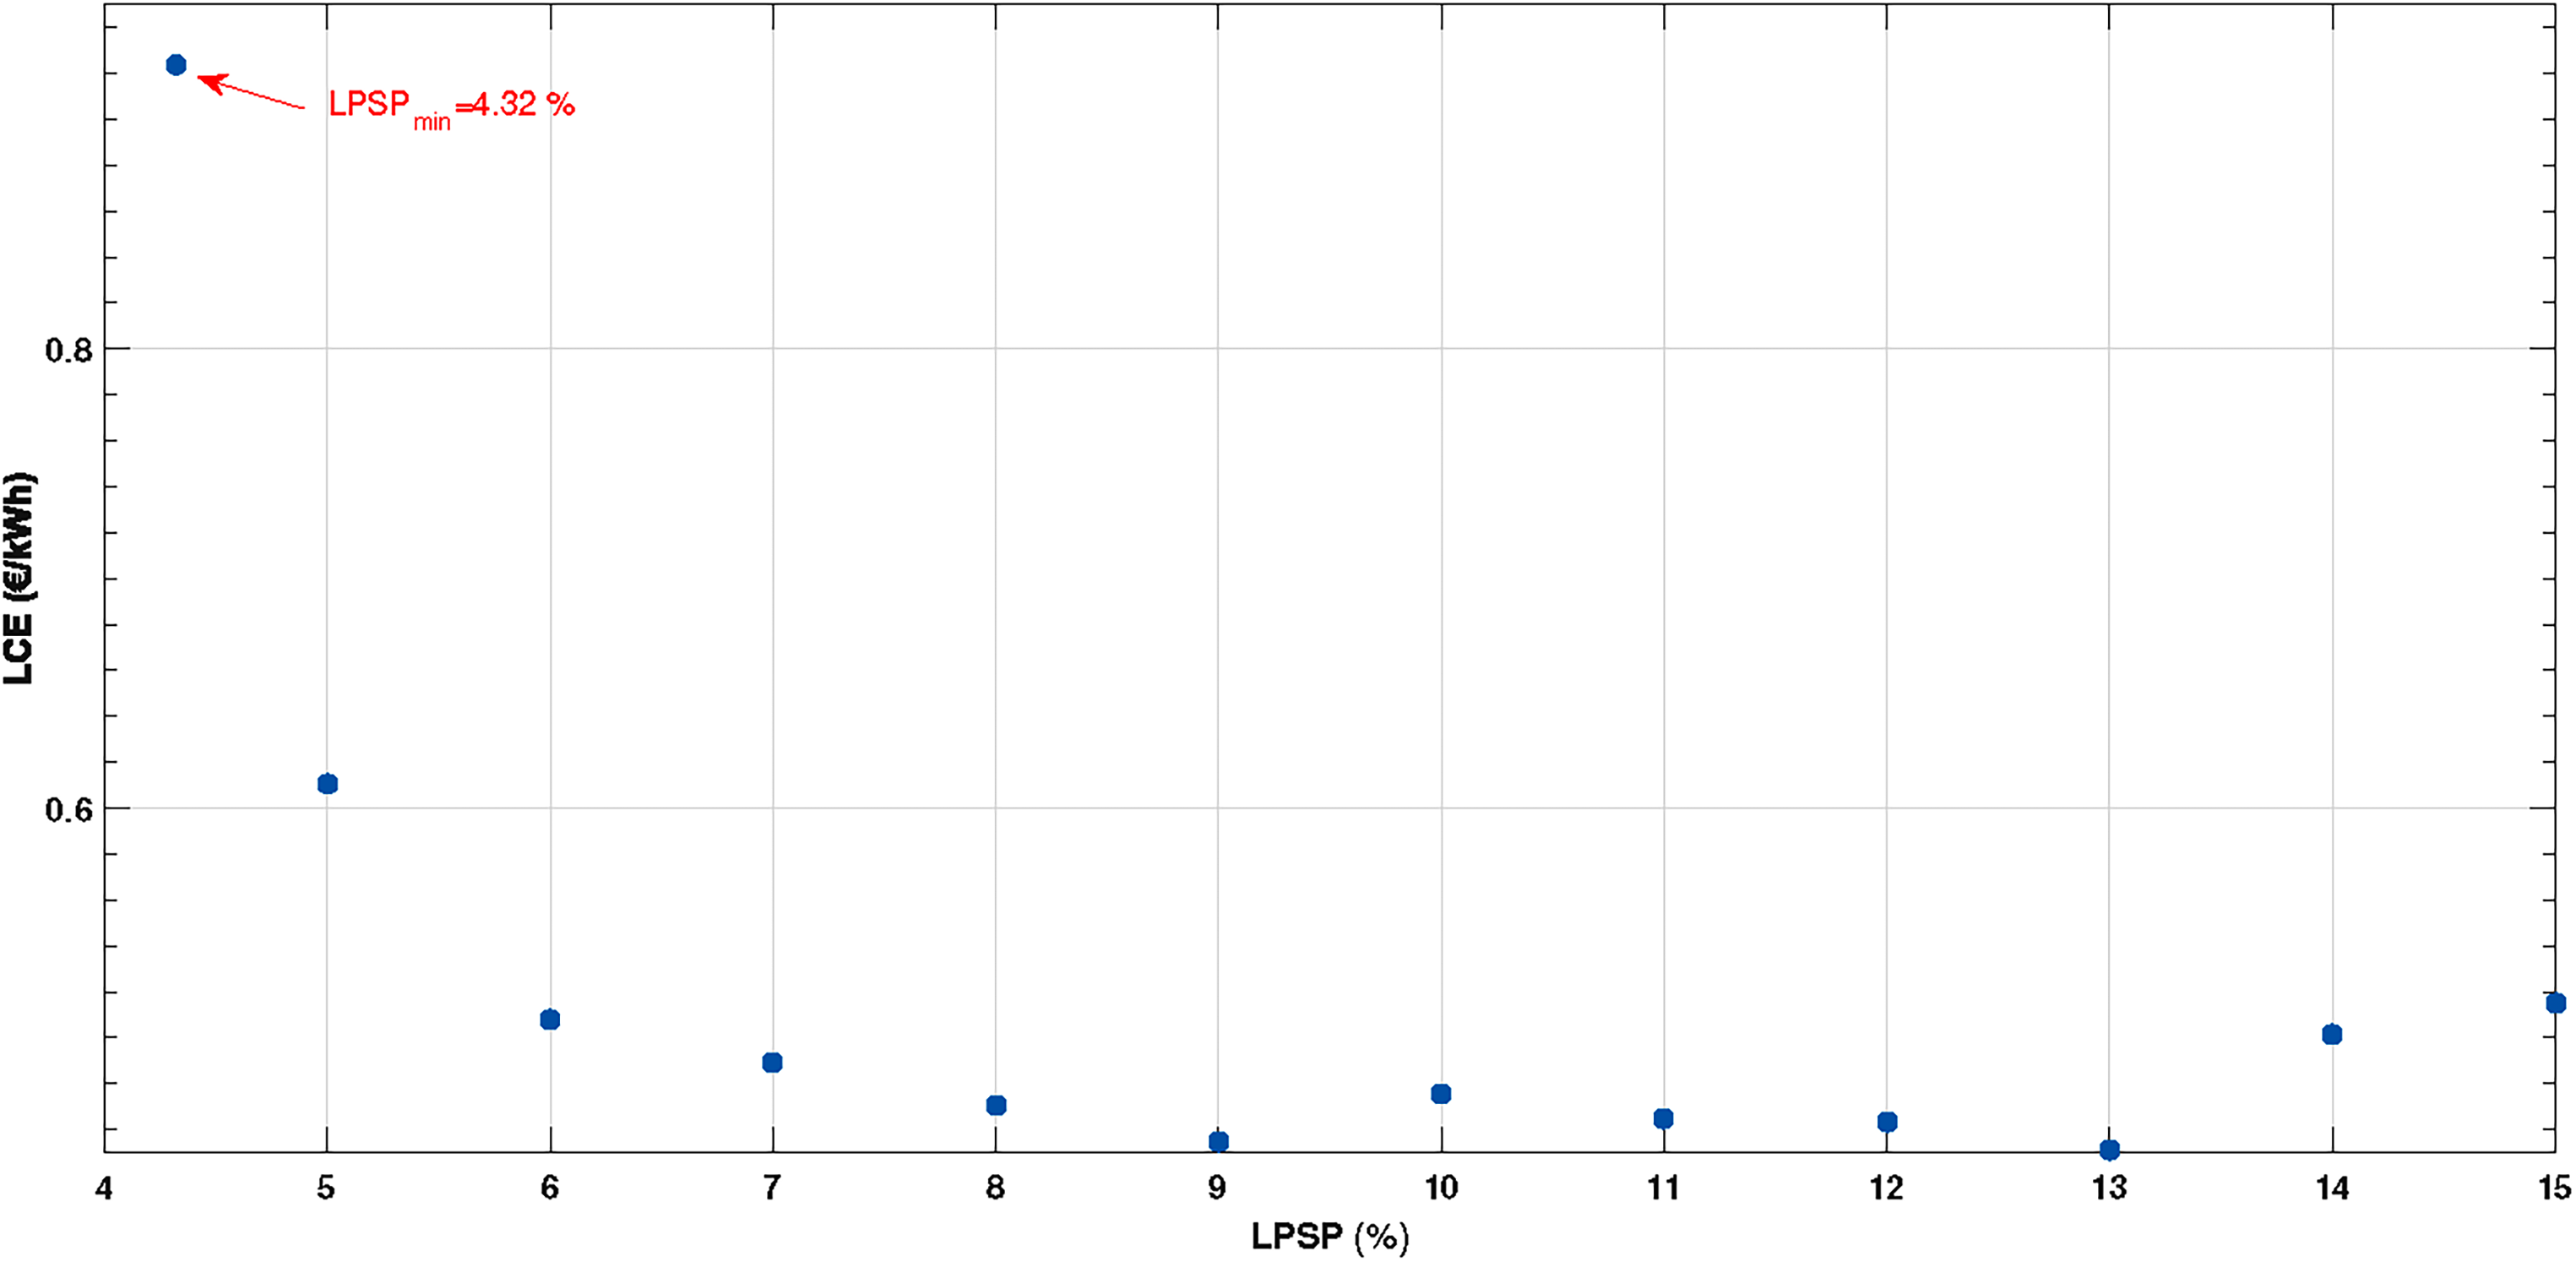
Variations of the LCE (e/kWh) with the LPSP (%).
The distribution of the optimal configurations (PV array capacity, battery capacity, upper water reservoir capacity) with the LPSP, is shown in Figure 7. It can be seen from this figure that the optimal capacities of the PV generator, the batteries and the upper water reservoir decrease exponentially with increasing LPSP. The variation of Cb opt is rather slow compared to the variation of Cres opt.
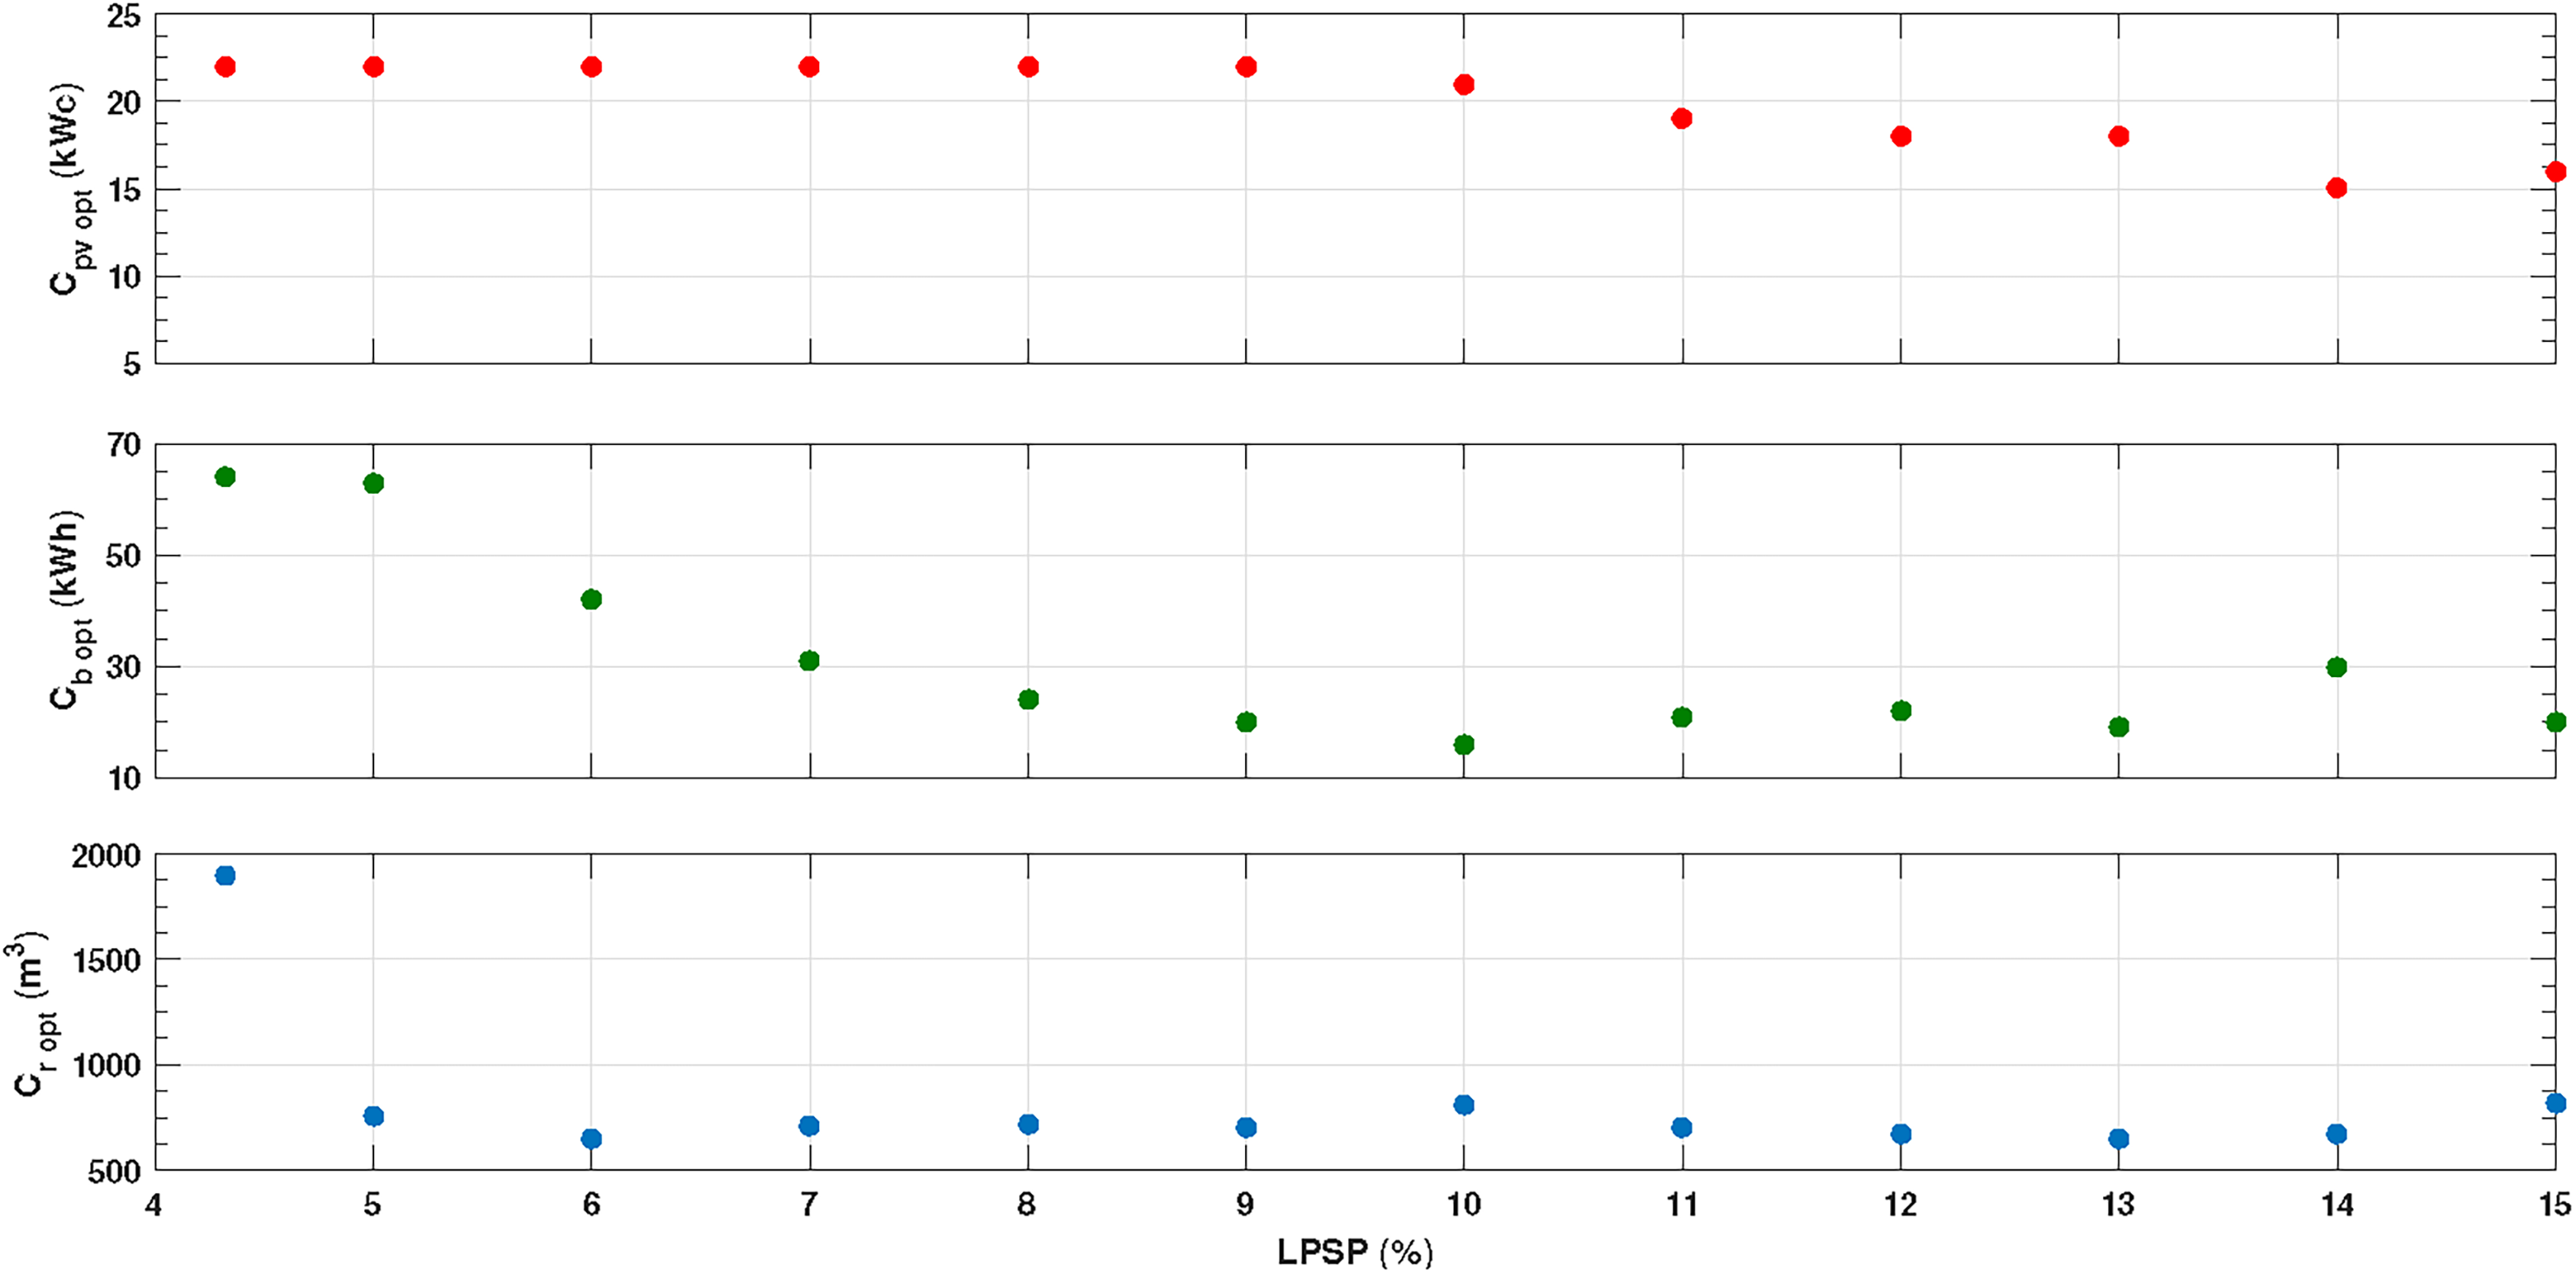
Variation of optimal configurations (Cpv opt, Cb opt, Cres opt) with the LPSP (%).
In the remaining part of this paper, we will study the energetic behaviour of the subsystems (PV generator, batteries and PSH system) for the optimal solution corresponding to an energetic satisfaction of 95% (i.e. LPSP = 5%).
By setting the desired energy reliability indicator LPSP = 5%, we can obtain several possible configurations, as shown in Figure 8. The optimal solution corresponds to the configuration offering the lowest cost According to Figure.8, the optimal solution is as: Cpv opt = 22 kWp, Cb opt = 63 kWh, Cres opt = 760 m3, LCE = 0.61 e/kWh.
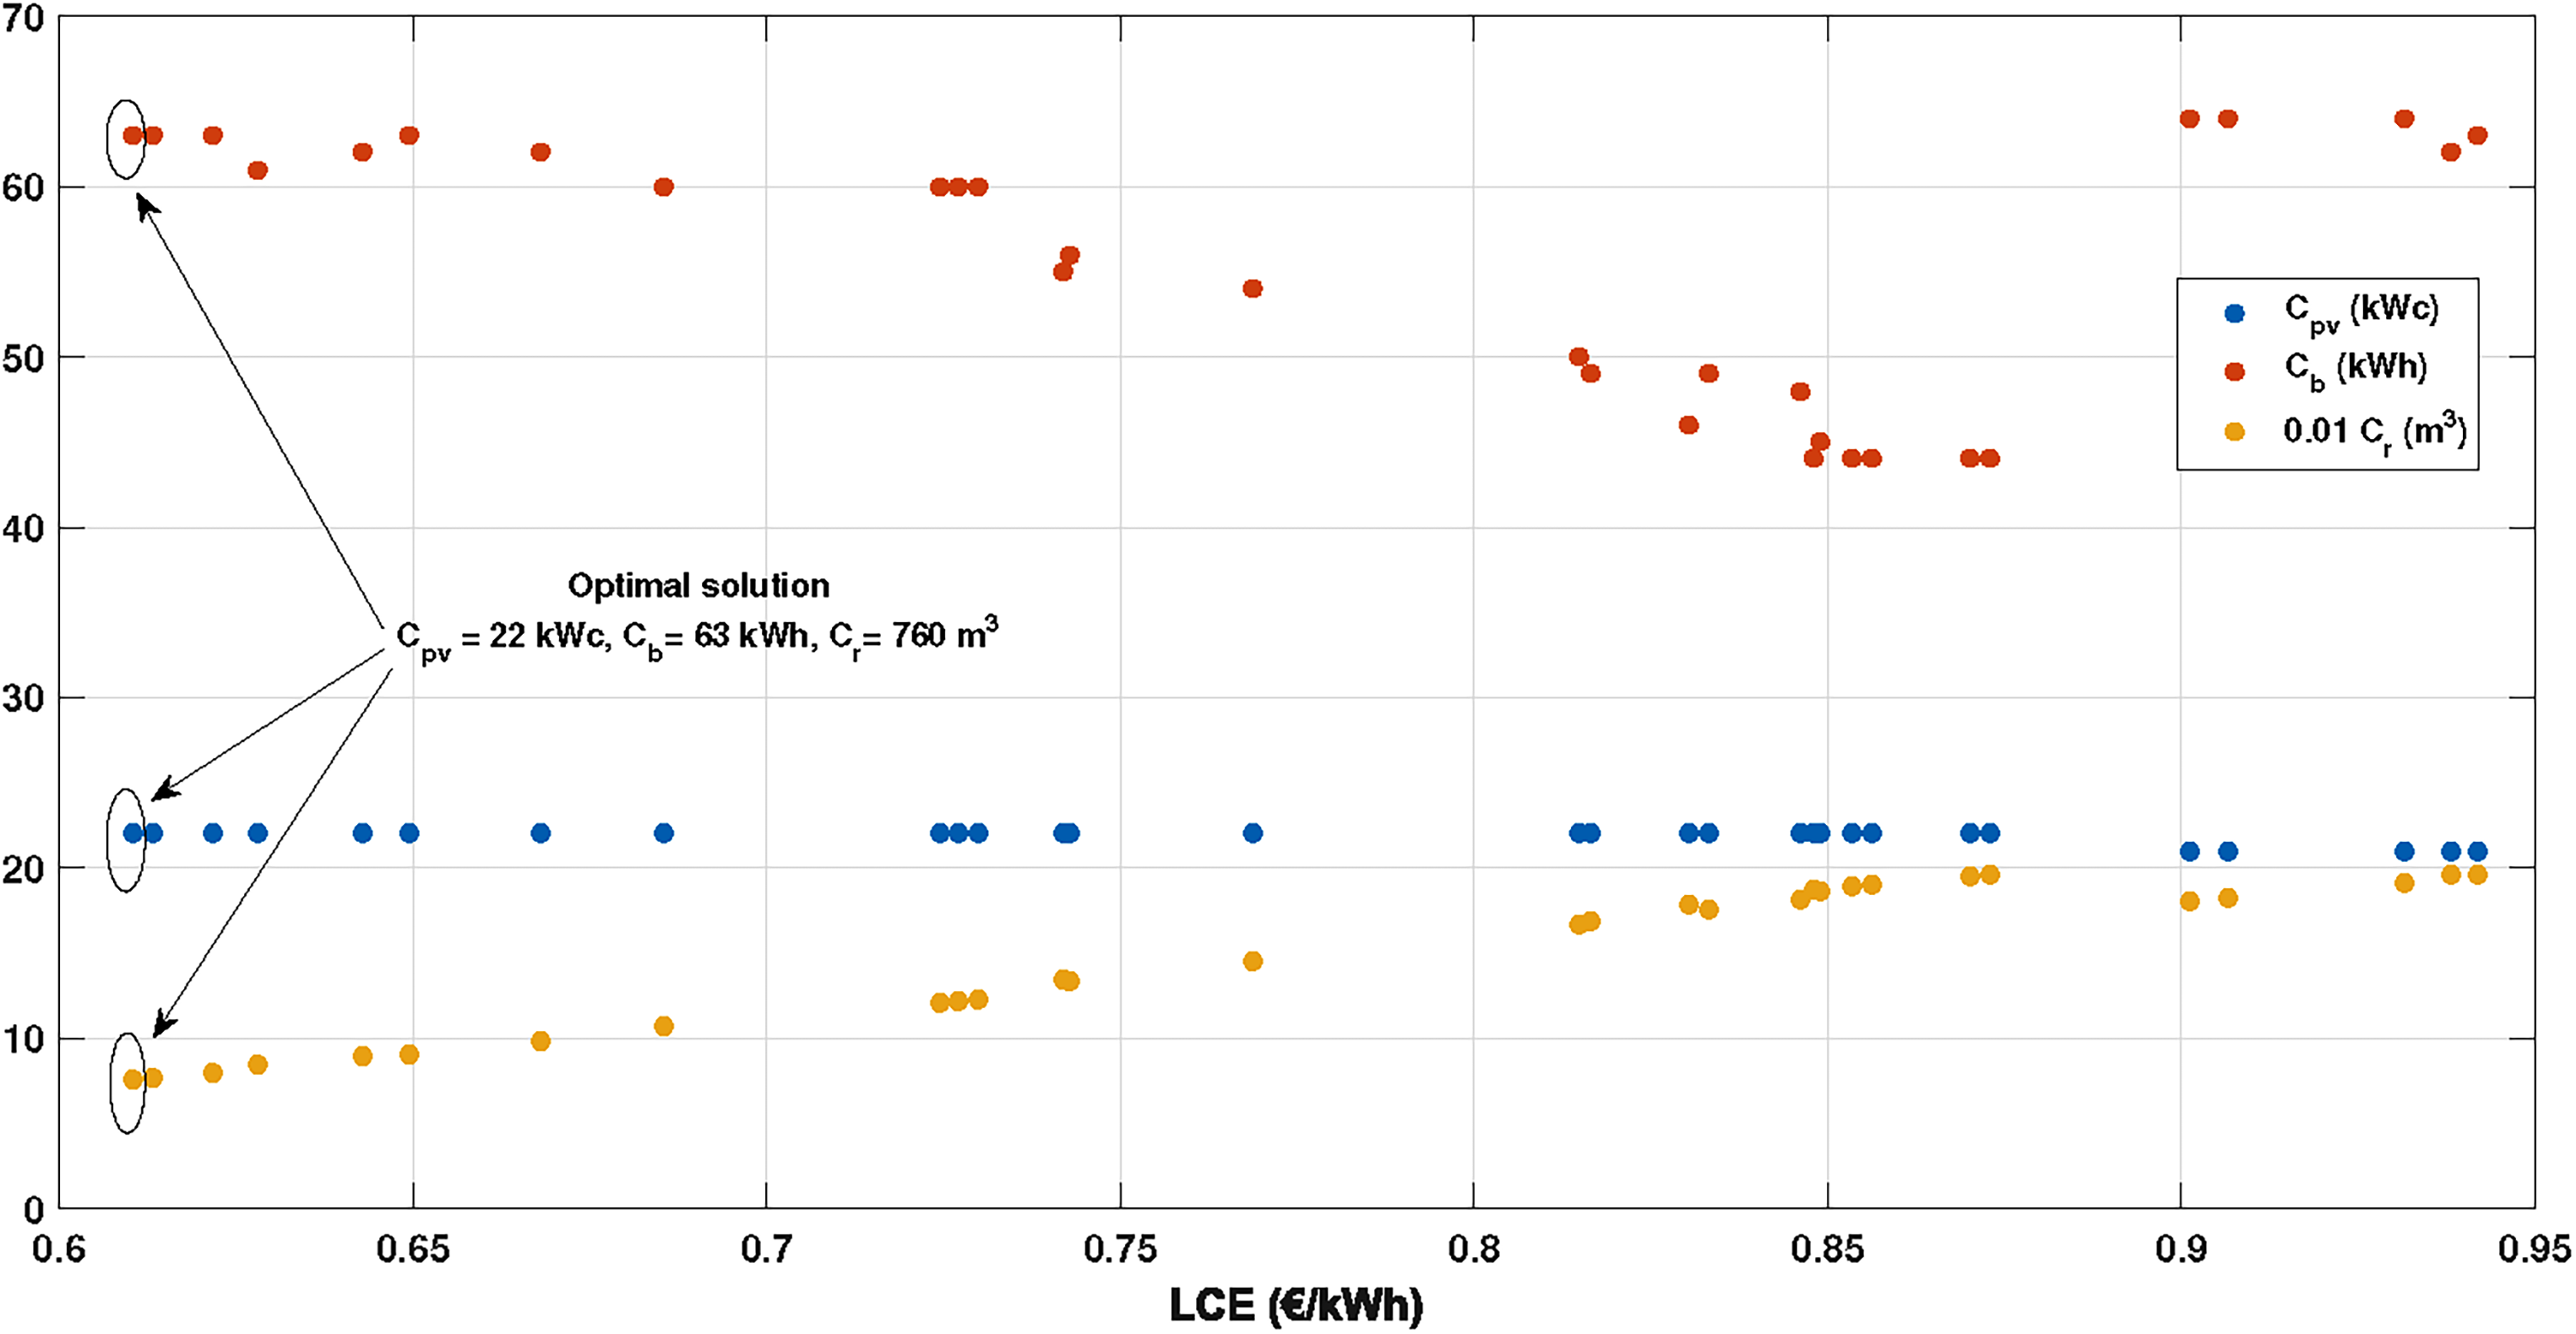
The possible configurations for LPSP = 5%.
Figures 9-10 represent the hourly distribution (kWh) in 2016 and the annual distribution (%) of photovoltaic generation between load and storage systems. The aim of Figure 9 is to represent the distribution of the total photovoltaic production between the demand, the batteries and the pumped storage over the year and to show the surplus of unexploited PV power.
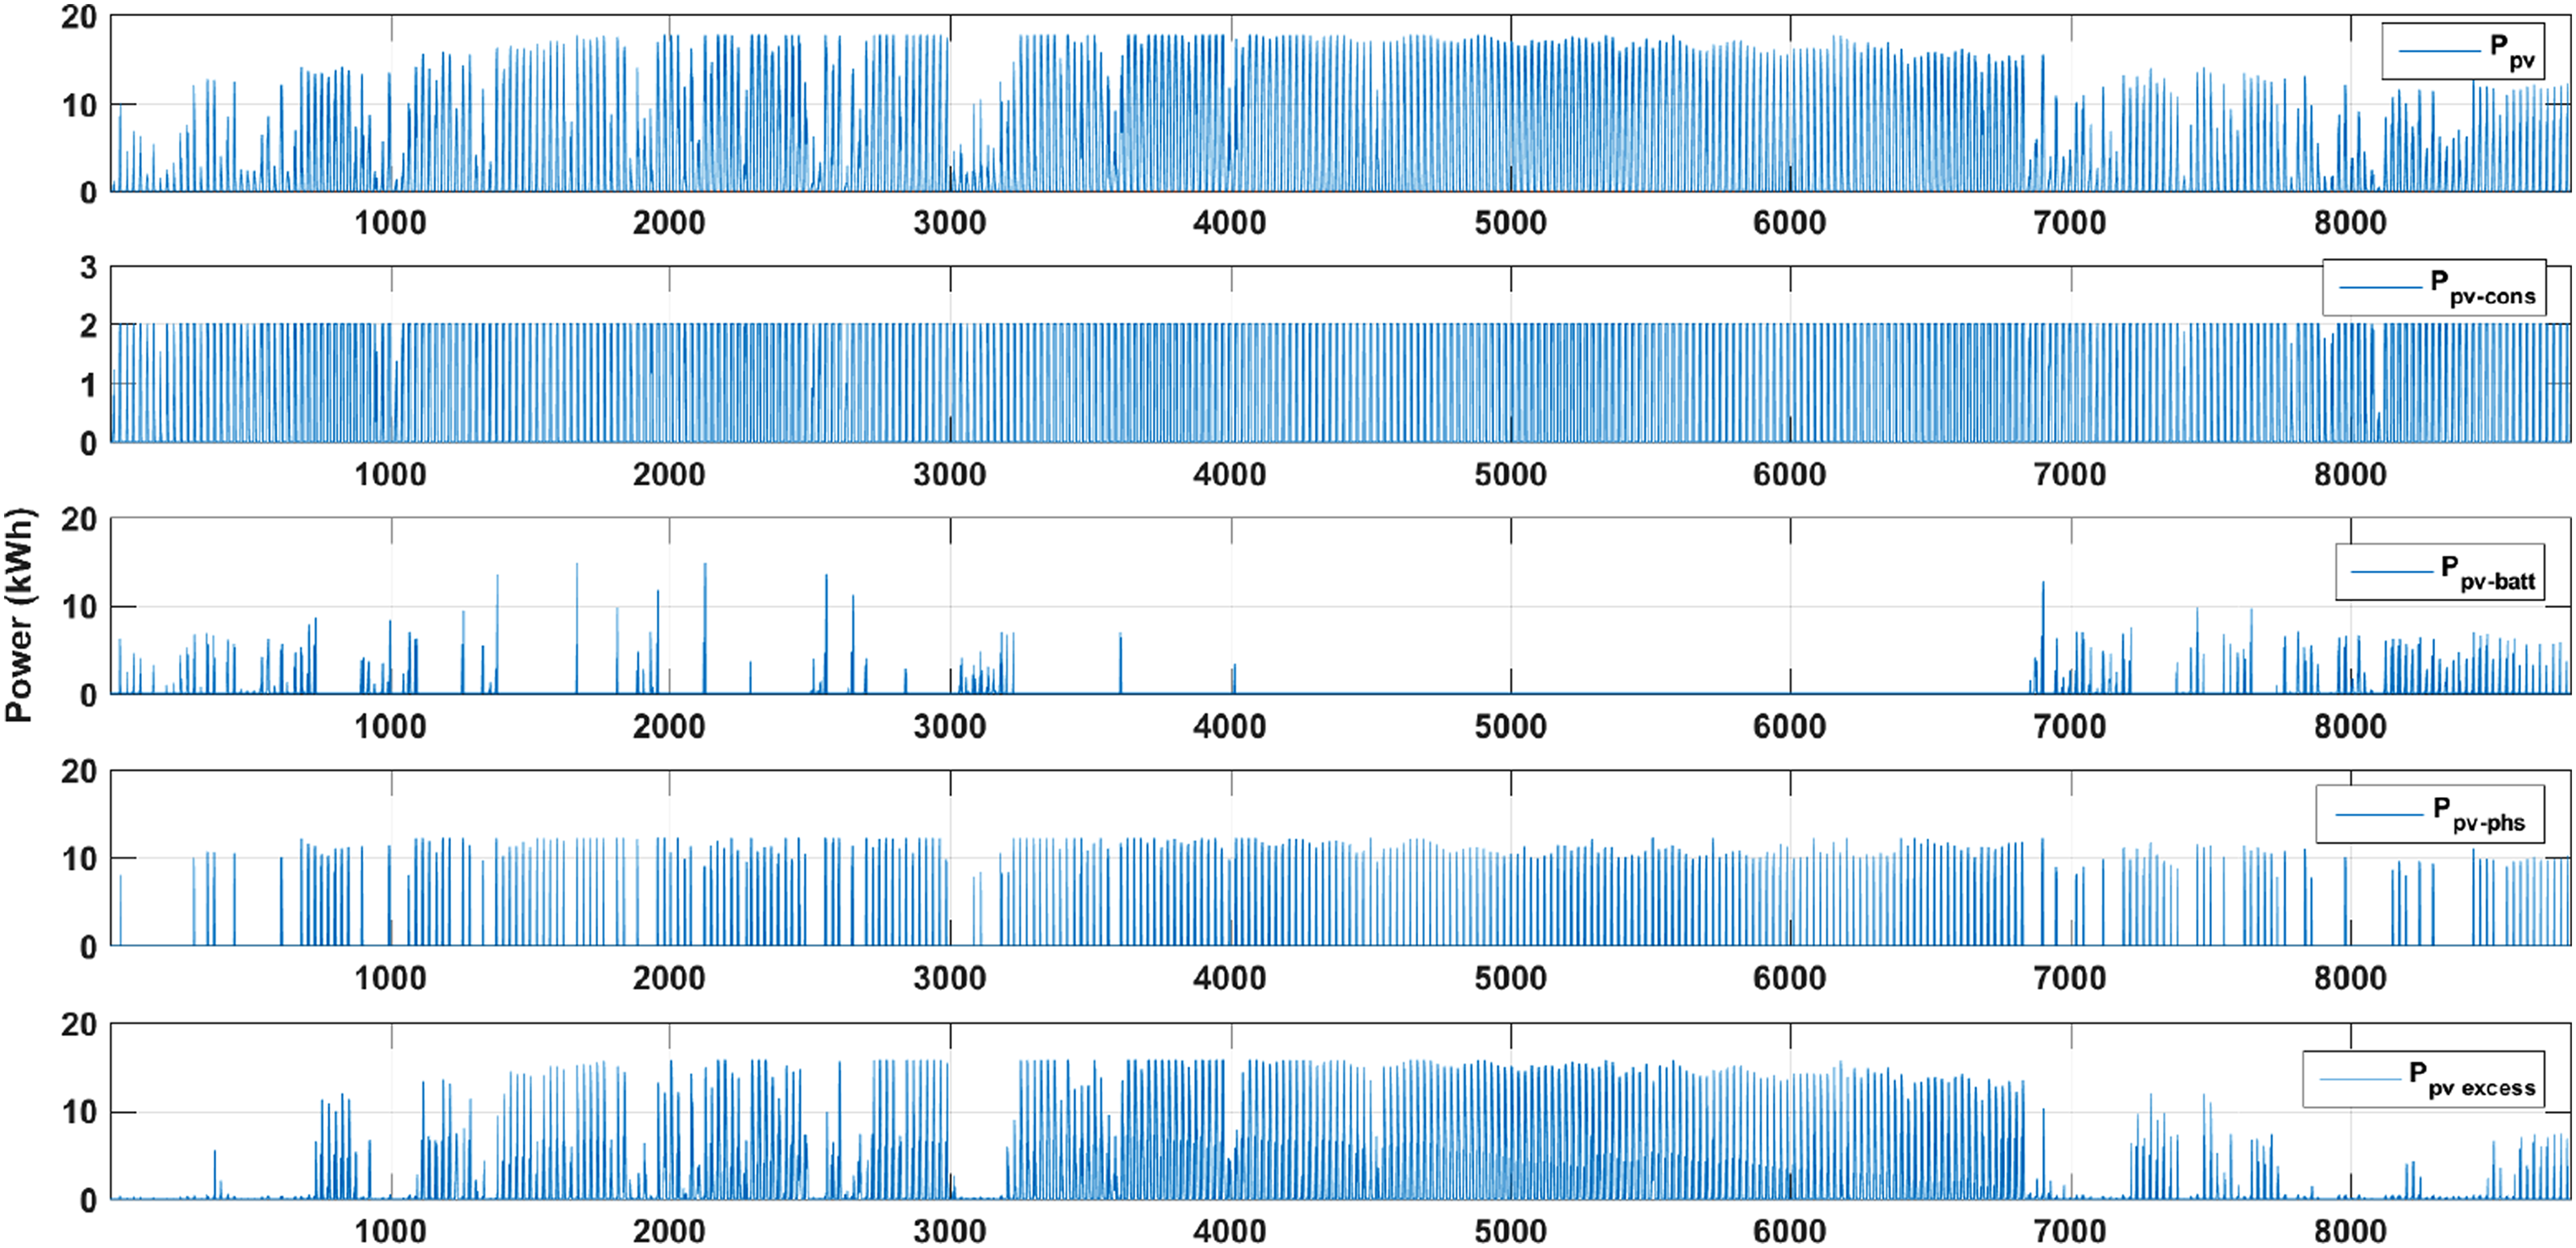
Annual profiles of the distribution of photovoltaic production (kWh).
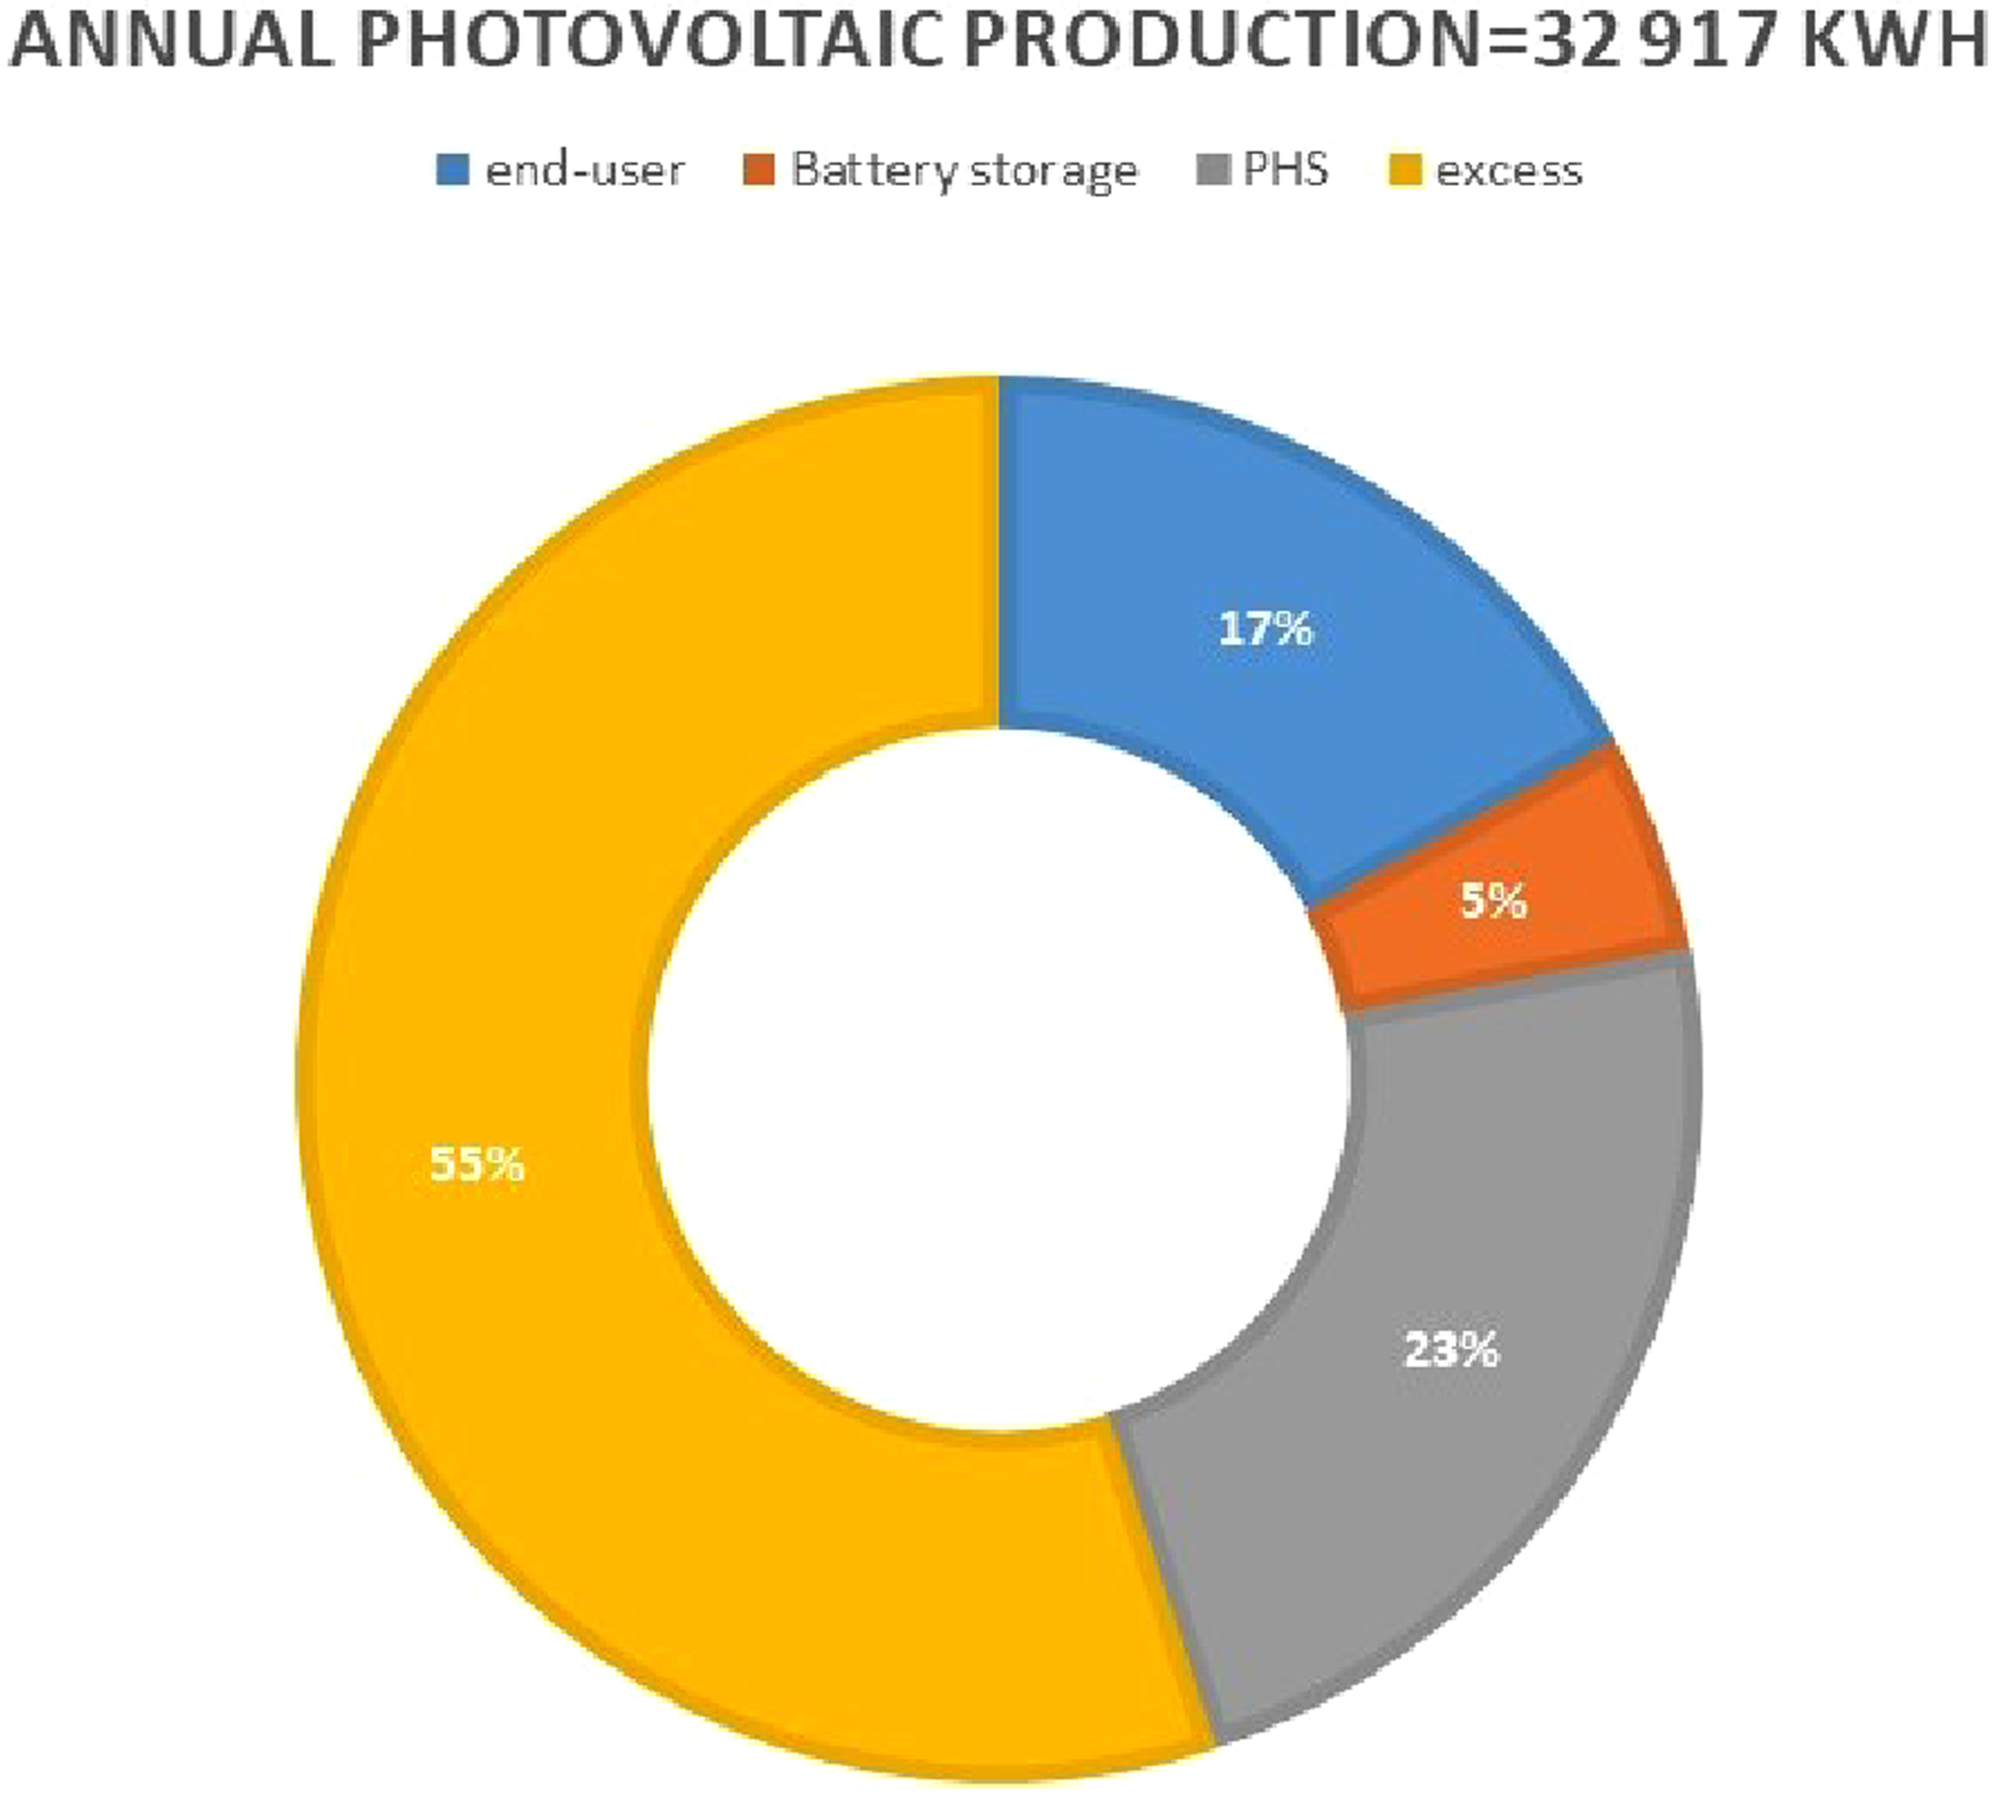
Distribution (%) of the total annual photovoltaic production.
It can be seen from the two figures that a large part of the total annual power produced by the PV generator is unused (about 55%). This is due to the following facts:
The required power by the load during the day (2 kWh) is quite lower than the maximal PV power production (17.7 kWh); maximum PV output is greater than the maximal operating power of the PSH (12.19 kW); upper reservoir is frequently full, because the power demanded by the load is low compared to the power stored by PSH; Batteries are not used during the summer because they are full and the turbine has the priority to provide the load with energy in the evening.
In addition, battery storage is rarely used compared to PSH (5% vs. 23%).
Figures 11-12 show the hourly (kWh) and annual (%) contribution of the different energy sources to satisfy 95% of the consumption demand.
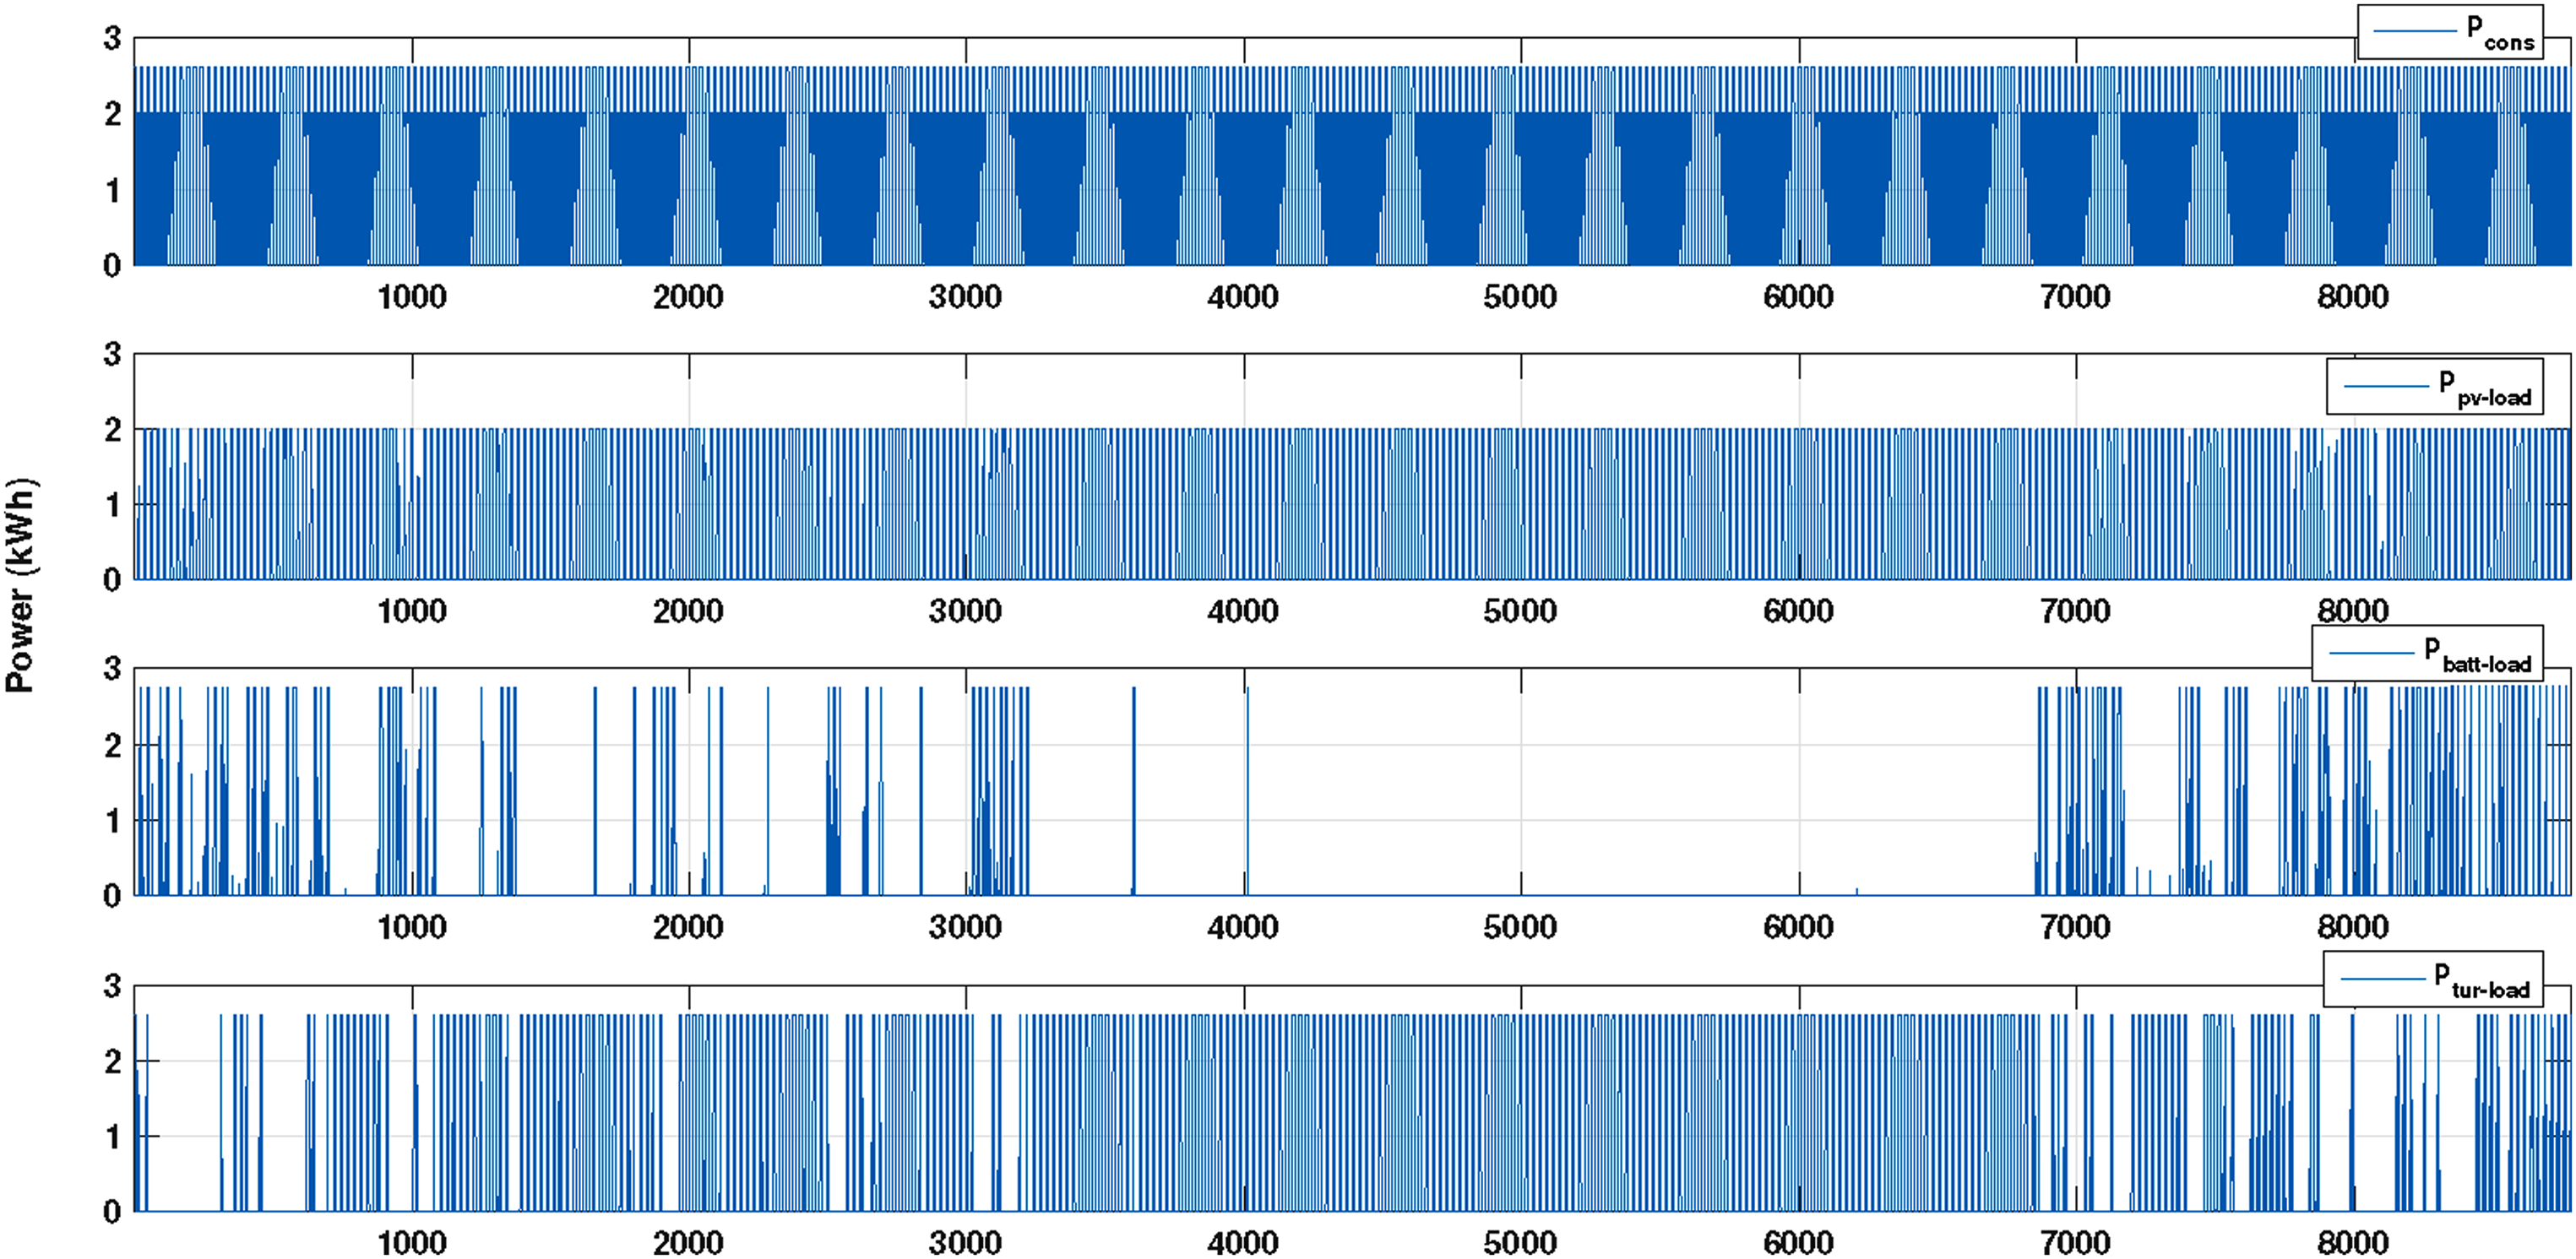
Annual profiles of subsystems power contribution (kWh).
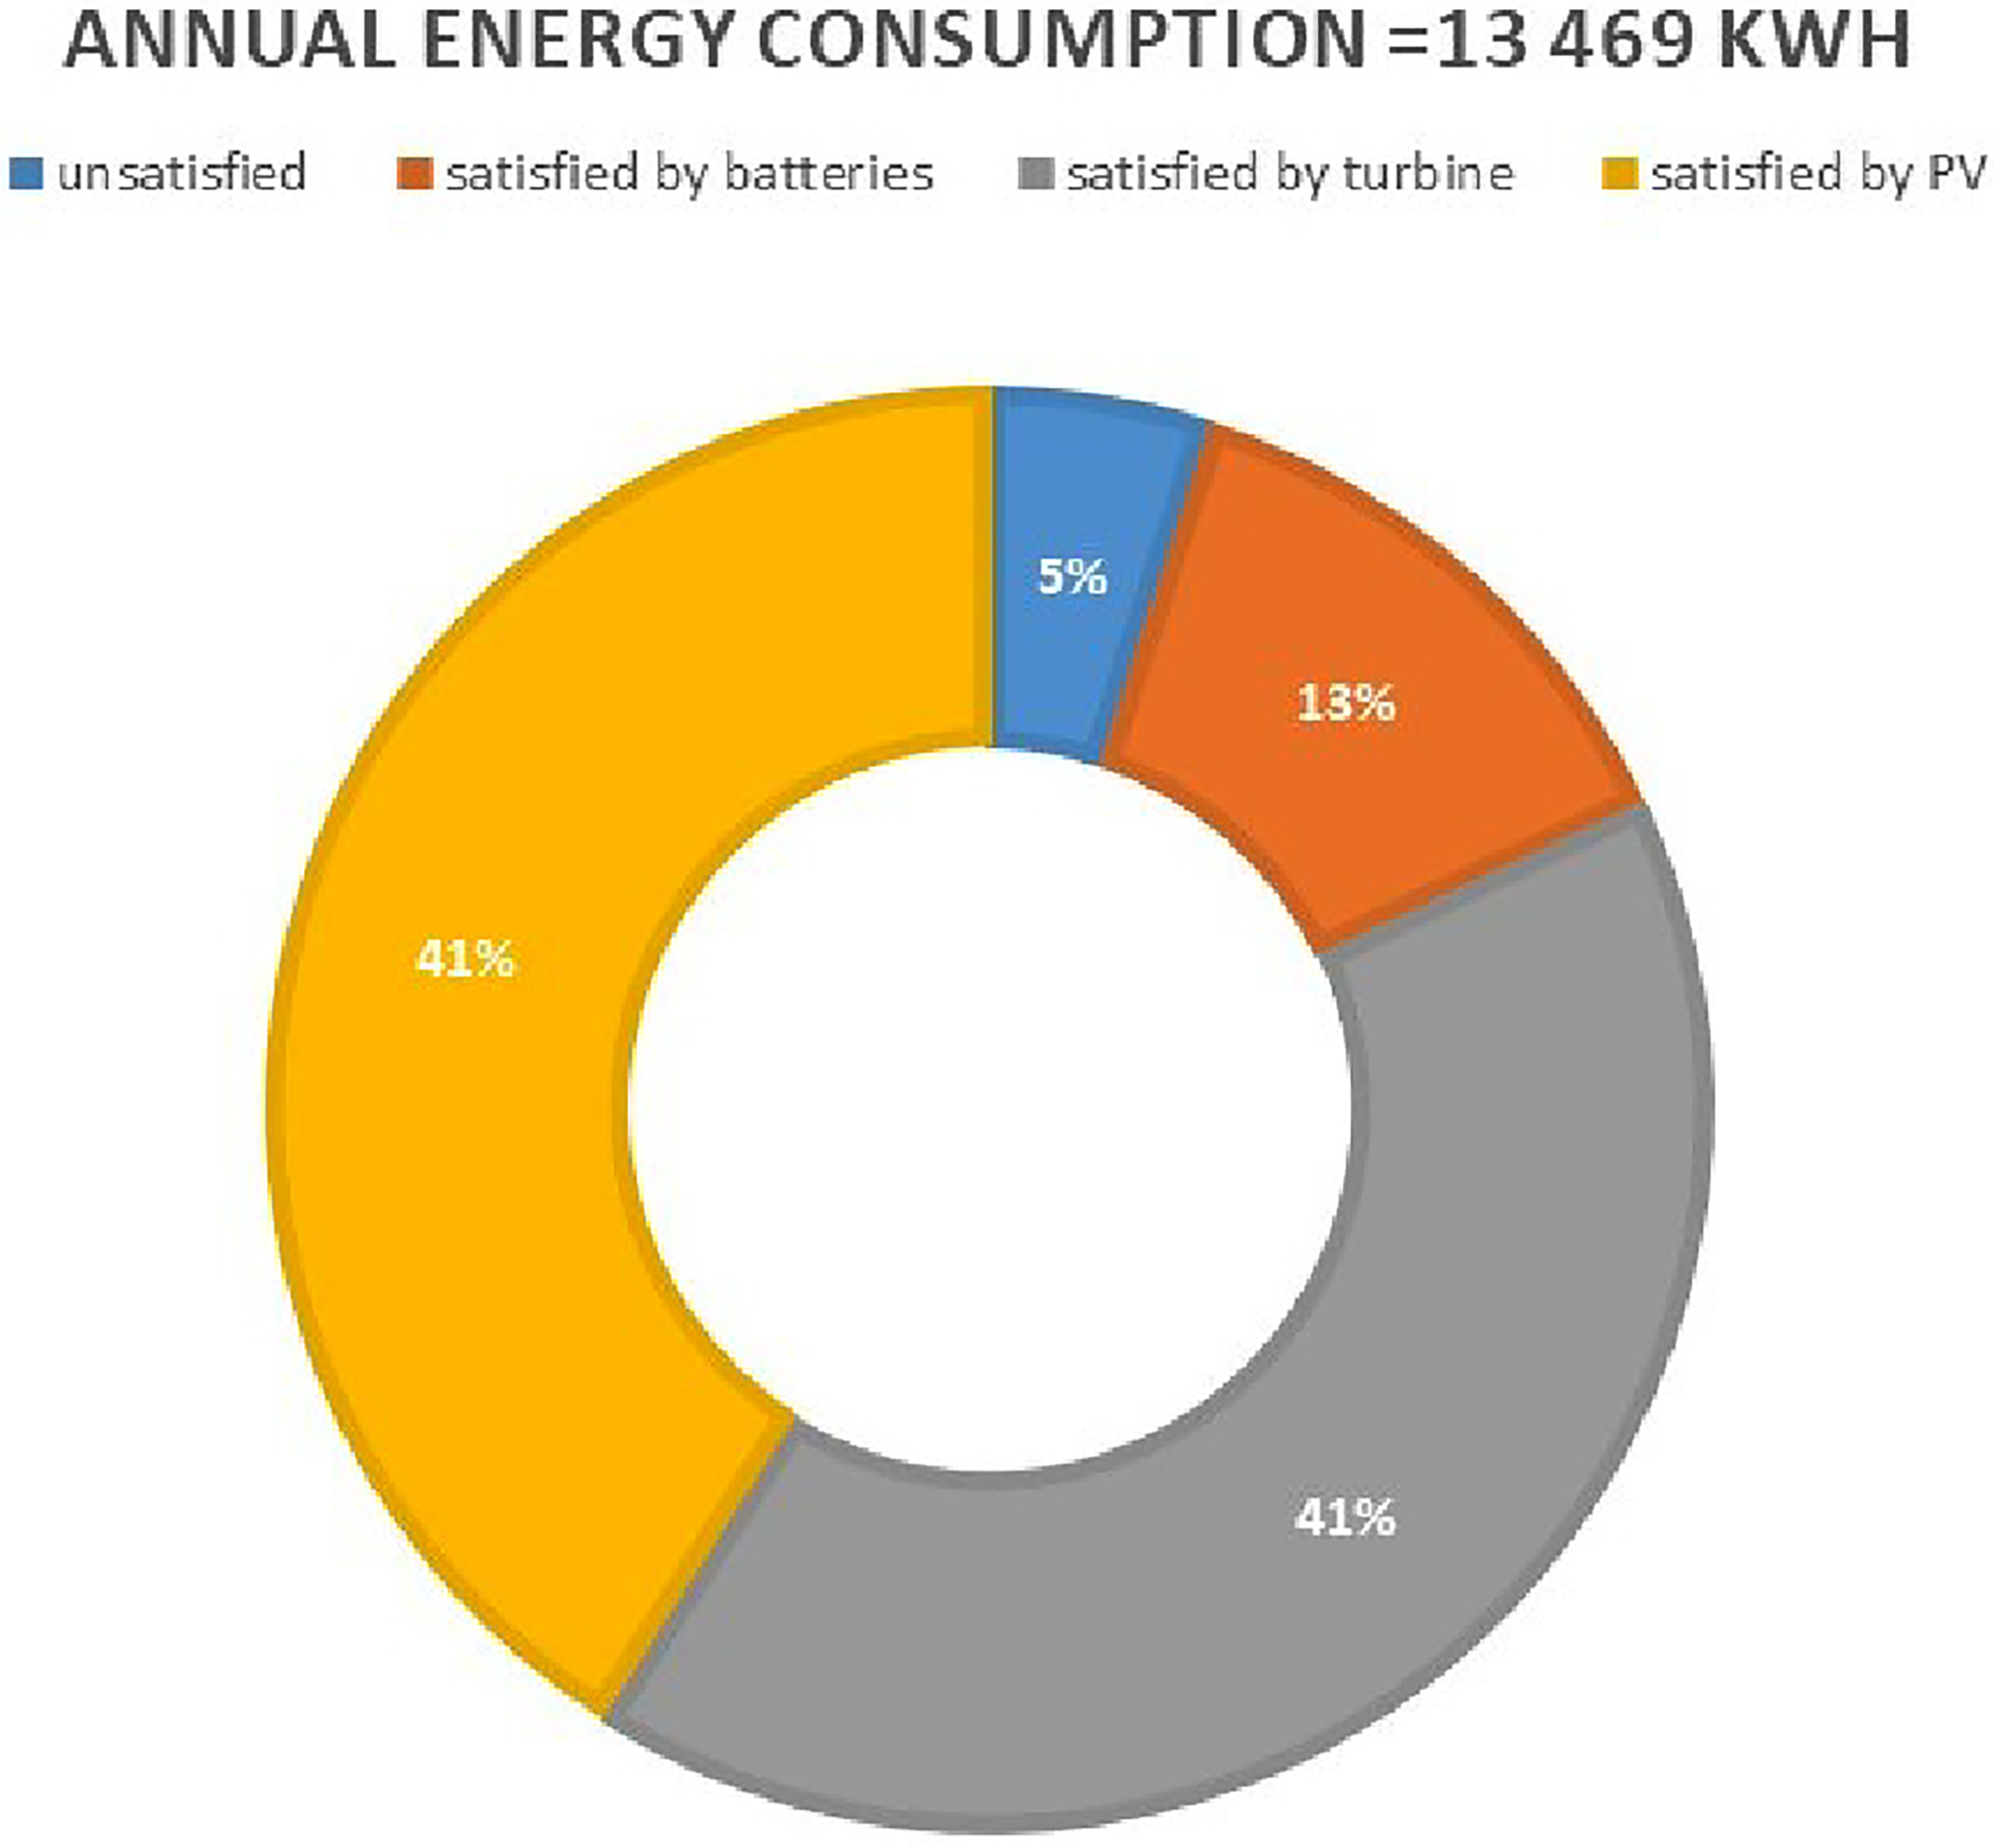
Distribution (%) of the annual power contribution of the subsystems.
Figure 11 shows that the daily power demand (2 kWh) is mostly met by the PV generator, that the night-time power demand (2.6 kWh) is usually met by the turbine, and that in summer the batteries are not used. It can be seen from Figure 12 that the two PV-hydroelectricity contributions are equal (41%).
Figure 13 shows the hourly variations of the amount of water stored in the upper reservoir (m3) and the energy stored in the batteries (kWh).
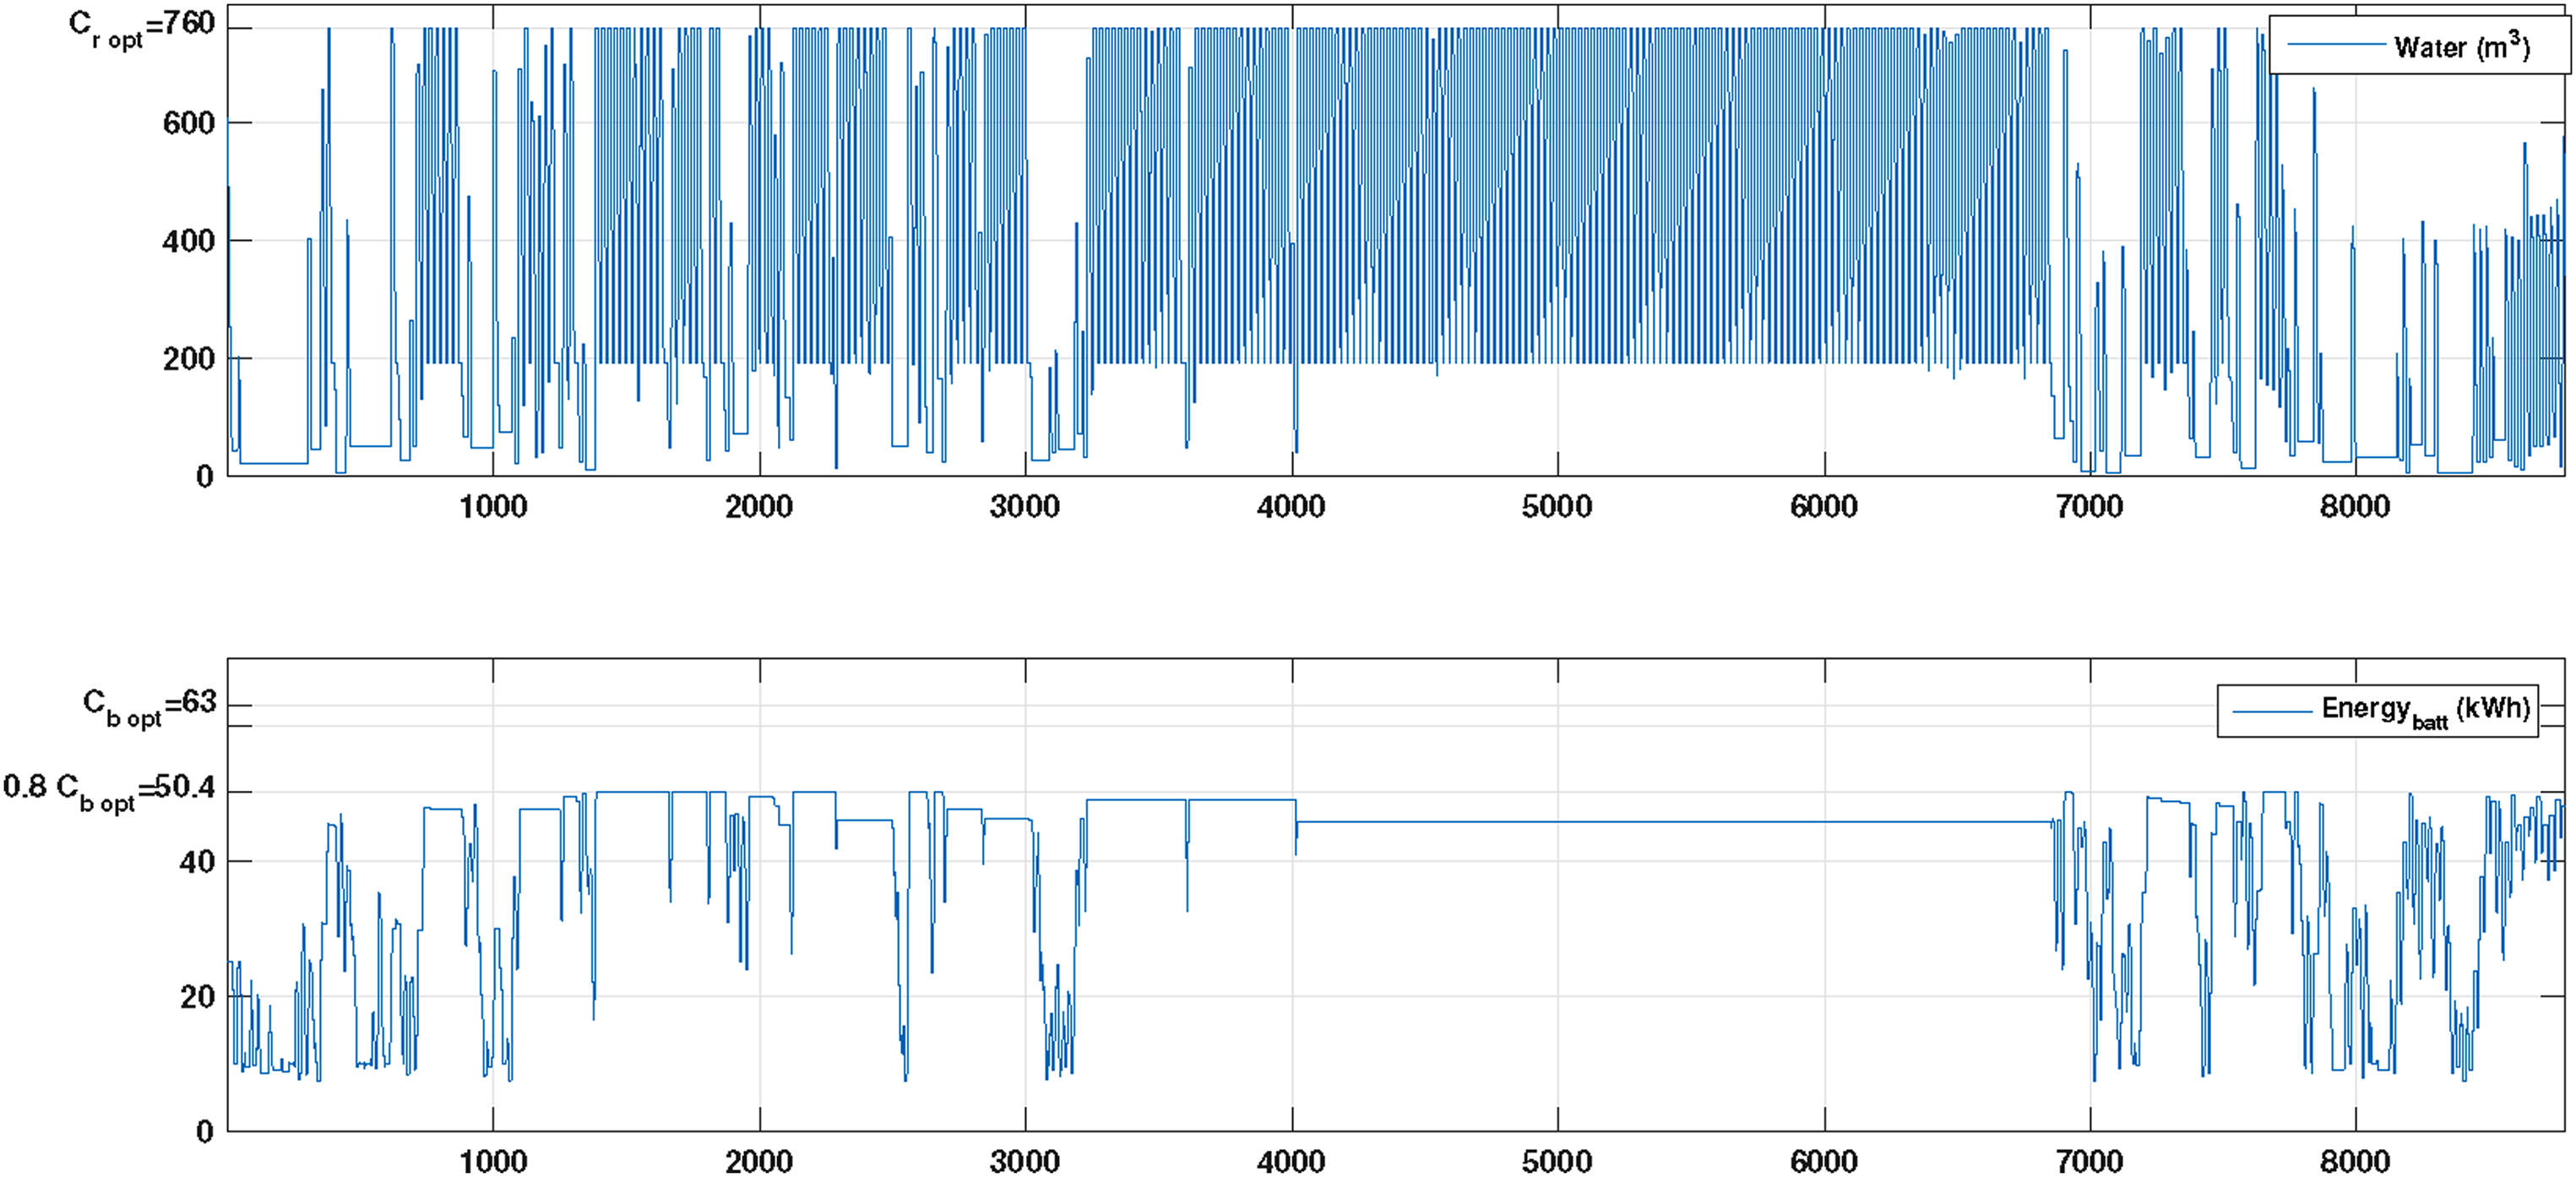
States of charge of the upper water reservoir (m3) and of the batteries (kWh).
It can be seen from Figure 13 that the batteries are almost at their maximum capacity in the summer because of the high PV production, while the upper reservoir is regularly charged/discharged to store the excess of PV energy and to power the load during the night. In winter, when the PV production is low, the discharge of the batteries is higher than the water reservoir.This is because the maximum power output of the batteries (DODmax.Cb max = 0.8 × 64 = 51.2 kW) is much higher than the maximal operating power of the turbine (3 kW).
Figure 14 shows the annual profiles of PV generation, consumption demand, and storage element charging/discharging. It is clear that the batteries have a very low power flow compared to the PSH system because the priority of energy storage/production is reserved for the PSH system. The considerable difference between the charging and discharging profiles of the PSH system is due to the fact that the maximal operating power of the pump (12.9 kW) is much higher than maximal operating power of the turbine (3 kW) and the excess of the PV generation is important. It can also be noted that the batteries are not used during the summer months (June, July, August and September) because they are full and the PSH system is used to store the high PV production and to regularly power the load during the night (Figure 13).
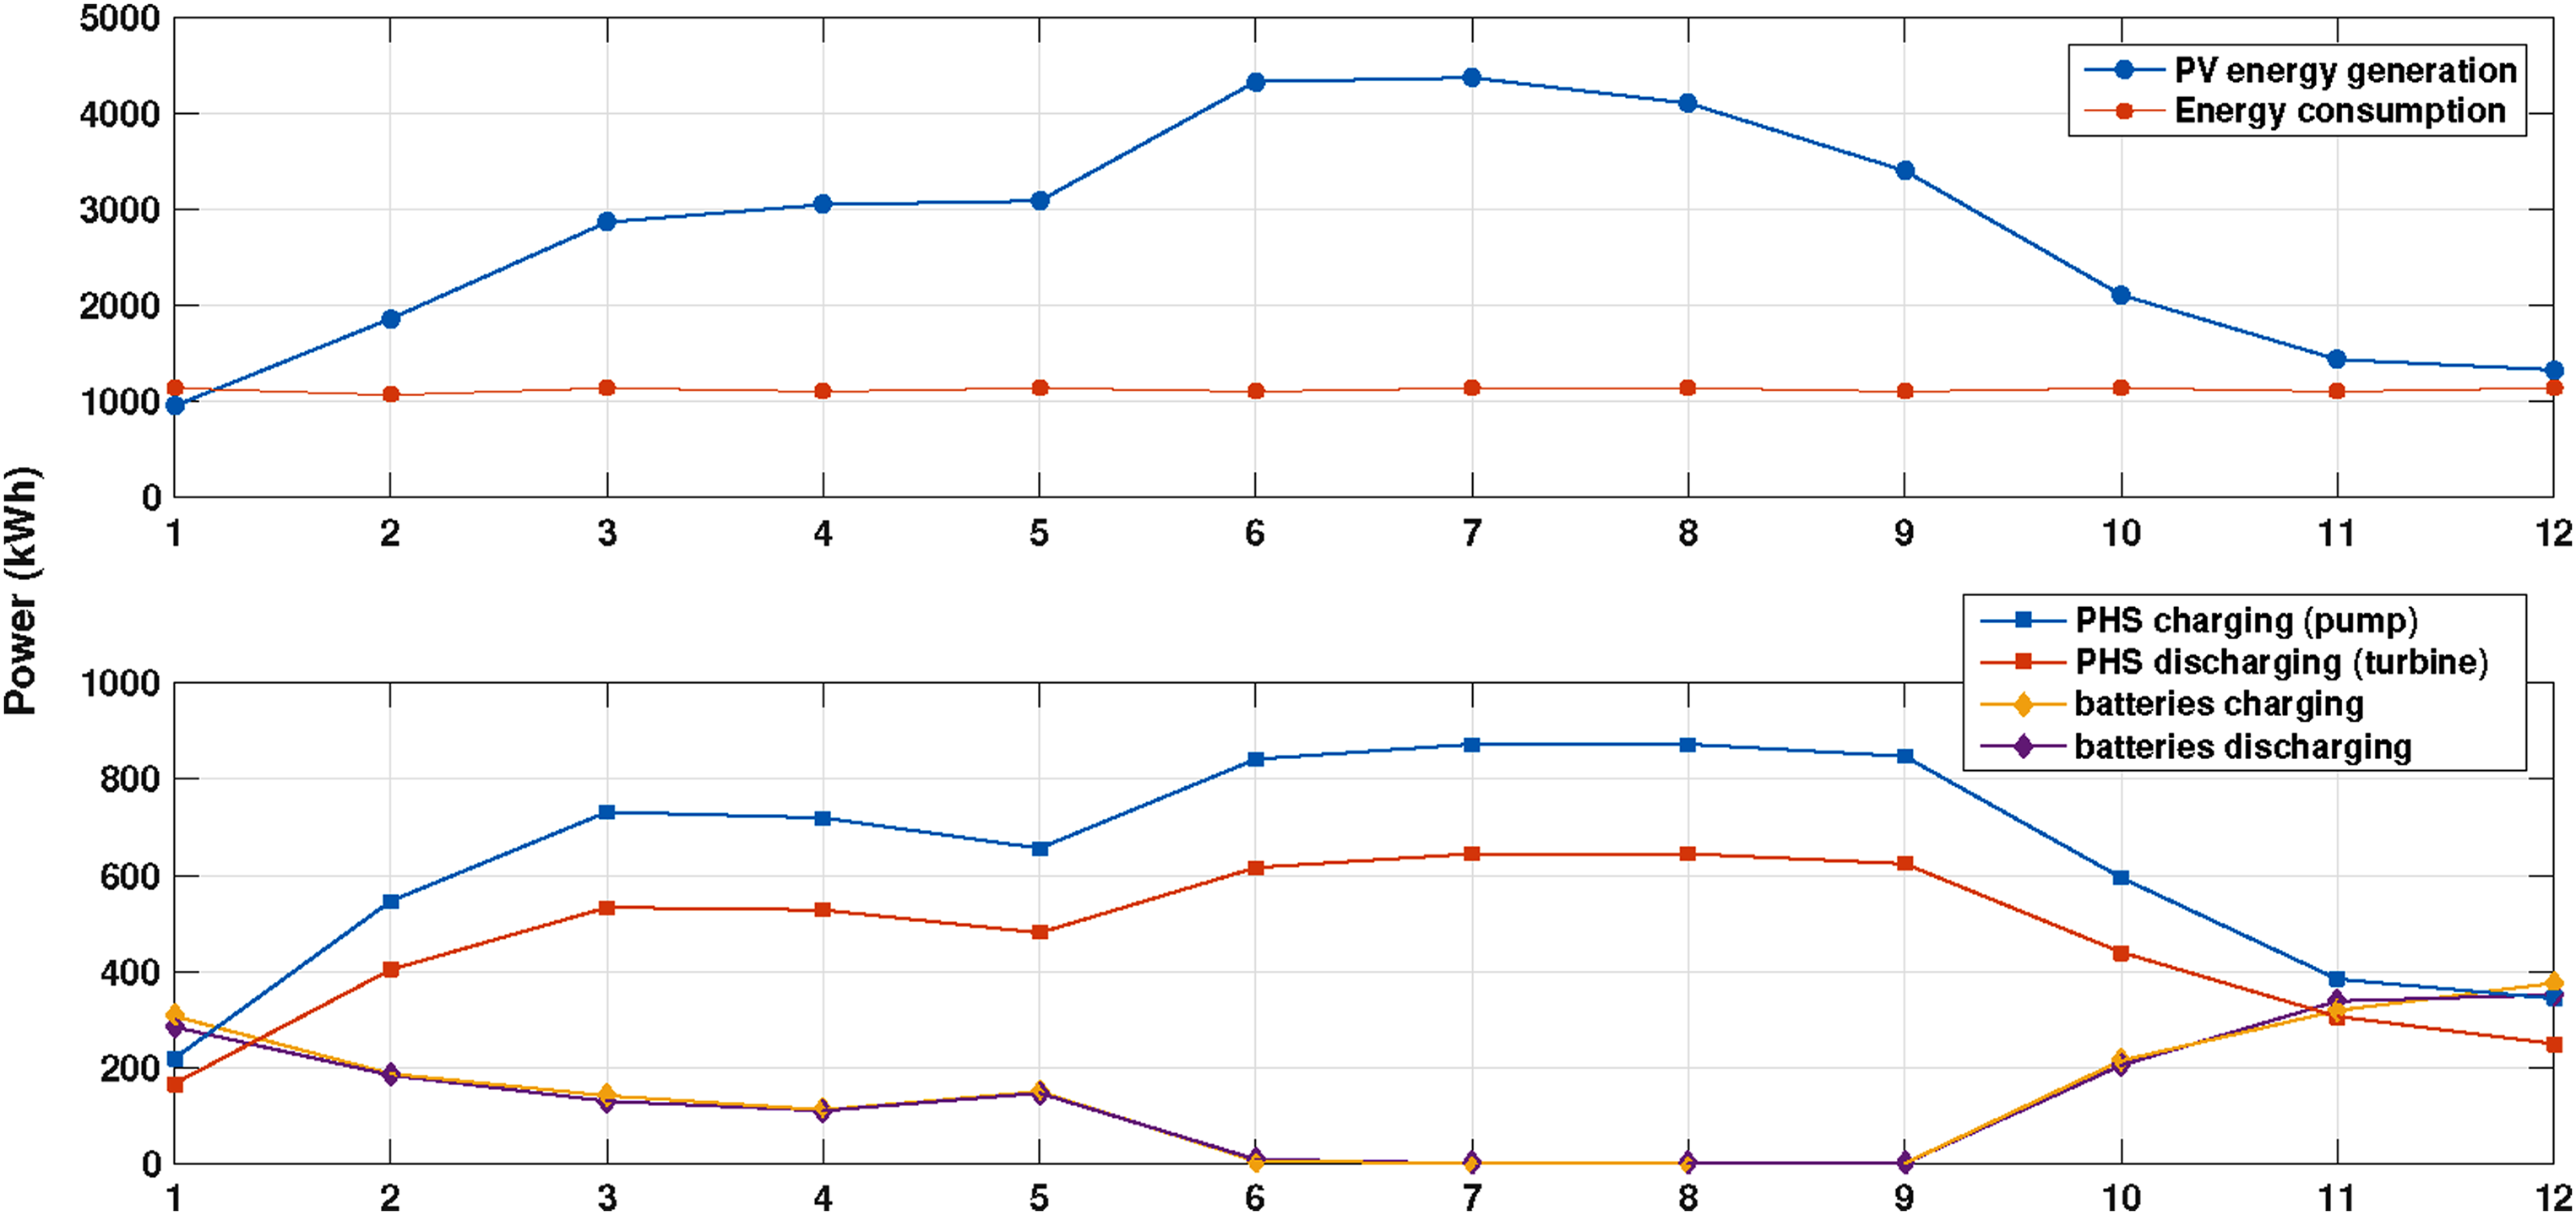
States of charge of the upper water reservoir (m3) and of the batteries (kWh).
Conclusion
In this paper, we have optimized, using GA and under reliability and cost constraints, the sizing and energy management within a stand-alone multisource hybrid renewable energy system composed of a photovoltaic generator, batteries and a PSH system. We detailed the implementation of GA, which includes three phases: selection, crossover and mutation. Two energy management strategies are possible: the priority of energy storage/production is reserved to the batteries or to the PSH system. In this paper, we have discussed only the strategy giving priority to the PSH system.
The last part of this paper was devoted to the simulation results of the system and its interpretations. The results showed that, by using the GA, the best configuration for the considered energy scenario at a desired LPSP of 5% is to have a photovoltaic generator of 22 kwp capacity, a 63 kwh battery bank and a 760 m3 water tank. The convergence time (number of iterations) of the GA depends on the choice of the initial population (the 3 search spaces).
Through these results, we could also conclude that the performance of a photovoltaic installation does not depend only on the efficiency of the PV panels, but also depends on the restricted power ranges of the pump, turbine and batteries.
Other solutions to reduce the surplus of PV energy can be discussed in the future: increasing the number of autonomous days of the storage devices, designing the PSH system and the batteries as a storage system and not as a production system, designing the entire system in two seasons (winter and summer), integrating the system into the grid, etc.
It may also be interesting to discuss, eventually, the second EMS giving priority to batteries and to compare the two strategies regarding reliability and cost
In the end, it is important to mention that the genetic algorithm has some drawbacks. The main disadvantage of the genetic algorithm is that it relies on a random approach, which can occasionally make the convergence to an optimal solution very slow. The setting of the population size, and the choice of the selection criteria for the new population must therefore be done with care.
Footnotes
Declaration of conflicting interests
The author(s) declared no potential conflicts of interest with respect to the research, authorship, and/or publication of this article.
Funding
The author(s) received no financial support for the research, authorship, and/or publication of this article.