
Abstract
As a new approach, biodegradable solid polymer blend polymer electrolytes are prepared using a synthetic polymer Poly [vinyl pyrrolidone] (PVP) and a biopolymer Starch with constant amount of Ammonium ceric nitrate. The Biopolymer starch is used to enhance the biodegradability of the polymer membranes. The polymer electrolytes are prepared by solution casting method using deionized water as solvent. The prepared electrolytes are analyzed with structural, vibrational, electrical and electrochemical behavior by using different characterization techniques. The amorphous nature of the blend polymer electrolytes has been confirmed by X-Ray diffraction (XRD) analysis. PVP/cassava starch/ammonium ceric nitrate polymer electrolyte shows high amorphous nature. In FTIR study, polymers-salt complexation and molecular vibrations are observed in the electrolytes. The ionic conductivity and dielectric measurement of the electrolytes are carried out by impedance spectroscopy. The maximum ionic conductivity of 8.1 × 10⁻⁶ S/cm is observed at room temperature for 80% PVP: 20% cassava starch: 2% ammonium ceric nitrate (ACN) system. The dielectric properties of the prepared polymer electrolytes are also analyzed. The electrolyte having higher ionic conductivity is tested with cyclic voltammetry (CV) and linear sweep voltammetry (LSV) studies that reveal the electrochemical properties and range of potential window of the polymer electrolyte.
Highlights
Environmental friendly PVP:Starch:Ammonium ceric nitrate polymer electrolytes are prepared by simple solution casting technique
The FTIR analysis confirms the complexation and functional groups present in the electrolytes.
When biopolymer starch is added with PVP, the ionic conductivity increases.
These biodegradable polymer membranes with high ionic conductivity can be used for electrochemical devices.
Further, by doping plasticizers and nanofillers, ionic conductivity of the electrolytes can be improved.
Introduction
Throughout the world, energy demand is increasing day-by-day. The role of energy storage devices is inevitable in the recent years. Solid polymer electrolytes play a main role for the better performance of these devices. So, researchers are mainly focusing on solid polymer electrolytes due to their high ionic conductivity, good thermal and electrochemical stability, better desired shapes and sizes, no leakage problem and also good alternative for liquid and gel based polymer electrolytes. 1 In early stage, single polymer and salt are used but it didn’t provide better result and good ionic conductivity. In modern period, it can be overcome by different approaches like polymer blending, adding plasticizers and fillers to improve the conduction of polymer electrolyte. For solid polymer electrolytes(SPE), phase system is important that means choice of polymer is in amorphous or crystalline phase but good conduction occurs in amorphous phase only. 2 For blending concept, the two types of polymers are physical mixtures via secondary forces which may interact to present ionic and dipole interaction. 3 It contains both synthetic and biopolymer such as polyvinyl alcohol (PVA), polyvinyl chloride (PVC), polypropylene oxide (PPO), polyvinyl pyrrolidine (PVP) and natural polysaccharide materials like cellulose, starch, carrageenan and chitosan. 4 Developing eco-friendly and biodegradable material is a challenge for synthetic polymer electrolyte and also easily available, low cost, biocompatible and good performance polymer electrolytes are used for device applications. 5 Some literature about biopolymer electrolytes are given by Buvaneshwari et al. and it reported the eco-friendly and biodegradable polymers with better performance for energy storage devices by using Gellan gum. 6 At the same time environmental issues like water pollution, global warming should be handled by peoples, so, it is avoided by using of bio-polymer materials and also it protect our environment. 7 Many research attempts are going on these problems such as You et al. developed a direct methanol fuel cells by using rice husk as a filler to improve the performance 8 and Rupa kasturi et al. derived carbon from bio-based material for energy storage devices. Man should need to lead a sophisticated and healthy life without using hazardous chemicals. Researchers may move to biocompatible polymers like PVP, starch, cellulose and etc. 9
PVP is a one of the attractive semi-crystalline polymer which possess high amorphous nature due to the presence of pyrrolidone group of carbonyl bond easily interact with hydroxyl and amino group which create novel characteristics. It is a biocompatible polymer which can be used as blood plasma expander for trauma victim, binder in pharmaceutical tablet, ointment, surgical scrubs and in agriculture application such as crop protection, seed treatment etc.10,11 In electrolyte preparation, PVP is a good film forming agent, easily soluble in water due to amorphous nature. It provides good electrical and electrochemical performance which is suitable for device fabrication. 12 Ramya et al. reported that PVP doped with ammonium thiocyanate has conductivity value of 1.7 × 10⁻⁴ S/cm and it is blended with some synthetic polymer which gives better conductivity of 1.16 × 10⁻⁴ S/cm has been reported by Regu et al.13,14 At the consideration of blend system mostly PVP blend with synthetic polymer and nowadays it is blended with some biopolymers such as chitosan and starch blended PVP has reported better conductivity of 1.31 × 10⁻⁴ S/cm. 15 Starch is a biopolymer naturally available carbohydrate from plants, root and leaves. It is a polysaccharide which consists linear and branched molecules composed by amylose and amylopectin content in α (1→4), α (1→6) glycosidic linkages. There are rich variety of starch available in nature such as potato, corn starch, maize, rice and cassava starch. 16 Starch from Manihot esculenta play vital role as a biopolymer in packaging application but recent research is focused on electrochemical application. 17 Few works are reported using Manihot esculenta starch powder, Arrieta et al. synthesized a biofilm using cassava starch with lithium perchlorate that gives better conductivity of 8.1 × 10⁻³ S/cm adding plasticizer. 18 Electric double layer capacitor of electrochemical device was fabricated with high conductivity of 3.1 × 10⁻³ S/cm using Manihot starch has reported by Kasturi et al. 16 Ismail et al. has reported zinc-air fuel cells using cassava starch with better conductivity. 19 This reported work shows that starch has good conductivity, thermal stability, easily biodegradable and flexibility and suitable for electrochemical application such as battery, fuel cells, supercapacitor. 17 In polymer electrolyte dopant is used to improve the ionic conductivity of polymer. The ammonium ceric nitrate is a salt which is soluble in water and act as an oxidized agent for organic synthesis. It contains monomeric structure and presumed free ammonium ions, Ammonium ceric nitrate is used for making or breaking carbon-carbon bond at single electron transfer reagent.20,21,22 In this ammonium ceric nitrate salt, ammonium plays a role for conducting ions which indicates the NH3+ and H+ protons in polymer system. In present work, PVP: cassava starch with ammonium ceric nitrate as dopant is used to prepare solid polymer electrolytes with good electrochemical performance. The prepared polymer electrolytes are tested with XRD, FTIR, AC impedance analysis, cyclic voltammetry and linear sweep voltammetry.
Experimental procedure
Materials
Polyvinyl pyrrolidone with molecular weight of 90,000 g/mol (Sd-fine chemicals, India), Cassava starch from Manihot esculenta root and cerium ammonium nitrate (sigma-aldrich, India) are used to prepare the electrolytes. Deionized water is used as solvent throughout the work.
Preparation method
The blend polymer electrolytes have been prepared by PVP, starch and cerium ammonium nitrate as dopant in the ratio of (100:00:2), (80:20:2), (60:40:2), (40:60:2), (20: 80: 2), (0:100:2). Different weight percentage of PVP polymer and cassava starch were taken in a 15ml of deionized water separately and 2% of salt also stirred continuously to get a clear solution. After that the solution is mixed to form homogenous solution and it can be poured into a petri dish to evaporate the solvent at room temperature for 3 days. The polymer electrolyte film is peeled off from the petri dish. Further, the films are tested with different techniques to analyze their structural, thermal and electrochemical stability.
Characterization techniques
XRD analysis
X-Ray diffraction (XRD) pattern was taken for all the solid blend polymers using Bruker-made X-Ray diffractometer with wavelength (λ) of 1.54A° with 5° per minute scanning rate from 10o to 60° to confirm the structural identification.
FTIR analysis
The SHIMADZU-IR Tracer-100 spectrometer was used to record the Fourier Transform Infrared (FTIR) spectrometer transmittance spectra of the solid blend polymer electrolytes in the wavenumber region of 4000cm−1 to 400cm−1. It provides information about complex formation between polymers and salt and also gives the details of different vibrational modes of the polymer electrolytes.
Impedance analysis
The prepared solid polymer electrolytes are used for Impedance analysis to study the electrical properties. The electrolytes are placed sandwiching between the two silver electrodes and the data is carried out by HIOKI-3532 LCR meter with frequency range of 42 Hz – 1MHz.
Electrochemical stability
The Electrochemical properties of the higher conducting polymer electrolytes are studied by CH - instrument of model 6008e. The electrolytes are placed between two silver electrodes (Ag// SPE//Ag) and analysis are carried out.
Result & discussion
XRD analysis
X-ray diffraction pattern is used to analyze the nature (amorphous or crystalline) of the material and it is shown in Figure 1. The X-ray pattern for all the PVP/cassava starch/ammonium ceric nitrate blend solid polymer electrolytes are shown in figure.1. The structural peaks of pure PVP and pure cassava starch were already reported by Venkata abba rao et al., 23 Vahini et al. 24 and Tavares et al. 17 In the present work, it is observed that the broad peak intensity at 2θ = 20° decreases when 20wt% of starch is added. Above this concentration of salt, the peak intensity increases. When we add more salt beyond this limit, salt agglomeration takes place which restrict the further movement of ions in the polymer matrix. So, 20wt% of starch doped system has more amorphous nature which has also sufficient number of charge carriers. The intensity of broad peak at 2θ = 30° increases gradually when the concentration of starch is increased.17,25 When increasing of starch content, small sharp peak is observed at 2θ = 16° that expose the semi-crystalline nature of the starch. 26 When PVP/Starch blend is added with ammonium ceric nitrate, the characteristic peaks corresponding to salt are absent in the polymers-salt system Figure 1, which confirms the complete dissolution of salt in the polymer matrix.
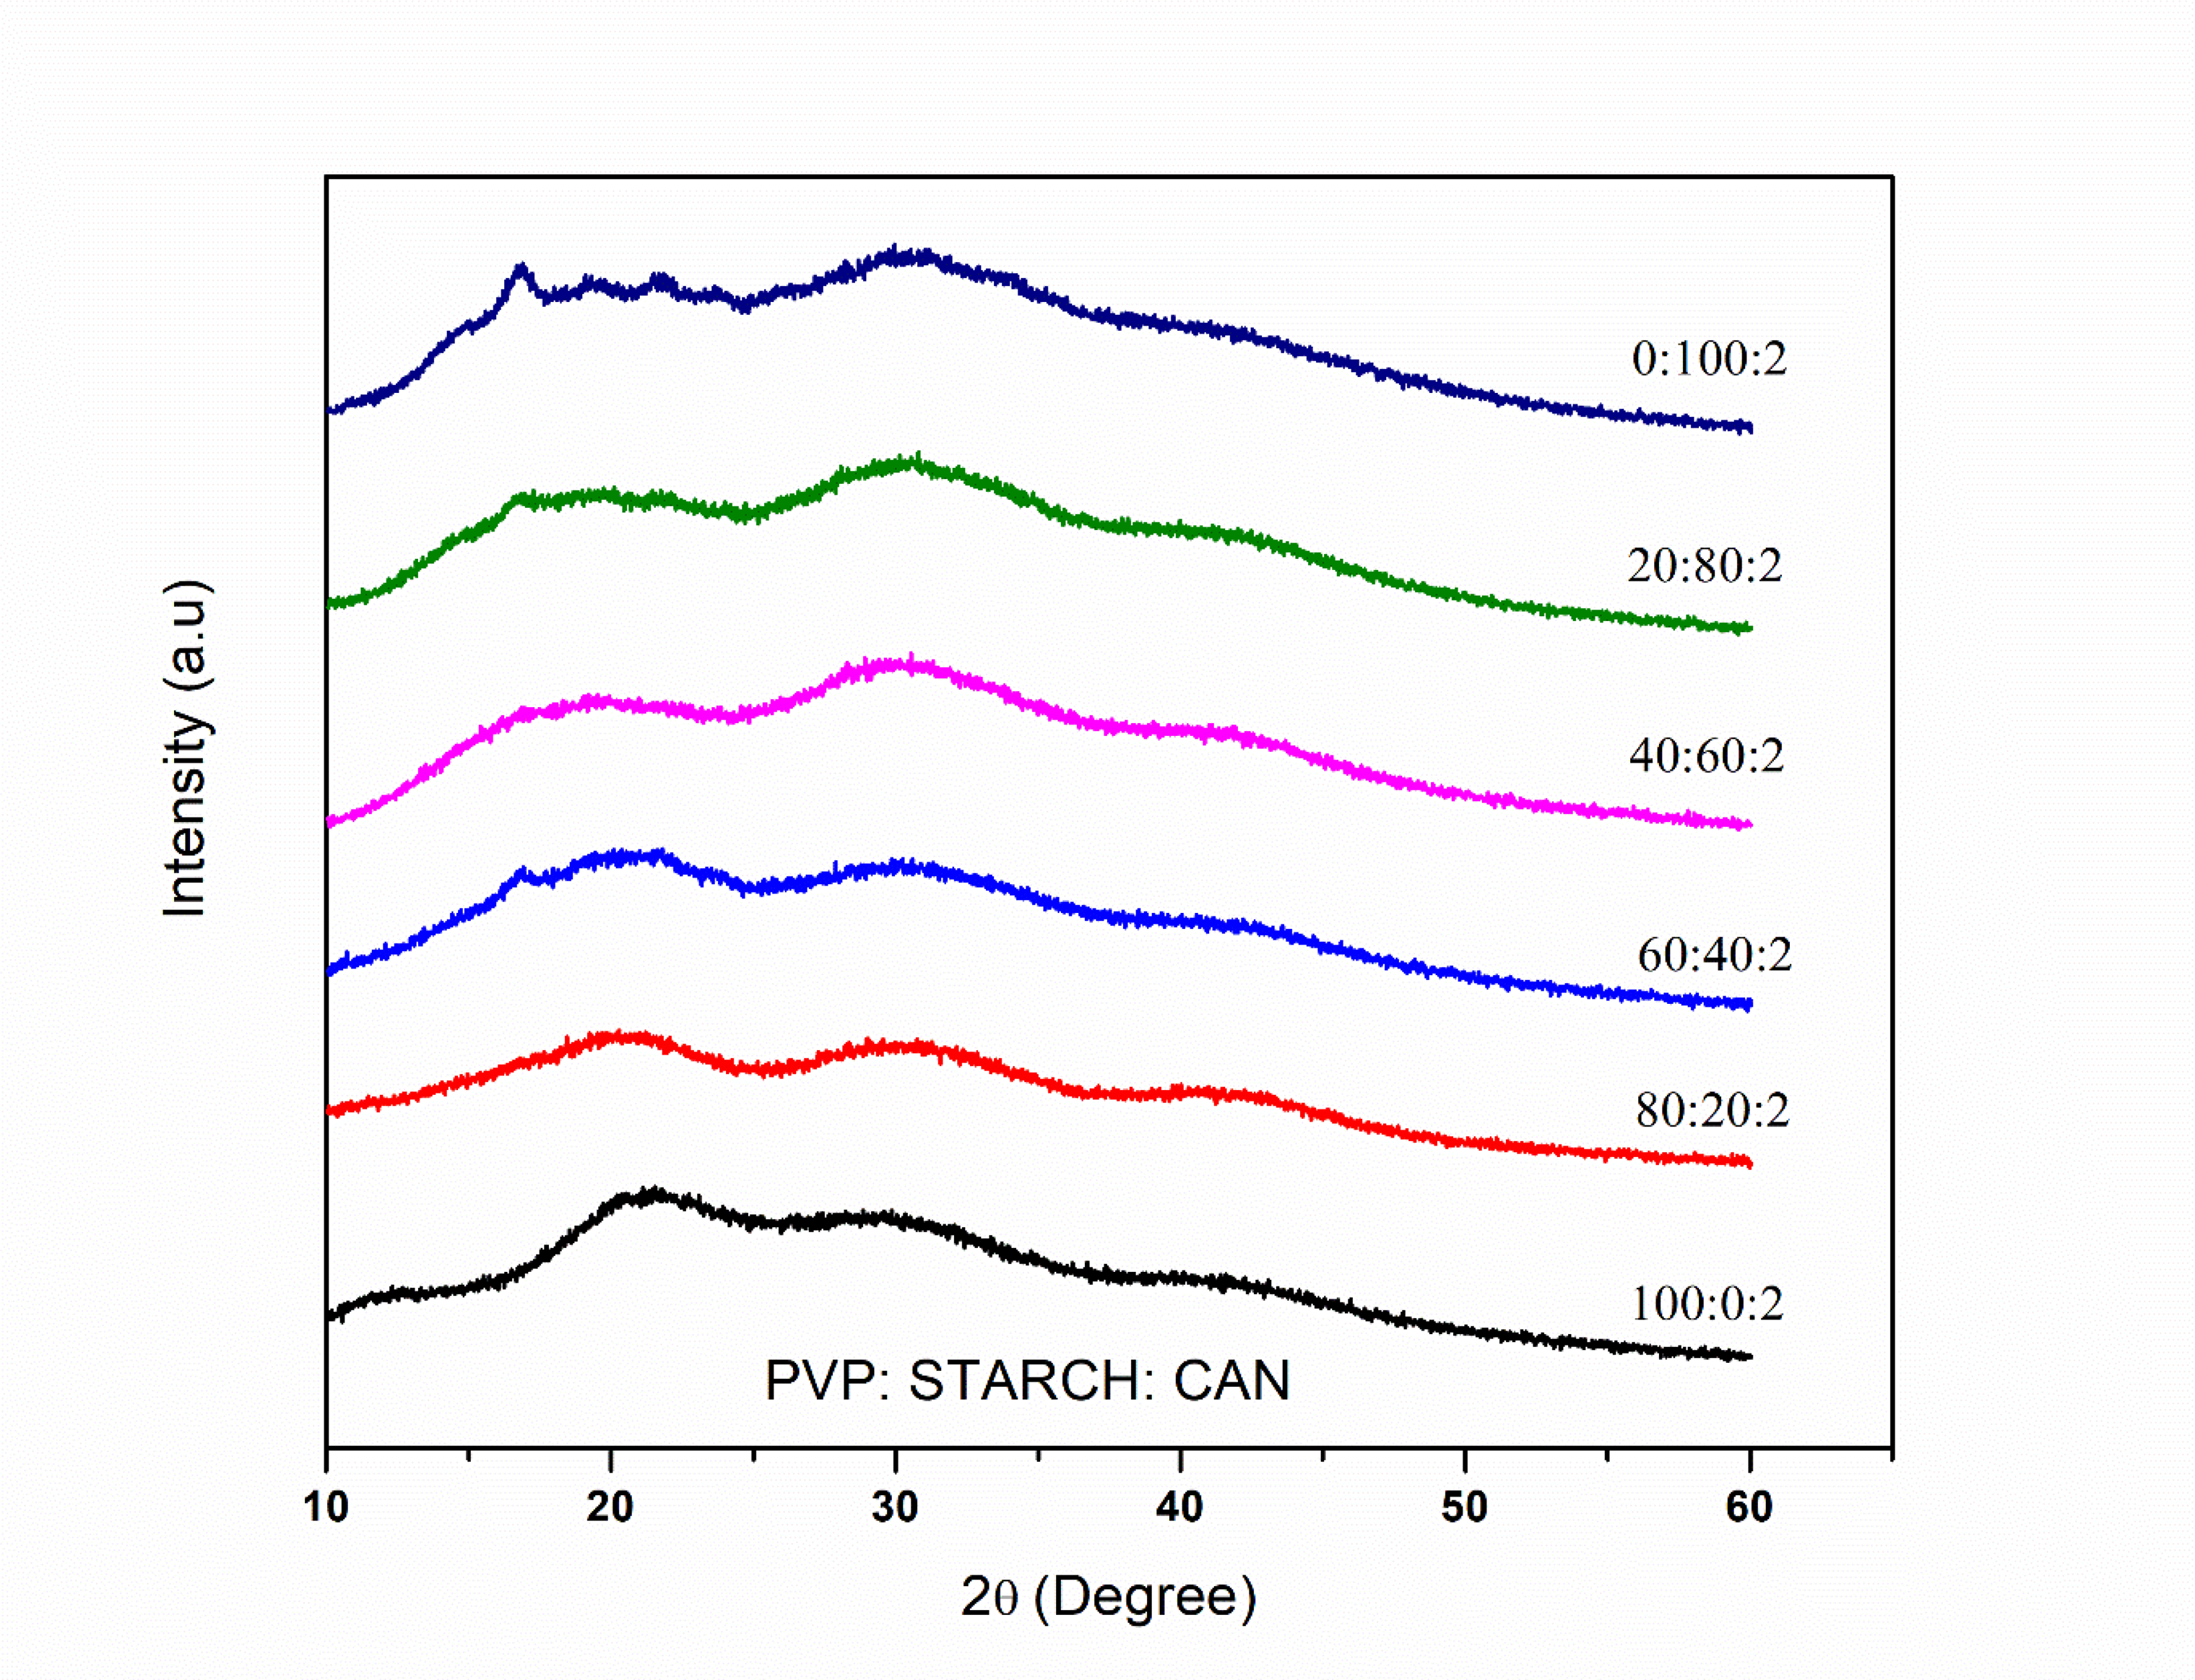
XRD pattern for PVP/starch/ammonium ceric nitrate polymer blend electrolytes.
FTIR analysis
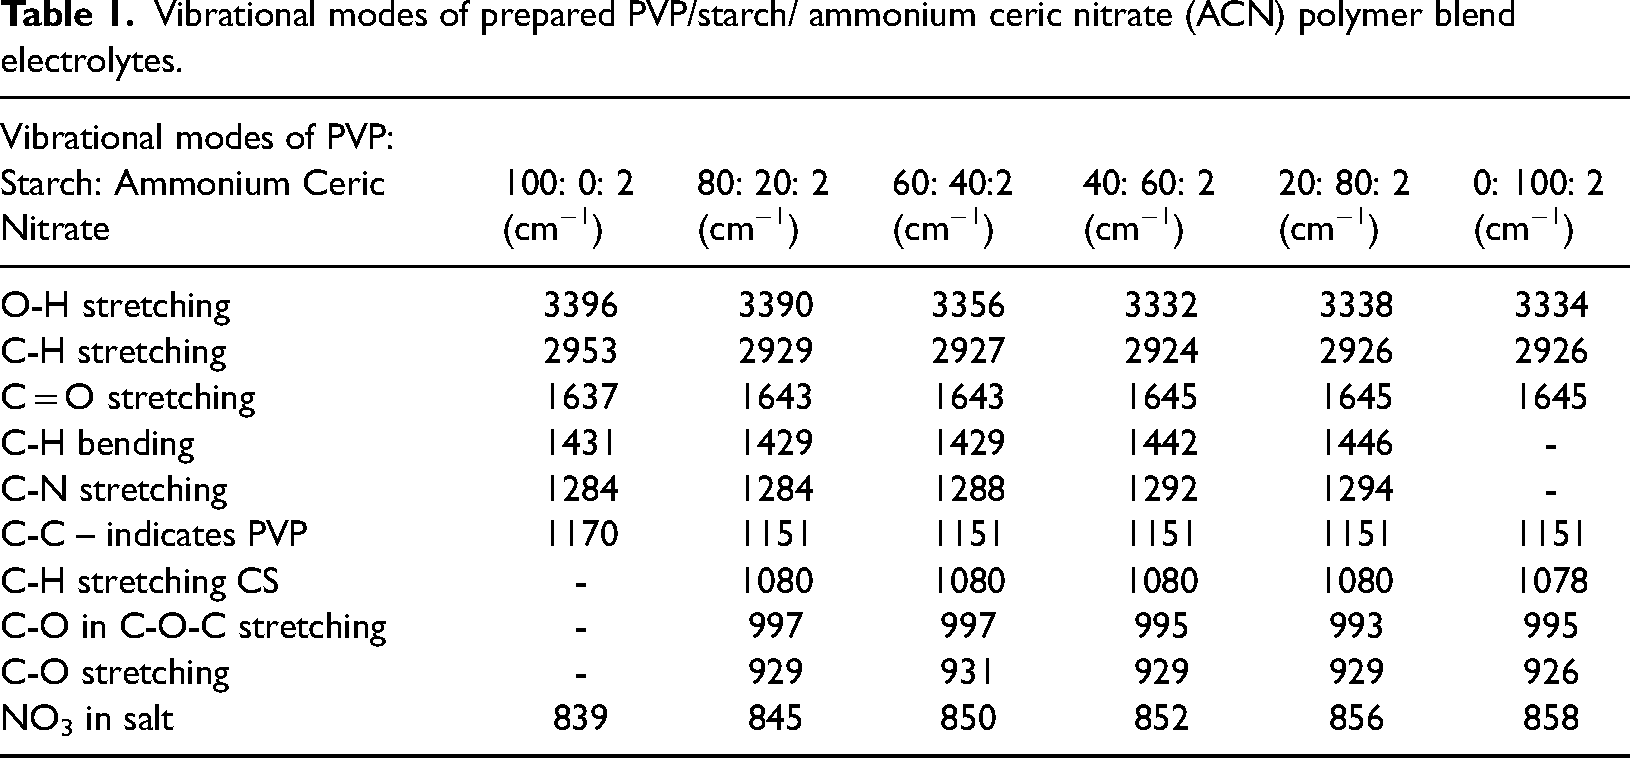
The complex formation and vibrational modes of chemical bond for PVP blend cassava starch with salt were discussed by FTIR spectrum. The vibrational modes of prepared solid polymer electrolytes are tabulated in Table 1. Hydroxyl bond of O-H stretching vibrations can be attributed at wavenumber range of 3600-3200 cm−1. A broad peak and C-H stretching vibration at 2926 cm−1 is appearing at all systems. 27 The presence of C = O stretching vibration explains the intermolecular interaction between carbonyl compounds of pyrrolidine rings of PVP at 1637 cm−1. The hydroxyl group of starch peaks are appearing at 1650cm−1 due to the polymer-salt interaction and it shifts to wavenumber range 1645 cm−1.28,29 The C-H bending vibrational band of PVP blends and C-N stretching vibration appears at wavenumber 1431 cm−1 and 1284 cm−1 respectively.30,31 The absorption peak of C-C bond at 1170cm−1 that indicates the presence of PVP and it is shifted to 1151 cm−1 due blending of starch.24,27 The C-O and C-H stretching vibrational bands range from 900-1080 cm−1 indicates the presence of anhydroglucose and it is shifted to 929 cm−1, 1080 cm−1 in blends.32,33 The C-O-C stretching of starch is present in the wavenumber of 997 cm−1 that indicates the polysaccharide group. The bands at 1700-800 cm−1 are identified due to addition of salt in blend system. The nitrate peak of salt obtained at 826 cm−1 is shifted to 839 cm−1 in all blends.14,34 The observed changes in the peaks shifting proposes the complex formation between polymers and salt. The FTIR spectra of the prepared polymer systems are given in Figure 2.
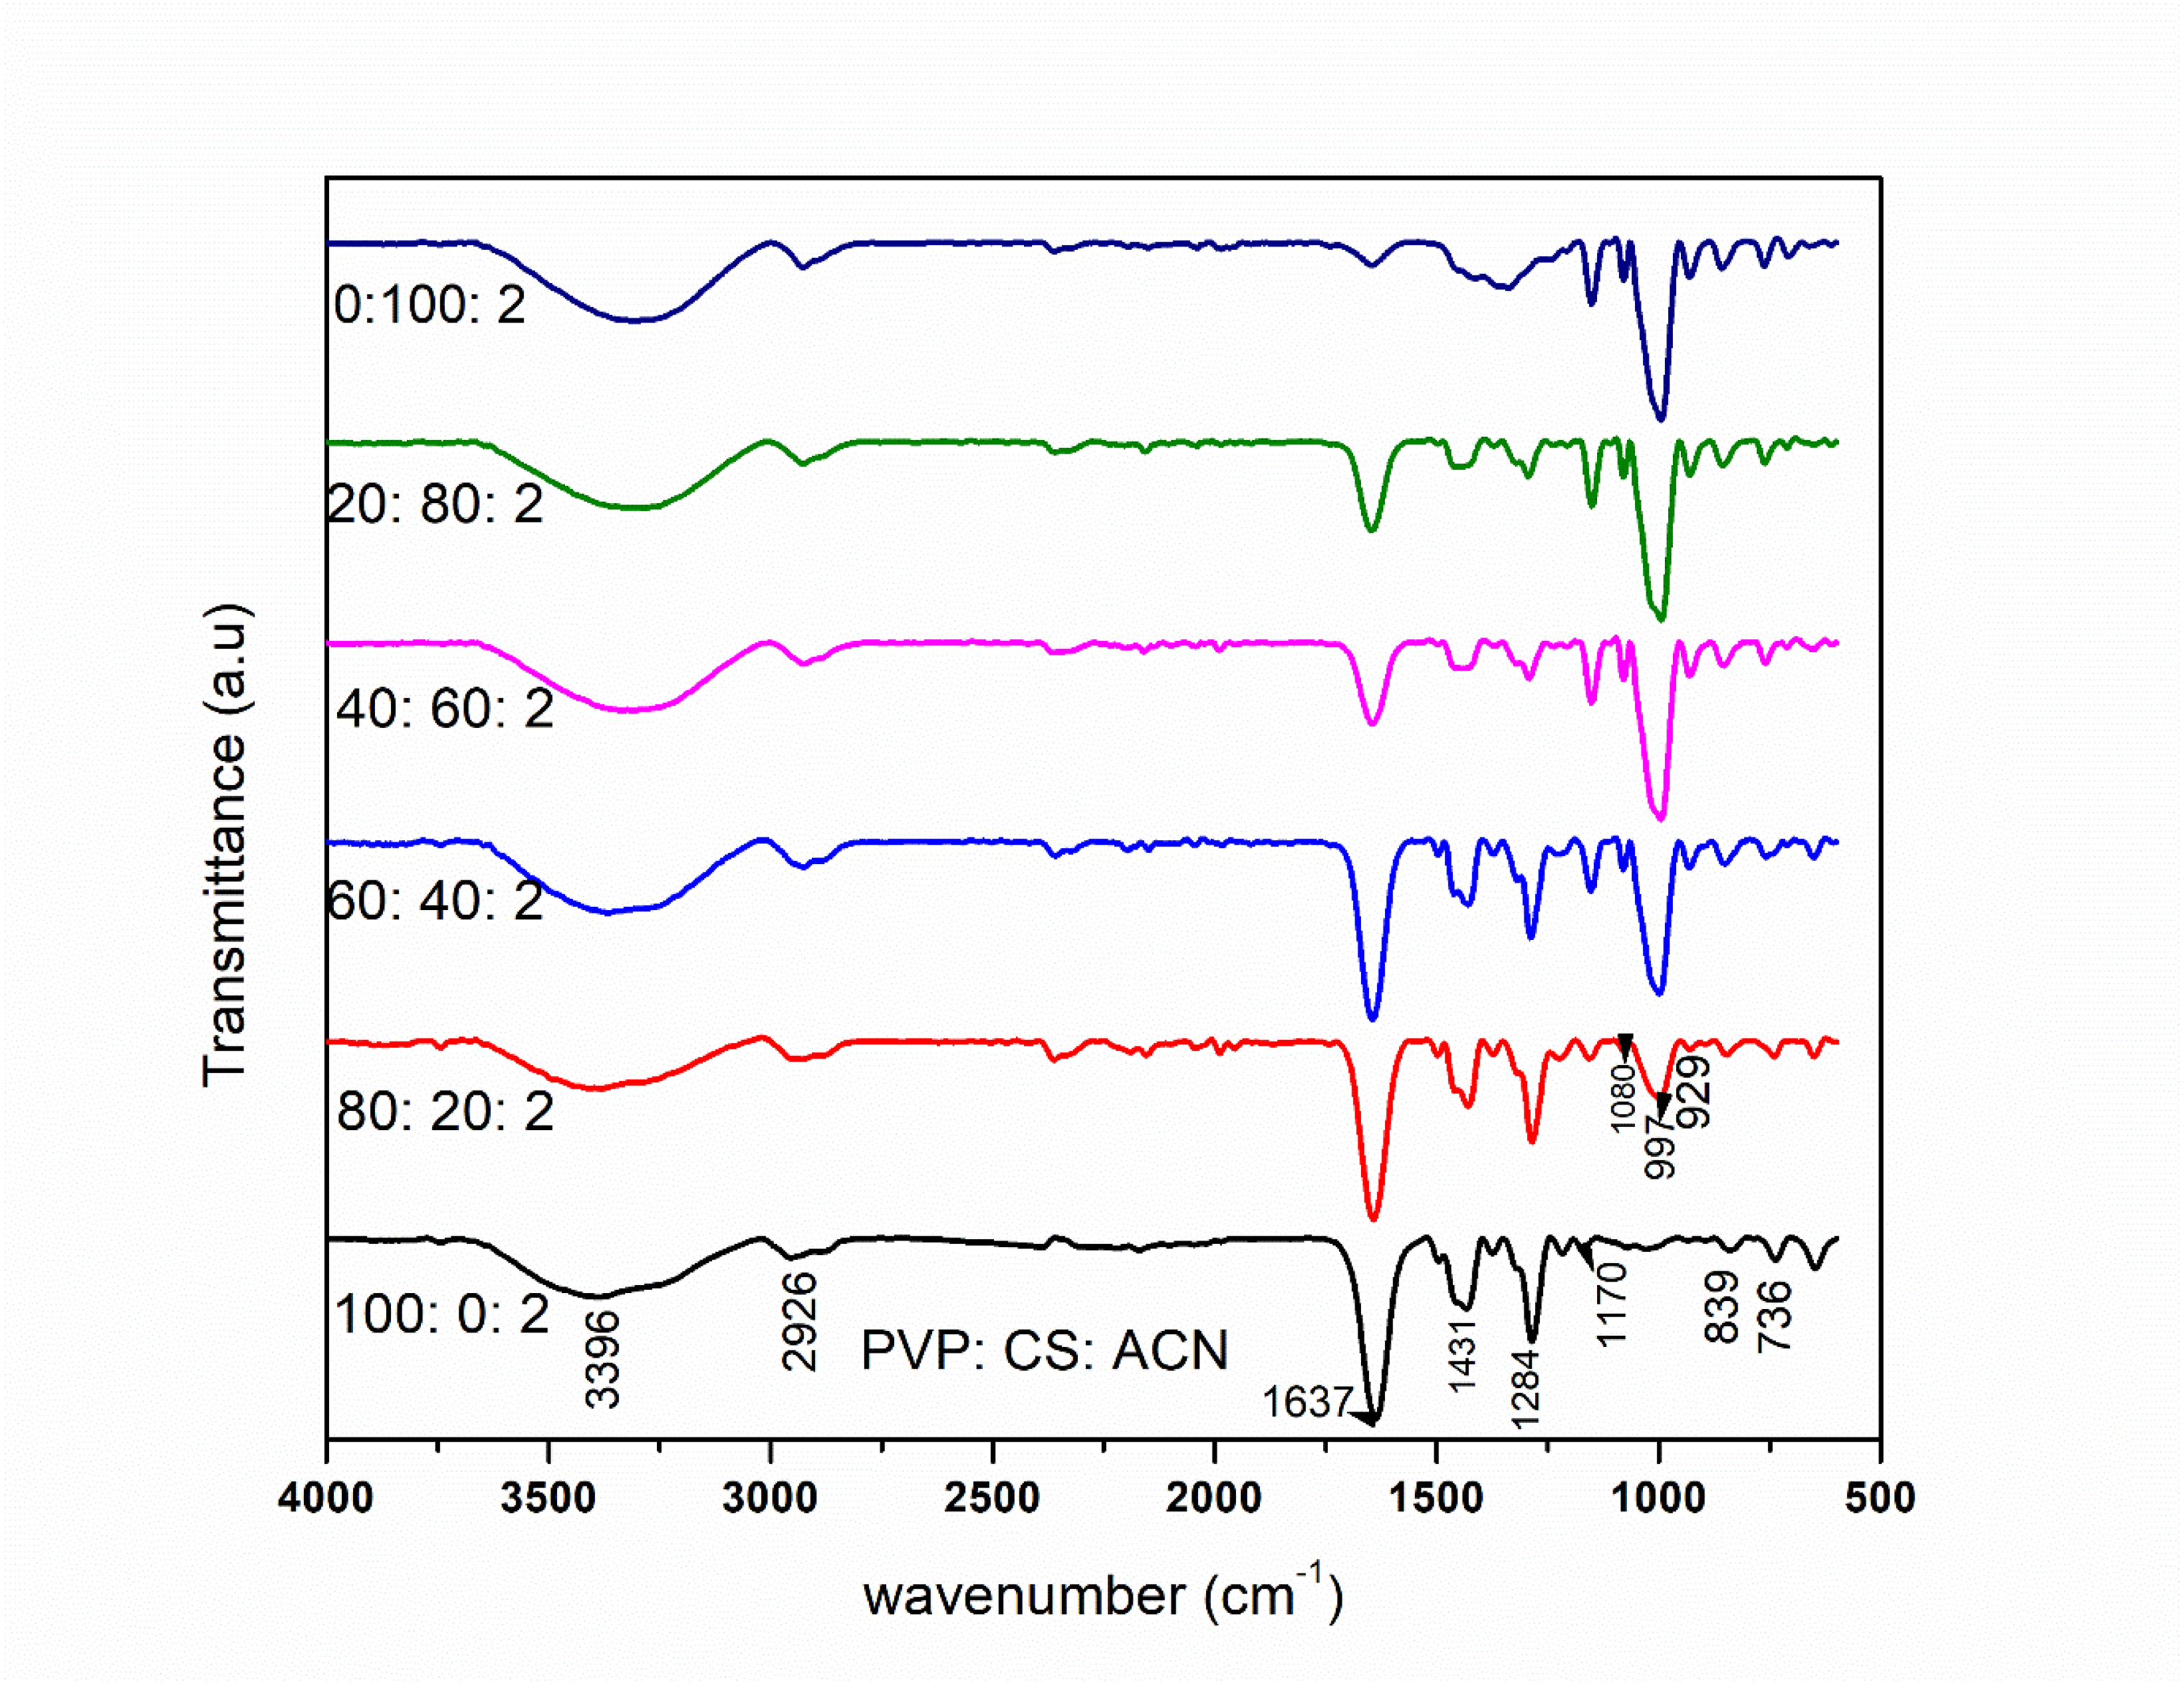
FTIR spectra for PVP/starch/ammonium ceric nitrate polymer blend electrolytes.
Vibrational modes of prepared PVP/starch/ ammonium ceric nitrate (ACN) polymer blend electrolytes.
Impedance analysis
Nyquist plot
The electrical measurements of the electrolytes are investigated by AC impedance spectroscopy.
35
The plots of different composition of PVP/cassava starch (100:0, 80: 20, 60:40, 40: 60, 20: 80, 0:100) with 2% constant ceric ammonium nitrate are are shown in Figure 3. In these studies, the formation of semicircle has two distinct regions, one is higher frequency that denotes the parallel combination of capacitor and bulk resistance because of migrations of protons and another one is spike at low frequency because of polarization between electrolyte and electrode interaction.23,36 Generally, depressed semicircle indicates the decrease of bulk resistance by adding polymers and salt. In present work the salt ratio is taken as constant because Sundar et al.
20
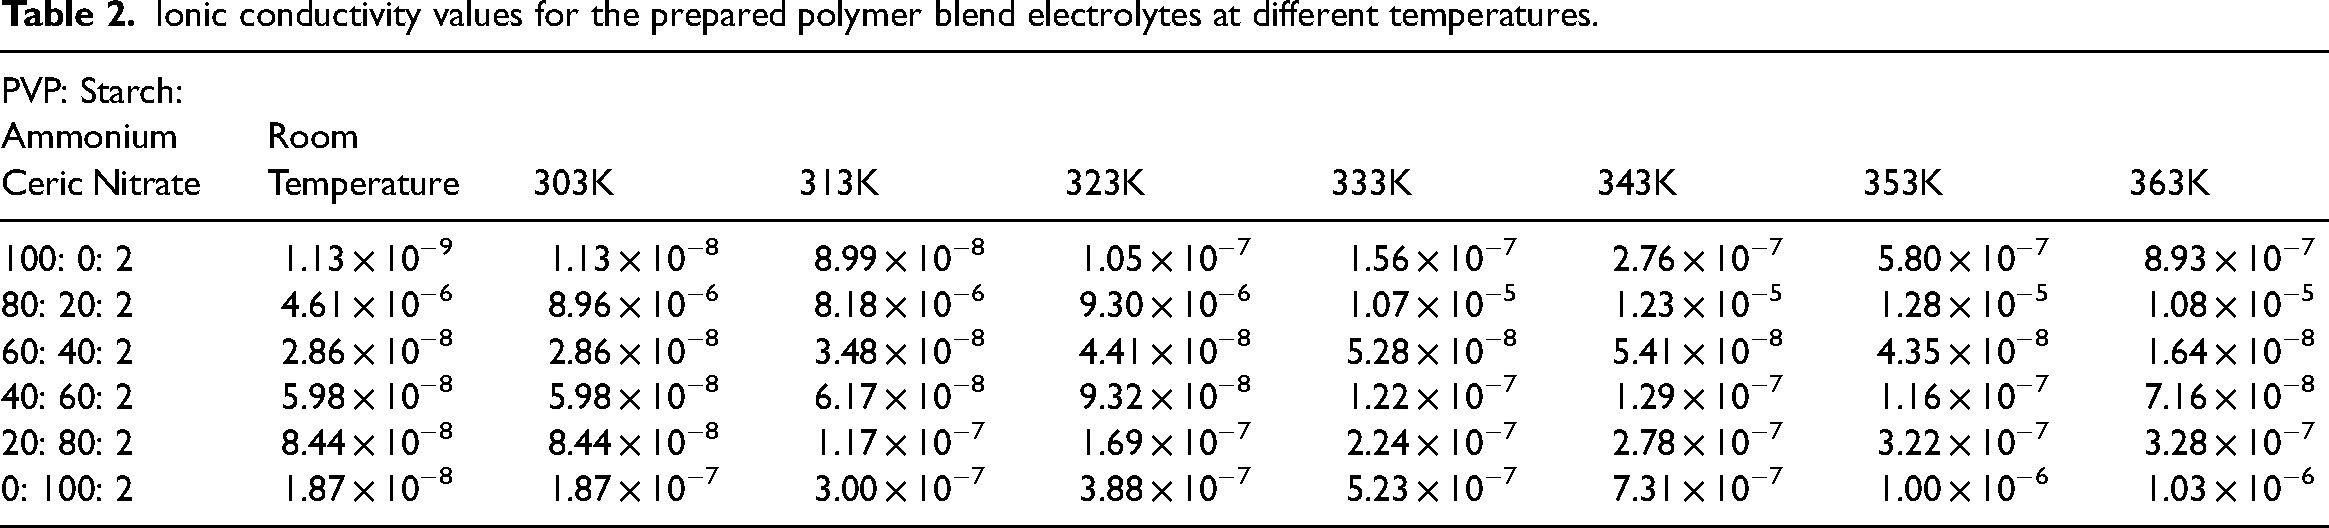
has already reported that 2% of ammonium ceric nitrate gives better conductivity. The (80: 20: 2) blend electrolyte shows higher ionic conductivity with minimum bulk resistance. The bulk resistance values are calculated using z-view software and the conductivity of electrolytes at different temperatures are tabulated in Table 2. The ionic conductivity is calculated by using this formula
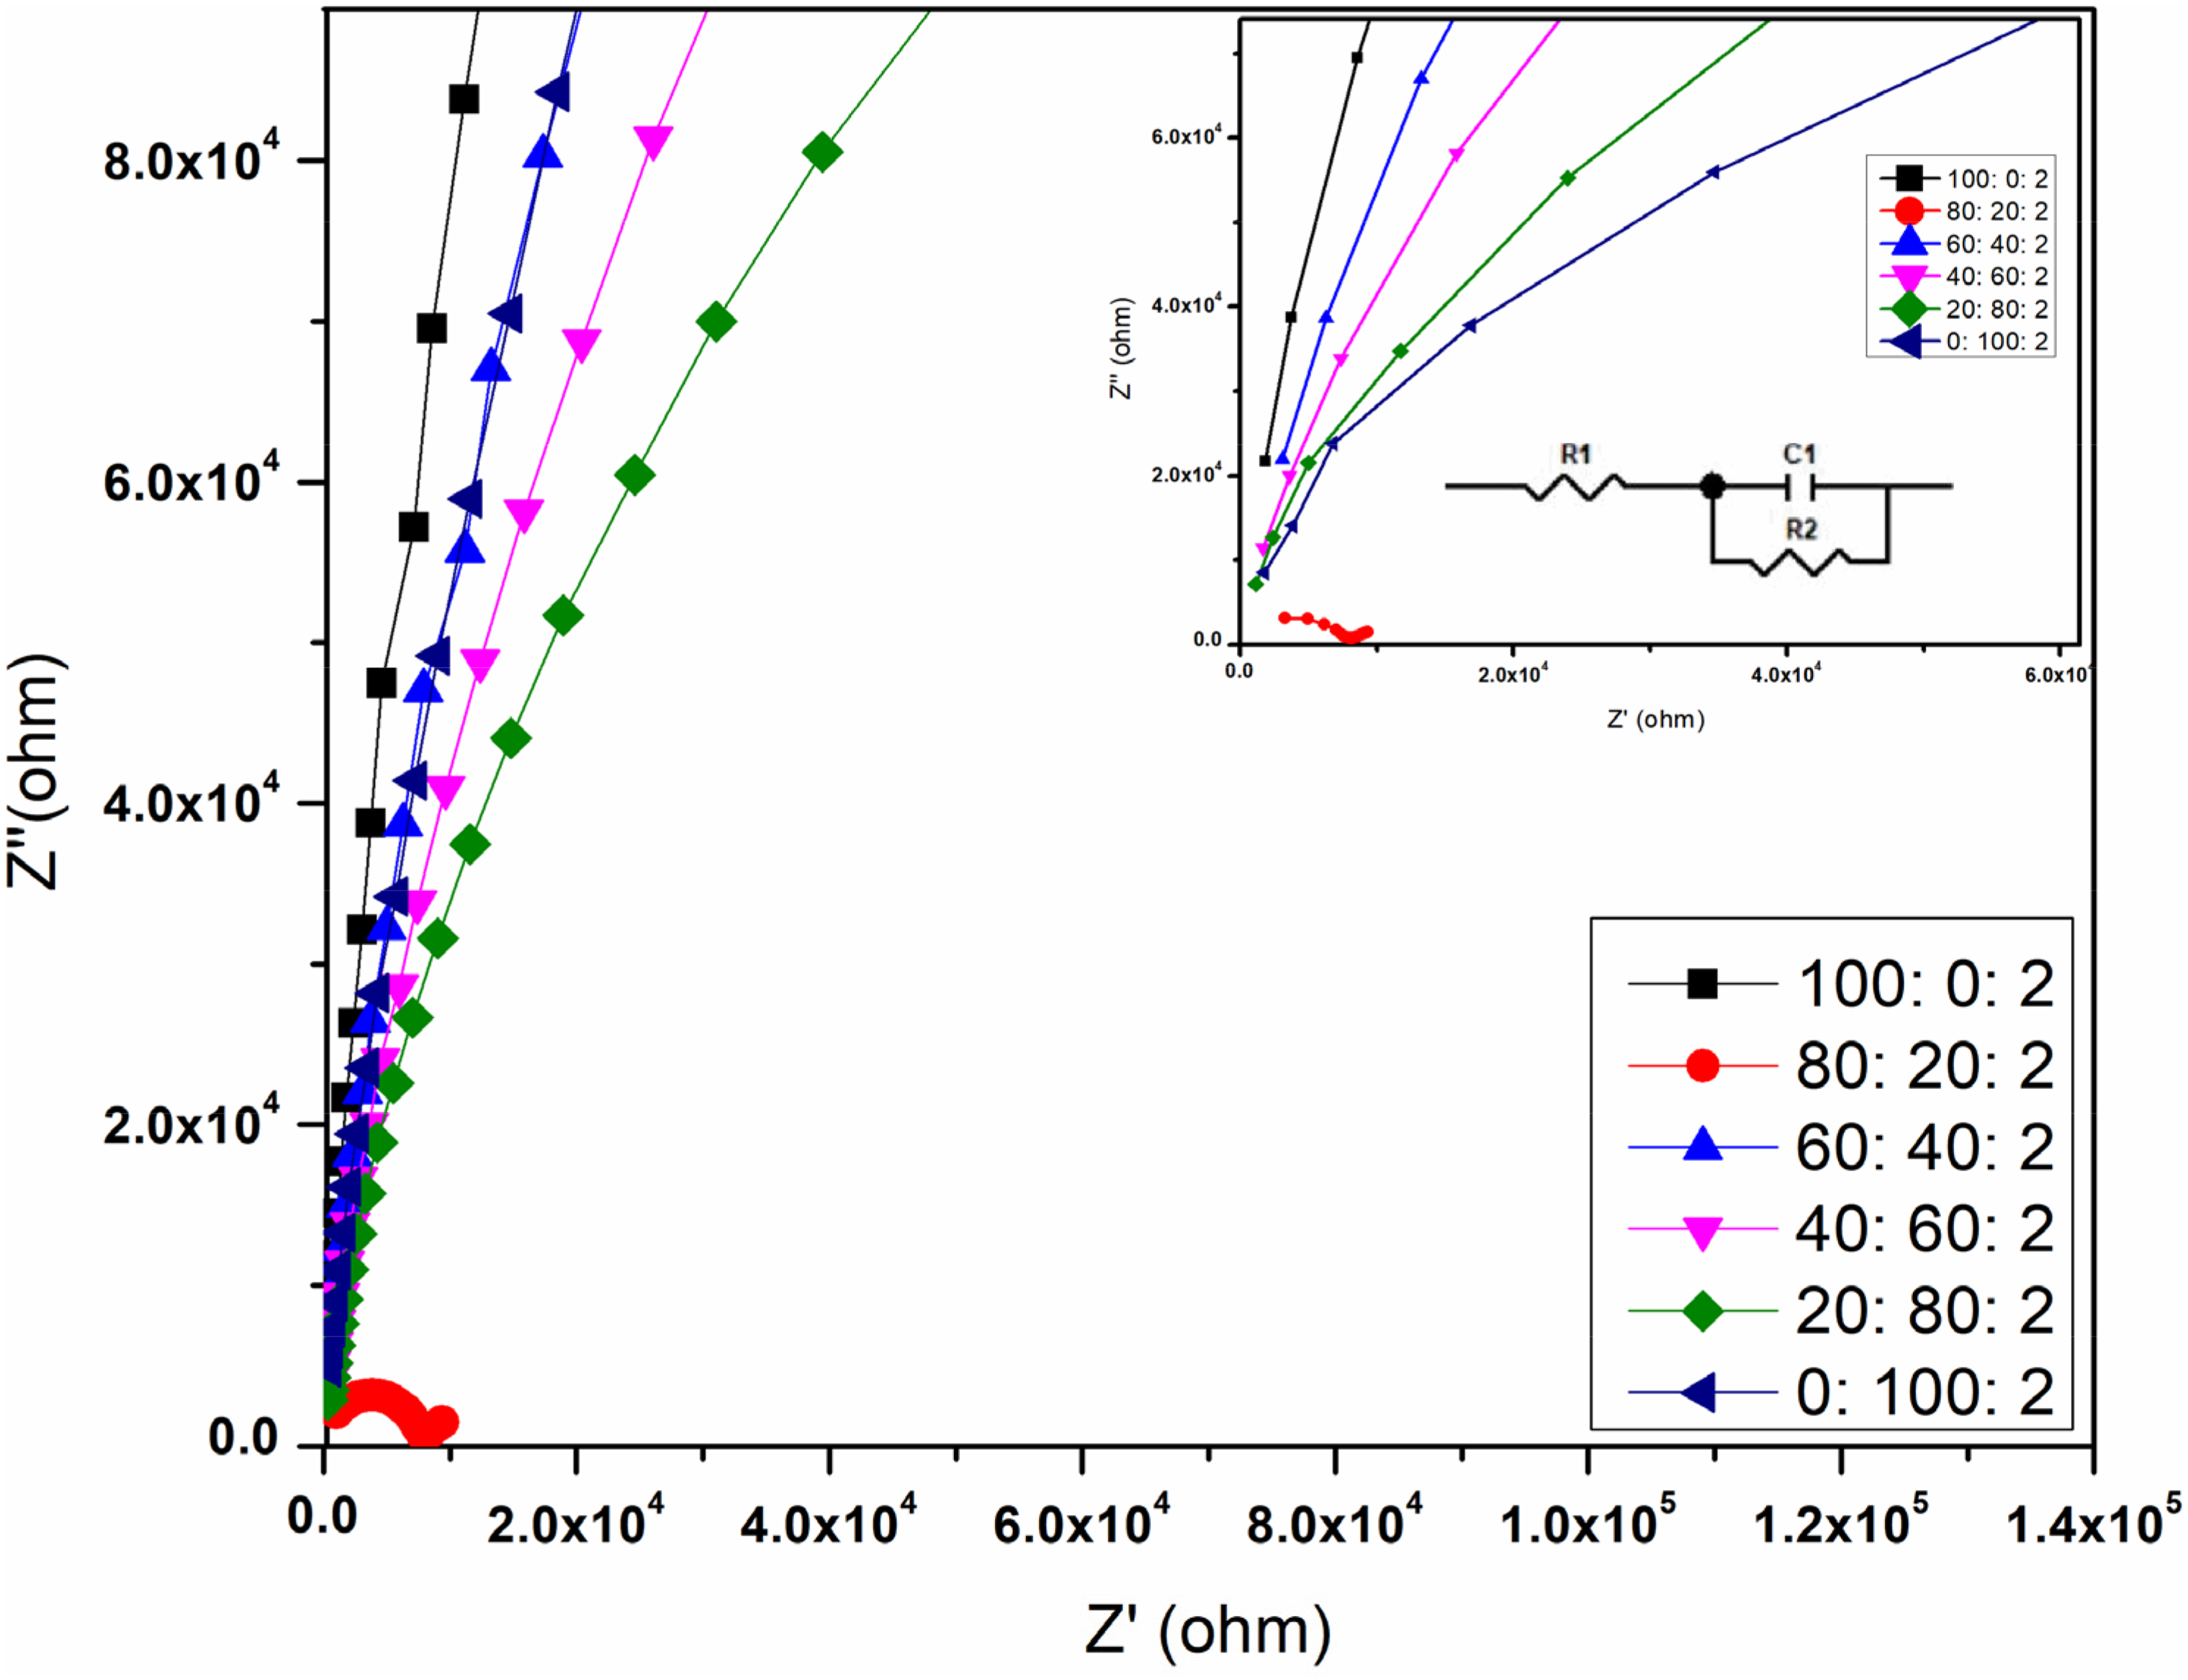
Nyquist plot for PVP/starch/ammonium ceric nitrate polymer blend electrolytes at room temperature.
Ionic conductivity values for the prepared polymer blend electrolytes at different temperatures.
Conductance spectra
The conductivity spectra reveal information regarding the characteristics, the nature of the conduction, and the hopping dynamics of charge carriers. It is plotted between logarithmic angular frequency with logarithmic conductivity of a material. 35 In the given images, there are two regions, the middle frequency plateau region which means frequency independent and produce conductivity with presence of hopping ions. The high frequency region is usually frequency dependent nature which means conductivity increases with frequency due to higher mobility of charge carriers in the electrolyte(80:20:2). By extrapolating the plateau region with Y-axis, conductivity values are calculated for the polymer electrolytes.28,36 These values are in good agreement with the values calculated from nyquist plot. The conductance spectra of prepared samples are given in Figure 4.
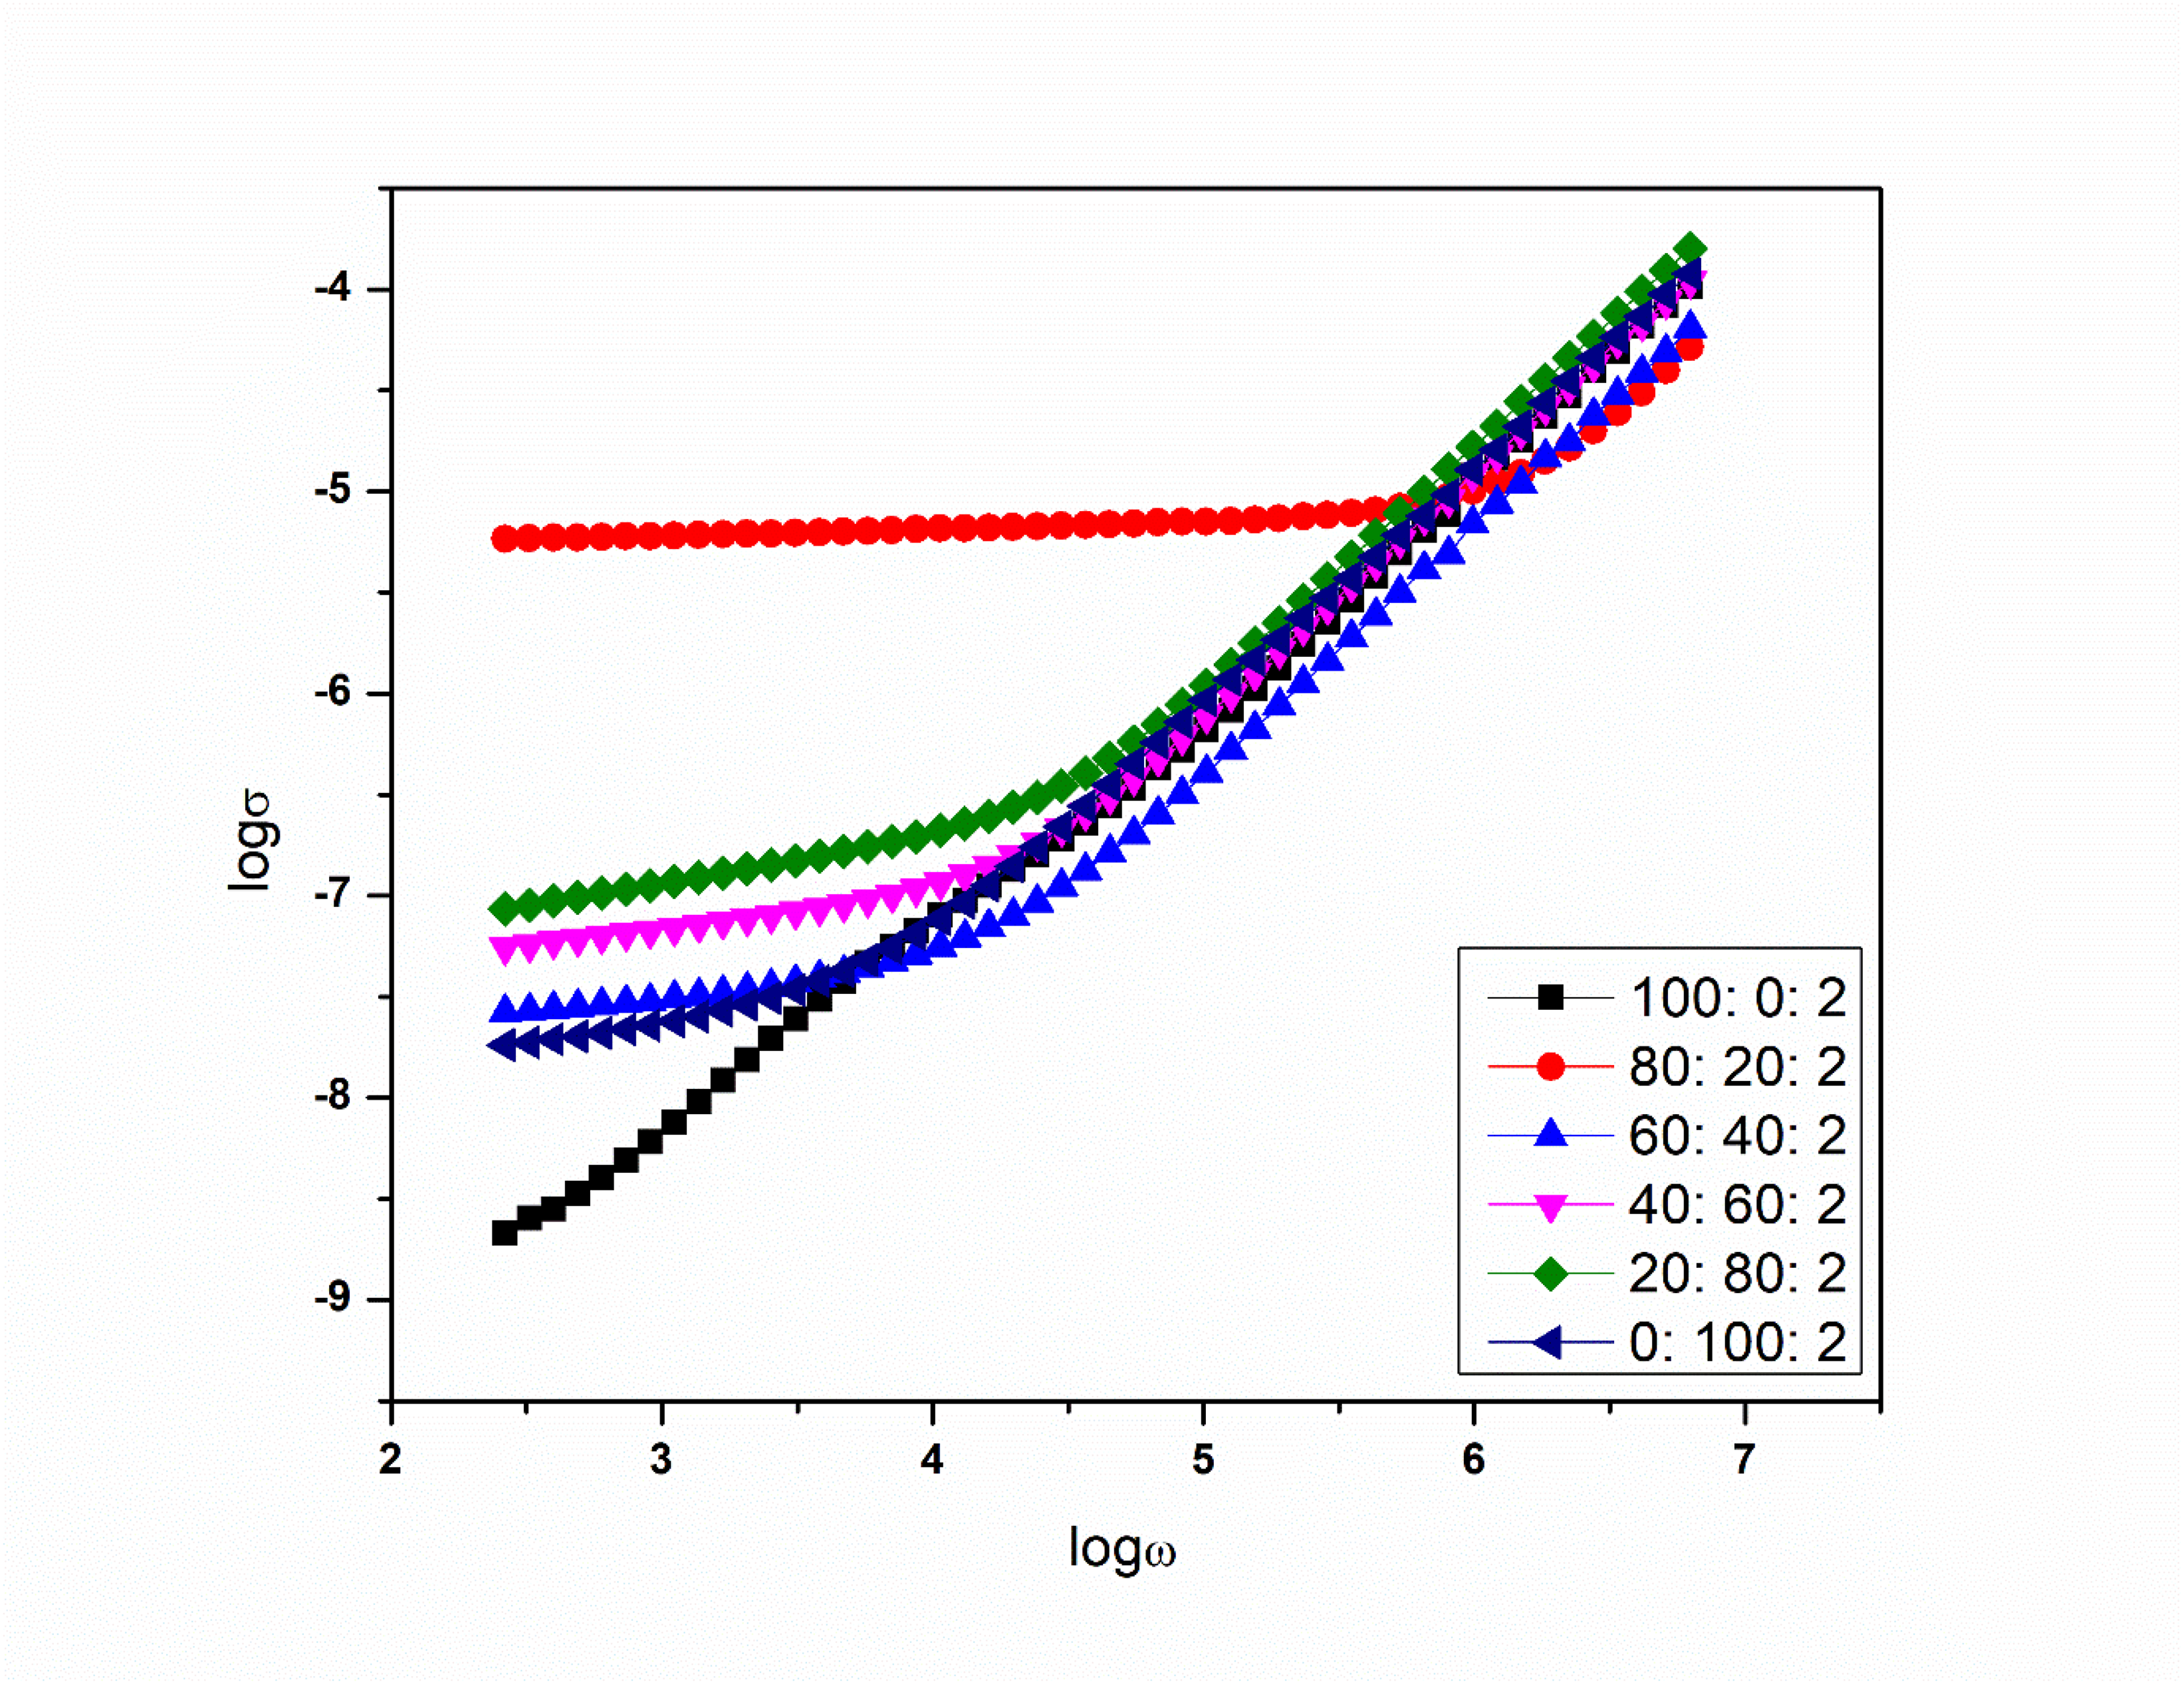
Conductance spectra of PVP/starch/ammonium ceric nitrate polymer blend electrolytes.
Dielectric constant analysis
The dielectric studies are used to observe the information of ions interaction or molecular relaxation behavior of ions and polarization between electrode-electrolyte interfaces.
37
In these studies, the charge storage is analyzed by dielectric constant and energy losses due to movements which indicates the parameters of ɛˊ and ɛ˝ of the electrolyte membrane.
38
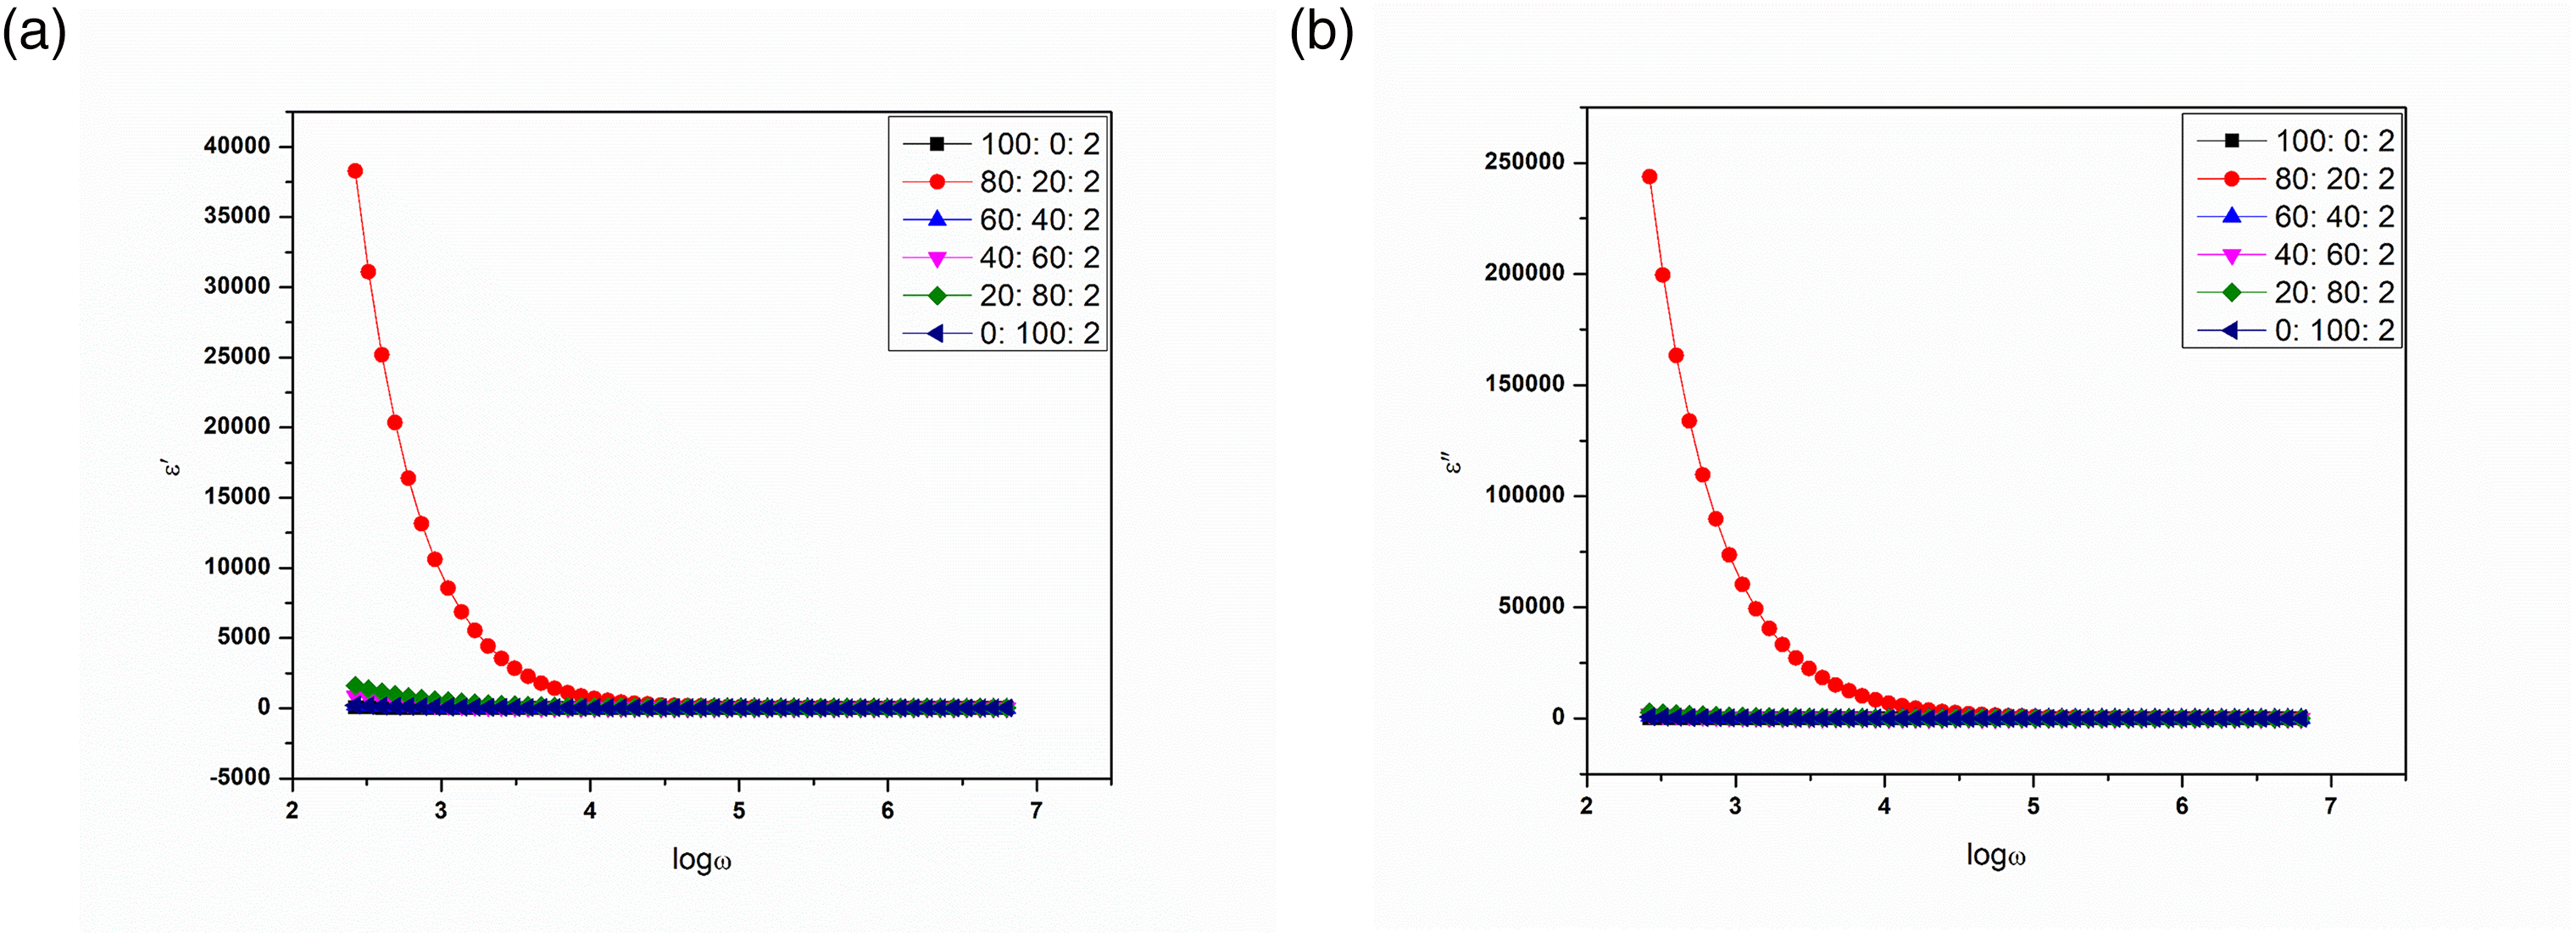
The addition of the salt in the polymer blend matrix enhances the dielectric constant and is directly linked to the number of free charge carriers. The high value of the dielectric constant at the low-frequency window is due to electrode polarization event which remains associated with the accumulation of the ions and evidence the complete dissociation of the salt. This nature also confirms the non-Debye dependence. The blocking electrodes prevent the ion migration to the external circuit, and this results in the accumulation of ions on the opposite electrodes, termed as polarization. Also in the low-frequency window, the ion pairs remain in the immobilize state which hinders the long-range motion and results in the high value of the dielectric constant due to sufficient time. Now, the high-frequency window the decrease of the dielectric constant is attributed to the dominance of the relaxation process. Here, the rapid change in the direction of the field makes ions incapable of responding to the applied field due to lack of inadequate time for rotation/translation of dipoles. So, now due to insufficient time ions are unable to accumulate at the electrodes and dielectric permittivity decreases. The dielectric constant and losses of prepared electrolytes are shown in Figure 5(a) and (b). The dielectric permittivity of the prepared polymer electrolyte is calculated by
(a) Dielectric constant graph of PVP/starch/ammonium ceric nitrate polymer electrolytes. (b) Dielectric loss graph of PVP/starch/ammonium ceric nitrate polymer electrolytes.
Where, ɛ denotes the dielectric permittivity of the electrolyte, ɛ ′ is the real part dielectric constant may deposited the energy and ɛ ″ is the imaginary part of dielectric loss occurs in ions migration. 39 Dielectric constant is used to observe the charge accumulation of ions in polymer electrolyte. 13 The non – debye nature of the polymer electrolytes depend upon the charge carrier and migration of ions due to presence of broad relaxation peaks. 24 Figure 5(a). shows the high dielectric constant at low frequency for (80: 20: 2) polymer electrolyte compared to other ratio because of increase in ion dissociation and decrease in ion combination, it increases the conductivity value. So that dielectric values are higher at low frequency due to electrode polarization 40 and the conductivity of this film is also matching for this electrolyte.
Dielectric loss analysis
Figure 5(b) shows the dielectric loss of prepared PVP/cassava starch with 2% ammonium ceric nitrate. It represents the energy losses due to ions diffusion occurs in polymer electrolyte. As the polymer electrolyte system comprises of ion-ion and polymer-ion interaction which results in almost complete dissociation of the salt. So, ions are the active species which response to the applied external electric field. During the periodic reversal of the field, the polymer electrolyte system follows a three-step process before reversing the direction. In the first step just when the field direction changes, at that moment de-acceleration of the ions occurs. Then in the second step ion comes in the stationary position and stays for a nonzero time there. Finally, in the third step ion is again accelerated in the reverse direction. The three-step process results in the heating of the dielectric polymeric system and this internal heat is called dielectric loss. The value of the dielectric loss approaches to zero for the zero relaxation time (ɛ″ = 0 for ωτ = 0). At higher frequencies, due to fast periodic reversal of the applied electric field, the dielectric loss is decreased because of no charge accumulations at the electrode interfaces. 34 The maximum dielectric loss of prepared sample was observed for (80: 20:02) system that agrees with the conductivity studies. 25
Tangent spectra analysis
Tangent spectra define the amount of energy lost (ɛ˝) to the amount of energy stored (ɛˊ) in an electrolyte. This is used to find relaxation time measured by dielectric energy dissipation factor.
15
The loss tangent (tan δ) is the ratio of imaginary part of permittivity to the real part of permittivity or ratio of energy loss to energy stored. Initially, the increase in the loss with an increase in the frequency is observed and the maxima at the particular frequency (where ωτ = 1) is followed by the decrease in high frequency. This plot can be divided into the three regions for a better understanding of the variation of AC conductivity with frequency, First is a low-frequency region, second is moderate frequency region, and the third one is a high-frequency region. All graph shows a single relaxation peak which indicates ionic conduction in the present system. In the low-frequency region increase of the loss associated with the dominance of the Ohmic component than the capacitive element. While the presence of the maxima is observed only at a single frequency when the perfect matching between the frequency of electric field and frequency of molecule rotation occurs. This resonance leads to the maximum power transfer to the dipoles in the system and hence the maximum heat . Now, in the high-frequency window, the capacitive component becomes dominant. Here, the Ohmic part becomes frequency independent, while the capacitive part grows with the frequency. Now, the effect of salt concentration is investigated. It is noticeable from the figure that the relaxation peak shifts toward the high-frequency side which indicates the faster ion dynamics from one coordinating site to another due to a decrease of relaxation time. To verify the above said results and calculation of relaxation time the fitting of the tangent delta plot was performed with the equation proposed by the Debye. The tangent spectra of prepared blend electrolytes are shown in Figure 6 and it is calculated using,
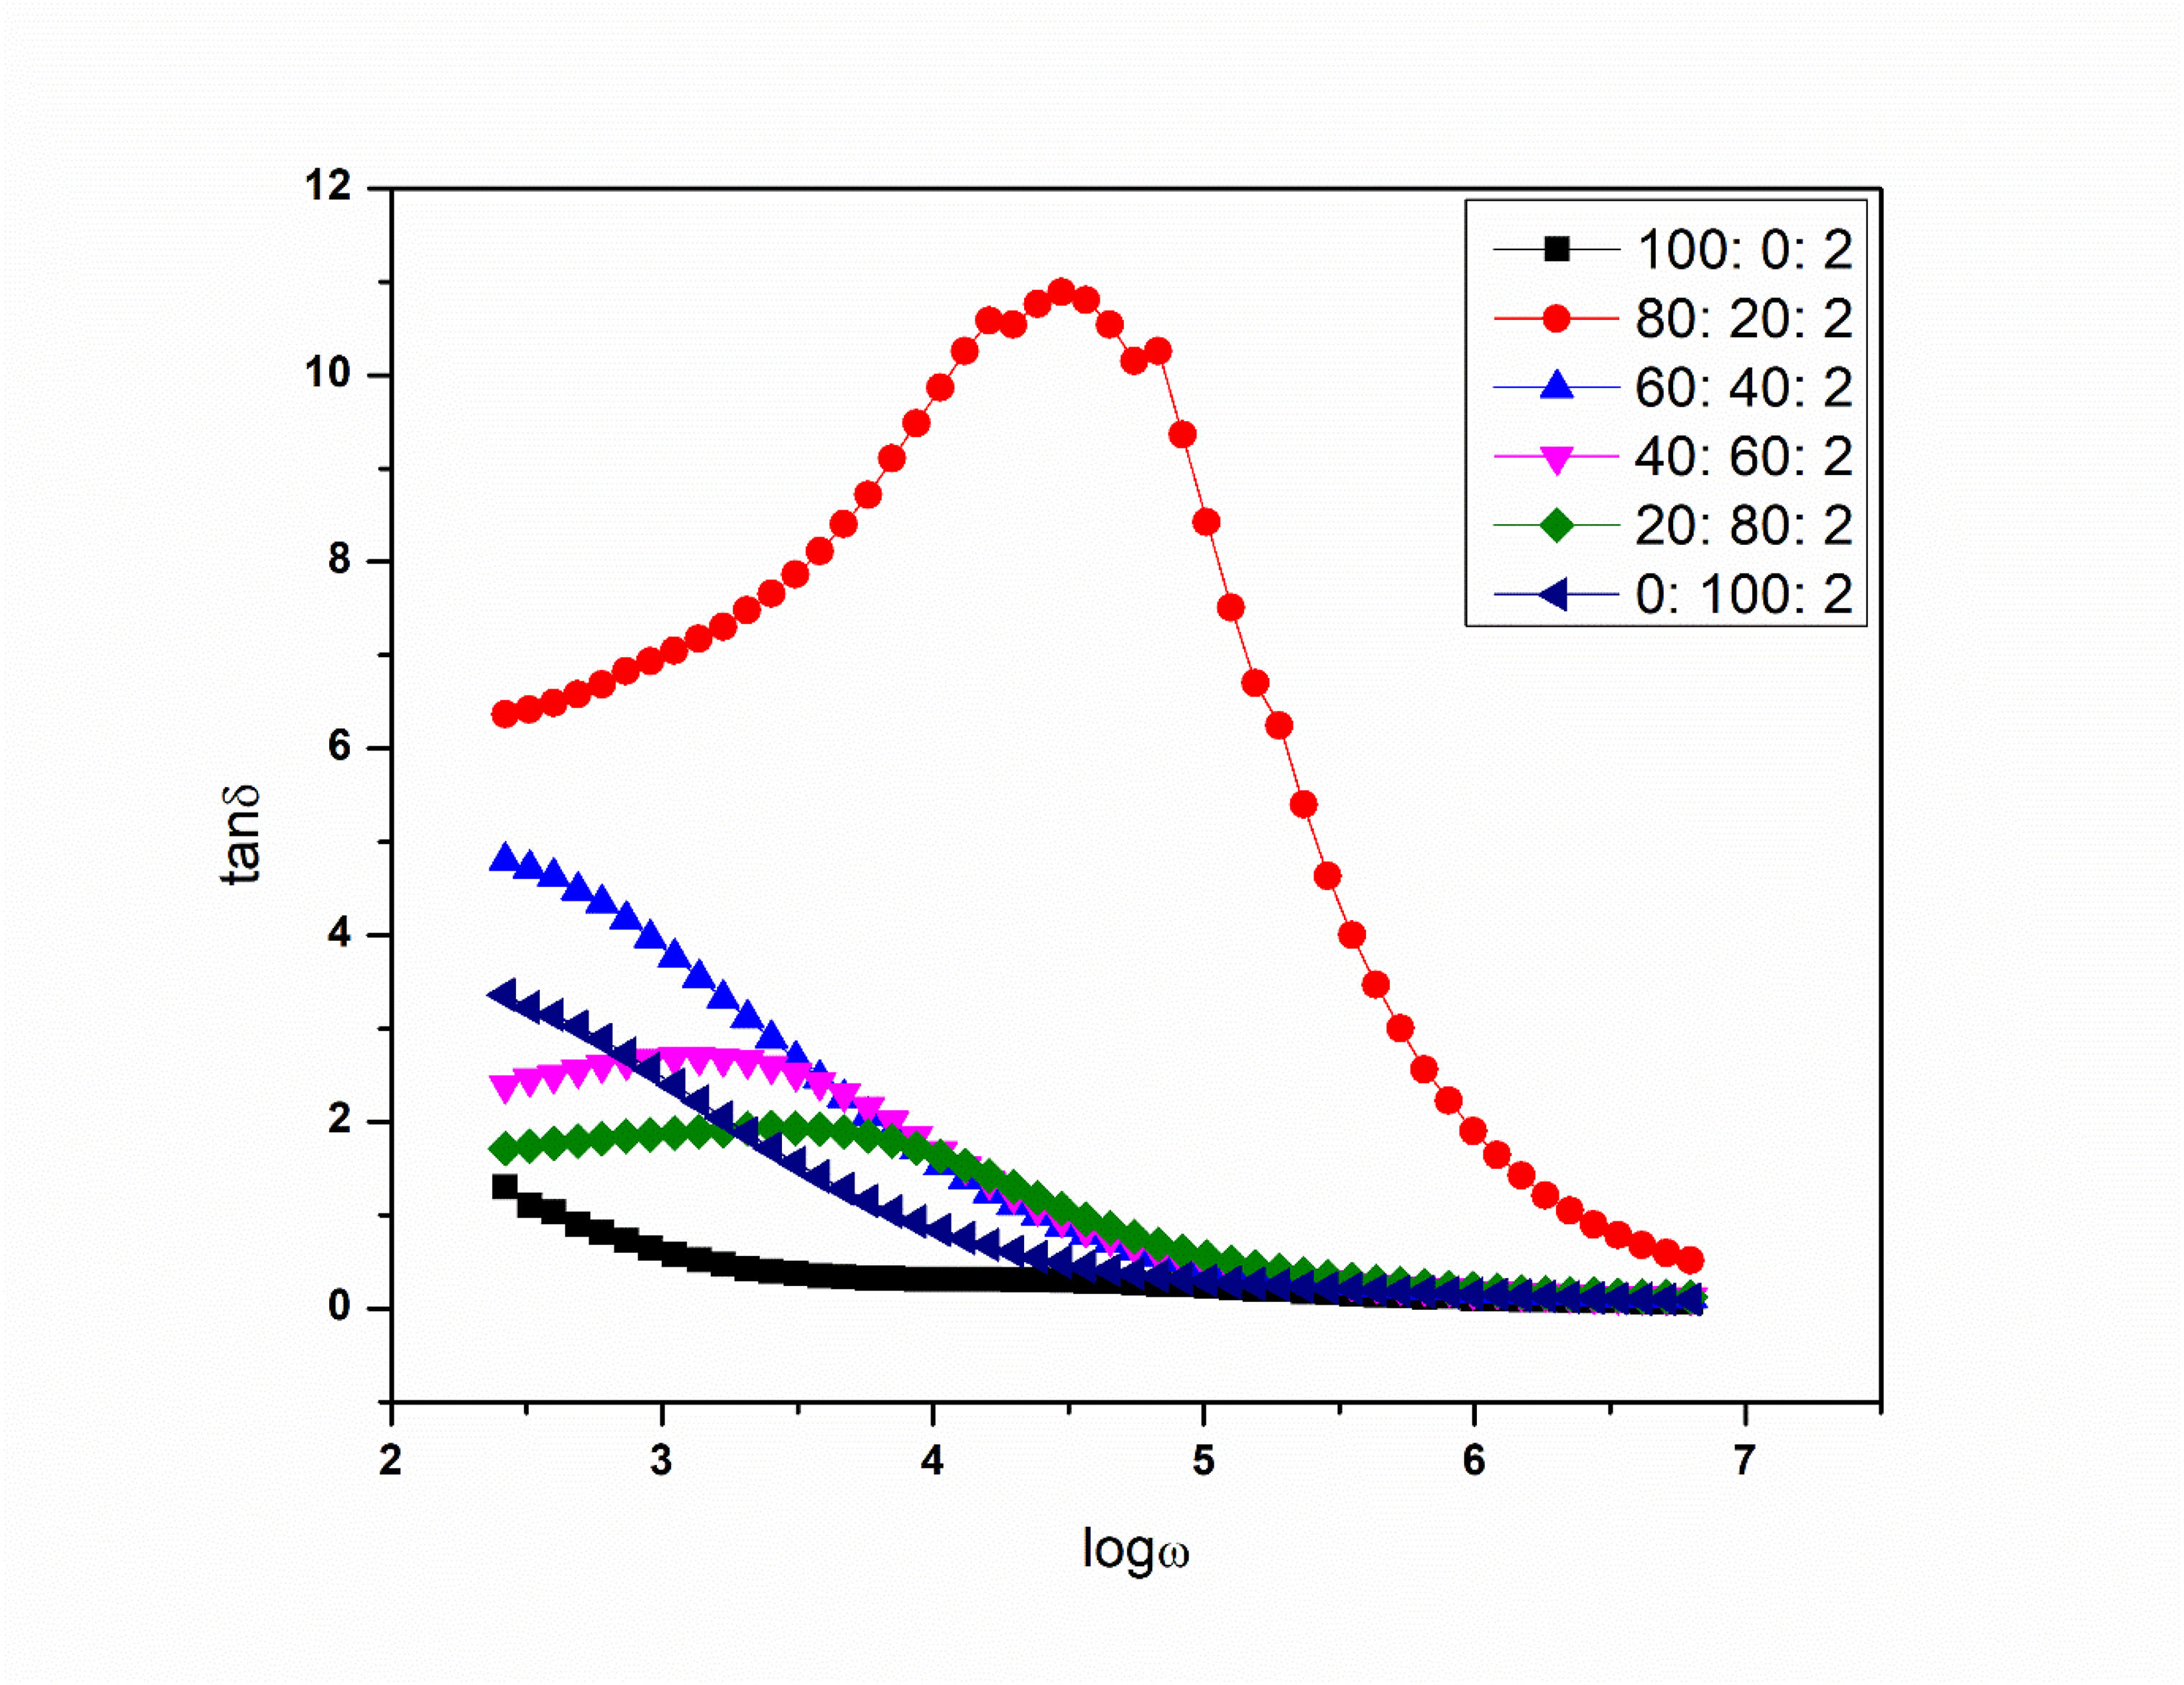
Tangent spectra of PVP/starch/ammonium ceric nitrate polymer electrolytes.
The tangent loss peak using dielectric loss was described by the equation ω τ = 1 where, ω is the angular frequency and τ is the relaxation time.41,42 Generally, the hump occurs due to frequency dependent when the high frequency peak shifted towards the addition of salt concentration. At high frequency the applied field is high, it denotes the increase of mobile ions which decreases the relaxation time that implies the non-debye nature of the samples at high conductive electrolyte. 43 In present work intensity hump appears at high conducting electrolyte for (80:20:2) which expose the same result at XRD that shows amorphous nature of the material.
Modulus spectra analysis
The important role of this modulus studies expose the absence of space charge polarization at electrode interfaces and relaxation time depends on conductivity of the electrolyte. 44 The modulus spectra investigated by the impedance plot of real (M′) and imaginary part(M″) for prepared high conducting polymer electrolyte at different temperature. Because of the bulk effect, the modulus value steadily increases with increasing frequency for all prepared SPEs compositions. The appearance of longer tails in the low frequency region demonstrates the presence of a significant capacitance associated with the electrode. This phenomenon implies that non-Debye nature exists in SPEs.
This type of electrical modulus can be calculated by

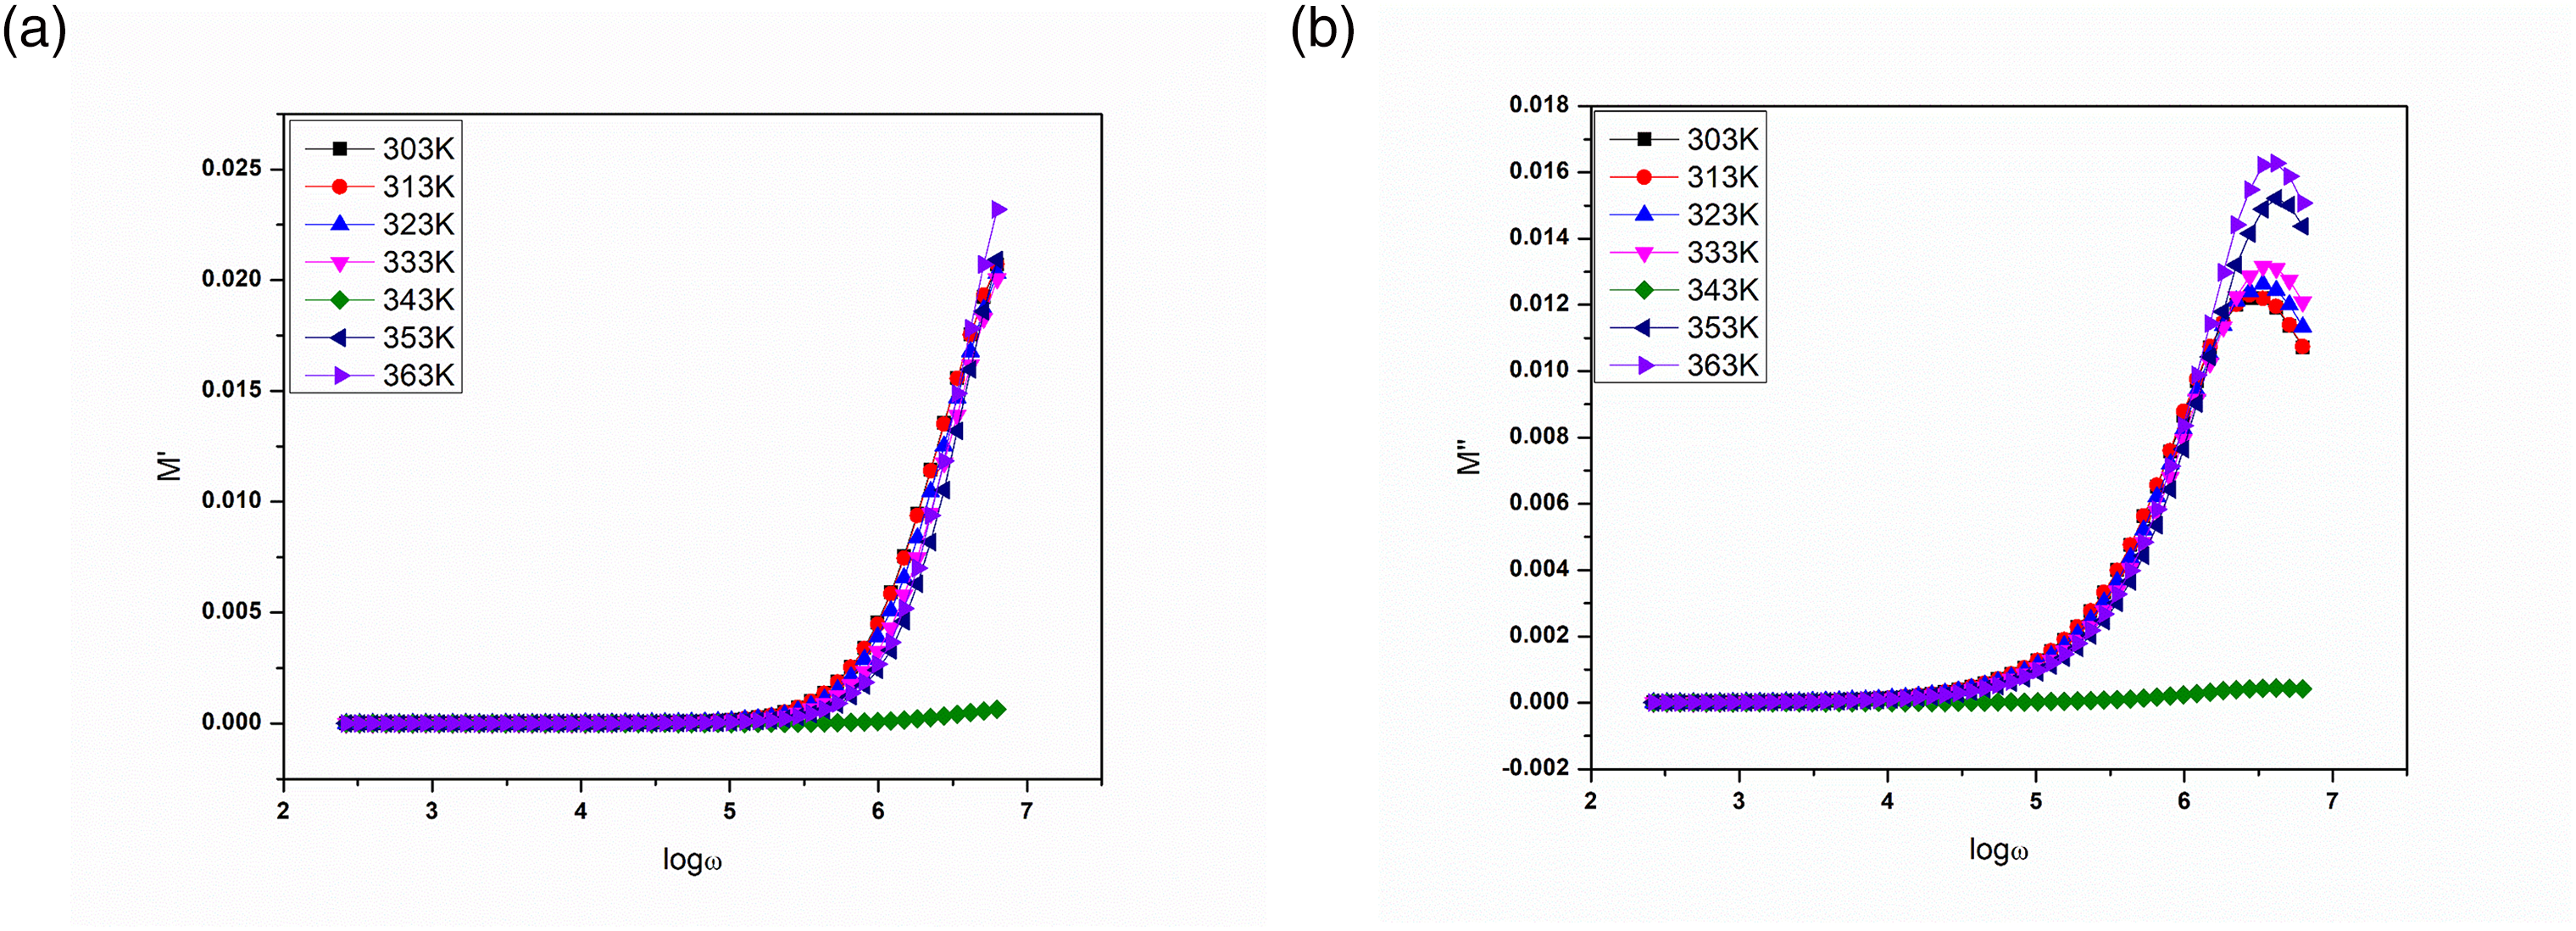
(a) Real part of Modulus spectra (M') of PVP/starch/ammonium ceric nitrate (80:20:02) polymer electrolytes at temperatures. (b) Imaginary part of Modulus spectra (M″) of PVP/starch/ammonium ceric nitrate (80:20:02) polymer electrolytes at temperatures.
Electrochemical studies
Cyclic voltammetry studies
Cyclic voltammetry studies reveal the electrical capacitor behavior and it charge storage performance of an electrolyte material and it is limited in cathodic and anodic reactions. It provides some information about redox process, kinetics of electron transfer and adsorption process. The pseudo capacitor behavior of electrolyte was confirmed by oxidation and reduction process, it improves the charge storage at electrode electrolyte interface. 15 In present work, CV shows the closed loop at different scan rate with electrochemical potential window at range of −1 to + 1V and the loop expose the pseudo capacitor behavior of the polymer blend electrolyte. The scan rate starts from 25mV – 100mV and it reflect increase of surface area at low scan rate and decrease area at high scan rate.49,24 The cyclic voltammetry of high conducting electrolyte shows better electrochemical performance and the graph is shown in Figure 8.
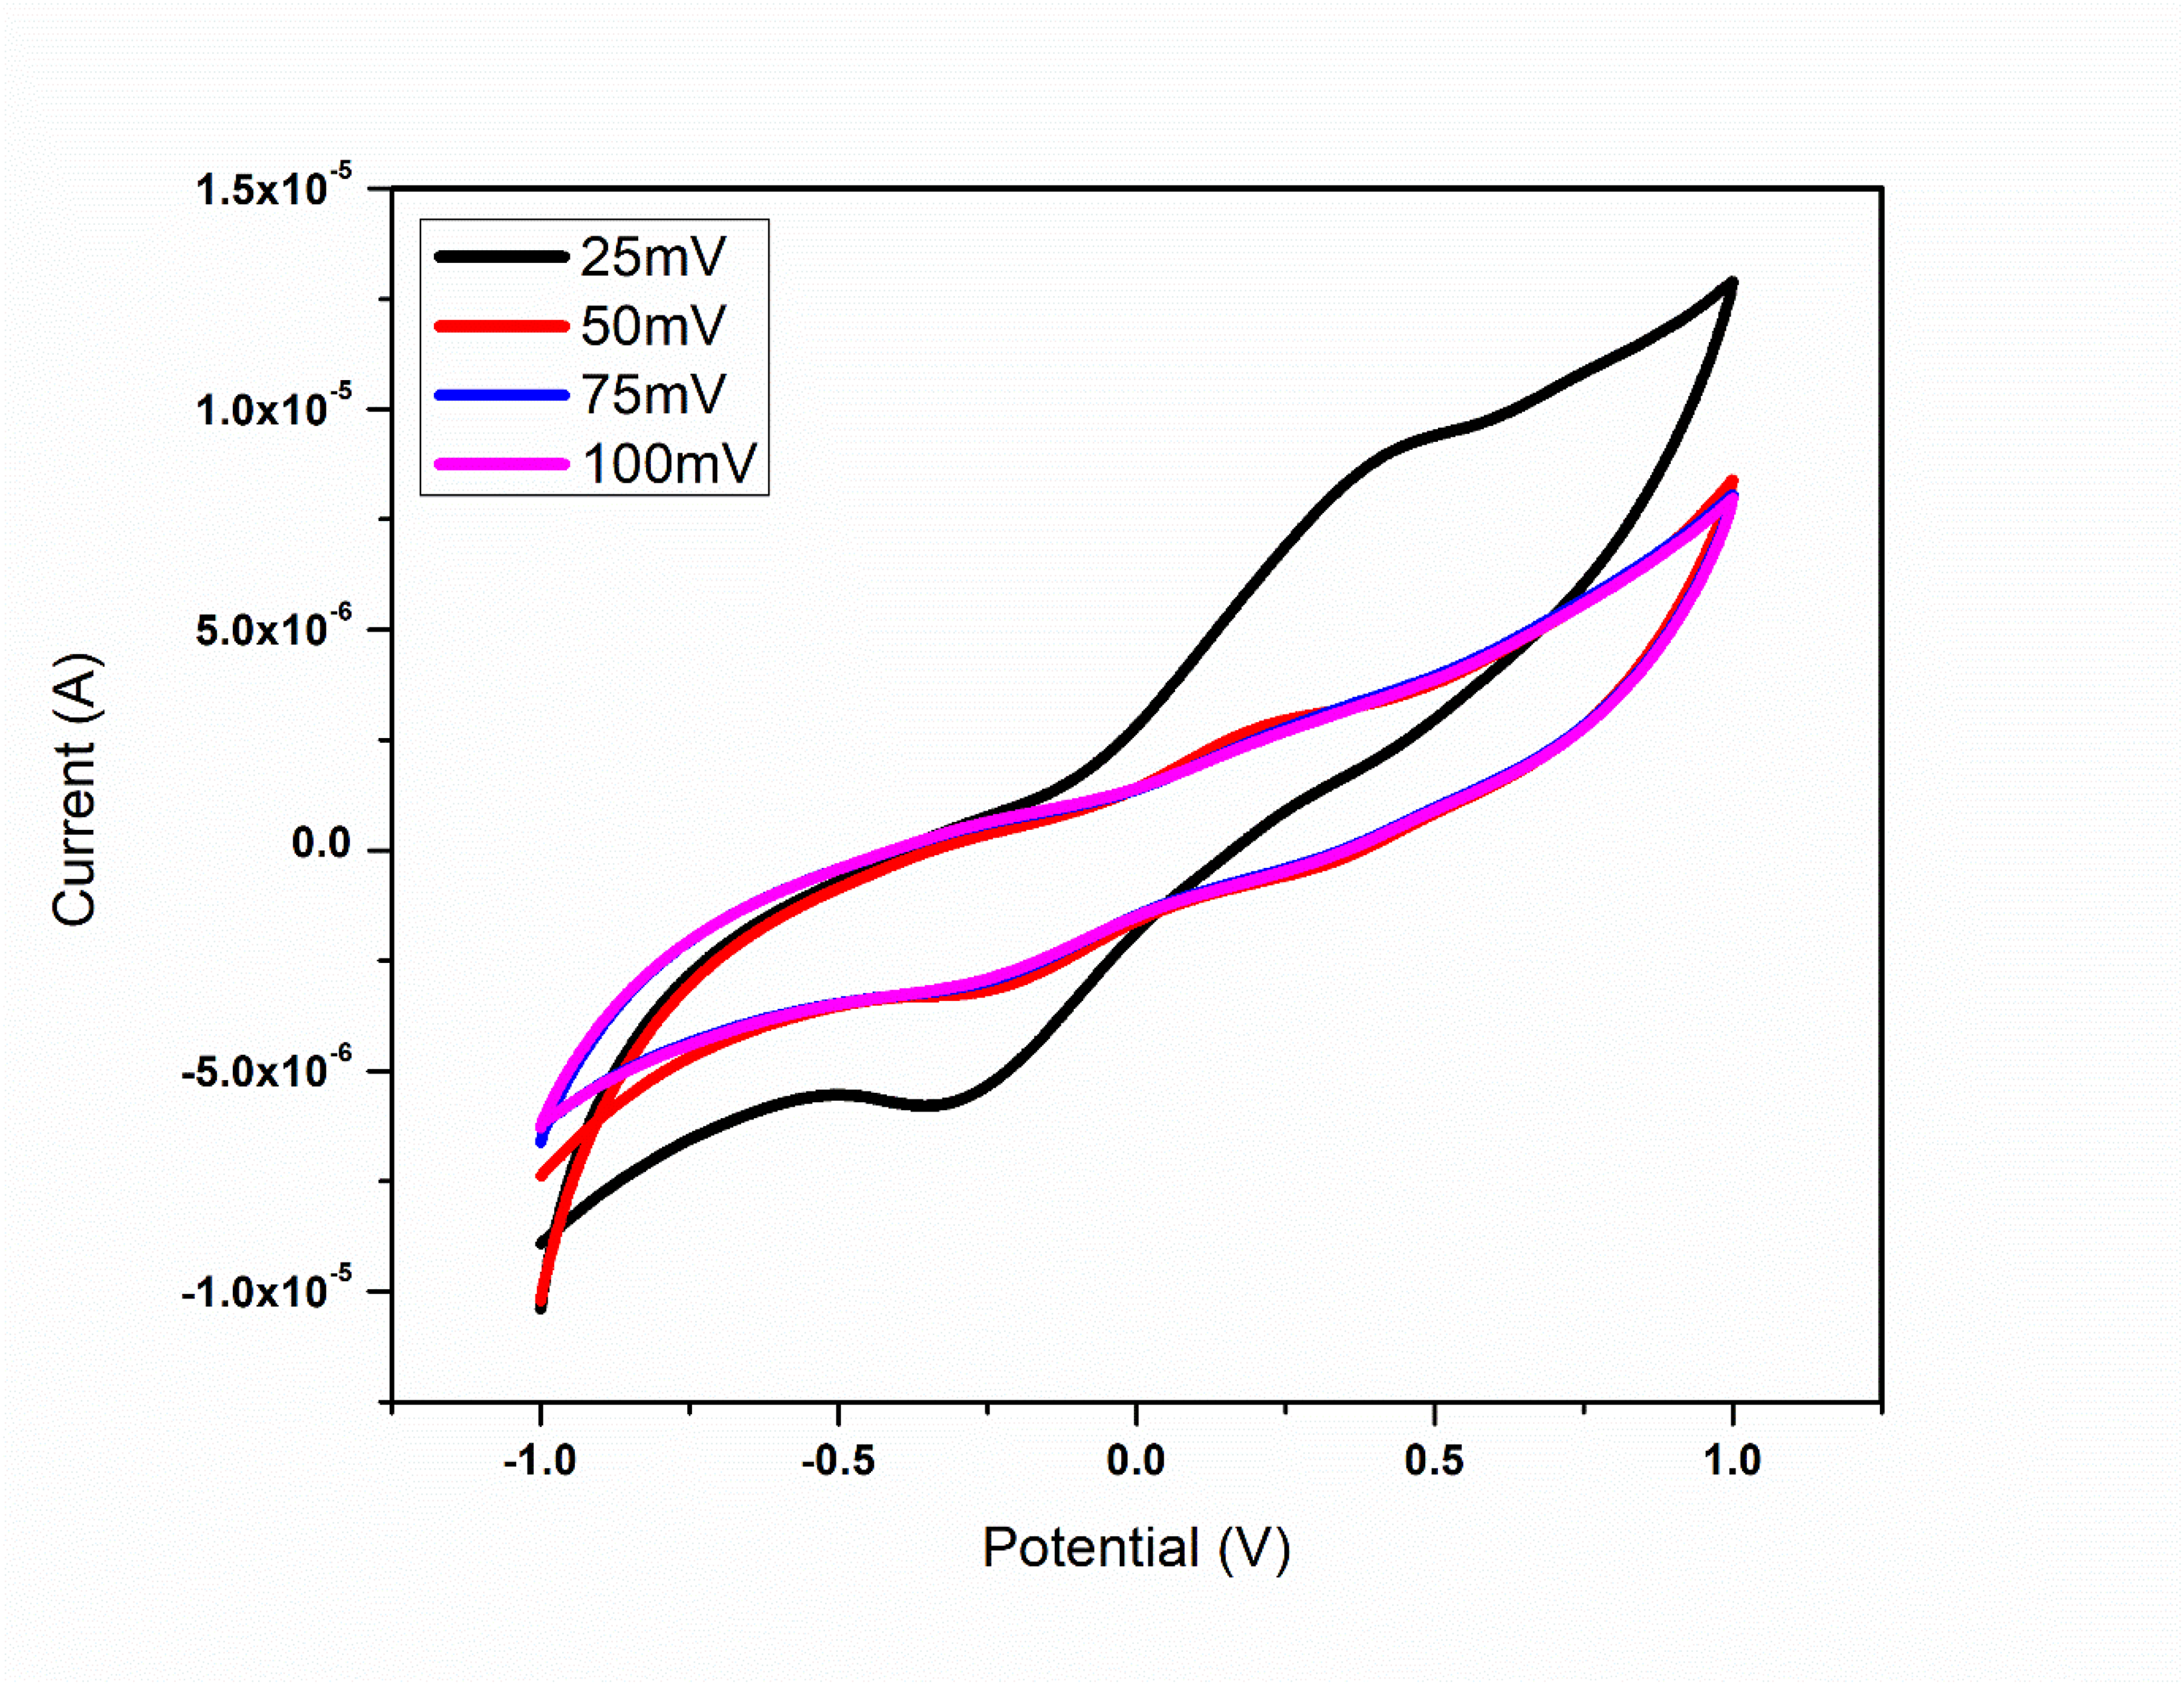
Cyclic voltammetry curve for PVP/starch/ammonium ceric nitrate polymer electrolytes.
Linear sweep voltammetry studies
The polymer electrolyte's working potential range and electrochemical stability are critical criteria to ascertain before it must be used in electrochemical devices. LSV analysis is used to determine the electrochemical potential window of the prepared polymer electrolyte.5,50 LSV reveal the decomposition voltage of high conductive electrolyte of 80% PVP: 20% cassava starch: 2% salt. 25 The electrolyte has no peaks within the operating voltage and the current increases due to electrode-electrolyte interface after a particular voltage. This study is carried out with different scan rate for the high conductive electrolyte. The linear sweep voltammetry of blend electrolyte is given in Figure 9. This result reflects the average voltage behavior of the electrolyte which is useful for electrochemical device fabrication. 24
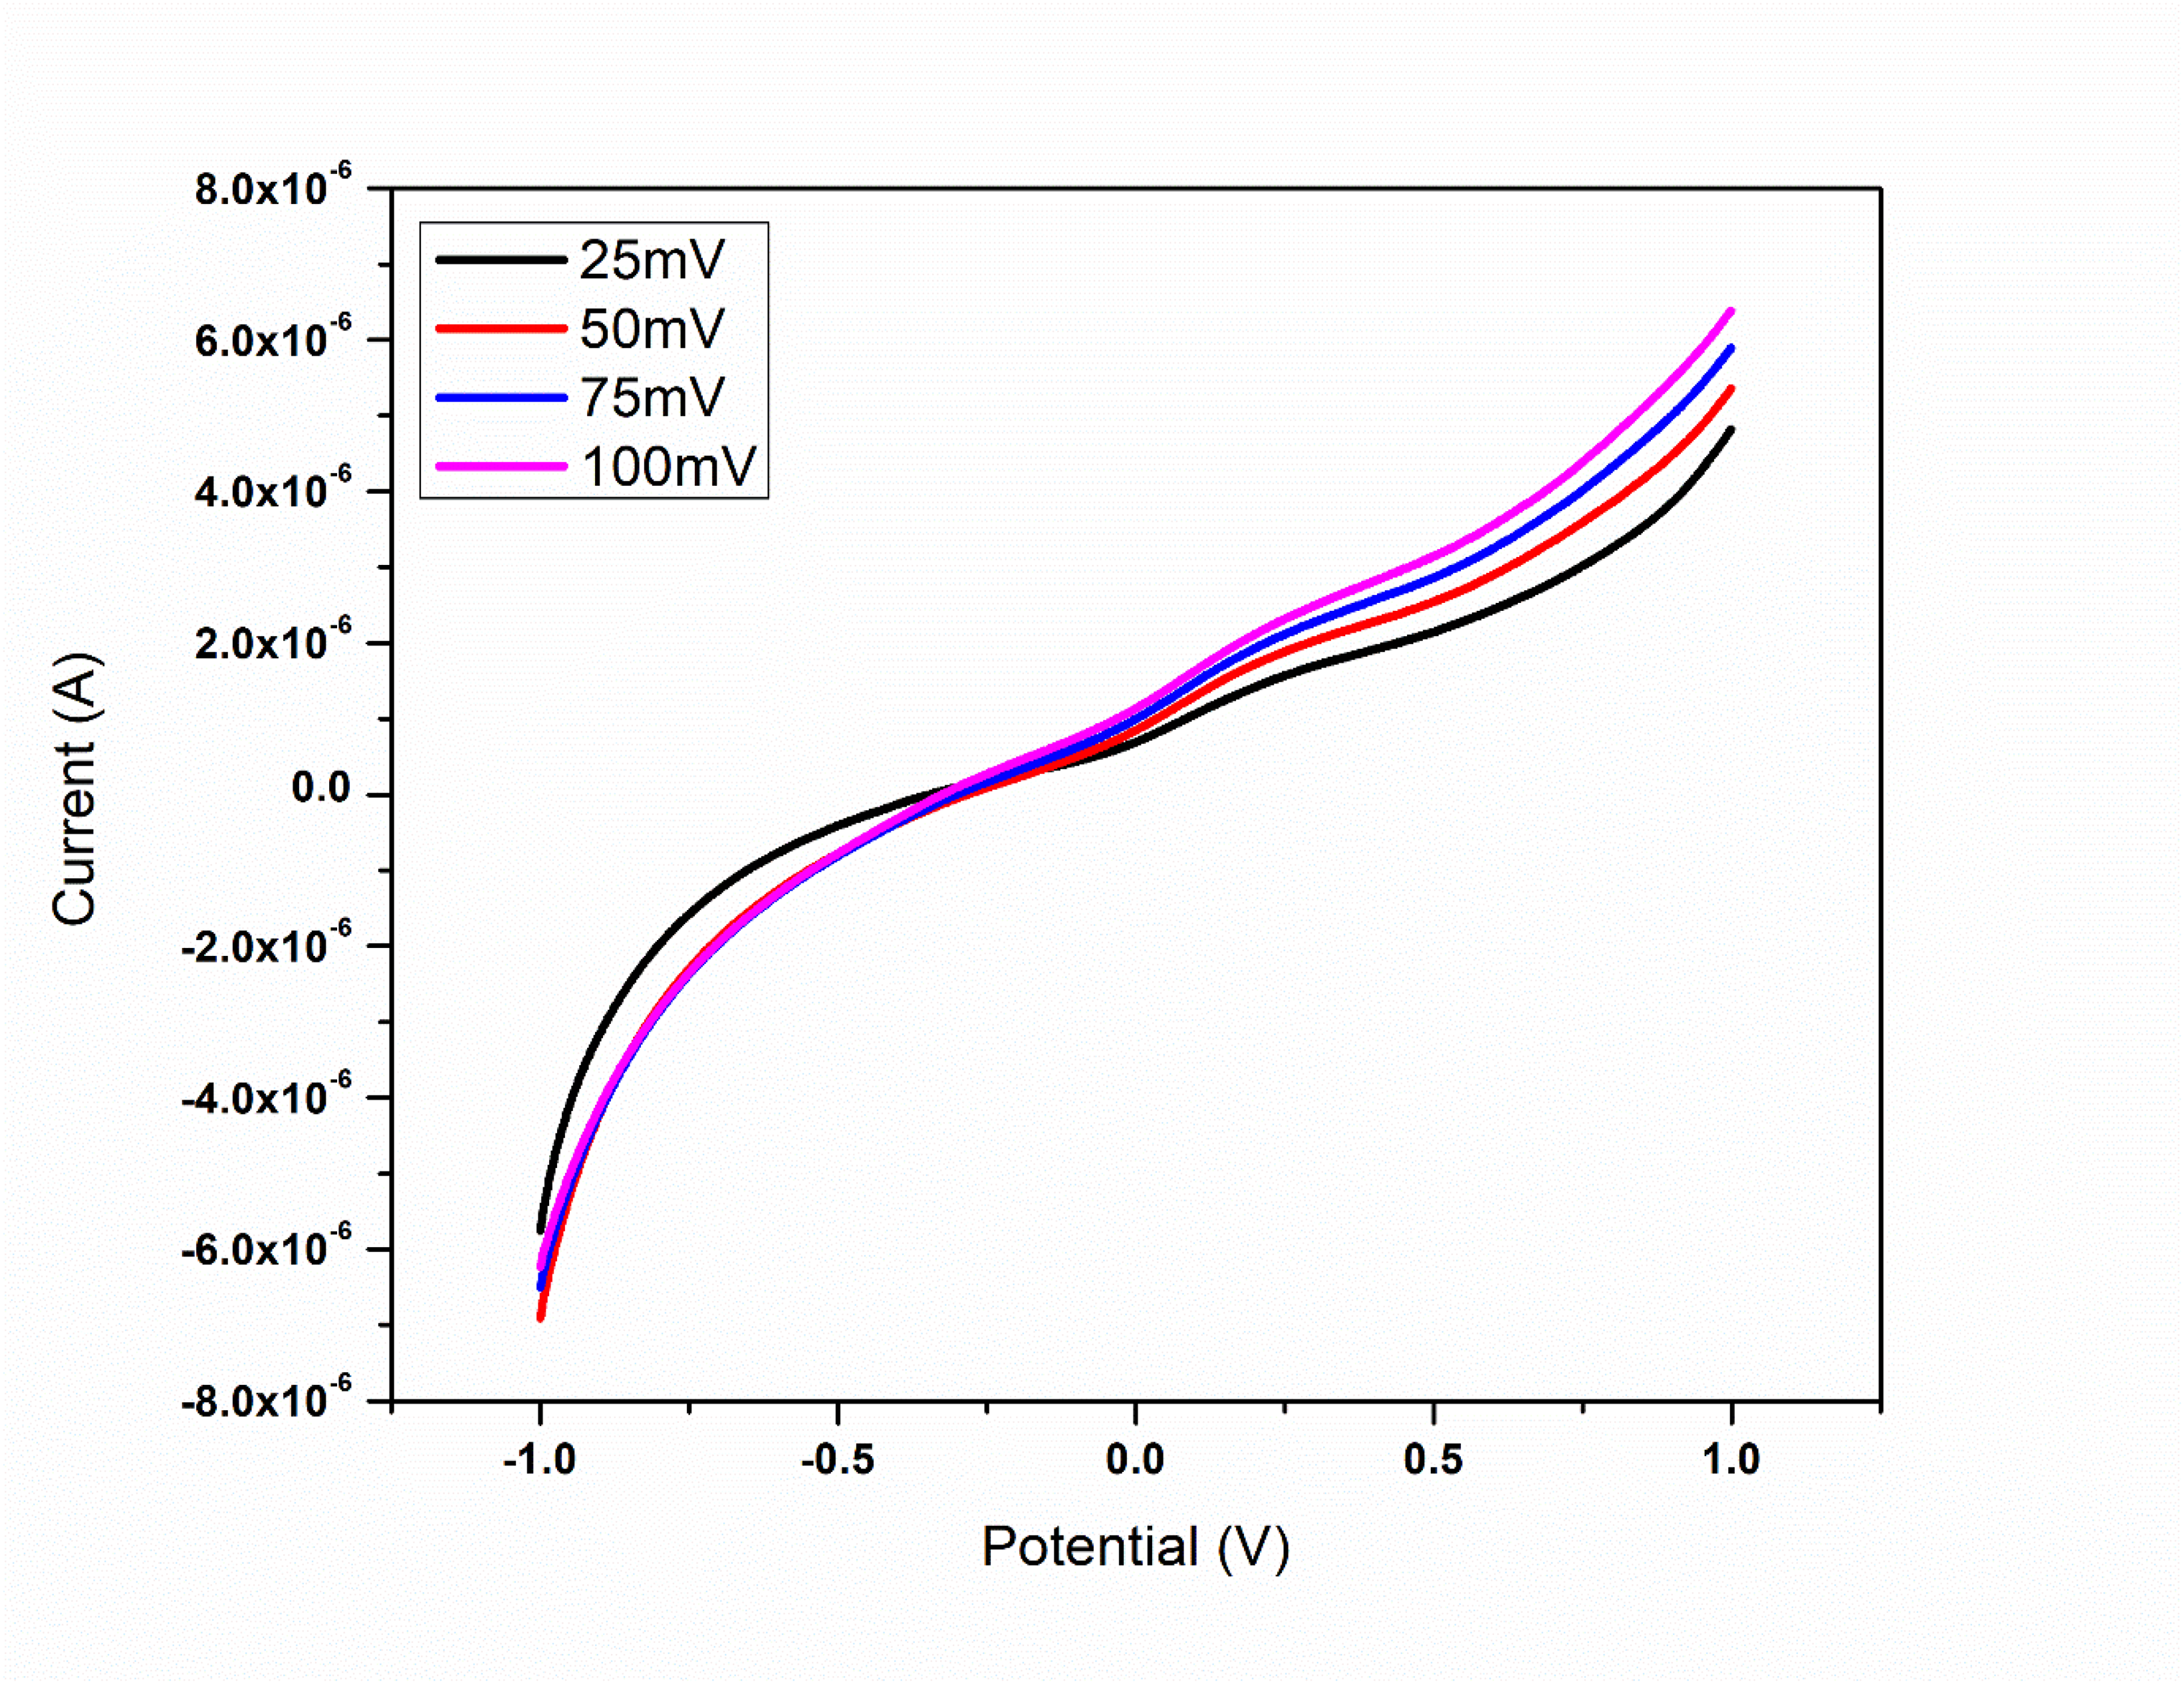
Shows Linear Sweep voltammetry curve for PVP/starch/ammonium ceric nitrate polymer electrolytes.
Conclusion
The solid blend polymer electrolytes are prepared using PVP/Starch with constant ammonium ceric nitrate by solution casting technique. The prepared samples are characterized with different techniques. XRD confirms the increase in amorphous nature of the electrolyte (80:20:02) ratio due to the addition of biopolymer. The complex formation and vibrational modes of blend polymer systems are analyzed by FTIR. The maximum ionic conductivity value of 8.96 × 10⁻⁶ S/cm is observed for 80%PVP/20%Starch system at room temperature. Above 20wt% of biopolymer starch, the conductivity decreases. The dielectric constant and dielectric loss results are in agreement with conductivity studies. The relaxation behavior of polymer electrolytes are confirmed by electric modulus studies. CV analysis shows pseudo capacitor behavior of the polymer electrolyte due to the oxidation and reduction peaks. LSV analysis confirms the suitable operating voltage between the electrode electrolyte interfaces of the electrolyte. Thus it is concluded that addition of particular amount of biopolymer with synthetic polymer enhances the properties of polymer electrolytes which are suitable of energy storage devices.
Footnotes
Declaration of conflicting interests
The authors declared no potential conflicts of interest with respect to the research, authorship, and/or publication of this article.
Funding
The author(s) received no financial support for the research, authorship, and/or publication of this article.