
Abstract
China is a major energy consumer, however, related empirical research on China's unequal energy consumption is very limited. Therefore, according to the data from 30 provinces and cities, this study aims to establish a simulation model to analyse the Gini coefficient (the Lorenz curve) of China's energy consumption, and identify the main factors affecting the Gini coefficient through dynamic scenario analysis. During the simulation cycle (from 2022 to 2081), the average Gini coefficient of energy consumption fluctuates between 0.30 and 0.41, which indicates the inequality is slightly high. But the maximum value fluctuation ranges from 0.40 to 0.50, which indicates the inequality is high. The author also found that three factors—technological level, government subsidies, and growth rate of energy supply—can significantly affect the Gini coefficient of energy consumption. It is necessary to promote the technological level, increase subsidies for energy production, and promote the growth of total energy supply to significantly reduce inequity in energy consumption.
Introduction
The energy sector is facing transformations related to climate change, security of supply, and consumption inequality.1–3 Energy consumption inequality is defined using the Gini coefficient of energy consumption. The Gini coefficient is defined based on the Lorenz curve, which plots the proportion of the total energy consumption of 30 provinces in mainland China that is cumulatively consumed by the bottom percentage of the provinces. Energy consumption inequality is directly related to energy poverty and justice, which has emerged as an interdisciplinary science research field. Energy poverty is mainly manifested in the affordability of household energy, the availability of energy services, the cleanliness of energy use, and the completeness of energy management. 4 However, energy justice pursues fairness and justice in the entire energy system and the energy transition system. It requires everyone to be treated fairly, with respect, and qualified for substantial participation in the energy system, including transparency, sustainability, intergenerational fair, and responsibility. 5
Successful energy policymaking can provide all citizens with access to safe, affordable, and sustainable energy. Severe inequities in energy consumption can lead to many adverse effects. For example, increasing inequality in energy consumption worsens the cooperative relationship among local governments in China, which is not conducive to the country's overall economic growth. 6 However, some researchers7–9 believed that inequality harmed growth through political economic channels or constraints on human capital accumulation. The probability distribution of global per capita energy consumption was studied using data from the U.S. Energy Information from 1980 to 2010. It was found that the Lorenz curve rose during this period, and the Gini coefficient decreased from 0.66 in 1980 to 0.55 in 2010, which indicates a reduction in inequality. 10 Economic growth is generally accompanied by an increase in energy consumption in developing countries,11–12 particularly countries with large amounts of energy consumption such as China.13,15 However, China shows regional inequality in its economic development—eastern China has higher gross domestic product, while western China has a lower gross domestic product. Thus, there also exists inequality between the different regions regarding energy consumption, which corresponds to this imbalance in economic development. 15 The eastern region consumes significant amounts of energy, while the western region, where a large amount of energy is produced, consumes lesser.16–18 For example, according to the energy data from the China Statistics Bureau in 2018, the national solar power generation that amounted to 83.02 billion kWh is mainly concentrated in the western regions, Qinghai, Inner Mongolia, Xinjiang, and Gansu. Meanwhile, the country's hydropower consumption is mainly concentrated in the southwestern region, with 278.57 billion kWh in Sichuan and 231.97 billion kWh in Yunnan. However, in the eastern region, Shanghai's power consumption in 2018 was 156.666 billion kWh, Jiangsu's was 612.827 billion kWh, and 453.282 billion kWh. These data show that China's energy consumption has typical multi-factor, such as the differences in size and economic structure, and complex system characteristics,19,20 thus, multi-agent modelling and simulation methods can effectively study this field. However, the Gini coefficient of China's energy consumption will be increased? What are the main influencing factors? Research on these issues can inform the creation of effective energy policies.
It is worth noting, as the following literature analysis shows, that the inequity of energy consumption in China has only been studied to a limited extent. Moreover, there is no research that predicts and analyses the Gini coefficient of China's energy consumption and identifies the main influencing factors. Therefore, setting various policy portfolio scenarios, and identifying the main influencing factors, this study explores the issues to address the research gaps, which are also the contributions of the study.
The present research has two main objectives including (1) establishing a simulation model to analyse the Gini coefficient of China's energy consumption; (2) identifying the main factors affecting the Gini coefficient through dynamic scenario analysis. The research design of this study is based on the previous research and theory to build a simulation model. And then, during the simulation process of the computer programme, the Gini coefficient of energy consumption in China is dynamically predicted. Meanwhile, the key influencing factors are also identified. Finally, based on these conclusions, policies are proposed. Therefore, the rest of this study is divided into literature review and hypotheses, research methods, results and discussions, conclusions and policy recommendations.
Literature review and hypotheses
Energy consumption involves multiple heterogeneous agents. 21 Industrial structure, population, and investment in fixed assets can affect energy consumption.22,23 Meanwhile, regional energy planning and macroeconomic cycles also affect energy consumption.24,25 Many other studies have examined the inequity of energy consumption, and they can be divided into three streams.
First, there is an emerging body of literature tackling energy consumption inequality, which examines the inequity of energy consumption by individuals and the justice of energy consumption in countries and regions in a broad scope. 26 For example, Tovar Reaños and Lynch, 27 and Roberts 28 put forward the concept of “fuel poverty,” which indicates a lack of basic energy services. Meanwhile, Day et al. 29 proposed the definition of energy poverty based on the capabilities approach. However, energy consumption justice is a global energy system that fairly distributes both the benefits and burdens of energy services and contributes to more representative and inclusive energy decision making.30,31 Bouzarovski and Simcock 32 introduced the concept of spatial justice and inequality of energy poverty and vulnerability. Energy poverty causes serious public health concerns related to indoor air pollution, physical injury, lack of refrigeration, and lack of medical care.33,34 Therefore, Chapman et al. 35 proposed an evaluation framework for energy policymaking incorporating equity.
Second, there is a stream of research concerning the influencing factors of energy consumption inequality,
36
such as government subsidies. This includes subsidies for not only consumers but also energy producers.37,38 While Lin et al.
37
found that electricity price subsidies in China contribute to energy equity, Lin and Kuang,
39
and González
38
indicated that energy subsidies lead to inequalities. However, current proposals for social tariffs are found to be less effective than targeted compensation schemes.
40
Based on these existing studies, the author proposed the following hypothesis.
Many other factors can also affect this inequality, such as technological progress.41,42 In developing countries, improvements in technology have enabled more farmers to obtain stable energy.41,43 Therefore, the Gini coefficient of energy consumption can be reduced to a certain extent. According to the studies, the author proposed the following hypothesis.
It is interesting to note that different regions have different effects on energy consumption such as touristic regions.
44
Natural conditions in provinces and cities also affect energy consumption, regardless of whether energy is abundant.32,45 In the European Union, there exists the classic economic development distinction between the core and periphery in terms of energy poverty.
46
The spatial difference affects the consumption of energy.
47
Inspired by these studies, the author proposed the following hypothesis.
According to the findings of Liang and Zhang,
45
Bouzarovski and Simcock,
32
end-use demand can affect energy consumption. Other existing studies also found a relatively large level of inequality in energy resource consumption in different household categories.48,49 Based on these studies, the author put forward the following hypothesis.
Furthermore, existing studies have shown that there is a close relationship between energy supply and energy consumption.
50
The study of Wang et al.
51
supports the result. Meanwhile, it is interesting to note that a drop in renewable energy generation disparities is attributable to inequality components.
52
Inspired by these studies, the author proposed the following hypothesis.
Finally, previous studies have explored different methodologies including Zenga index.53,54 Meanwhile, Jacobson et al. 55 extended the application of Lorenz curves to energy consumption. Furthermore, the Atkinson index was used to calculate energy distribution,56,57 and the Theil index45,58 and a systems-thinking approach 59 were employed to calculate energy inequality.
This literature analysis shows that literature on the inequality of energy consumption in China is very limited. The conclusions of this research can enrich studies on energy consumption inequality, and promote energy justice.
Method
The agent-based model is mainly based on the theory of complex adaptive systems and uses multidisciplinary methods such as economics, systems science, and computer simulation. The outstanding advantage of this method is that it can simulate nonlinearity and heterogeneity, and can identify key factors in the dynamic simulation process, which has been successfully applied to many research fields. The modelling steps of this method usually start with the construction of a theoretical model and behaviour rules of agents (Model I), then building a simulation model (Model II).
Reasons for adopting the agent-based model
First, energy consumption is affected by a variety of factors showing typical characteristics of complex adaptive system. A large number of studies have shown that the use of multi-agent modelling and simulation models can effectively analyse this, especially the effective dissection of the heterogeneity of a single agent, 60 as well as the agent's interaction, learning and evolution of various factors. 61 Agents can interact with other agents directly or indirectly, and system-level phenomena emerge from agents’ traits. The adaptive traits affect their potential fitness, and they also learn from the factors and adjust their behaviours. Thus, it is very different from econometrics or Dynamic Stochastic General Equilibrium.
This method can identify the dominant factors among many influencing factors. Inequity in energy consumption is influenced by many factors, and there exist different factors for different countries. Moreover, the importance of these factors varies. However, as the model is based on multi-agent modelling, it can effectively simulate many factors and identify the dominant factors in the long-term evolution process. This method can effectively remedy the deficiencies caused by lack of empirical data. Energy data are very imperfect in China. Complete data on energy consumption, especially for the 1990s cannot be obtained from published energy data such as the China Statistical Yearbook and China Energy Statistical Yearbook. Lack of empirical data leads to insufficient long-term analysis of the Gini coefficient of China's energy consumption. The outstanding advantage of this model is that it does not need long time-series data. The long-term evolution trajectory can be obtained by inputting short-term data into the simulation model. This fits perfectly for long-term analysis of the Gini coefficient of China's energy consumption (Figure 1).
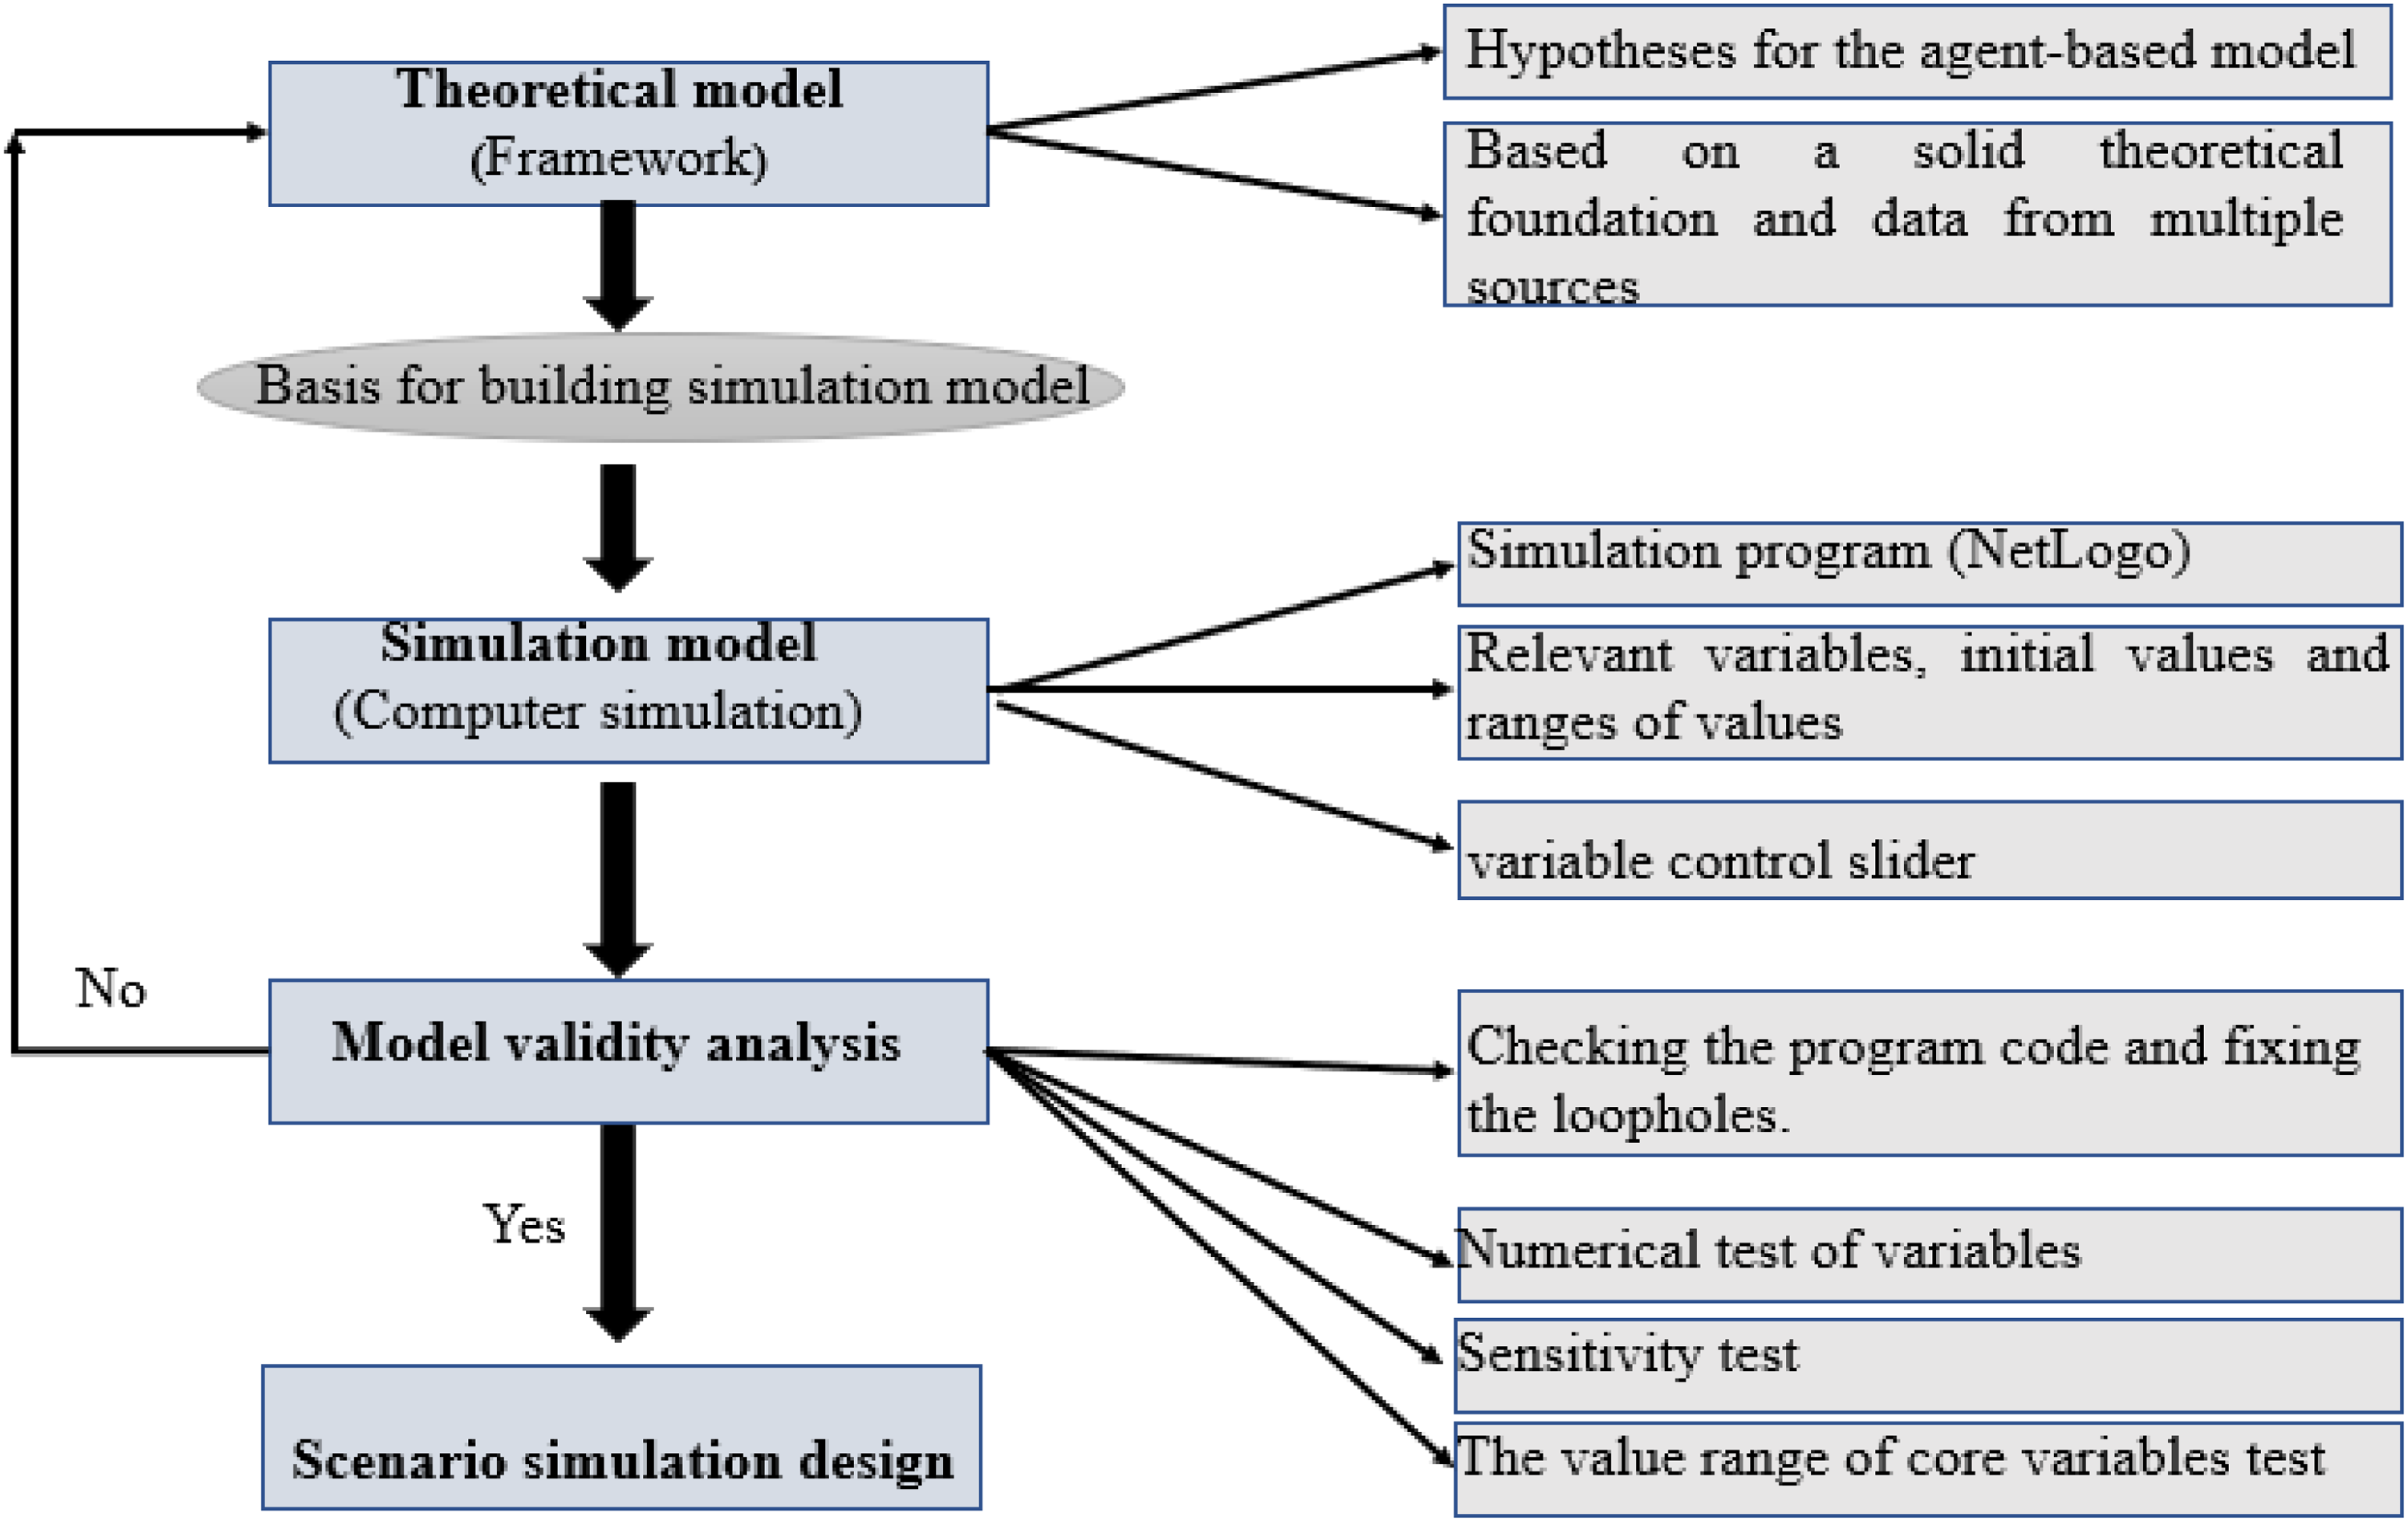
Research method framework and specification.
Model I-theoretical model
According to complex adaptive systems theory, system phenomena come from agents’ behaviours, and agents have their adaptive abilities that can affect their fitness. Agents can predict consequences of their behaviour, and then, they adjust their behaviour based on this prediction. Another most important premise is the interactivity of various subjects, and they influence each other's behaviour in interactive communication. Meanwhile, stochasticity of the model includes, for example, agents’ location in the simulation world. Finally, agents with different behaviours are grouped under collective behaviour. Although the behavioural rules can be presented by mathematical formulas, qualitative description is also a commonly used method, 60 which can not affect the writing and results of the simulation programme. An agent-based model usually includes households and individuals. However, Holland62,63 believed that an agent should be an active element, and he has not limited the agent to households or individuals. Furthermore, with the rapid development of Internet and artificial intelligence, regions become more and more active and intelligent. 64 Thus, a region has the main characteristics of an agent. The theoretical model is the basis for building the simulation model. The energy consumption of 30 provinces and municipalities directly under the Central Government of China is taken as the research sample.
According to the theory of energy economics, consumable energy sources include local and non-local energy sources. If there is energy surplus in the process of consumption, it is transferred to the energy input part. Energy consumption brings about various outputs. Energy consumption shows differences among provinces and cities, and it can be divided into high, medium, and low energy consumption, thus, this difference leads to inequality in energy consumption, and the Gini coefficient is calculated accordingly. 65 According to the literature review of section 2, energy consumption in various provinces and cities is affected by many factors such as government subsidies, industrial structure, investment in fixed assets, regional energy planning and macroeconomic cycles. These factors interweave with each other and affect the energy consumption of each province and city together, consequently affecting the Gini coefficient of energy consumption. Thus, the simulation model is built and analysed in this study to determine which factors are key and formulate targeted regulatory policies to enhance energy equity (see Figure 2).
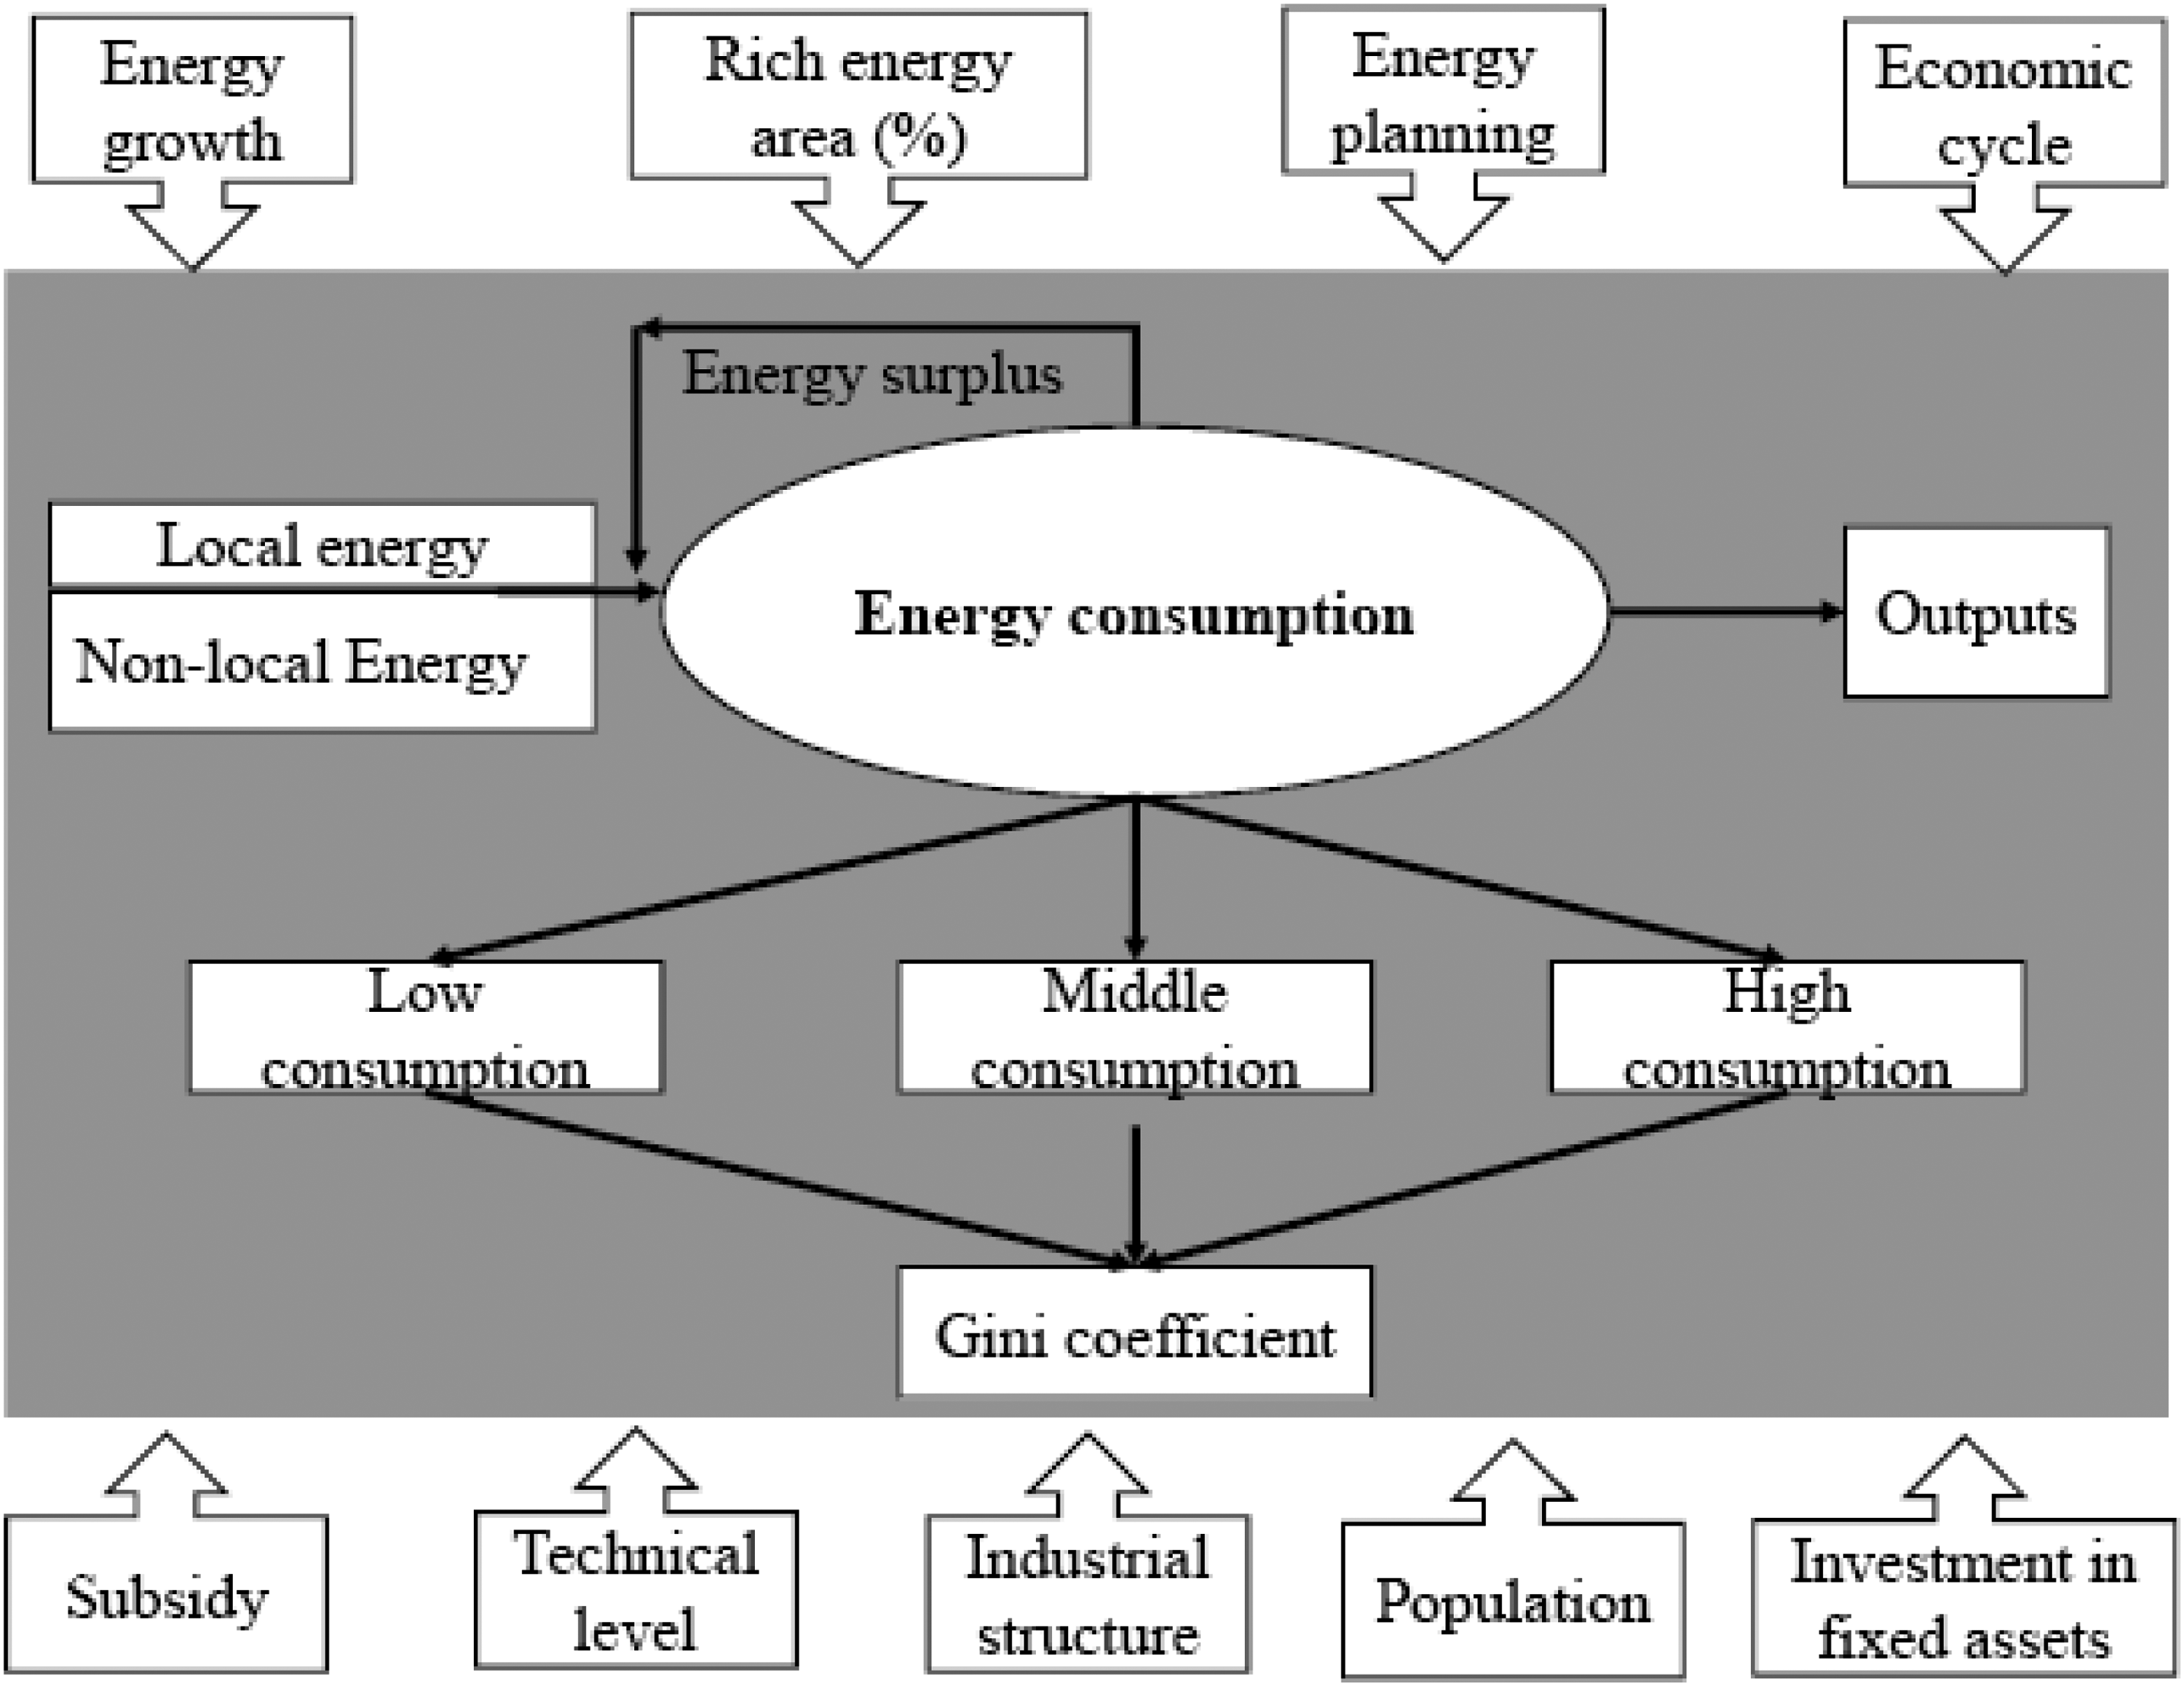
Theoretical model framework.
Model II-simulation model
The simulation model is based on the theoretical model. Thirty research samples were used in the simulation system (NetLogo) in the shape of houses (Figure 3). The initial location is randomly distributed. The “input-consumption-output” of energy is regarded as the 30 subjects’ behaviour rule (See appendix 1 for main programme codes).
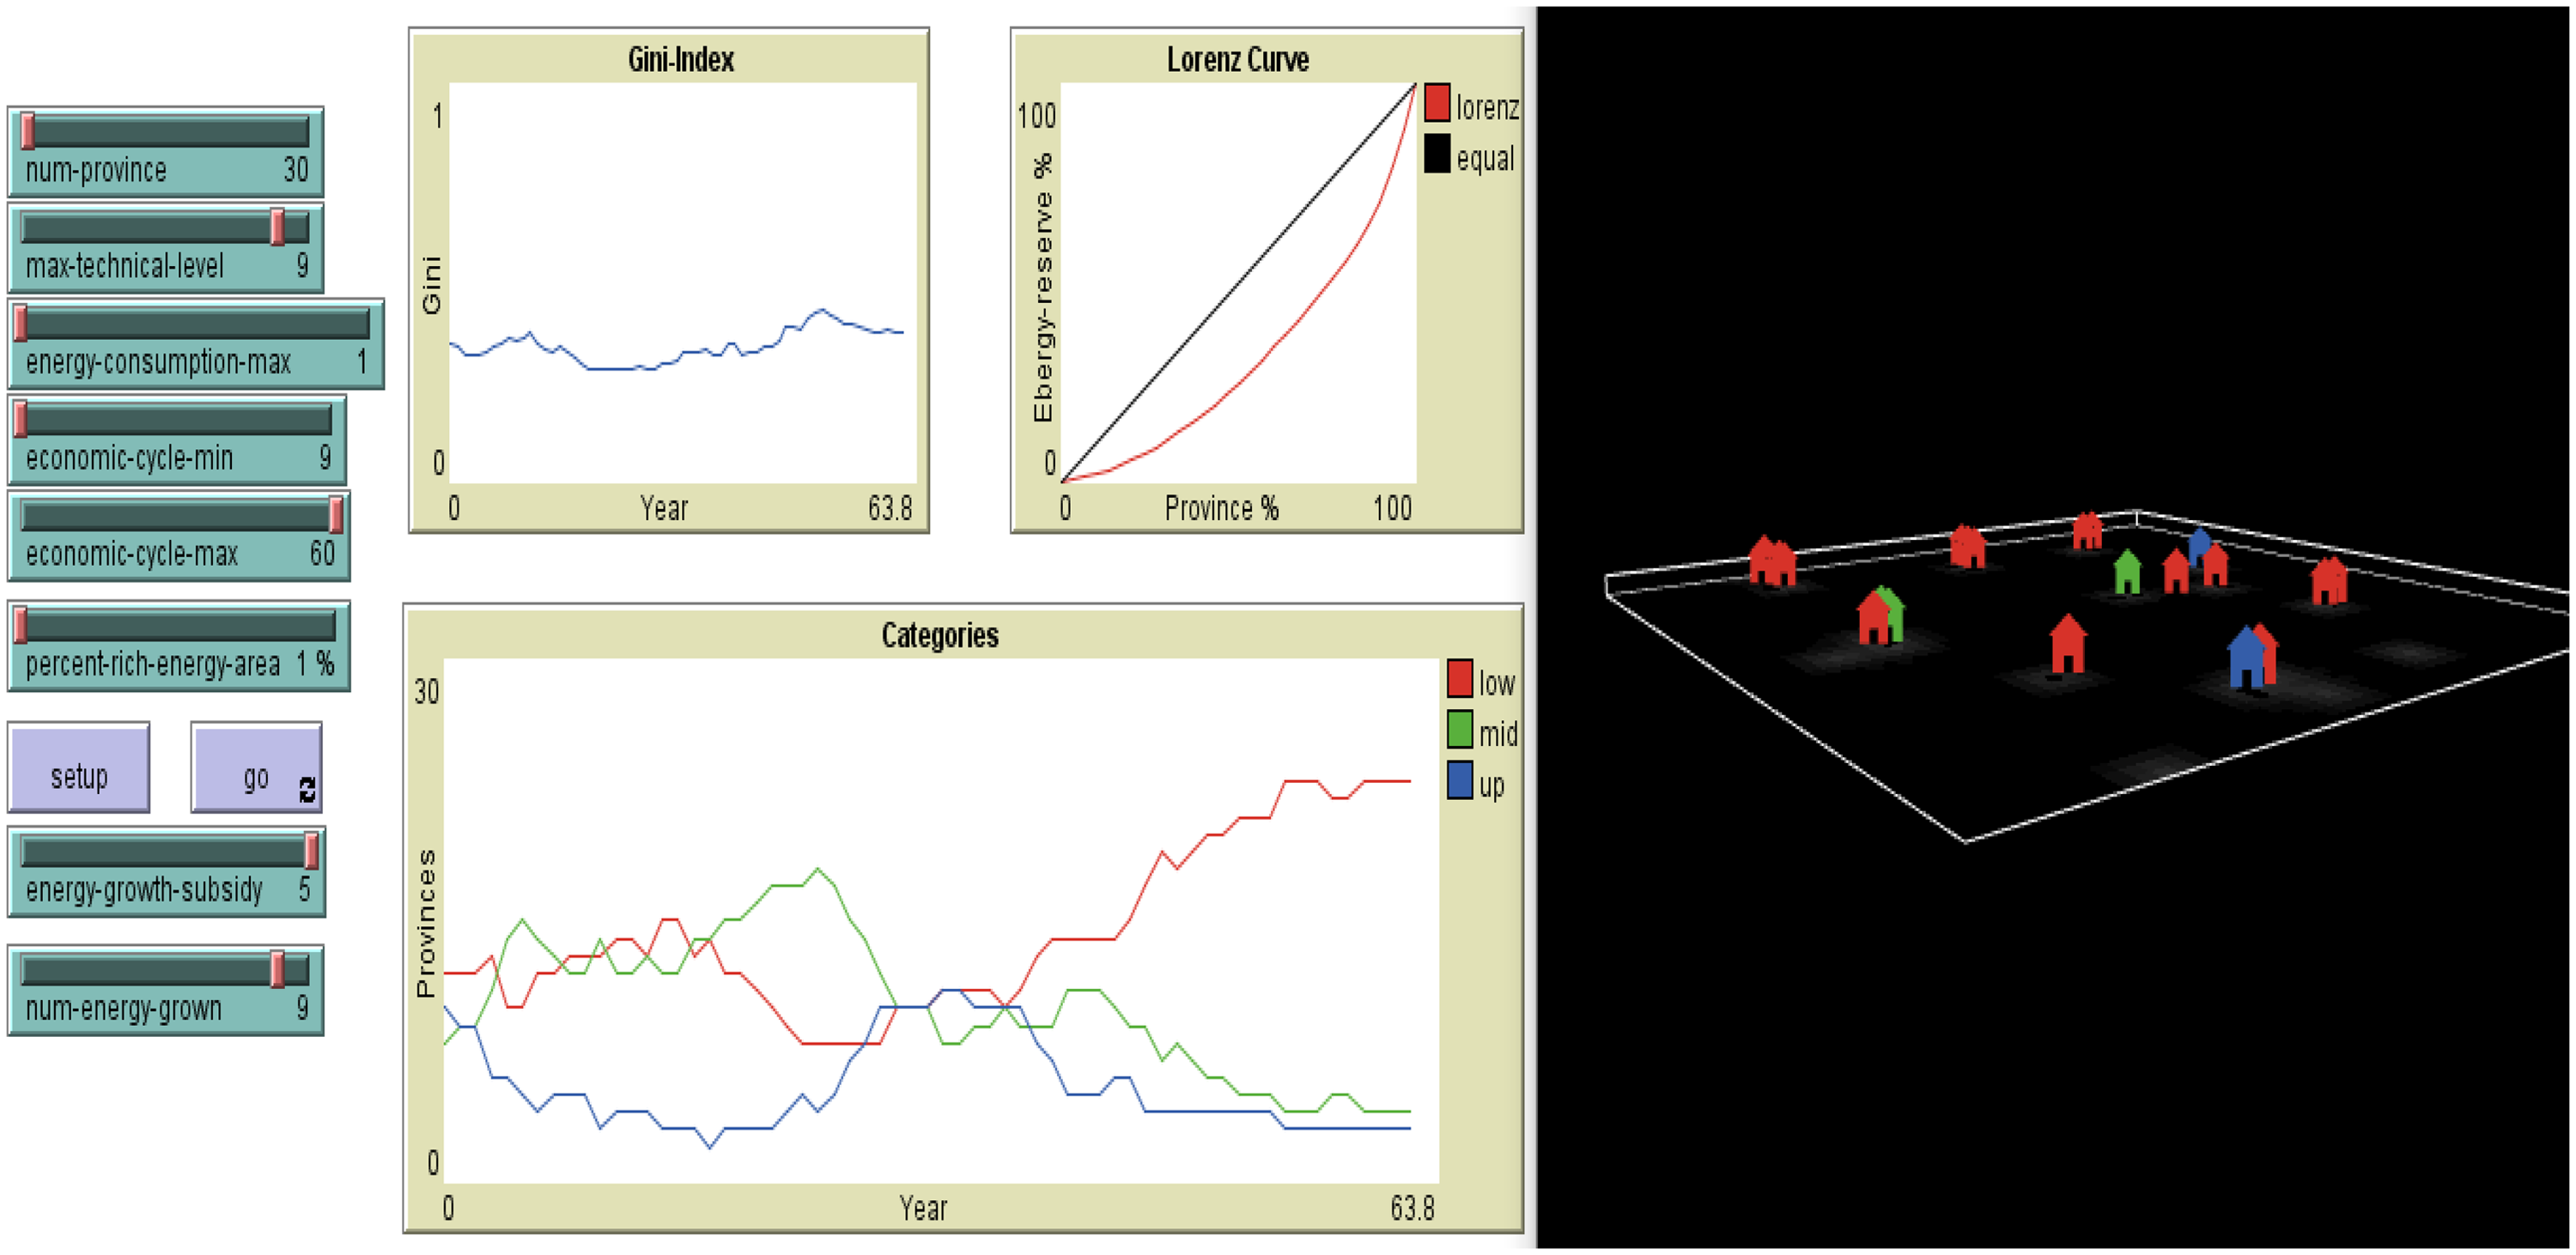
Interface of the simulation model.
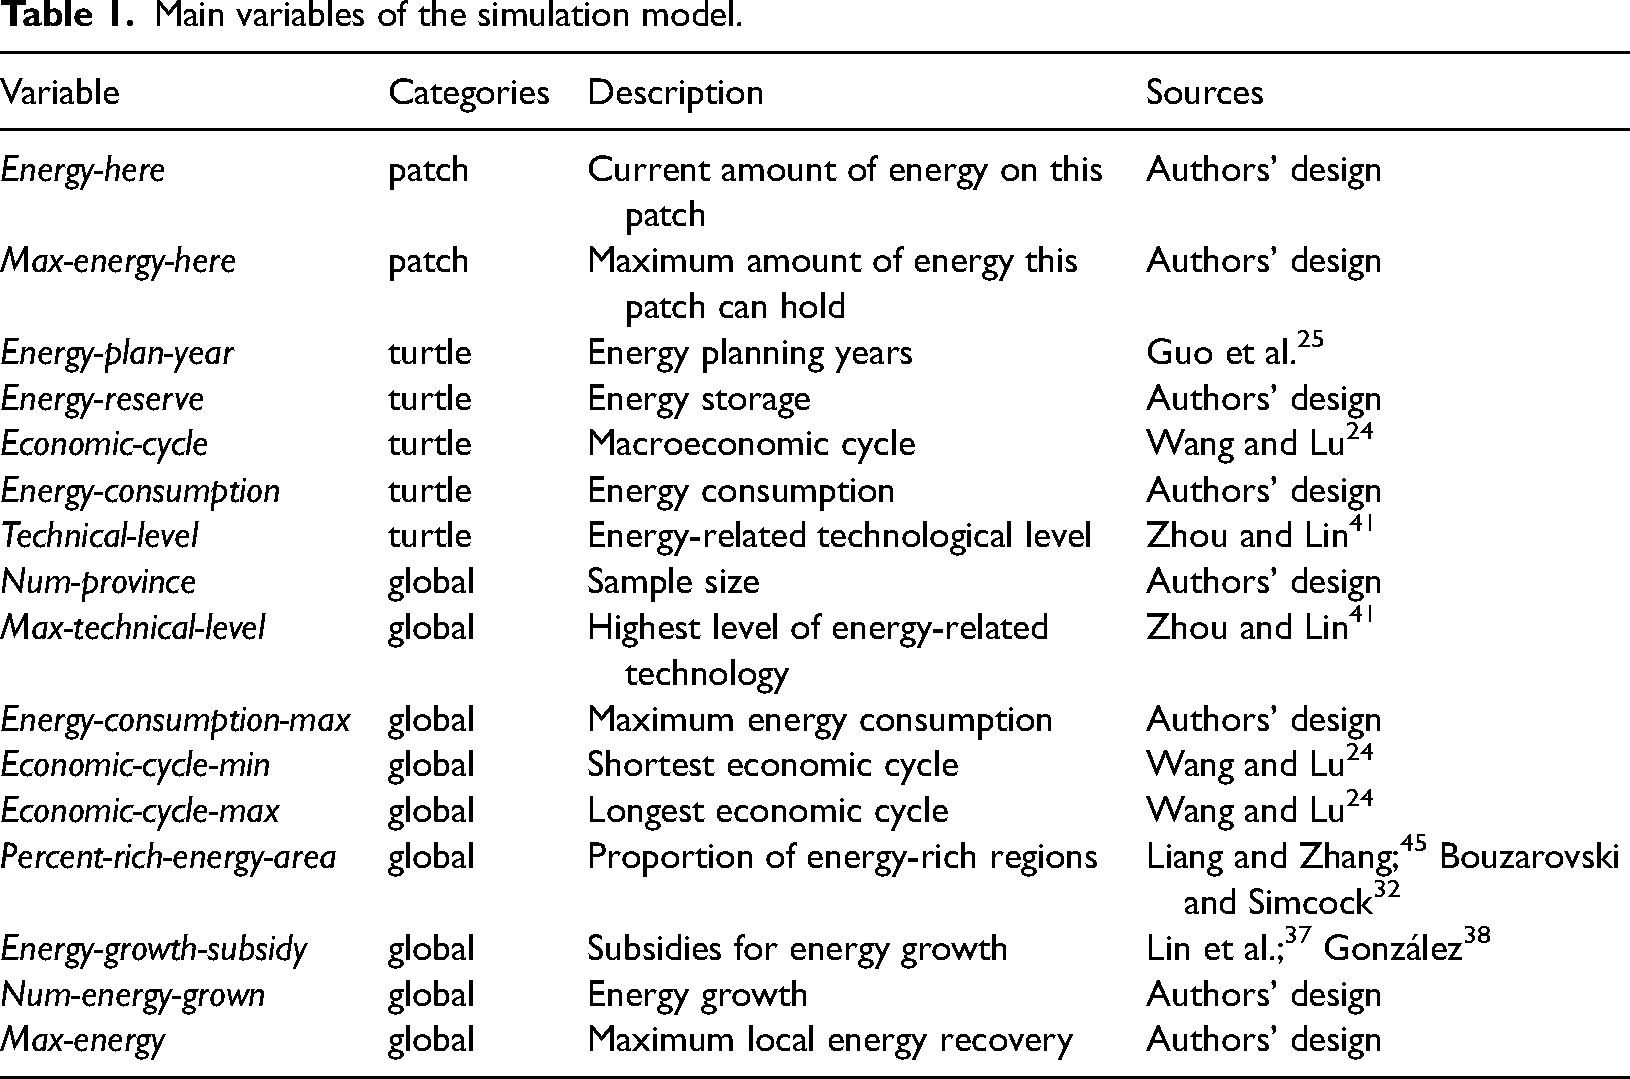
The relevant factors affecting the behaviour rules were set for different variables (patch, turtle, and global; see Table 1). Simultaneously, different variables need to be set in the whole simulation environment. The variable control slider is also set for variables that must be regulated (left side of Figure 3).
Main variables of the simulation model.
Data collection and initialization
If actual data cannot be collected, data provided by the existing research is used. The Gini coefficient is defined based on the Lorenz curve, which plots the proportion of the total energy consumption of 30 provinces (y axis) in mainland China that is cumulatively consumed by the bottom x% of the provinces. The energy consumption Gini coefficient can then be considered as the ratio of the area (A) that lies between the line of equality and the Lorenz curve over the total area (A and B) under the line of equality. The energy consumption Gini coefficient ranges from perfect equity among all members of the provinces (Gini coefficient = 0) to complete inequity (Gini coefficient = 1). The area of A and B is calculated by the fixed integral method. Additionally, a programme is written for automatic calculation of the Gini coefficient of energy consumption for the 30 simulation subjects.
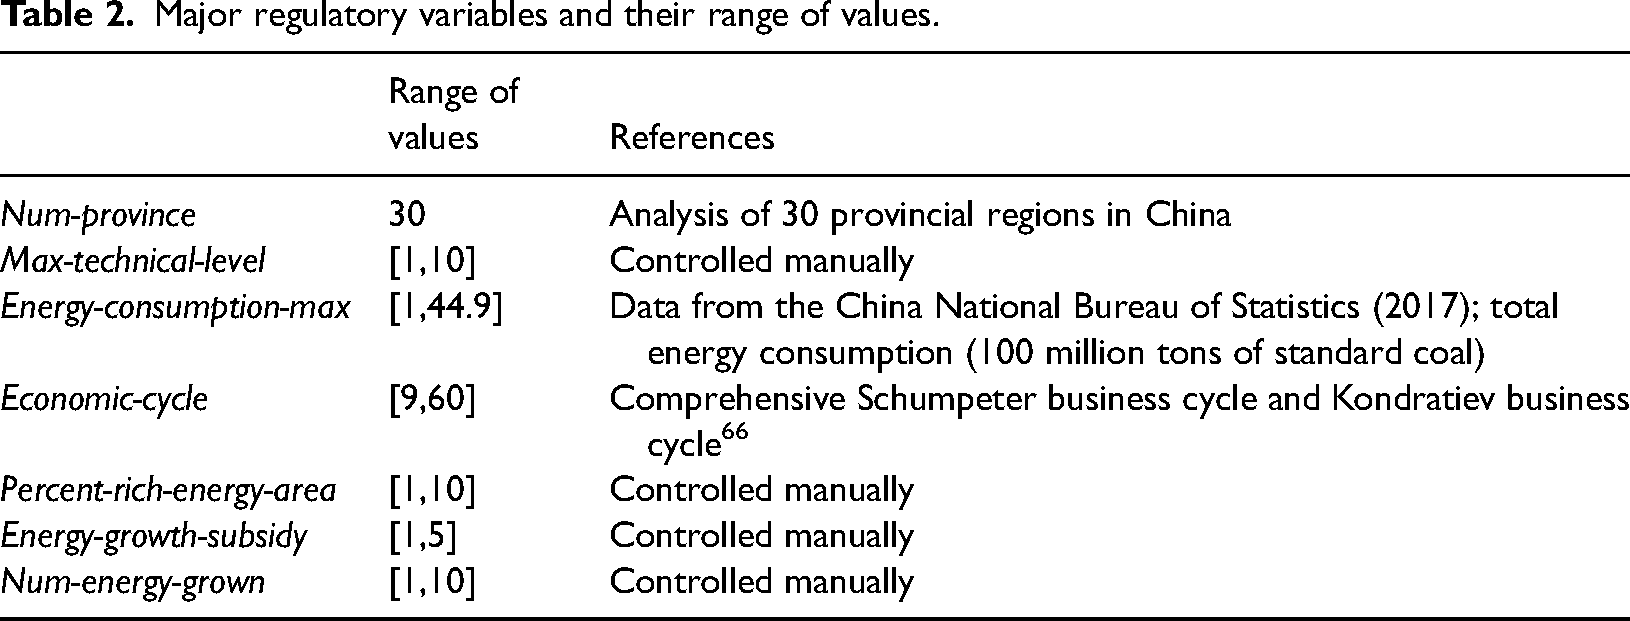
After the design of the simulation model's relevant variables is completed, initial values and ranges of values need to be set for the variables. The determination principle of these values is based on actual data. For example, according to the data from the China National Bureau of Statistics, Energy-consumption-max has been calculated. To observe conveniently the influence of the Gini coefficient on energy consumption in the simulation, some parameters were controlled manually to analyse the key influencing factors under different scenarios, for example, Max-technical-level (see Table 2). Although manually controlled variables are subjective, they do not affect the interaction between observed variables and have been widely used in the analysis of long-term trends (Liu, 2012).
Major regulatory variables and their range of values.
Model validity analysis
There is no uniform standard for the validity test of the model. 67 However, the entire modelling method ensures the validity of the model. The construction of the theoretical model is based on a solid theoretical foundation23,32,38 and data from multiple sources, including empirical data. Analysis of the literature review was employed as a basis for developing the model; regional reports, official government documents and media reports were gathered to supplement primary data collection, which make the theoretical model as close as possible to the real world.
The simulation model is tested to ensure a true reflection of the theoretical model. The validity of the procedure is tested by checking the programme code and fixing the loopholes. The entire programme has been debugged more than 30 times, and each sub-module programme has also been debugged separately. Then, in the numerical test of variables, sensitivity is tested using extreme values to find vulnerabilities and correct the variables in time. For example, Energy-consumption-max [1, 44.9]. The extreme values are 1 and 44.9. Furthermore, we also tested the value range of core variables.
Therefore, models built on the basis of reality and existing research can guarantee, to the greatest extent possible, the closeness between the results of model output and the actual energy consumption situation. Through these tests, we have reasons to believe the validity of the results obtained by the entire model.
Scenario simulation design
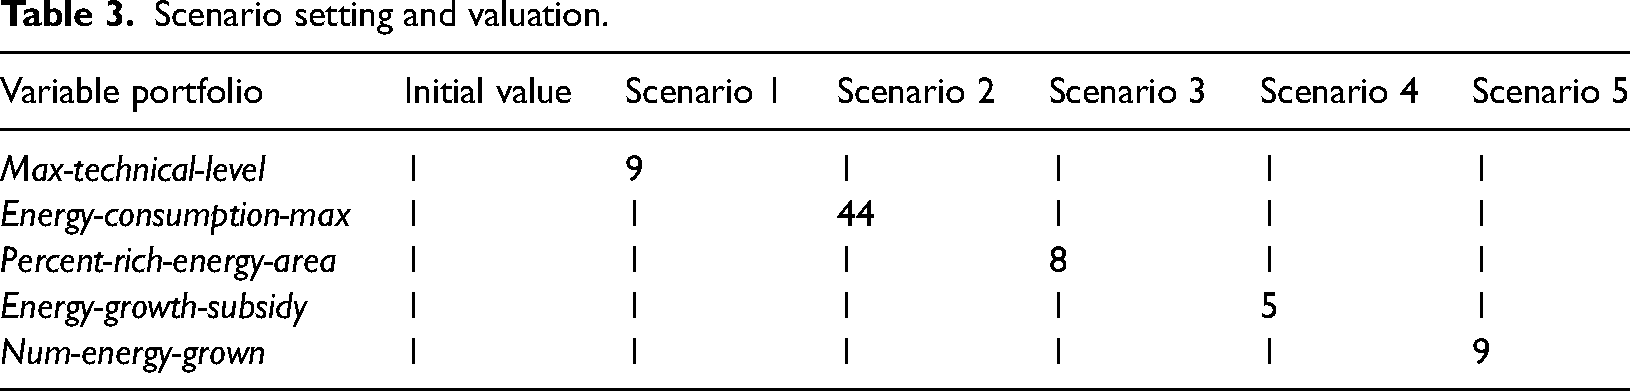
Scenario simulation is an effective method to identify the key factors, which not only overcomes the shortcomings of linear and static analysis but also has the characteristics of dynamic and vivid results displayed. It has been successfully used in various fields of research.68,69 To identify the key factors affecting the Gini coefficient of energy consumption, six simulation scenarios are designed. The first scenario is the baseline scenario. The second to fifth scenarios are simulation and comparison scenarios. The main basis for the design of these scenarios is the literature analysis in section 2, such as González, 38 Tovar Reaños et al., 40 Sousa and Meireles, 44 and the proposed five research hypotheses. For example, Scenario 4 is a simulation experiment for Energy-growth-subsidy, which also tests Hypothesis 1. In the comparative analysis scenarios, the value of each of the five variables is larger so that significant factors are observed to facilitate comparison with the baseline scenario for example Max-technical-level, the value of baseline scenario is 1, however, the value of scenario 1 is 9. The values of baseline scenario are supposed. To observe the general trend of computational experiments, other values of scenarios are sustained by the literature review of section 2, such as Bouzarovski and Simcock, 32 Dou et al., 49 and manually controlled. 67 Thus, the comparative scenario could be performed (Table 3).
Scenario setting and valuation.
There is no unified standard for the determination of the simulation period. The monthly cycle or the annual cycle can be set according to different research needs. Energy consumption involves changes in the economic structure and energy technology; these are long-term processes. Especially China is a country dominated by fossil energy. Studies have shown that China's energy consumption is locked to a certain extent, and it is difficult to change in the short term. 70 The effect of short-term policies is very limited, and policies that focus on the long-term are more likely to change energy consumption inequality. 71 Therefore, a long-term simulation period is suitable. Meanwhile, energy consumption and economic development are closely related. Considering that the economic cycle is set at 40–60 years, 66 the simulation period is set to 60 years. Furthermore, existing forecasting studies have successfully used long-term forecasting.67,72
Based on the different simulation scenarios, key variables that have a significant impact on the Gini coefficient of energy consumption can be identified. Next, the author assembled these variables, and designed the optimal regulation policy so that the Gini coefficient of energy consumption can be decreased.
Results and discussion
Gini coefficient and changes in technology level
The results of running the simulation programme show significant differences in the Gini coefficient of energy consumption between the benchmark scenario and simulation scenario 1 (F = 30.52, Sig (0.00) <0.05; T = 11.40 Sig (0.00) <0.05). Simulation scenario 1 sets the technical level to a higher value (9), while the other variables remain unchanged. As Figure 4 shows, during the whole simulation cycle, the Gini coefficient of energy consumption decreased compared with the benchmark scenario and passed the significance test mentioned above. This indicates that technological progress related to energy reduces the inequality of energy consumption (H2). In fact, energy-related technological progress can increase the supply of energy or improve the efficiency of energy use. 73 This also means reducing inequality in energy consumption from both the supply and demand sides. Furthermore, advances in technology have made energy sources such as electricity and natural gas available to residents in rural areas,41,43 which allows farmers to use safe and stable energy. These can reduce the Gini coefficient of energy consumption. This conclusion means that it is appropriate to formulate policies to reduce the Gini coefficient of energy consumption in terms of improving the technical level.
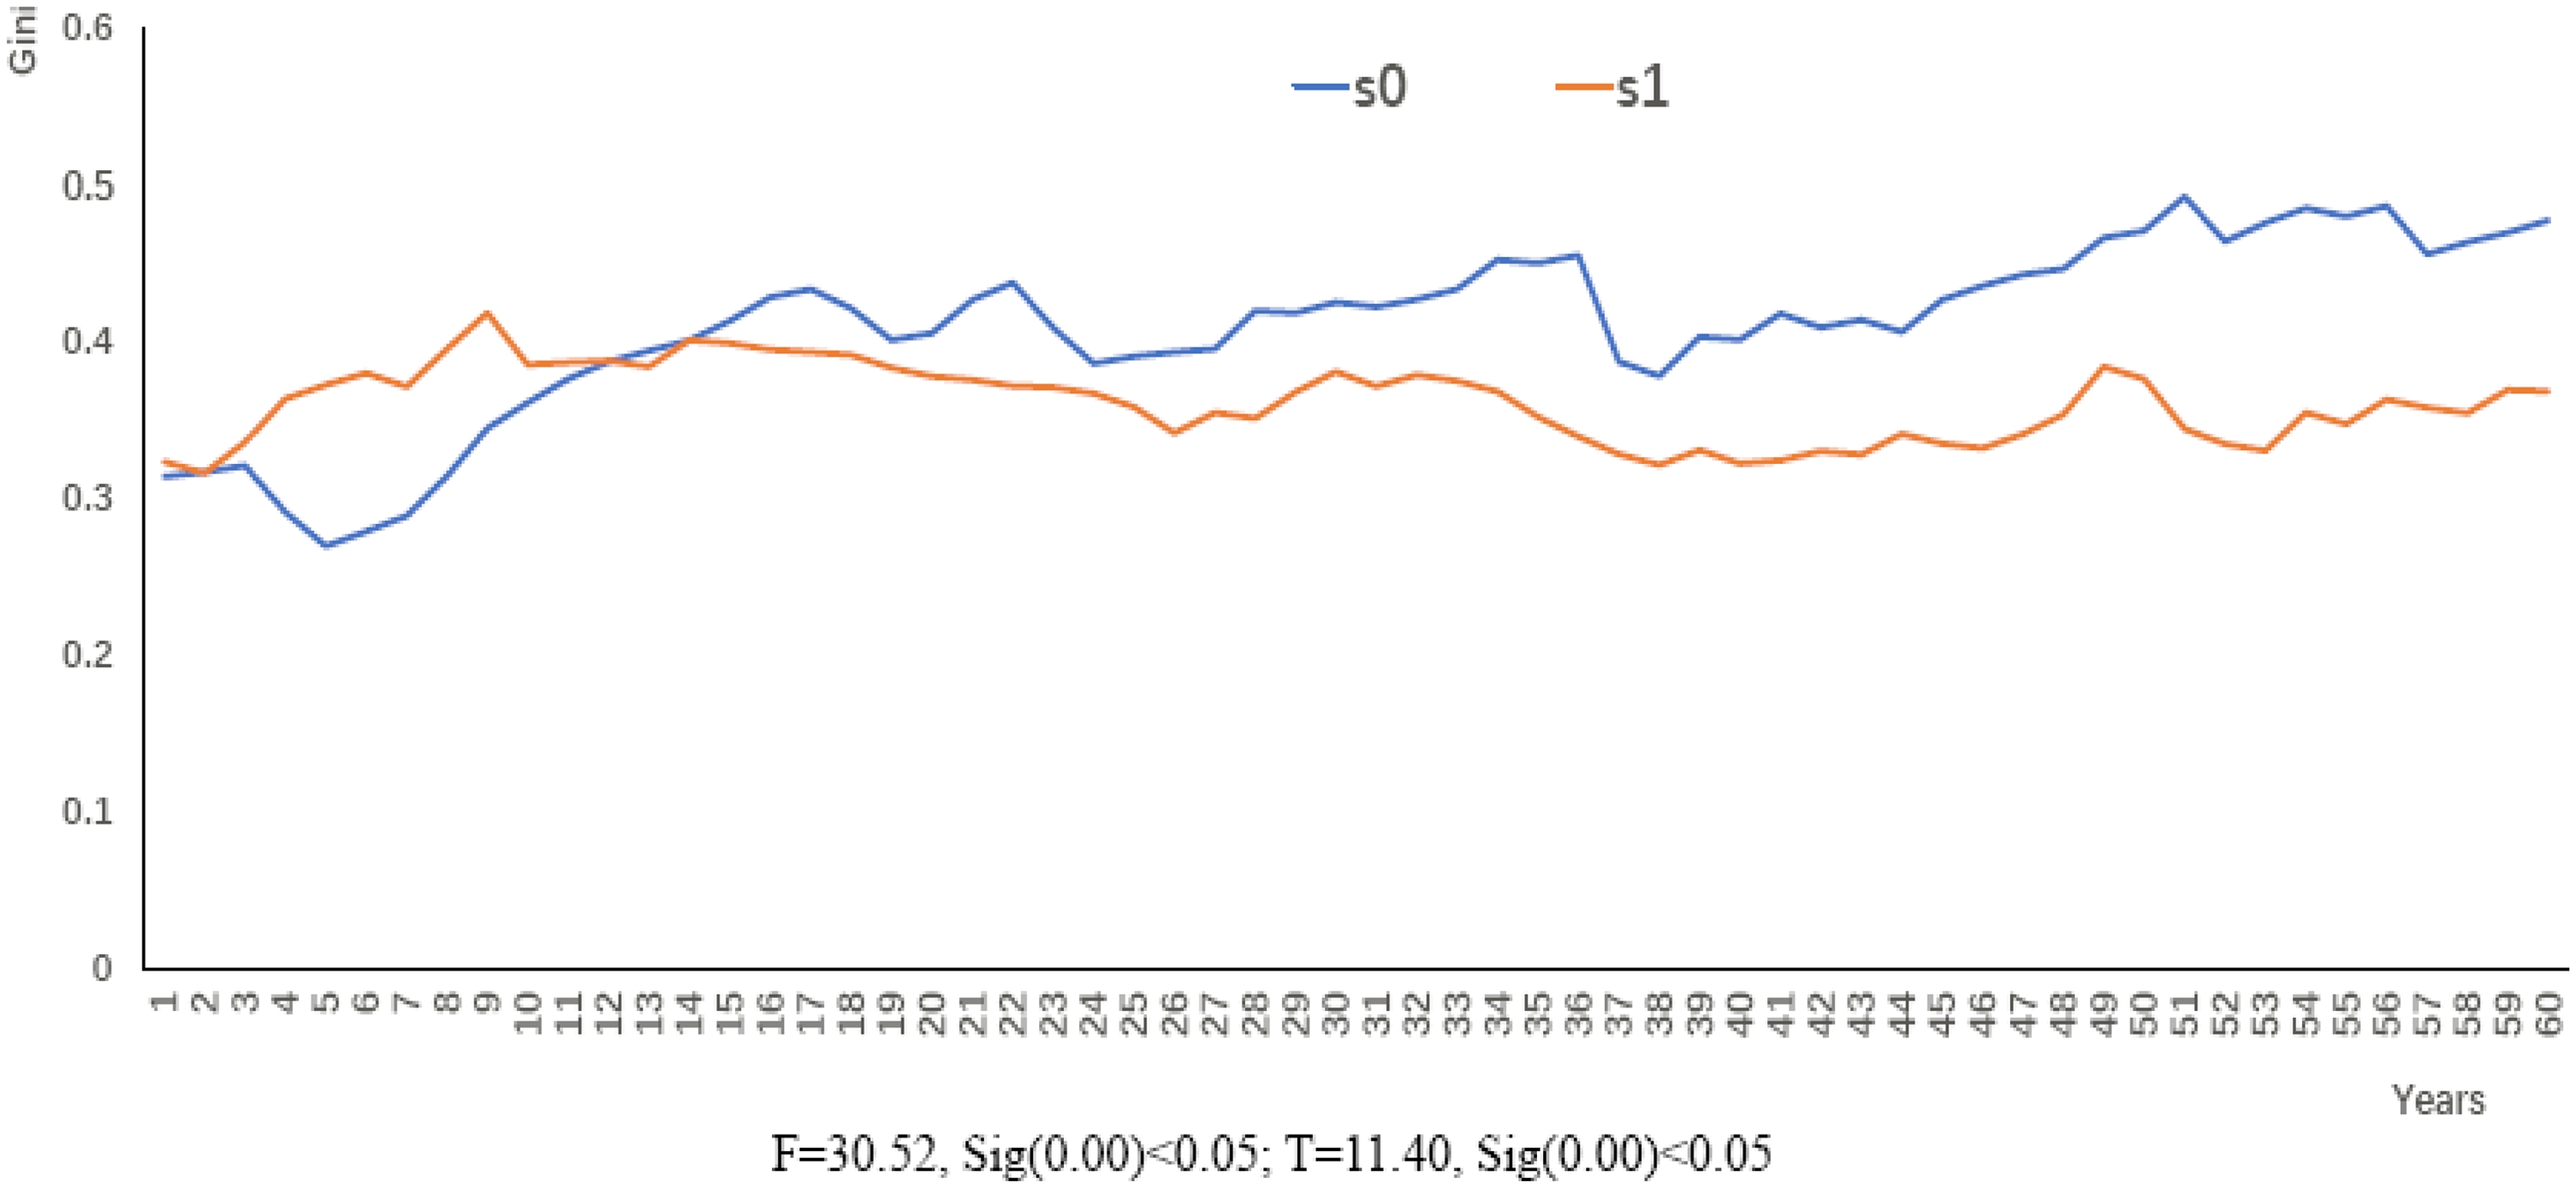
Effect of technology level on energy Gini coefficient.
Energy consumption adjustment and gini coefficient
In scenario 2, the maximum energy consumption is set to a higher level (44), while the values of other variables remain unchanged. The simulation results show no significant difference between scenario 2 and the benchmark scenario in terms of Gini coefficient of energy consumption (F = 1.11, Sig (0.29)>0.05; T = 1.09, Sig (0.28)>0.05). As Figure 5 shows, the Gini coefficient of the whole simulation cycle fluctuates almost in accordance with the reference scenario. Adjusting the Gini coefficient from the end of energy consumption has little effect (H4). Under the existing state of energy consumption, it is difficult to make the main consumers of energy consumption change their consumption behaviour. It is difficult to change the overall distribution of energy consumption for high (low) consumers to reduce (increase) their consumption. Each subject's consumption patterns are relatively solidified to a certain extent. In fact, existing studies also show that the energy consumption behaviour of Chinese residents presents a “lock-in” feature, which cannot be easily changed. 74 This is closely related to energy consumption habits and culture. 75 There are also studies showing that urban sprawl in China has led to a “solidification” of energy consumption patterns, 21 which cannot be changed in the short term. Therefore, starting from the consumer side to reduce the Gini coefficient of energy consumption is very ineffective. This also provides policymakers with decision-making information that the focus of policy should not be on energy consumers.
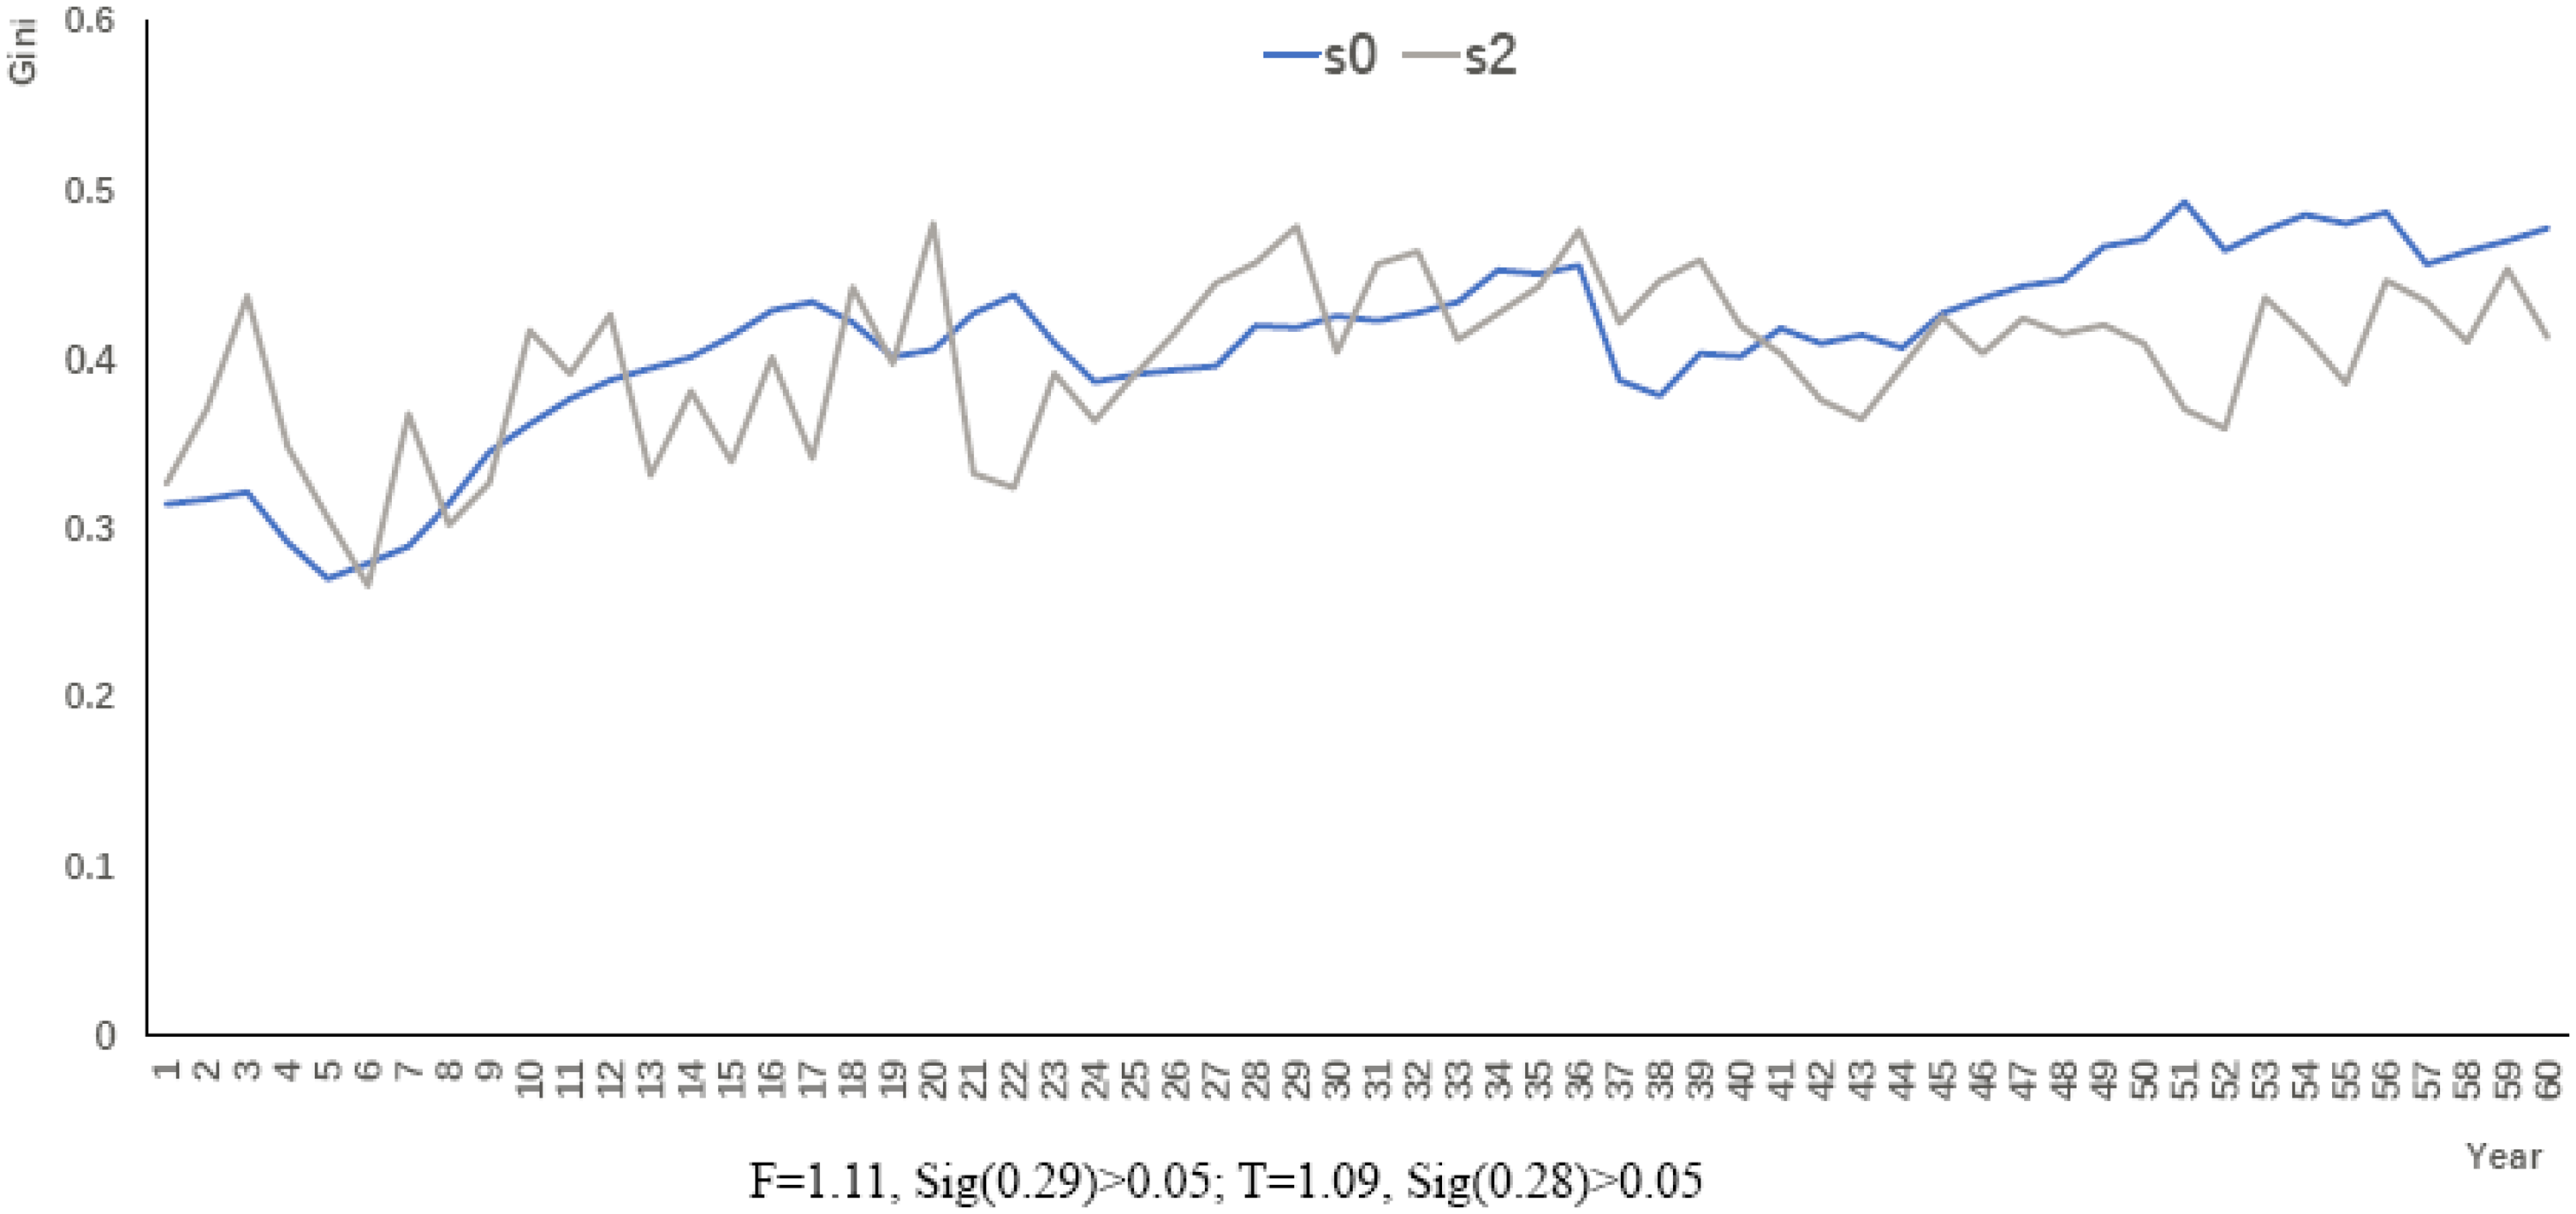
Effect of energy consumption on Gini coefficient.
Energy-rich region and gini coefficient
The simulation results show that the Gini coefficient of energy consumption is not affected significantly by the increase in the proportion of energy-rich regions (F = 11.21, Sig (0.001) <0.05; T = 0.92, Sig (0.36)>0.05; H3). Increasing the proportion of energy-rich areas refers to the continuous discovery and exploitation of new energy sources. China's energy distribution shows a regional imbalance, and the energy consumption is not consistent with energy distribution. Energy-rich areas are often sources of export energy, and high-energy-consuming areas are often not energy rich. This situation in China determines the increase in the proportion of energy-rich areas and has no significant impact on the Gini coefficient of energy consumption. An increase in the Gini coefficient of energy consumption made it is easy to categorize areas with abundant energy stocks as having a “resource curse.” The resource curse, also known as the paradox of plenty, refers to the paradox wherein areas with abundant natural resources tend to have less economic growth than areas with fewer natural resources. 76 The level of economic development of China's energy-rich storage areas, such as the western region and part of the central region, has been lagging behind that of the eastern coastal areas. However, the energy stock in these coastal areas is very limited. Therefore, some inland provinces of China, such as Shanxi, have been caught in the “resource curse.” In addition, this restricts the development of the economy in these provinces. Previous research also supports this result. 77 These provinces’ economic growth is slow, accompanied by a unitary industrial structure, destruction of ecological environment, and outflow of labour force, which exacerbate the gap in energy consumption. This echoes Han et al.'s (2007) results (Figure 6). These results provide valuable decision-making information for reducing the Gini coefficient of energy consumption.
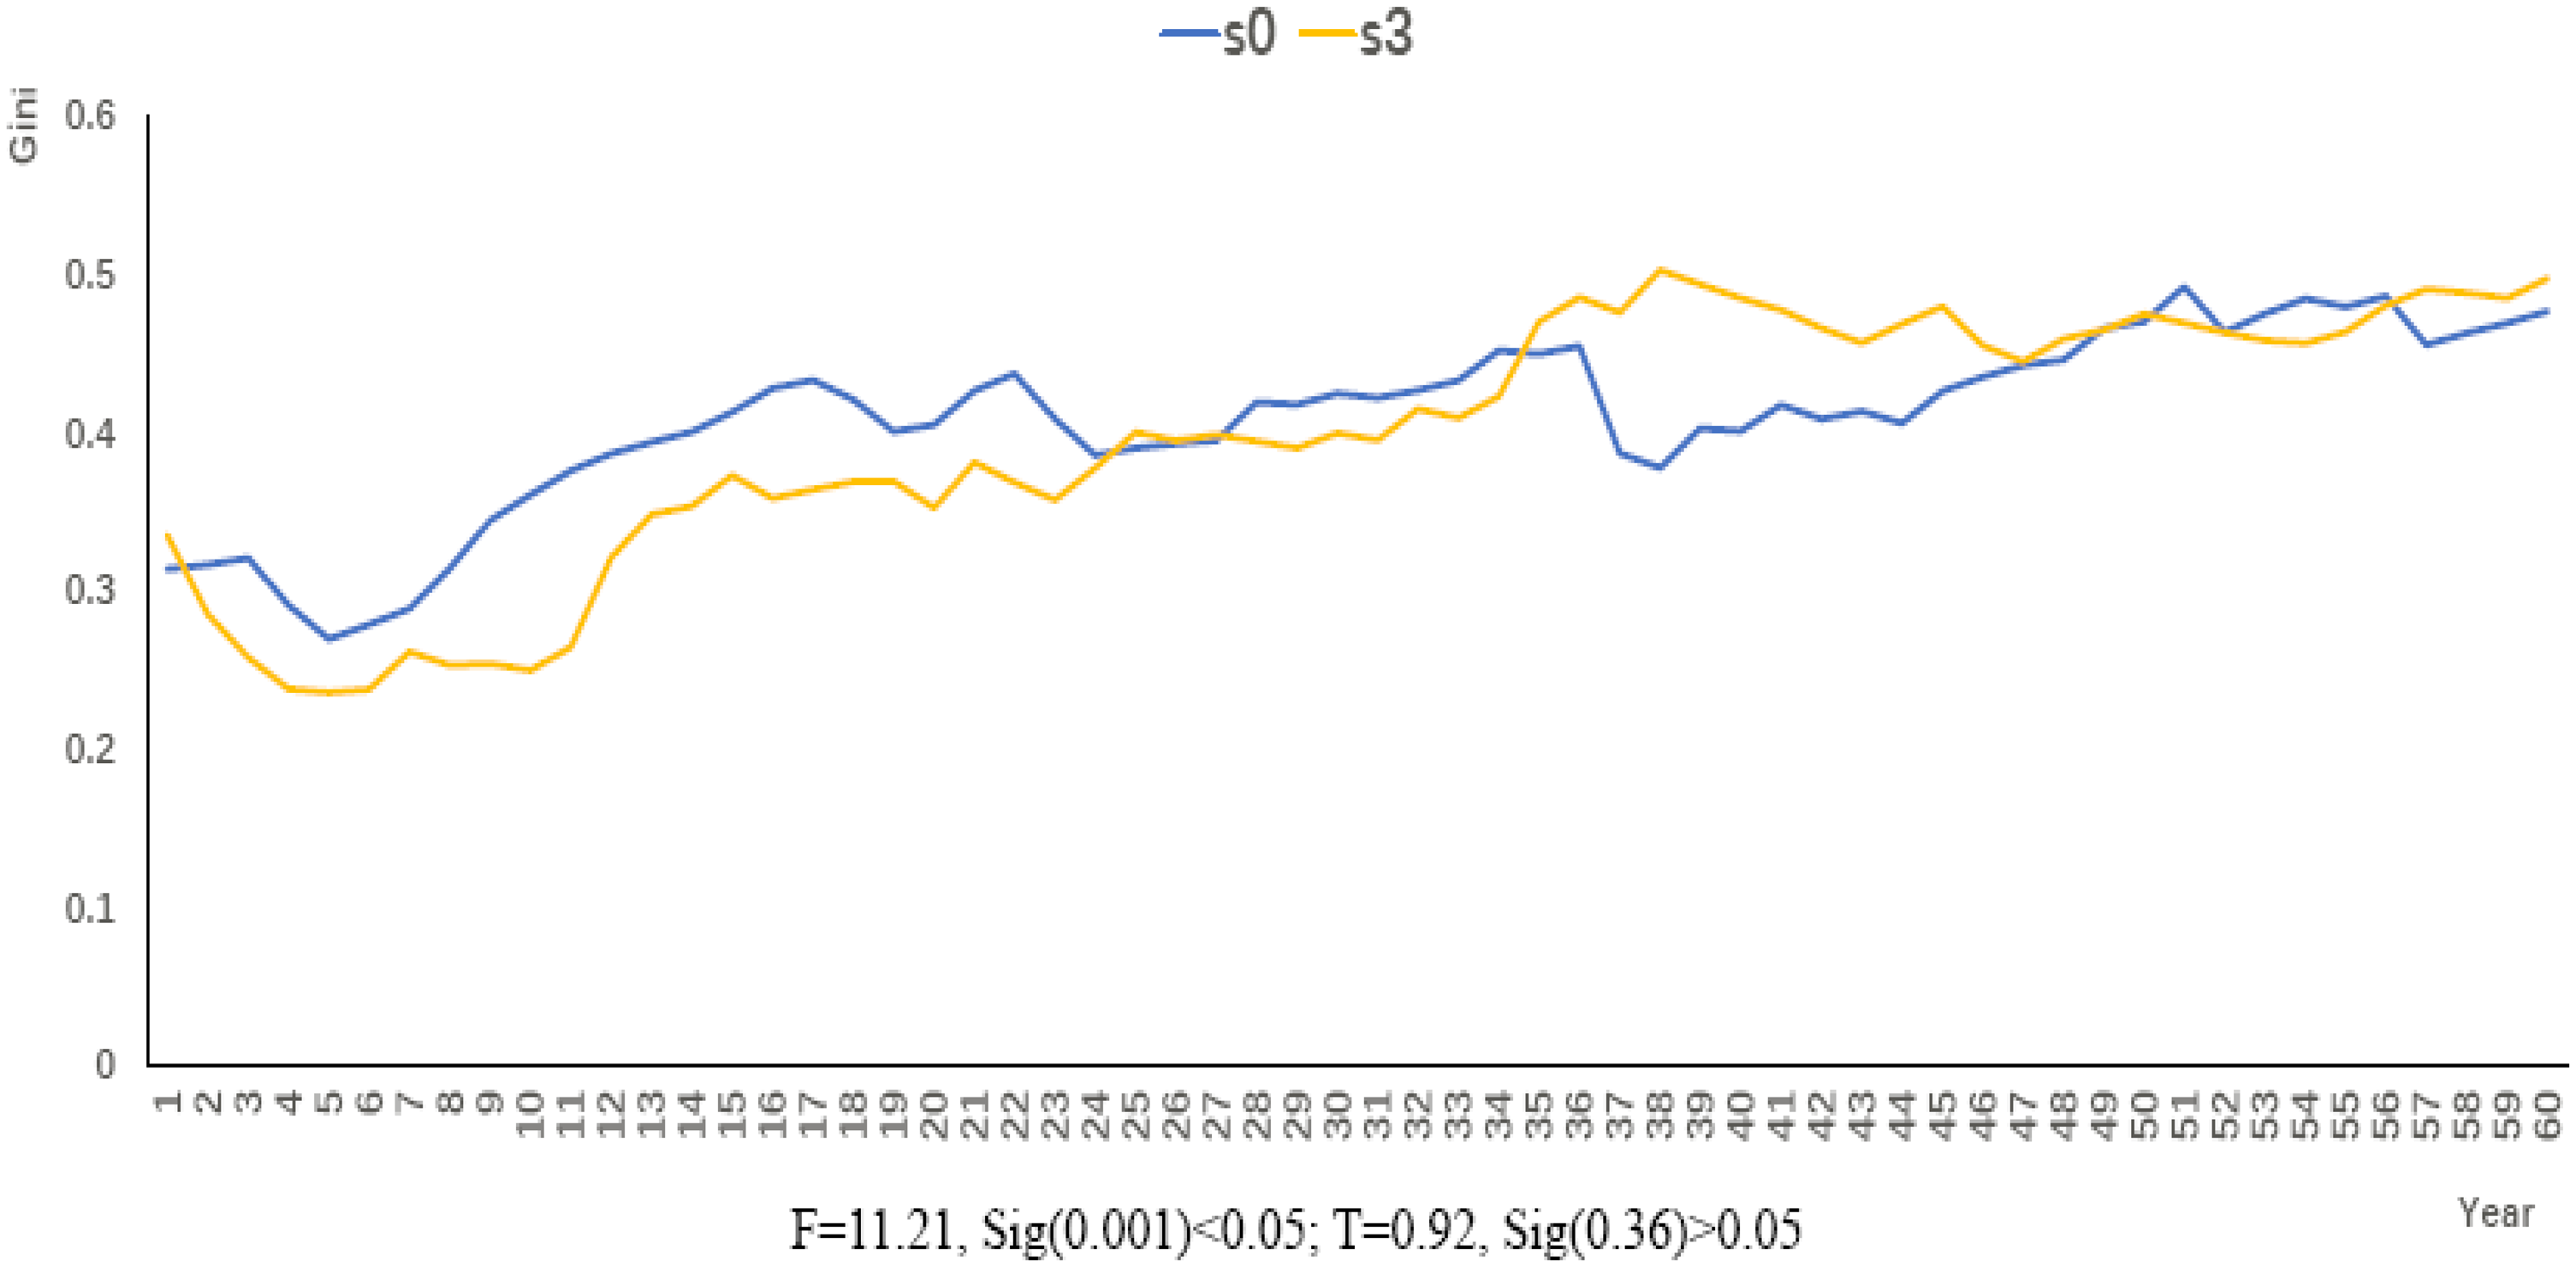
Effect of increasing the proportion of energy-rich zone on the Gini coefficient of energy consumption.
Energy subsidy and gini coefficient
The simulation results show that the energy subsidy policy has a significant impact on the Gini coefficient of energy consumption (F = 0.13, Sig (0.72)>0.05; T = 9.64, Sig (0.00) <0.05; H1). Subsidies for energy are granted to energy producers to increase the overall amount of energy. Such policies are conducive to the reduction of the Gini coefficient of energy consumption. This is more beneficial to the less-developed provinces because China's energy policy tends to prioritise the energy supply of certain regions. For example, during the peak period of summer power consumption, priority is given to ensuring the use of electricity in cities, while restrictions are imposed on electricity use in rural areas. Energy poverty in China's poverty-stricken provinces will result in an increase in the Gini coefficient of energy consumption. These areas consume a very low proportion of clean energy and cannot afford to use modern energy equipment, such as air conditioners and refrigerators. Most of them consume fossil fuels or plants as fuel. 78 This causes environmental damage and indoor air pollution. According to Chen et al., 79 indoor air pollution in China occurs mainly owing to domestic coal and biomass fuel combustion in rural areas, however, in 2018, approximately 46% of households still used solid fuels in rural villages. 80 Renewable energy sources such as solar and biogas accounted for less than 10%. 81 This is detrimental to the local residents’ health, causing issues such as respiratory symptoms and diseases as well as lung cancer, which result in the loss of human capital. This situation will be alleviated when the total amount of energy increases including renewable energy. These conclusions provide a basis for reducing the Gini coefficient of energy consumption through subsidies. (Figure 7).
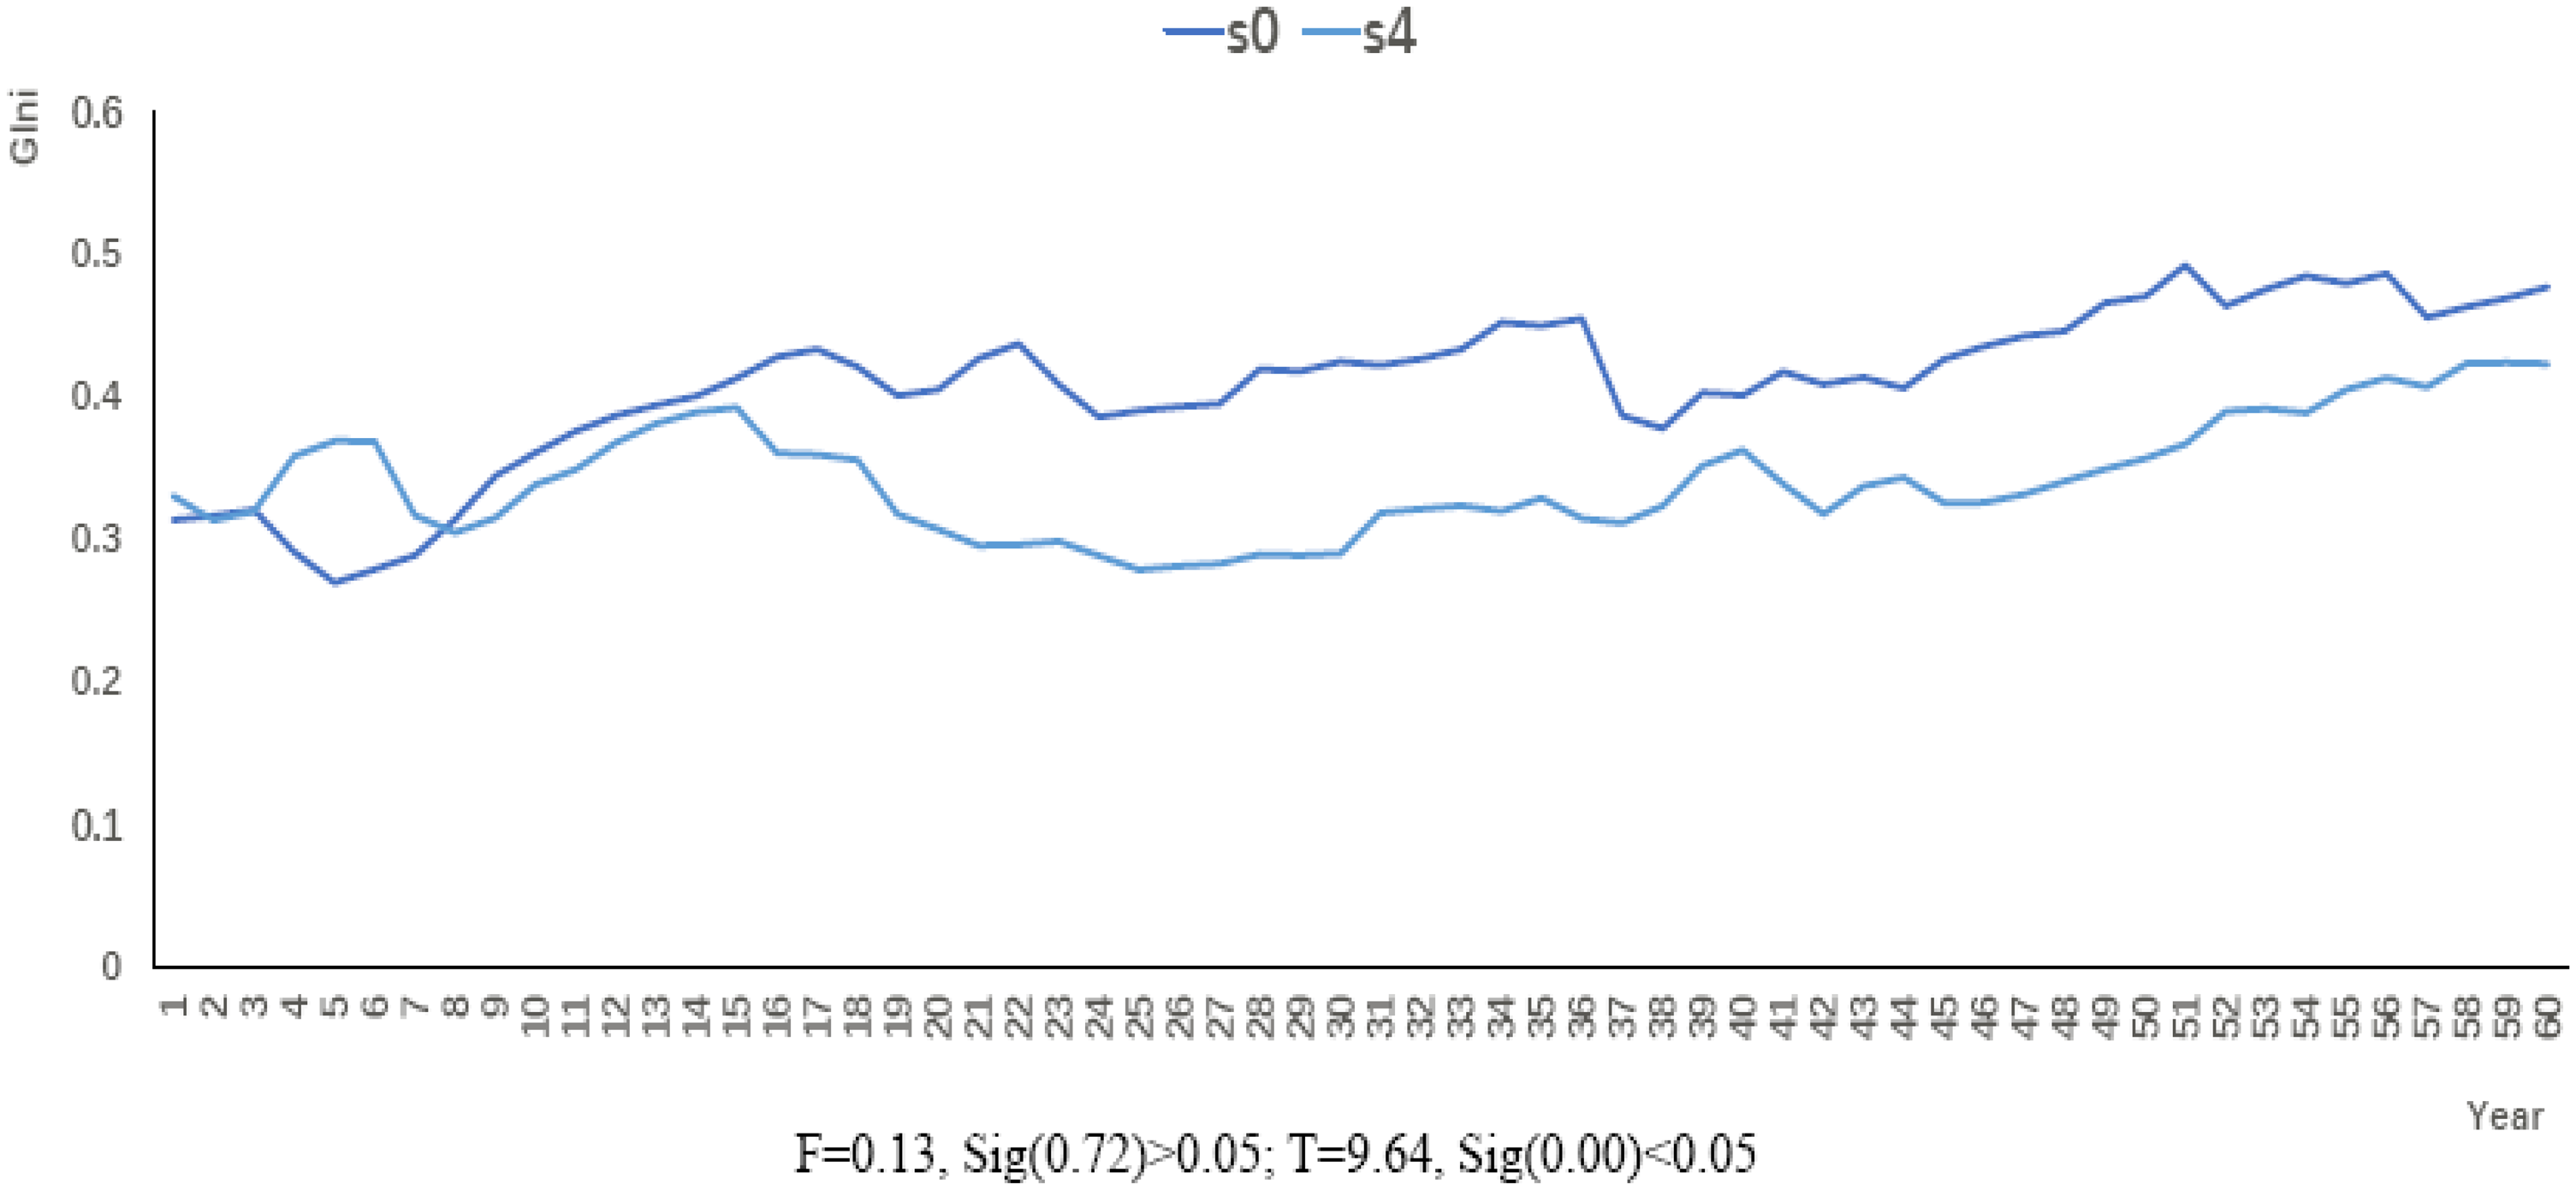
Effect of the subsidy policy on the Gini coefficient of energy consumption.
Energy growth rate and gini coefficient
The simulation results show that the energy growth rate can generally reduce the Gini coefficient of energy consumption (F = 2.11, Sig (0.15)>0.05; T = 5.47, Sig (0.00) <0.05; H5). As energy subsidies promote total energy supply, the energy industry's growth rate has accelerated, and the total supply of energy has increased. The Gini coefficient of energy consumption is reduced from the source of supply. This means that starting from the energy supply side and increasing the total supply of energy is a feasible way. Existing studies also partially support this conclusion. The increase in China's energy supply has enabled more residents in relatively poor areas to use electricity and natural gas, 82 which reduces the Gini coefficient of energy consumption. At the same time, it is also conducive to promoting energy equity, so it has a high reference value in terms of policy implications (Figure 8).
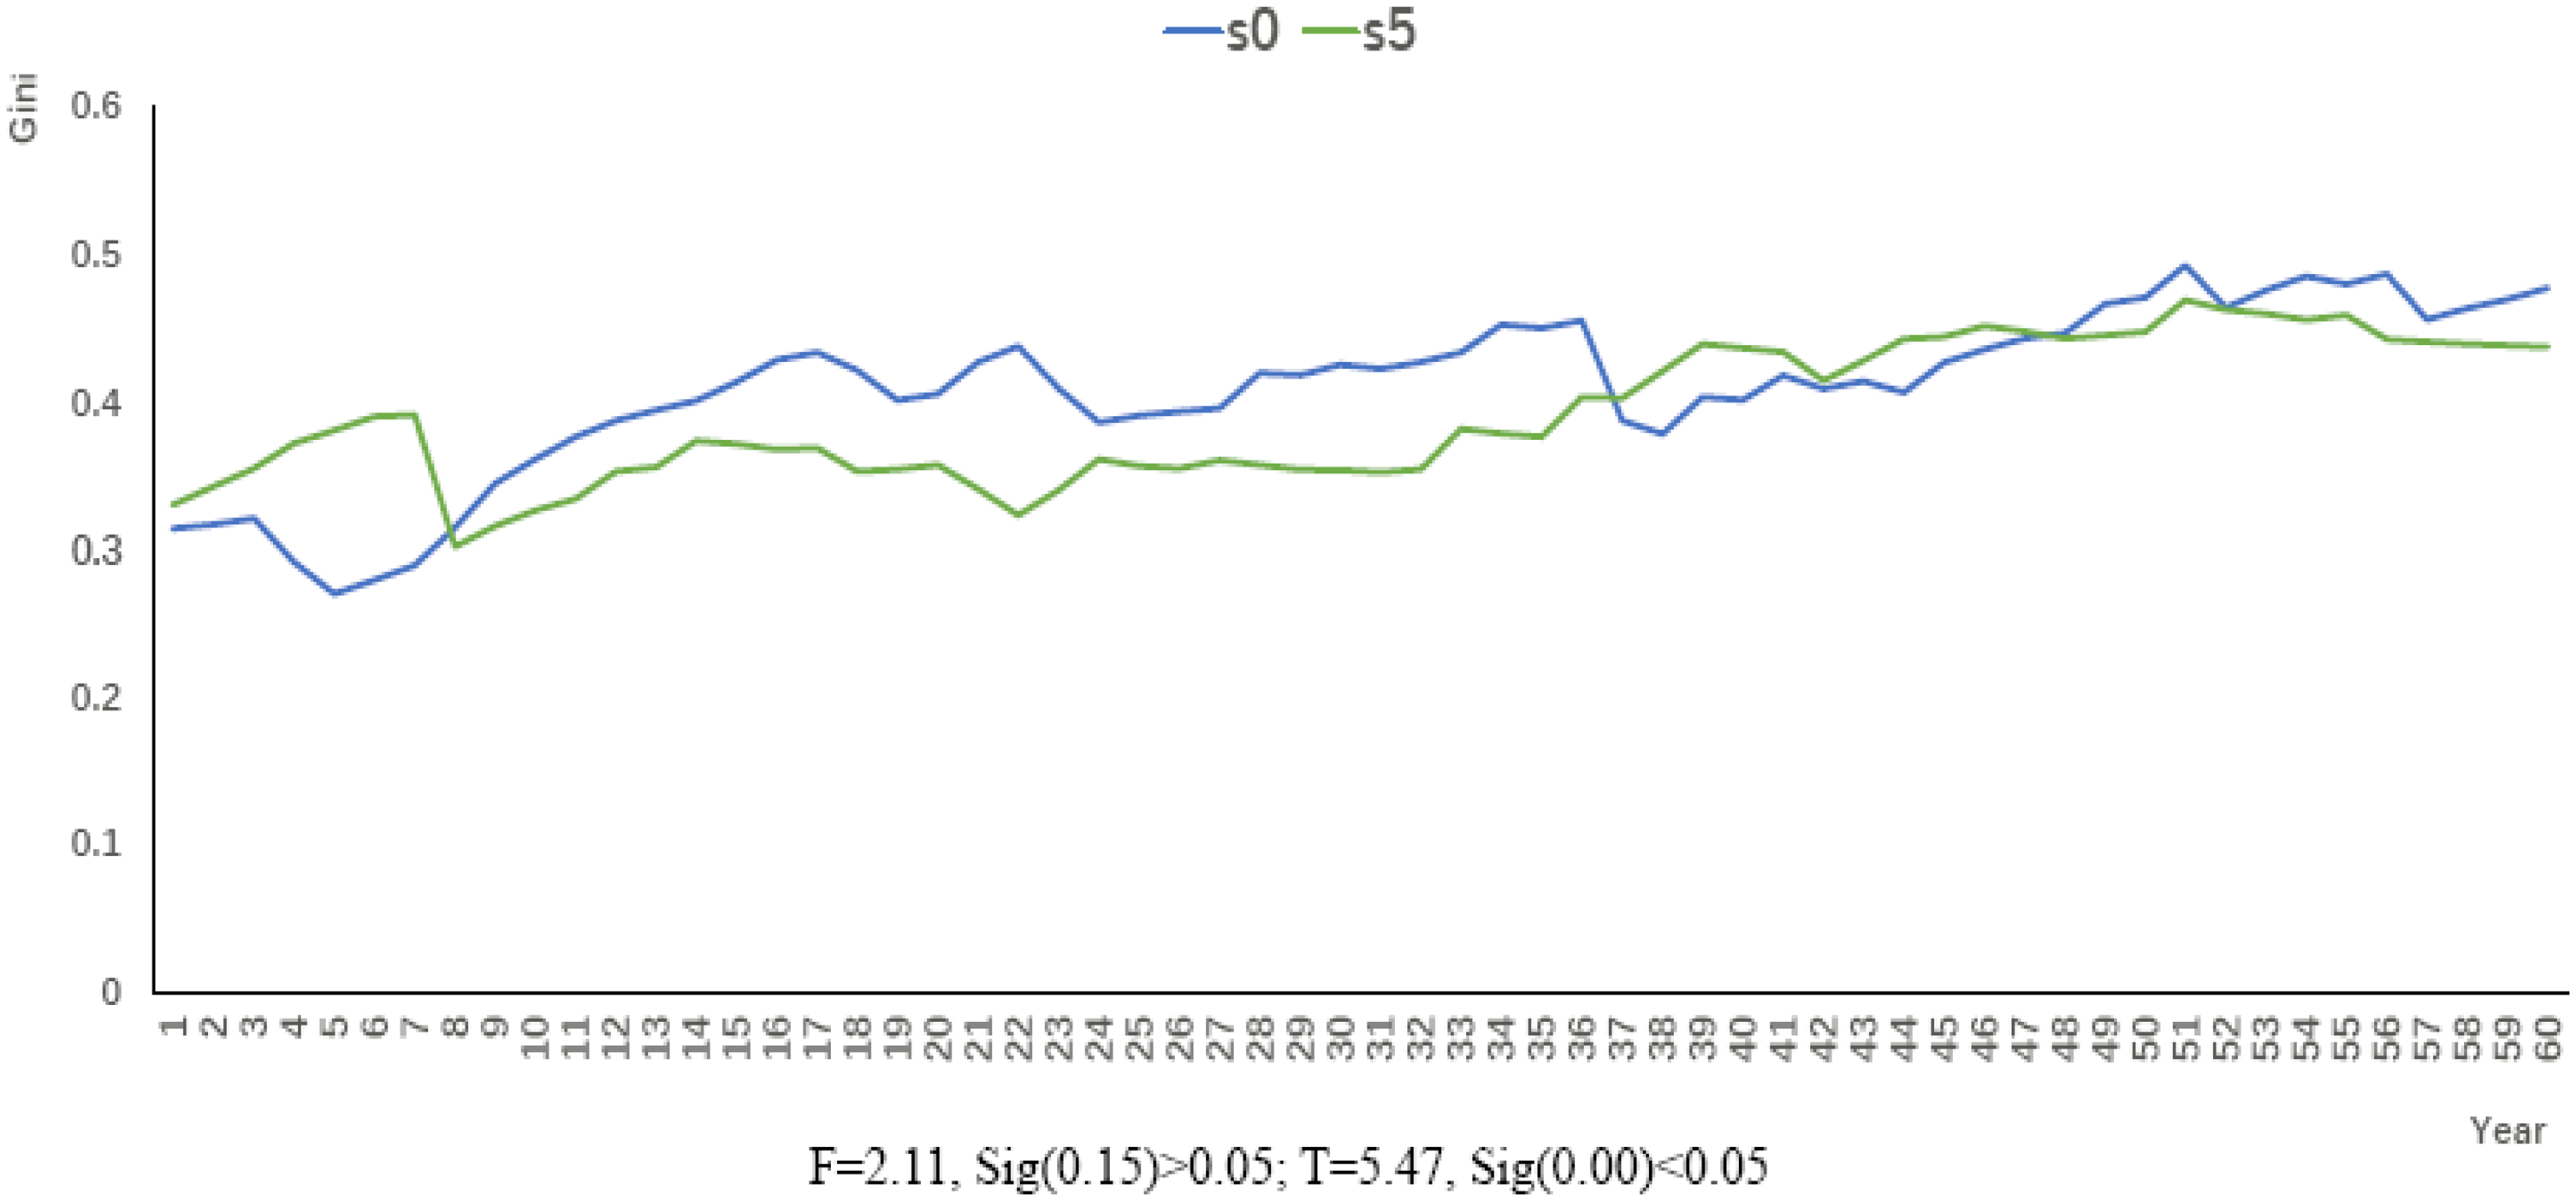
Energy growth rate and the Gini coefficient of energy consumption.
Results of optimal policy
In the simulation scenario above, after increasing the value of a specific variable, if the Gini coefficient changes significantly, then the variable in the optimal policy scenario takes that value. If there is no significant change, the variable maintains its initial value. For example, the results of running the simulation programme show significant differences in the Gini coefficient of energy consumption between the benchmark scenario and simulation scenario 1 (max-technical-level = 9). In scenario 2, the maximum energy consumption is set to a higher level, while the values of other variables remain unchanged. The simulation results show no significant difference between scenario 2 and the benchmark scenario in terms of Gini coefficient of energy consumption, therefore, energy-consumption-max = 1 (the initial value). The final values of the key variables are as follows: max-technical-level = 9, energy-consumption-max = 1, percent-rich-energy-area = 1, energy-growth-subsidy = 5, and num-energy-grown = 9. The simulation results show that the Gini coefficients obtained by combining the above variables are significantly different from those obtained in the benchmark scenario (F = 2.21, Sig (0.14)>0.05; T = 17.34, Sig (0.00) <0.05; Figure 9).
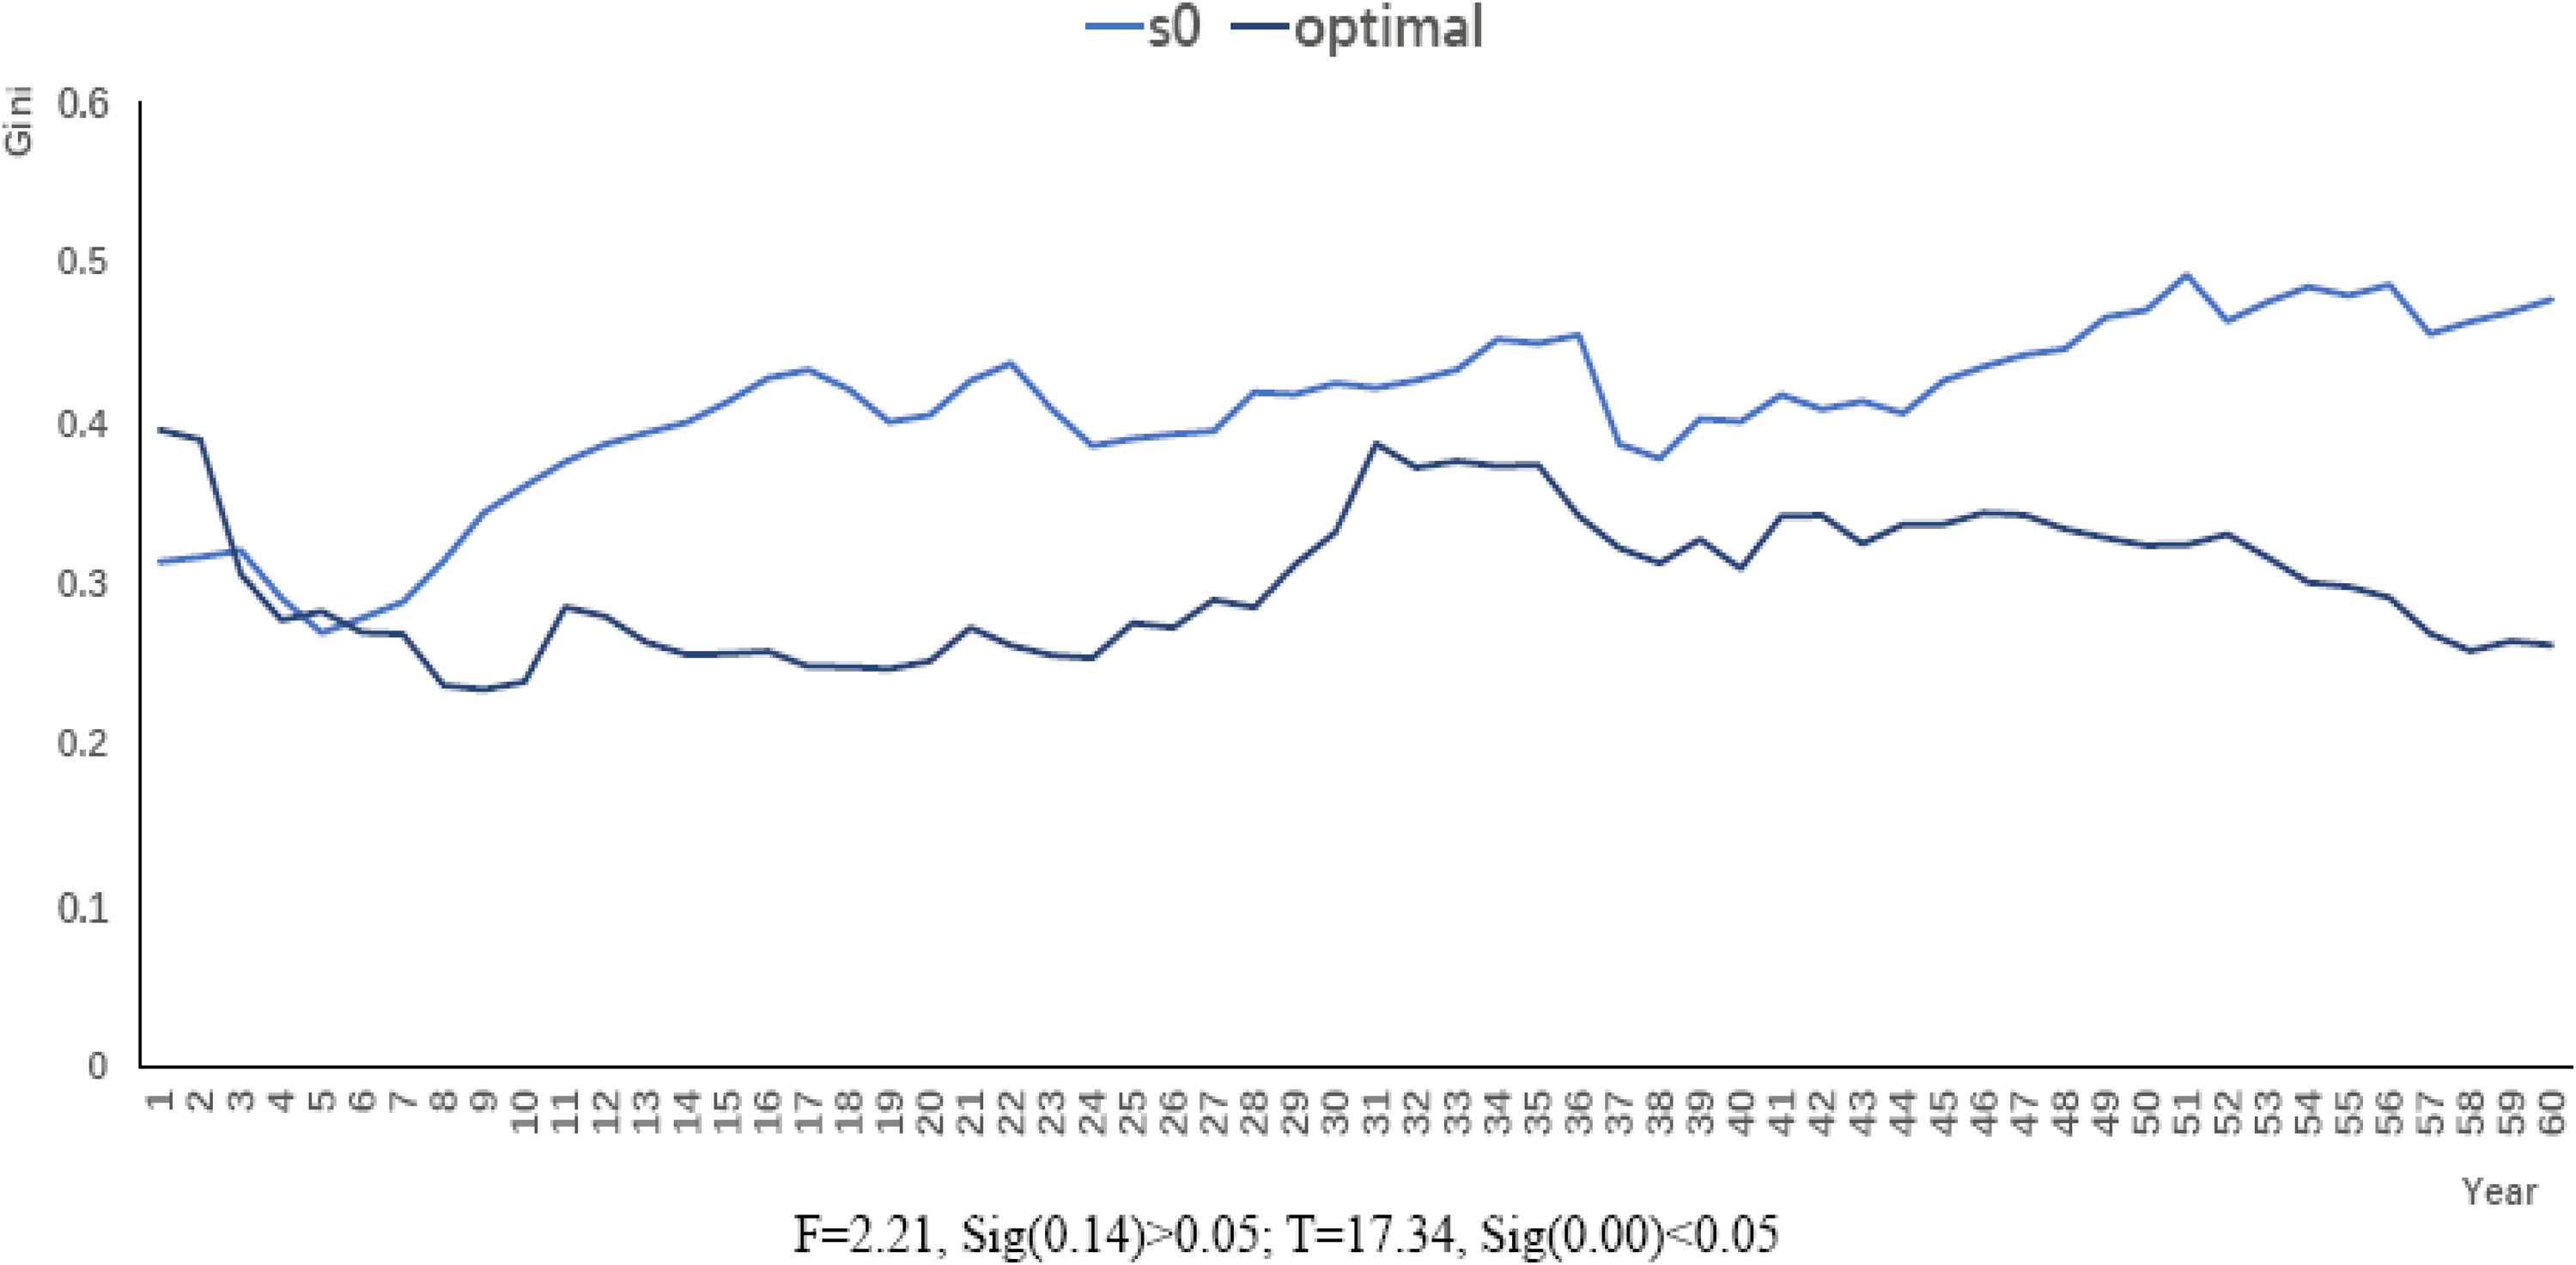
Comparison between the optimal policy scenario and baseline scenario.
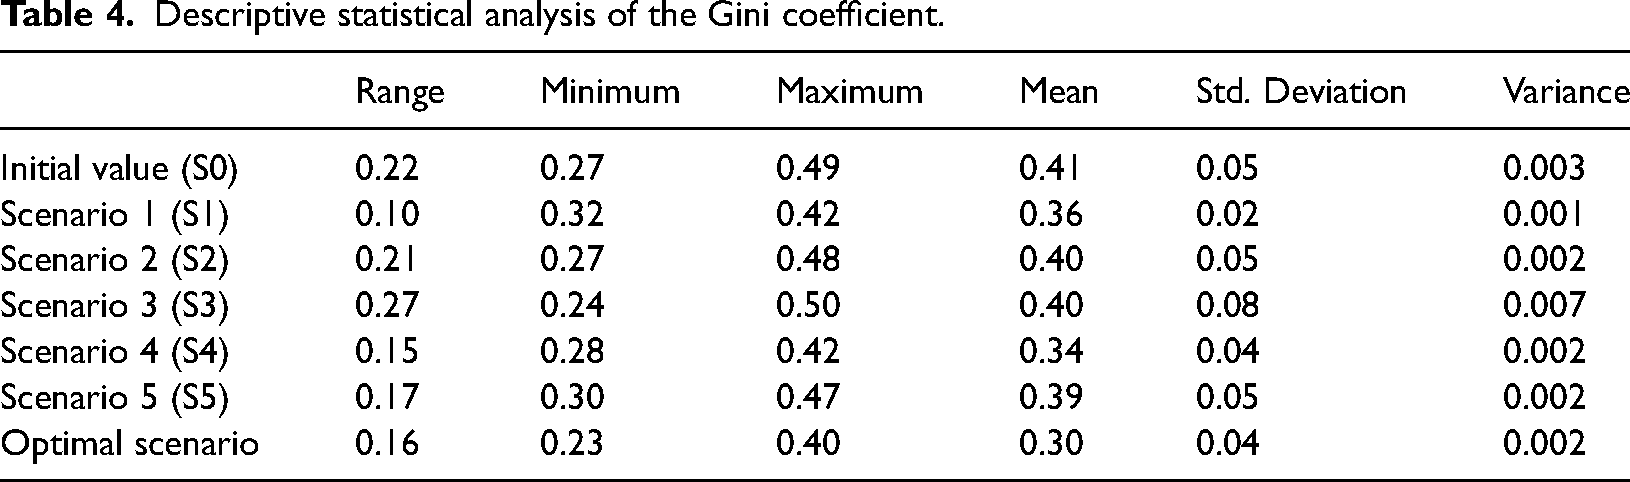
Moreover, the Gini coefficient of energy consumption obtained from the optimal policy scenario has advantages in terms of descriptive statistics compared with the other six policy scenarios. As shown in Table 4, during the whole simulation cycle, the average Gini coefficient of energy consumption in the optimal scenario is the smallest (0.30). In all other simulation scenarios, the maximum Gini coefficient is the smallest (0.40). The minimum value is 0.23, which is the smallest of all other simulation scenarios. This shows that the scenario (Figure 9) may effectively reduce the Gini coefficient of energy consumption. The policies designed accordingly are expected to achieve better results in promoting the equity of energy consumption.
Descriptive statistical analysis of the Gini coefficient.
According to the simulation results based on optimal policy combination, it is necessary to promote the technological level, increase subsidies for energy production, and promote the growth of total energy supply. This will significantly reduce inequity in energy consumption. Upgrading technologies will not only increase the types of energy sources, including new types of sustainable energy, but will also improve the efficiency of traditional energy utilization. In turn, the total amount of energy will be increased. Technological advances have enabled efficient energy supply in the poor and remote areas. Therefore, technological innovation is the main method for achieving energy equity and justice and reducing the Gini coefficient. Government subsidies and support policies still play a role in reducing inequality in energy consumption. This subsidy is for energy producers, which can increase the total supply of energy. Relatively lower energy prices ensure that underdeveloped areas will have the ability to consume modern energy.
Conclusions and suggestions
Conclusions
In this study, the author adopted the multi-agent modelling. Based on the data of 30 provinces and municipalities directly under the Central Government of China, different simulation scenarios have been designed. By controlling different influencing factors, the Gini coefficient of China's energy consumption was simulated for a period of 60 years (from 2022 to 2081). During the simulation cycle, the highest Gini coefficient is 0.50, and the lowest Gini coefficient is 0.23. It is particularly worth noting that when the Gini coefficient exceeds 0.4, which means high inequality, therefore, China may face very high inequality in energy consumption in the future. Furthermore, through different simulation experiments, three key variables have been identified in this study—technological level, government subsidies, and growth rate of energy supply. The contribution of this study is not only to predict the Gini coefficient of China's energy consumption but also to identify the key influencing factors. These conclusions are very important, which provide a decision-making basis for reducing energy consumption inequality in China, and also have reference value for other developing countries.
Suggestions
The above conclusions are conducive to the formulation of relevant policies to curb the expansion of the Gini coefficient of energy consumption and promote energy justice in China.
The most important policy involves promoting energy-related technological progress, as the technological level significantly affects the Gini coefficient of energy consumption. Therefore, increasing investment in research and development of energy-related technologies plays a very important role. These technologies include the extraction, transportation and consumption of energy. The results also indicated that government subsidies play an important role in decreasing the Gini coefficient. Therefore, appropriate regional policies should be designed. Subsidies and fiscal transfers should be distributed to energy-rich provinces. This requires overall coordination by the central government and avoidance of the vicious competition between local governments. Finally, the growth rate of energy supply is an inspiration for policy-making from the supply side. Therefore, increasing the supply of renewable energy is a very promising source of supply. Relevant supporting policies, including financial support and tax relief, can promote the development of renewable energy.
A limitation of this study is that it does not include all variables affecting the Gini coefficient of energy consumption. Only some of the influencing factors are analysed. Moreover, some parameters are artificially set with certain subjectivity. Thus, the simulation conclusion has limitations. However, against the background of the lack of long time-series data, this study is a useful exploration of the Gini coefficient of energy consumption. It will promote further research in the future such as the Zenga index, and a multi-factor analysis as well as discussing demand-side solutions.
Footnotes
Declaration of conflicting interests
The author(s) declared no potential conflicts of interest with respect to the research, authorship, and/or publication of this article.
Funding
The author(s) received no financial support for the research, authorship, and/or publication of this article.