
Abstract
A large number of studies have been conducted to examine China’s CO2 emissions problem disaggregated to the city level. However, few studies have delved further into the black box of economic production to examine the characteristics of CO2 emissions at the city supply chain level. In the context of the reality that Beijing takes the lead in achieving CO2 emissions reduction, this study decomposes CO2 emissions change in Beijing at three levels: overall, supply stage, and supply chain, using structural decomposition analysis (SDA) and structural path decomposition (SPD), filling the gap in urban CO2 emissions studies. The results show that: (i) energy consumption intensity is the most significant driver of emissions reduction, while per capita final demand is the largest factor in increasing emissions; (ii) Beijing’s emissions reduction contribution is mainly reflected in the first supply stage (76.50%) and the second supply stage (18.85%); (iii) the expansion of domestic exports and thus greater demand for transportation is significant in emissions increase supply chains; (iv) the improvement of the demand structure for electricity from domestic exports contributes a large part in emissions reduction supply chains; (v) the existence of many offsetting effects, such as the ebb and flow of domestic exports on the demand for different products, has led to the loss of emissions reduction. Finally, corresponding policy recommendations are presented from the energy, industry, and demand perspectives. Our study will provide assistance in developing more microscopic policies to reduce emissions and replicating the Beijing experience.
Introduction
As the world’s largest energy consumer, China is considered to be a key area of international efforts to reduce emissions. 1 In 2020, Chinese government has announced the goal of carbon peaking and carbon neutrality to the world based on the inherent requirement of achieving sustainable development and taking the initiative to assume responsibility for global climate change. Whether the “Double Carbon” targets can be successfully achieved requires the joint efforts of all provinces and cities in China. In recent years, China has emphasized the importance of developing low-carbon and climate-resilient cities in many national plans, such as the 14th Five-Year Plan and the National Adaptation Strategy 2035. As the political center of China, the Beijing Municipal Government has already successfully fulfilled its commitment to reach peak carbon by 2020 or even earlier. 2 The subsequent targets of green and low-carbon transformation are also reflected in the Beijing Energy Highlights 2022: the proportion of renewable energy consumption reaches 12%, the proportion of renewable electricity consumption is no less than 19%, and the proportion of high-quality energy consumption reaches over 98%. The low-carbon and green development of Beijing is not only the key question of “what kind of capital to build and how to build it,” but also a positive demonstration and leading role for other provinces and cities.
In 2020, Beijing’s carbon emissions intensity was the lowest among China’s provincial regions, dropping by more than 23% compared to 2015, exceeding the national target of “20.5% reduction.” What has driven the reduction of CO2 emissions in Beijing? Does its experience in reducing emissions have lessons for other regions in China? How can China replicate Beijing’s emissions reduction achievements? Most of the previous literature has studied the emissions increase in Beijing,3,4 which provides a valuable entry point for this study to answer the above question: at this new stage of achieving CO2 emissions reduction in Beijing, it is of greater practical importance to investigate the mechanism behind the reduction.
In the field of CO2 emissions, calculation and driver analysis occupy an important position. Calculation of CO2 emissions is the basis for quantitative analysis. 5 The energy consumption method provided by the Intergovernmental Panel on Climate Change, which relies on official statistics to estimate CO2 emissions by collating and calculating energy consumption, net calorific values and emission factors, is currently used by the majority of studies. 6 This method is characterized by the flexibility to select appropriate data to address specific research questions. 7 However, the energy consumption method requires consolidation of industry classifications in order to maintain the same caliber of energy consumption data and input–output data. 8 The dilemma between the accuracy of energy data and sectoral precision has often required significant sectoral aggregation in previous studies of Beijing’s CO2 emissions,9,10 with the common drawback that the coarse industrial classification hides some of the linkages between Beijing’s sectors, especially between the increasingly important service sectors and other sectors.
As the root causes of CO2 emissions are numerous and complex, identifying the key drivers is the only way to provide a scientific basis for the emissions reduction policy formulation. There are two main types of methods: the first is econometric. At the global level, Kirikkaleli et al. examined the long-term and causal effects of financial development and renewable energy consumption on CO2 emissions using panel data and found that global financial development and renewable energy consumption have a positive impact on environmental sustainability. 11 In a series of studies on environmental pollution in the EU, Alsaleh and Abdul-Rahim found that by increasing the share of renewable energy sources such as bioenergy and hydroelectricity in the EU national power generation corridors can effectively mitigate CO2 emissions in the region.12,13 At the single-country level, the suppressive effects of factors such as technological innovation and renewable energy consumption on CO2 emissions have likewise been extensively empirically demonstrated, both in developed14,15 and developing countries.16–18 At the city level, Huang et al. adopted the STIRPAT model to assess the key pathways to reduce emissions in Beijing under different policy scenarios and showed that energy mix upgrading and energy efficiency improvement were the key drivers. 19 Wang et al. used the STIRPAT model to examine the combined effects of socioeconomic and spatial planning factors on CO2 emissions in Chinese megacities and found that compact urban development pattern helps to reduce CO2 emissions. 20 Econometric methods have an irreplaceable contribution to the study of CO2 emissions driving effects, due to the flexibility to examine the extent and direction of each influencing factor on emissions.
The second is decomposition analysis. The key drivers of CO2 emissions changes can be explored by decomposition analysis through breaking down the changes into the contributions of various influencing factors. 21 Compared to the elasticity coefficients given by econometric methods, the advantage of decomposition analysis is to directly obtain the actual contribution of each driver to emissions. Index decomposition analysis (IDA) and structural decomposition analysis (SDA) are the two most commonly used decomposition methods. 22 The IDA method requires less data and has good research timeliness, but can only analyze the direct impact of each factor on the study indicators. 23 The SDA method has high data requirements and requires the use of input–output tables, but can provide further insight into the indirect effects caused by the interconnectedness of sectors. 24 With the growing importance of CO2 emissions in China, many scholars have conducted empirical studies on China’s emissions using SDA method based on calculation of CO2 emissions. National and regional carbon intensity changes during 2007–2012 were decomposed into intensity effect, input structure effect and final demand effect by Cao et al. to identify sectors with greater potential for intensity reduction. 25 And Li and Wei concluded that a reduction in the total amount of China’s CO2 emissions was difficult to achieve in the short term. 26 Although there are differences in indicators, models, methods, and data across the literature, there are certain commonalities in their conclusions: changes in the scale of final demand are the most important factor in the increase of CO2 emissions, while the decrease in carbon intensity is the main reason for the reducing total emissions. 27
However, SDA is still essentially a macro analysis and cannot be used to examine CO2 emissions from a product life cycle perspective. 28 In 2007, Lenzen proposed the structural path analysis (SPA) method, which decomposed total emissions into emissions from an infinite number of supply chains in the production system. 29 By opening the “black box” of the national economic network, the key supply chains that influence CO2 emissions have finally been identified. 30 In 2009, Wood and Lenzen constructed the structural path decomposition (SPD) method based on SPA and SDA to achieve the decomposition of drivers of emissions changes at the level of supply chains. 31 Notably, the characteristics of CO2 emissions at the micro level usually vary with the stage of economic development. Gui et al. decomposed the changes in life-cycle CO2 emissions driving China from 1992 to 2007 and found that “Chemical industry → export” was the most important supply chain. 32 Li et al. found that the CO2 emissions in the supply chain in the category of “electricity industry → (intermediate sector) → consumption demand” during 2002–2017 needs to be emphasized. 33 To the best of our knowledge, most of the previous literature using SPD method to study China’s CO2 emissions focuses on the country as a whole,34,35 which cannot reflect the characteristics of CO2 emissions in individual provinces and cities such as Beijing.
In summary, although a large number of studies have been conducted on CO2 emissions in China and Beijing, there are still gap areas that need to be explored. Most existing studies of city-scale CO2 emissions are too macro for specific policy guidance, and few studies have explored the characteristics of emissions at the city scale in China from the supply chain perspective. This is necessary because the differences in CO2 emissions between cities depend largely on the details of their respective development patterns, industrial links, and trade status. 36 Therefore, in this study SDA and SPD models are used to investigate the changes in CO2 emissions in Beijing from 2012 to 2017 and the drivers behind them. In addition, CO2 emissions along the supply chains are often accompanied by the transfer of products from the upstream industrial sector to the downstream service sector and then to the consumption chain. A coarse classification of service sectors can lose the ability to effectively identify key emission pathways. In order to make the study results more precise, maximum sectoral precision, especially for the service sector, is retained, a point generally ignored by previous studies. Furthermore, CO2 emission-reducing and CO2 emission-increasing supply chains were given equal treatment in this study. This is of great interest to Beijing, which has already achieved carbon peaking, because this approach reveals both the emissions reduction path that Beijing has achieved and the follow-up efforts that are still needed.
A research perspective that encompasses macro and micro levels (overall, supply stage, supply chain) is expected to provide pioneering experiences that can be applied to low-carbon development in cities around the world. The remaining parts are organized as follows: section “Material and methods” introduces the method that calculating CO2 emissions and SDA method and SPD method; section “Results and discussion” decomposes and analyzes the CO2 emissions changes in Beijing at three levels: overall, supply stage, supply chain; section “Conclusions and policy recommendations” presents the main conclusions and policy implications.
Material and methods
Accounting of CO2 emissions from energy consumption
In this study, CO2 emissions in Beijing are computed with reference to the Intergovernmental Panel on Climate Change (IPCC) Guidelines
37
and the study by Tian et al.
38
Structural decomposition analysis
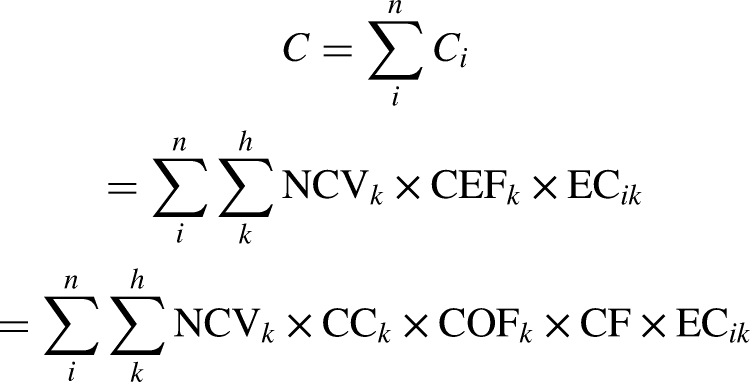
Total CO2 emissions can be expressed as the product of carbon emission intensity and total output. Based on the equilibrium relationship of the input–output table, equation (2) is obtained:

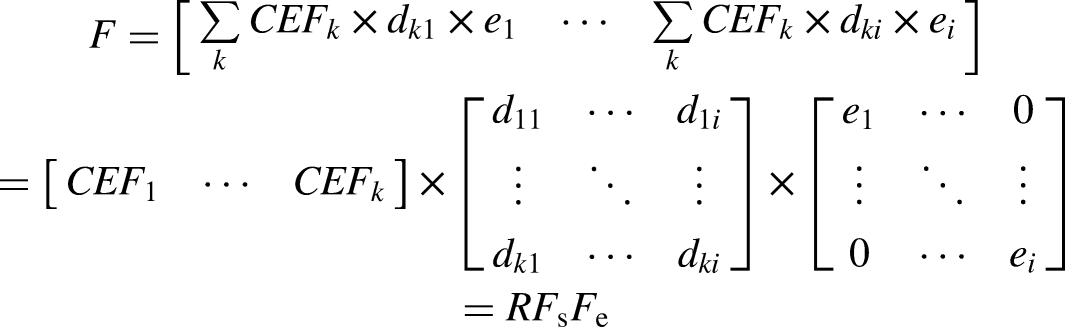
Re-decomposition of the carbon emission intensity matrix (F) leads to equation (3):
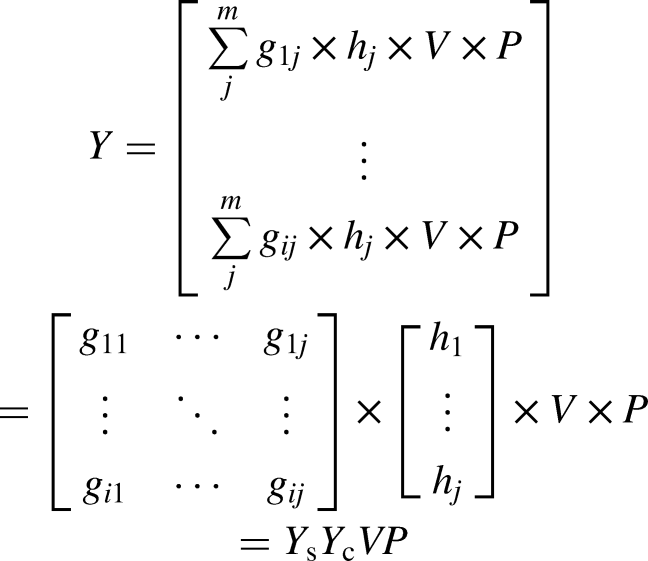
Re-decomposition of the final demand matrix (Y) leads to equation (4):
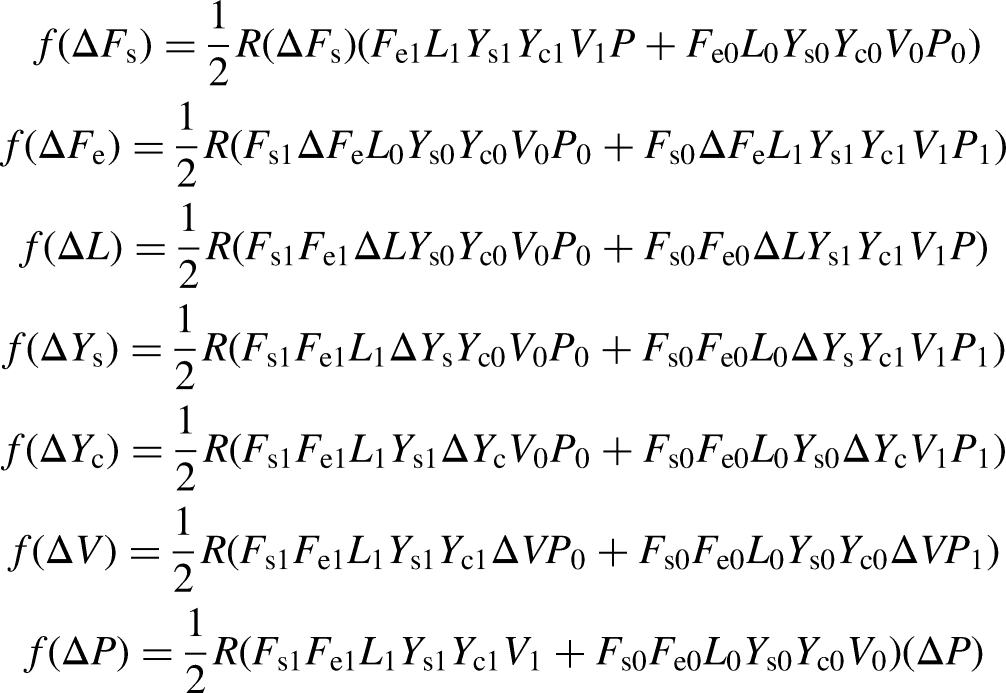
Based on equations (2)–(4), the decomposition of total emissions can be obtained as shown in equation (5):


Structural path decomposition
An economic system can be viewed from a product life cycle perspective as the sum of numerous supply chains consisting of interconnected production sectors. These supply chains start in the supply sector, pass through the various product processing sectors and end in final demand.
Taylor expansion is used to handle the Leontief inverse matrix:


Data sources and processing
Data sources
The calculations and analyses in this study are mainly based on input–output table data and energy-related data of Beijing. 2012 and 2017 input–output tables are obtained from the China Regional Input–Output Tables compiled by the Department of National Economic Accounting of the National Bureau of Statistics. 40 Energy consumption data were taken from the Beijing Statistical Yearbook. 41 To ensure that the calculations are more in line with the actual situation in China, the data required to calculate CO2 emissions are taken from the China Energy Statistical Yearbook 42 and the Beijing Statistical Yearbook. 41
Data processing
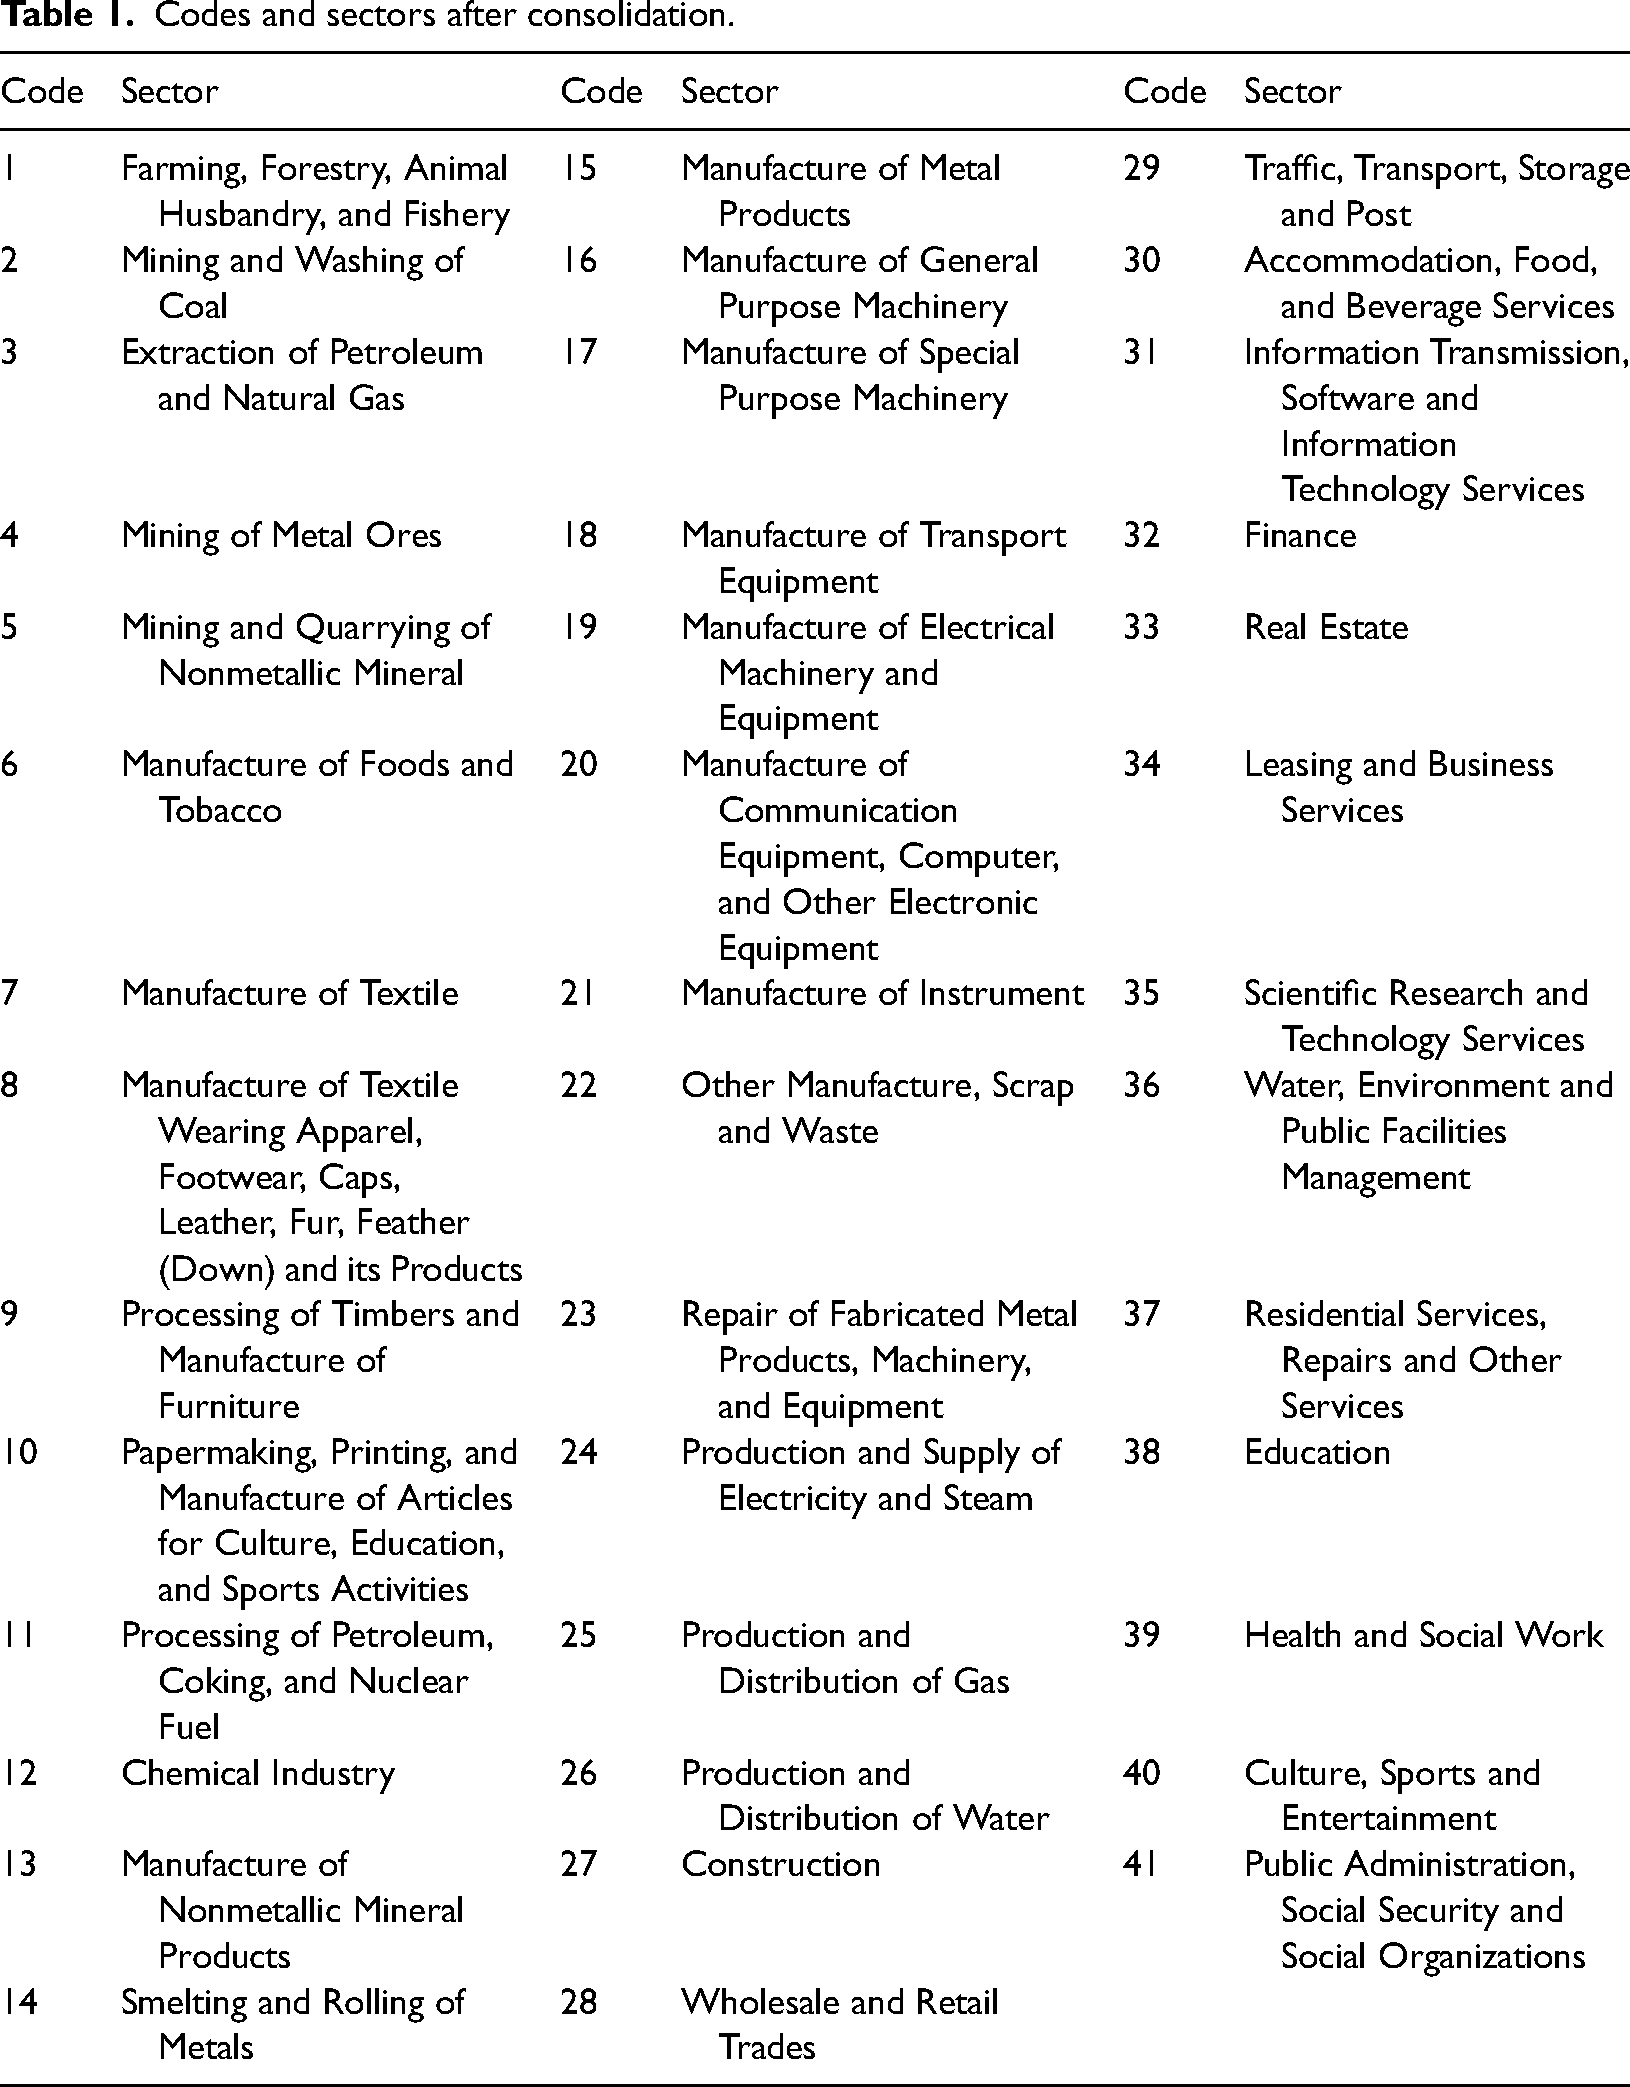
First, the sectoral classifications of input–output tables for 2012, 2017 as well as energy consumption in Beijing in 2012 and 2017 are not an exact match. In order to ensure the consistency of the caliber of the input–output sectoral classification and the energy statistics sectoral classification, while maximizing the retention of the linkage of product flows between sectors, the sectors of the national economy were merged into 41 sectors. The results of the consolidation are shown in Table 1.
Codes and sectors after consolidation.
Second, in order to remove the influence of price changes on input–output data in different years, we need to construct comparable price input–output tables. “Agricultural production price index,” “Industrial ex-factory price index,” “Construction and installation price index,” “Retail commodity price index,” and “Value added index for transportation, storage and postal industries and other industries” were used to adjust the input–output table for 2017 to an input–output table with comparable prices from 2012.
Finally, the treatment of non-competitive input–output tables follows the method used by Weber et al., 43 which assumes that the use of imports is the same across intermediate use sectors and domestic end-use sectors, then subtract the use of imports from them to get the input–output table of domestic products. Most of the studies that have been conducted on selected provinces and cities are based on this method, which simply sums domestic import with foreign import and domestic export with foreign export and then treats them non-competitively. 44 However, in practice, it is found that the intra-city supply of Beijing in many sectors shows negative values. Considering the trade characteristics of Beijing and the economic principles behind it, the following distinction is made between import product flows and export product flows in Beijing, following the original assumptions of Weber et al.: foreign import is still not used for foreign export but are used for domestic export, while domestic import is used for both domestic export and foreign export. Eventually, the total foreign import and total domestic import into each sector are separated to create a non-competitive input–output table.
Results and discussion
Changes in CO2 emissions from a holistic perspective
The accounting results show that Beijing’s total CO2 emissions (including the residential consumption component) decreased from 98.09 Mt in 2012 to 85.19 Mt in 2017, a reduction of 13.15%, which is a significant reduction.
From the overall view (see Figure 1), the majority of sectors achieved emissions reduction during 2012–2017. The sector with the largest emissions reduction is sector 24 (Production and Supply of Electricity and Steam), which reached 4.51 Mt, accounting for 22.69% of the total emissions reduction. The six sectors with the most significant CO2 emissions reduction achieved 13.86 Mt of emissions reduction, accounting for 69.78% of the total emissions reduction. However, there are still six sectors where CO2 emissions are increasing, and the two sectors with the most significant increase emissions are sector 29 (Traffic, Transport, Storage, and Post) and sector 25 (Production and Distribution of Gas), with a total increase of 5.41 Mt, accounting for 97.63% of the total increase in emissions.
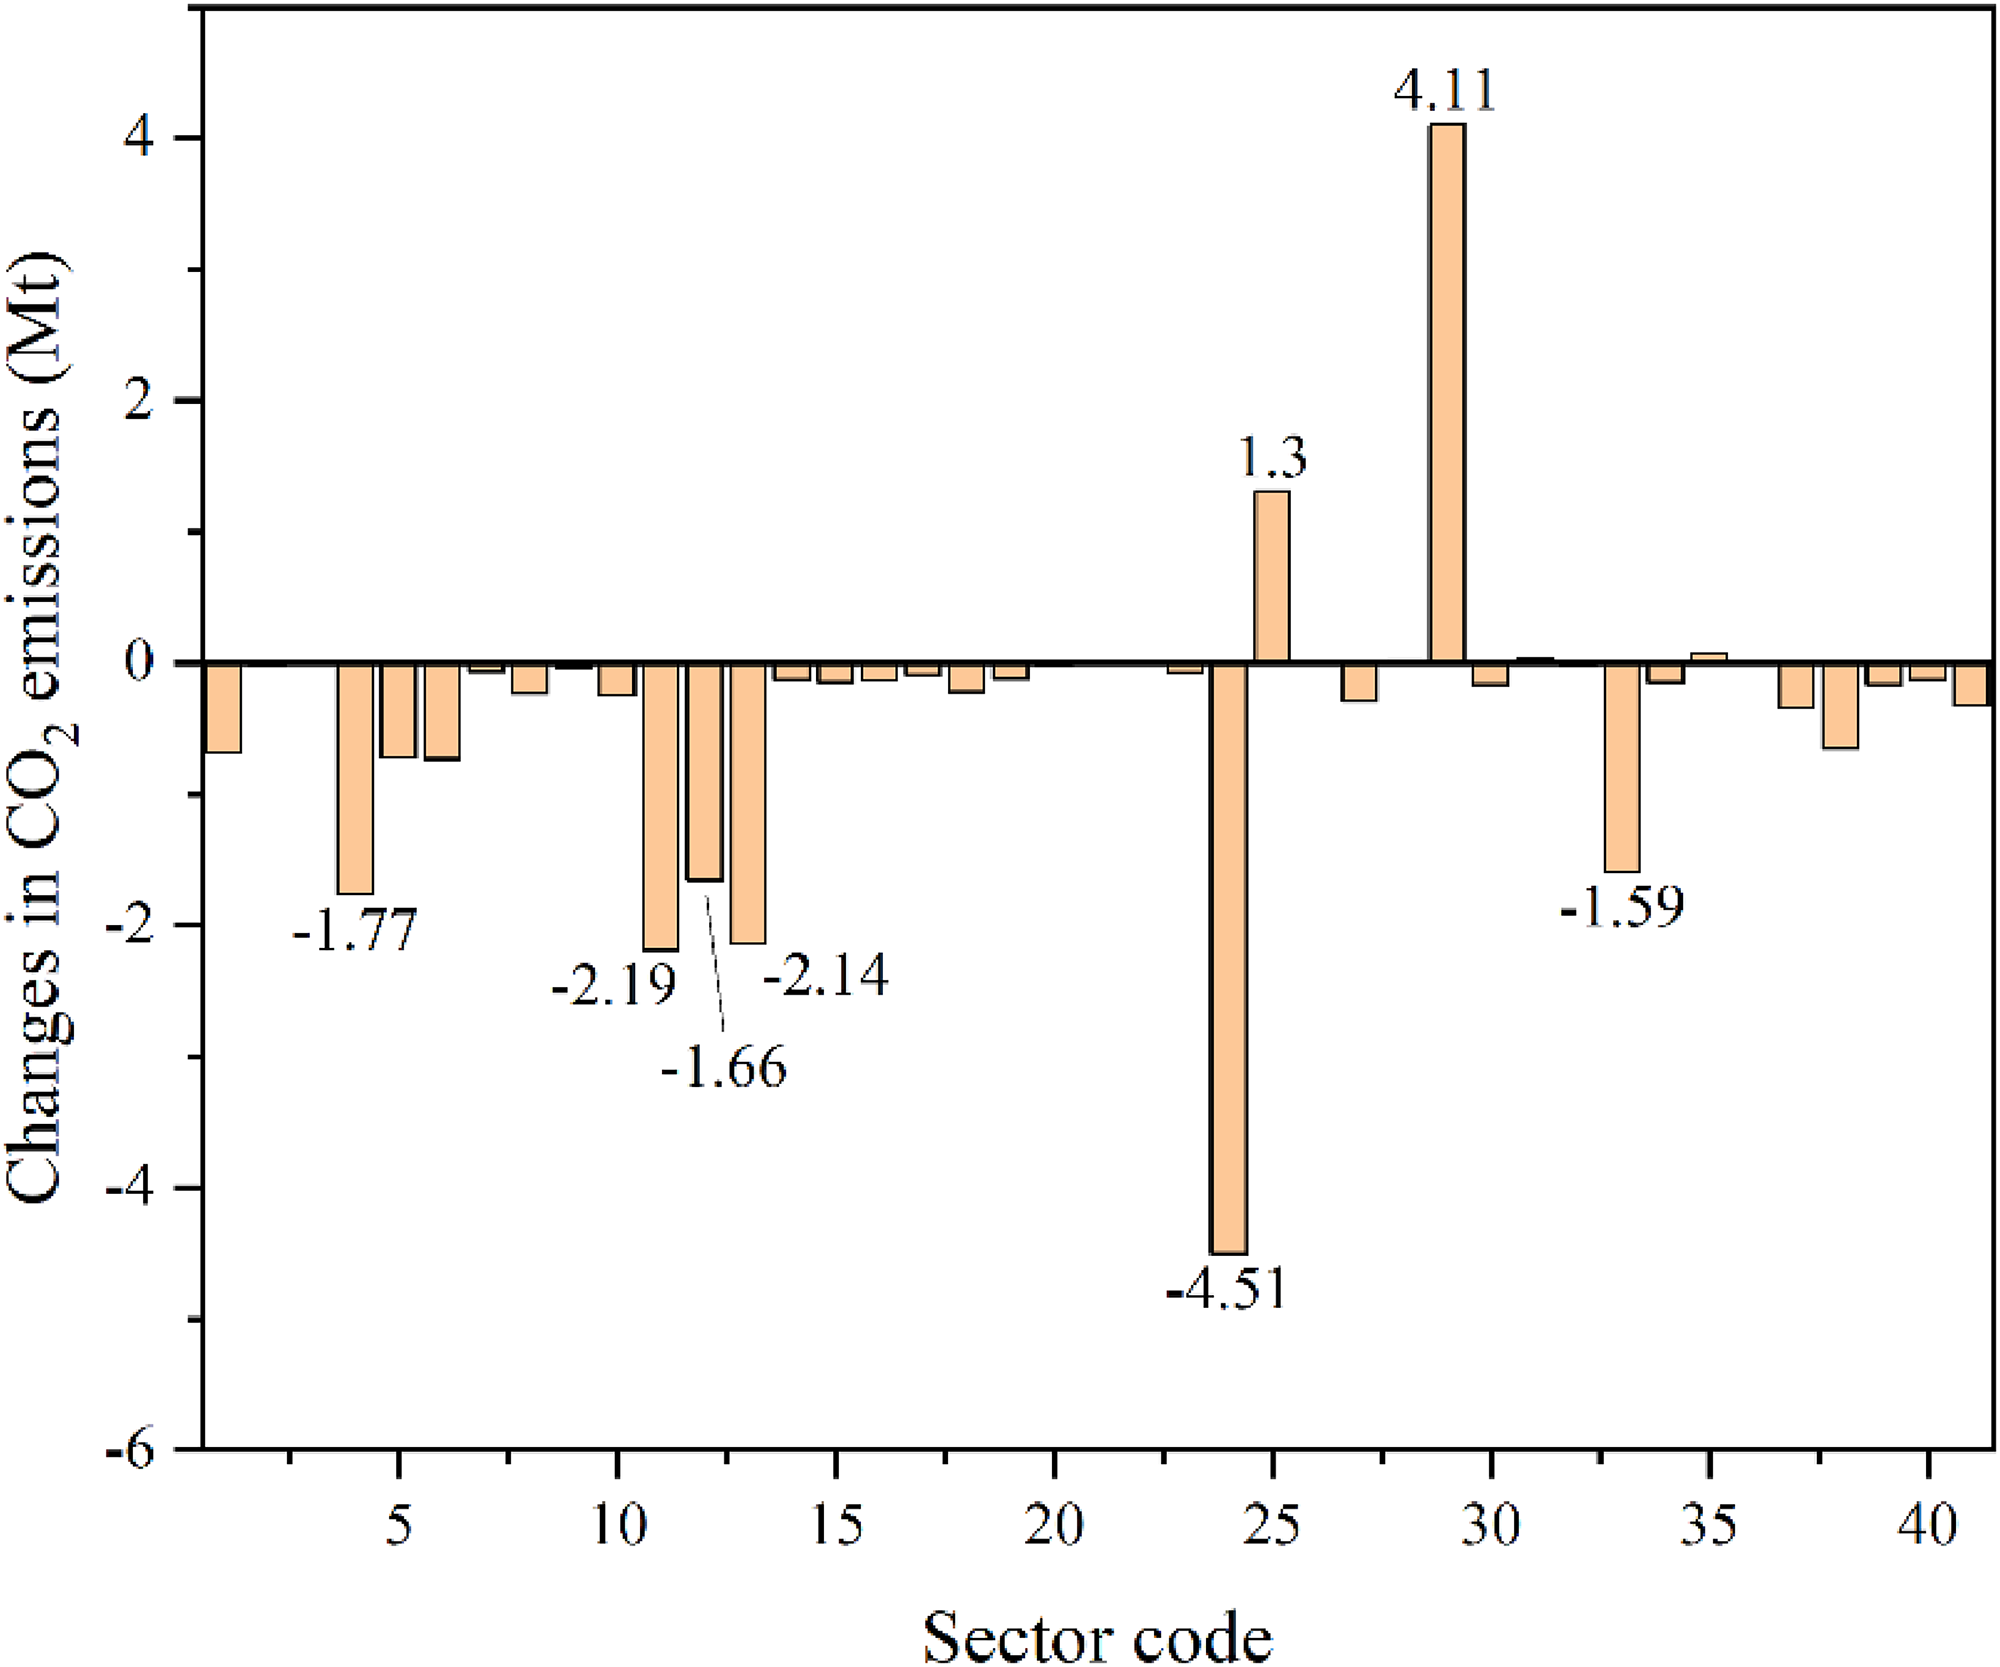
Changes in sectoral CO2 emissions in Beijing during 2012–2017. Source: Beijing Statistical Yearbook (2012, 2017).
The results of the decomposition of total CO2 emissions changes are shown in Figure 2. Both energy consumption structure and intensity contributed to CO2 emissions reduction, with their contribution rates of 66.16% and 177.95%, respectively. This indicates that Beijing has made considerable progress in tackling emissions from an energy consumption perspective. The final demand structure contributed 105.07% to emissions reduction, indicating that Beijing’s consumption demand for products in high-carbon sectors has been significantly curbed. Other effects related to final demand, on the other hand, inhibit emissions reduction in Beijing. The most significant of these factors is the size of demand per capita, which contributes −180.01% to emissions reduction. Similar to the type of final demand and growth of resident population, the input–output structure also played a smaller role in inhibiting emissions, with the contribution of the three being −38.85%, −25.18%, and −5.14%.
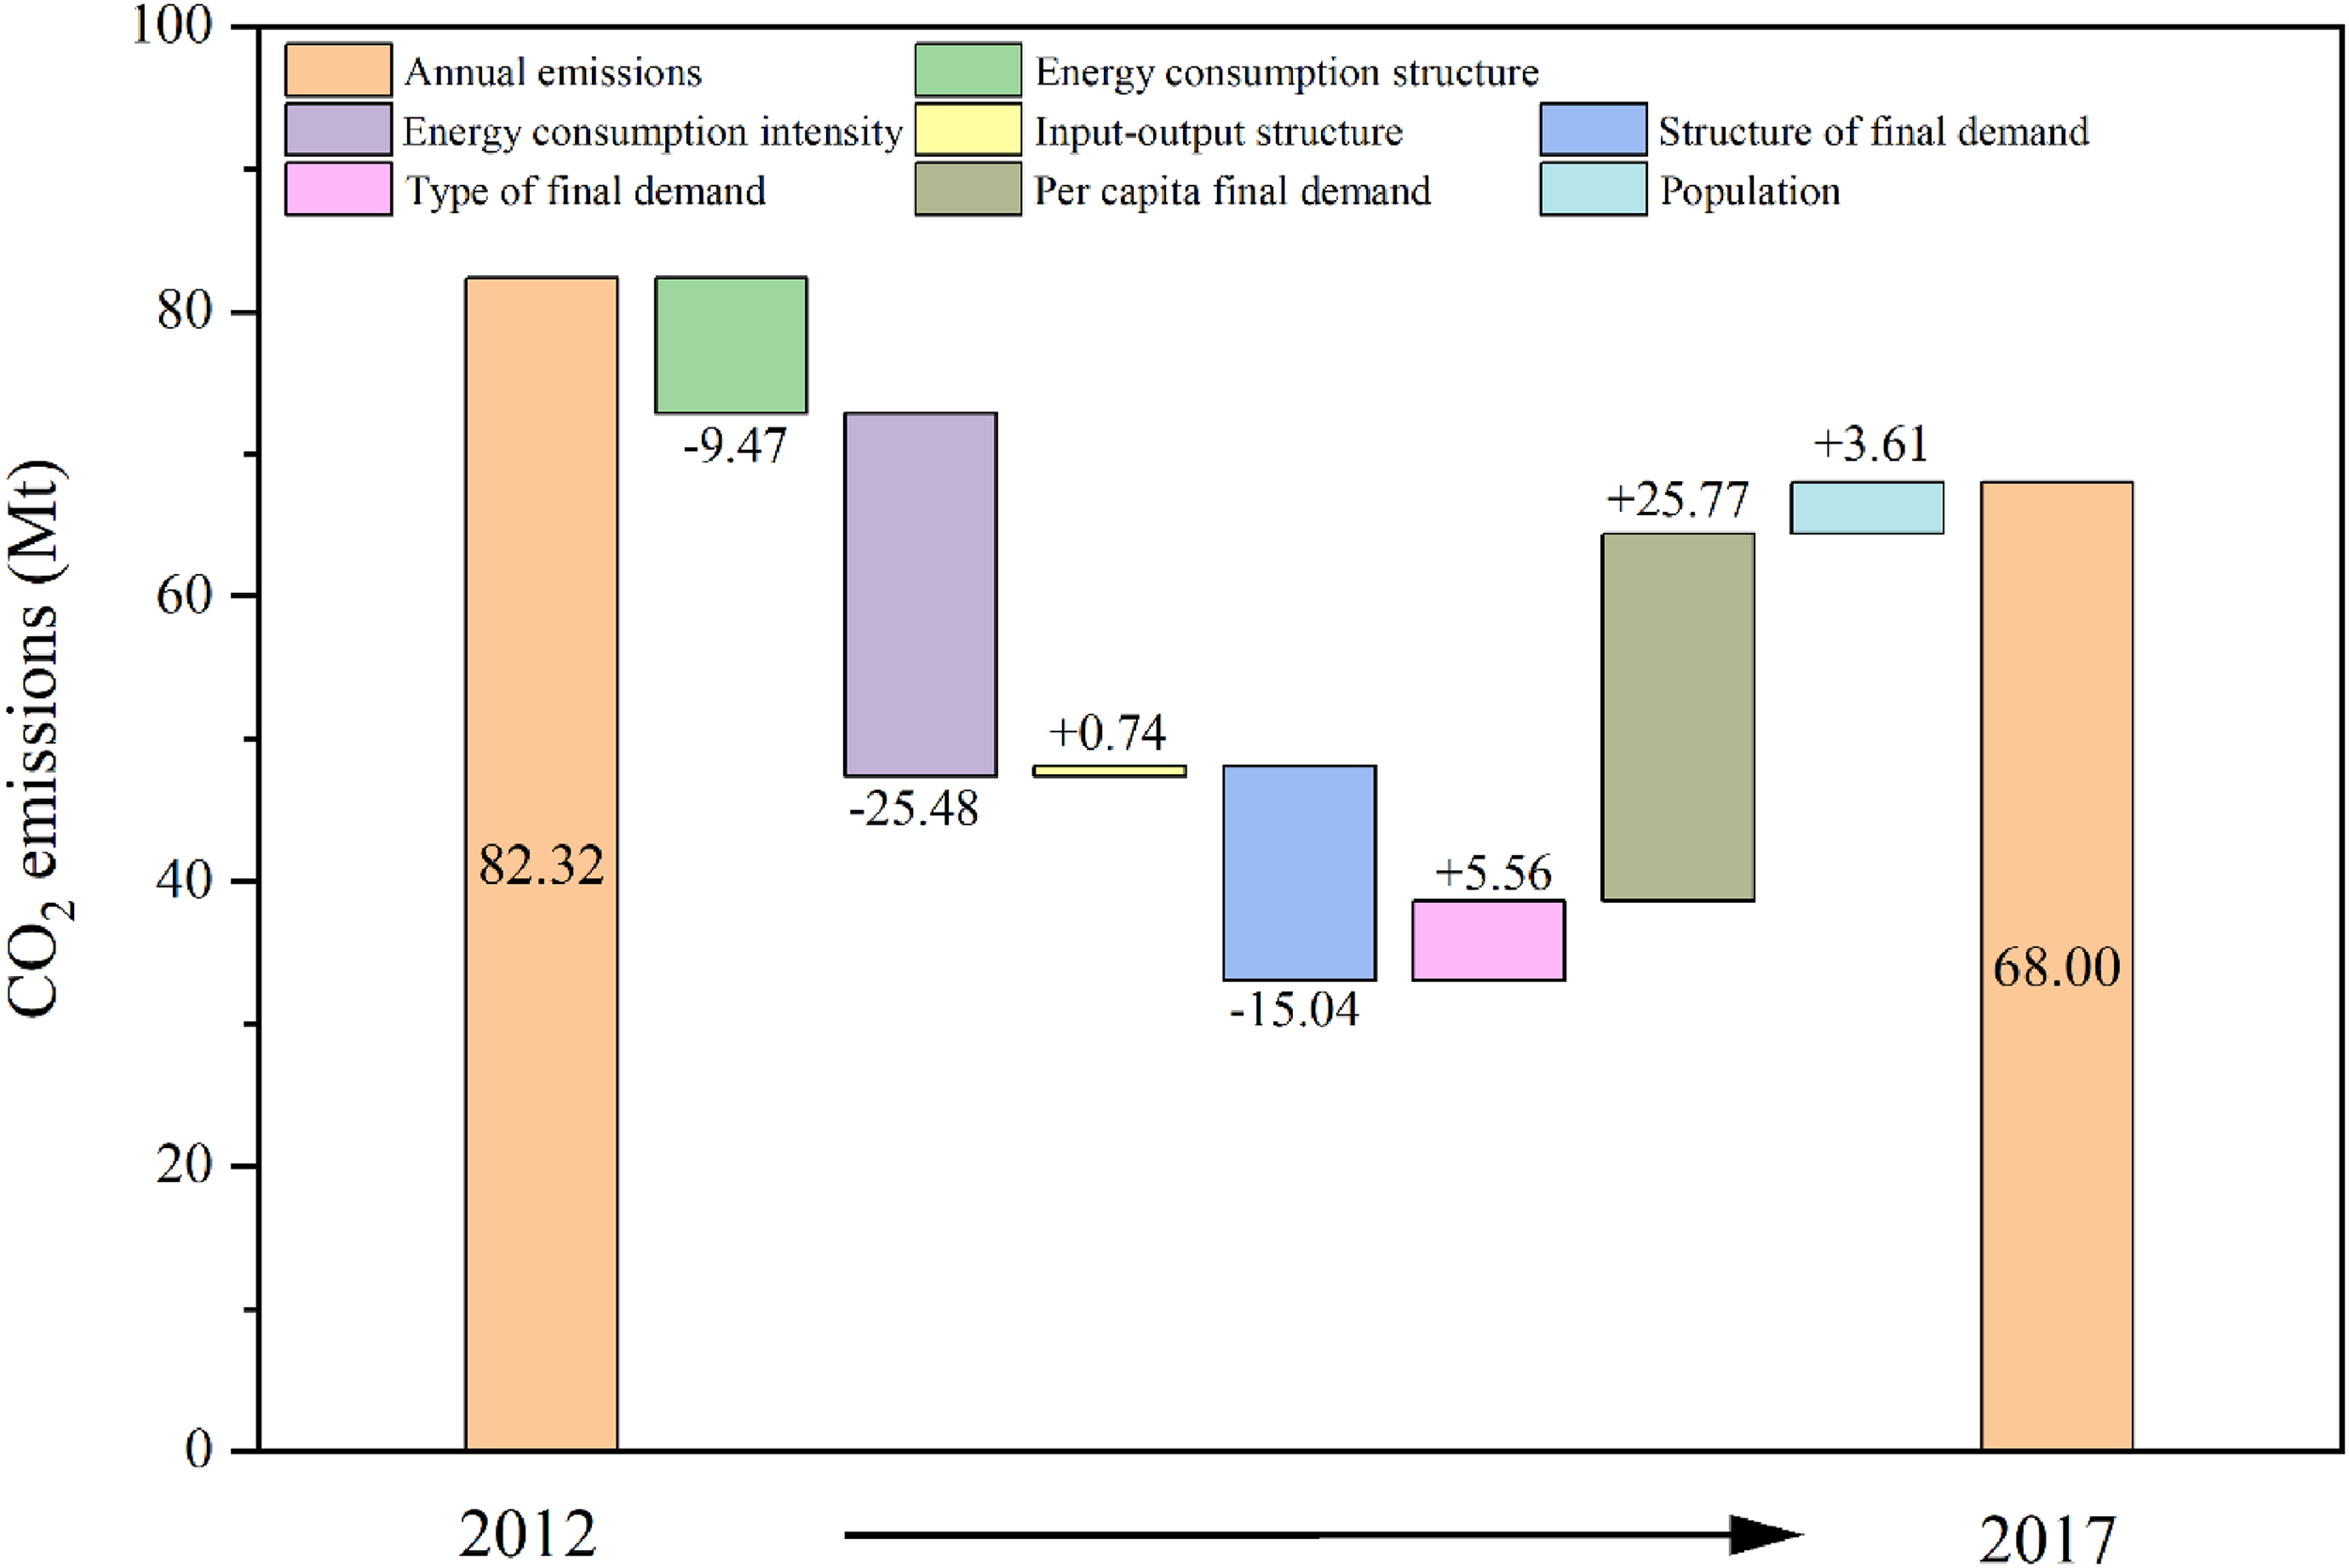
Decomposition of total CO2 emissions changes in Beijing during 2012–2017.
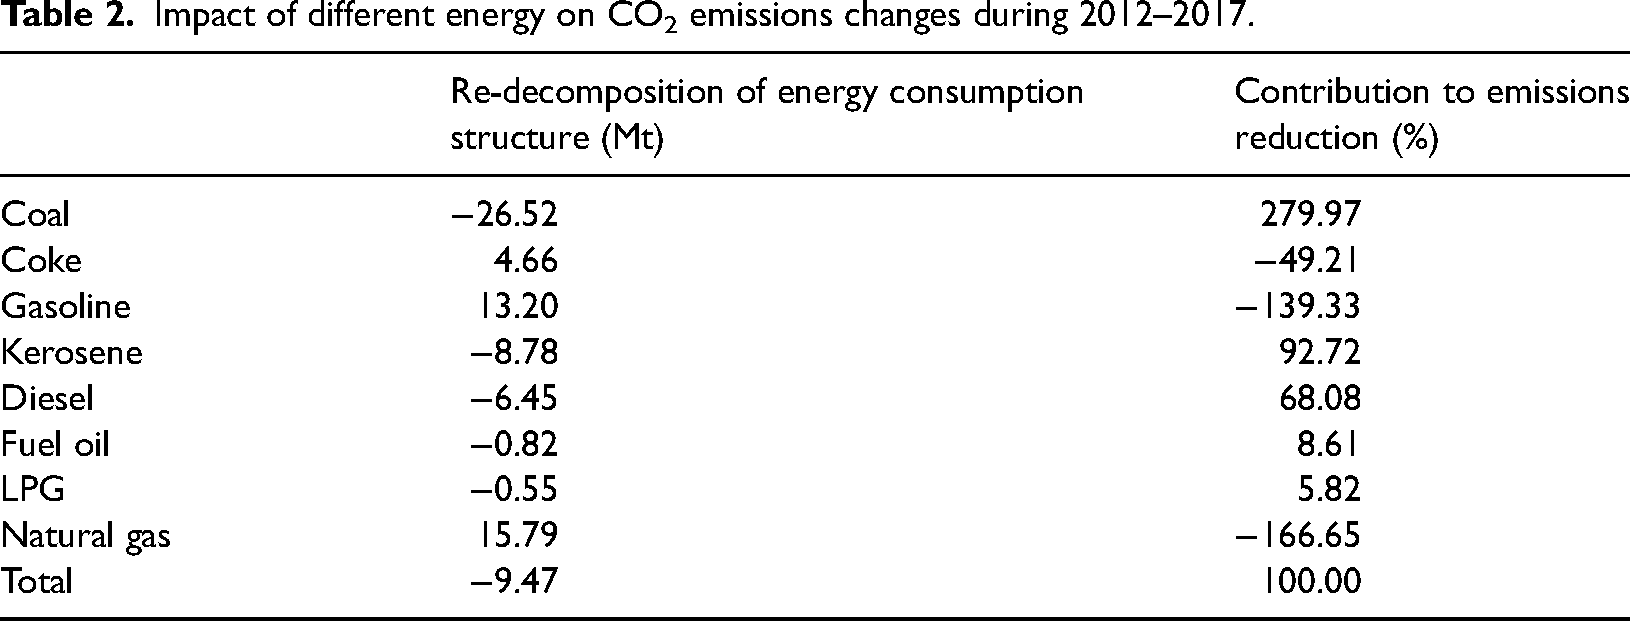
A cleaner energy mix is at the heart of environmental sustainability. 45 By re-decomposing the energy consumption structure, the impact of changes in the share of each type of energy consumption on CO2 emissions can be obtained. As shown in Table 2, the improvement of coal consumption structure led to a reduction of emissions by 26.52 Mt, which contributed 279.97% to the emissions reduction and played a great role in promoting emissions reduction. Also playing a role in promoting emissions reduction are kerosene (92.72%), diesel (68.08%), fuel oil (8.61%), and LPG (5.82%). However, the change in the consumption structure of coke, gasoline, and natural gas increased CO2 emissions by 46.61 Mt, 13.20 Mt, and 15.79 Mt, respectively, with a combined contribution to emissions reduction of −355.19%, significantly pulling down the final emissions reduction effect of energy consumption structure improvement. This is due to the fact that Beijing has made a sustained reduction in CO2 emissions intensity a goal of economic and social development.19,46 Coal and other high-emissions energy sources are undoubtedly the main focus of emissions reduction efforts, so the consumption structure of these energy sources has improved significantly. However, the inertia of economic development makes the energy demand still exist, and the energy gap brought by the reduction of high-emission energy consumption inevitably triggers an increase in the consumption of relatively clean energy sources such as coke, gasoline, and natural gas. The “coal to electricity” and “coal to gas” make the reduction of CO2 emissions is offset accordingly, and the emissions reduction effect of improving energy structure is discounted. 47
Impact of different energy on CO2 emissions changes during 2012–2017.
By re-decomposing the final demand structure and re-decomposing the final demand type, the impact of the change of each type of final demand on CO2 emissions can be obtained. As shown in Table 3, among the final demand structure, those that played a contribution to emissions reduction were rural residential consumption (0.69%), fixed capital formation (18.43%), inventory change (0.86%), and domestic export (94.72%). As for urban residential consumption (−0.53%), government consumption (−3.66%), and foreign exports (−10.51%), there is still a need to lead the low-carbon consumption habits through the upgrading of consumption structure and the transformation of the economic development mode. Among the type of final demand, those that have played an abatement role are government consumption (24.25%), fixed capital formation (27.93%), and foreign exports (78.12%), indicating that the share of these three final demands in total final demand is decreasing. Conversely, other types of final demand with increasing shares lead to an increase in CO2 emissions. Among them, the increase in the share of interprovincial transfers out is the most prominent, leading to a significant emissions increase effect.
Impact of different final demand on CO2 emissions changes during 2012–2017.
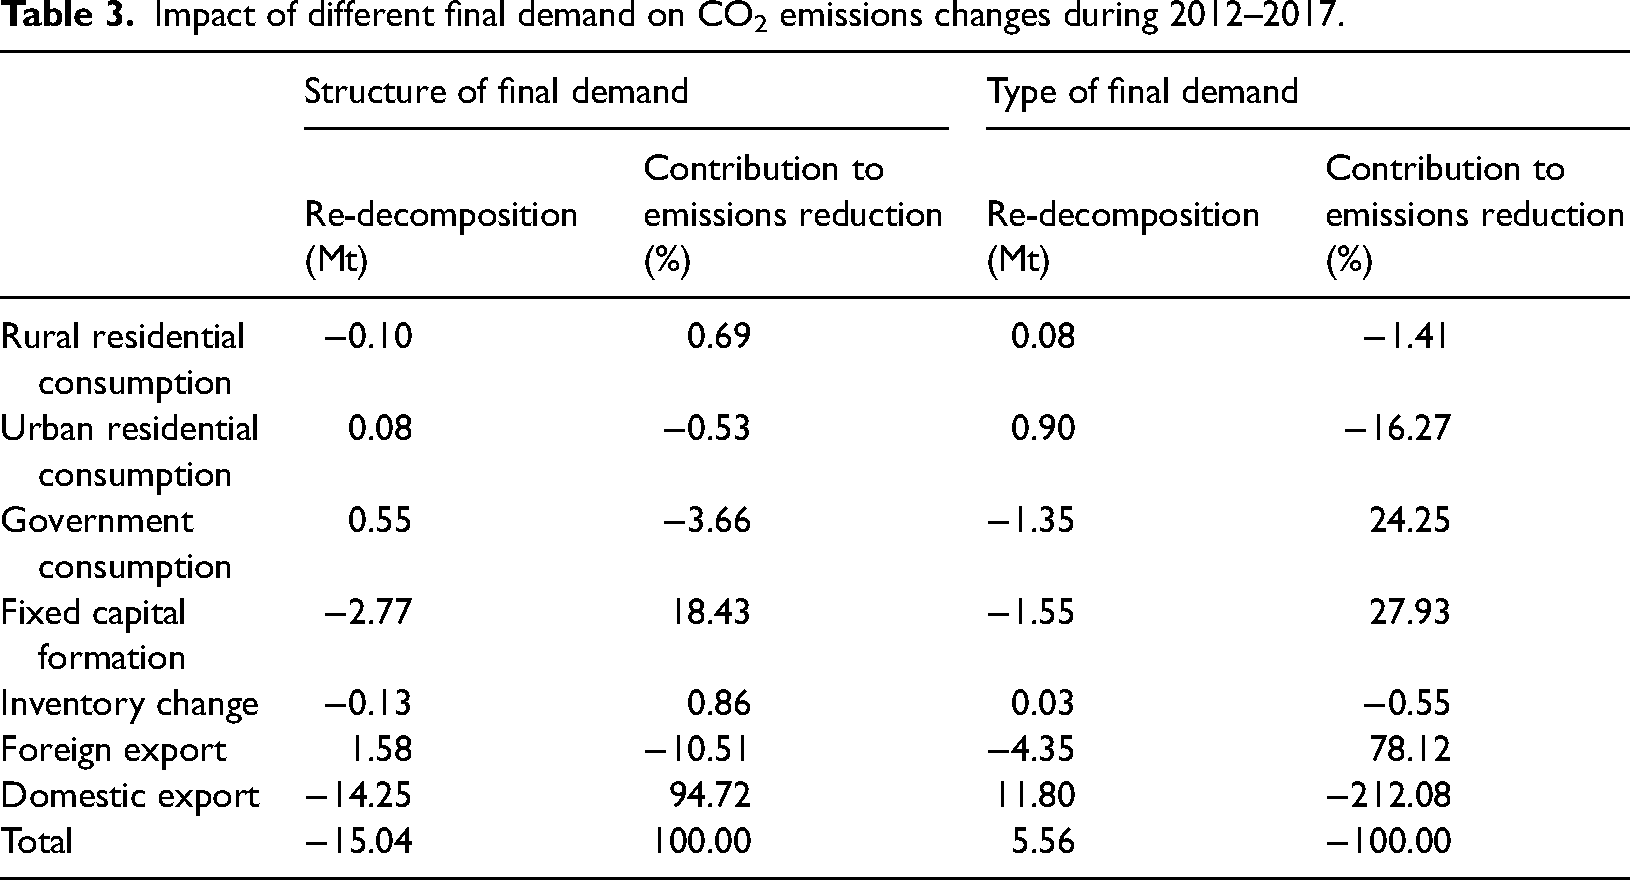
From the results of the decomposition of the two effects of final demand, the most important factors are all domestic export. However, the impact of domestic export on CO2 emissions is one positive and one negative in these two effects of final demand, which eventually offset most of the emissions reduction results. On the one hand, Beijing continues to improve its industrial structure, and the reduction of products with high emissions characteristics and the increase of service products in domestic export have brought significant emissions reduction effectiveness. On the other hand, Beijing continues to strengthen its function as a trade hub, and the scale of domestic export continues to expand, thus leading to an increase in CO2 emissions.
Changes in CO2 emissions from a supply stage perspective
The CO2 emissions and changes for the first three supply stages, which explain 99.12% of the total CO2 emissions changes, are shown in Figure 3. In terms of absolute amount, CO2 emissions decrease with the increase of supply stages. The largest amount of CO2 is emitted in the first supply stage, accounting for 57.7% of the total emissions in 2012 and 53.74% of the total emissions in 2017. In terms of the amount of change, CO2 emissions reduction also decreases with the increase of the supply stages. The first supply stage is the most effective in emissions reduction, contributing 76.50% of the total emissions reduction. The second supply stage contributes 18.85% of the reduction, and the subsequent supply stages contribute a total of 4.65%.
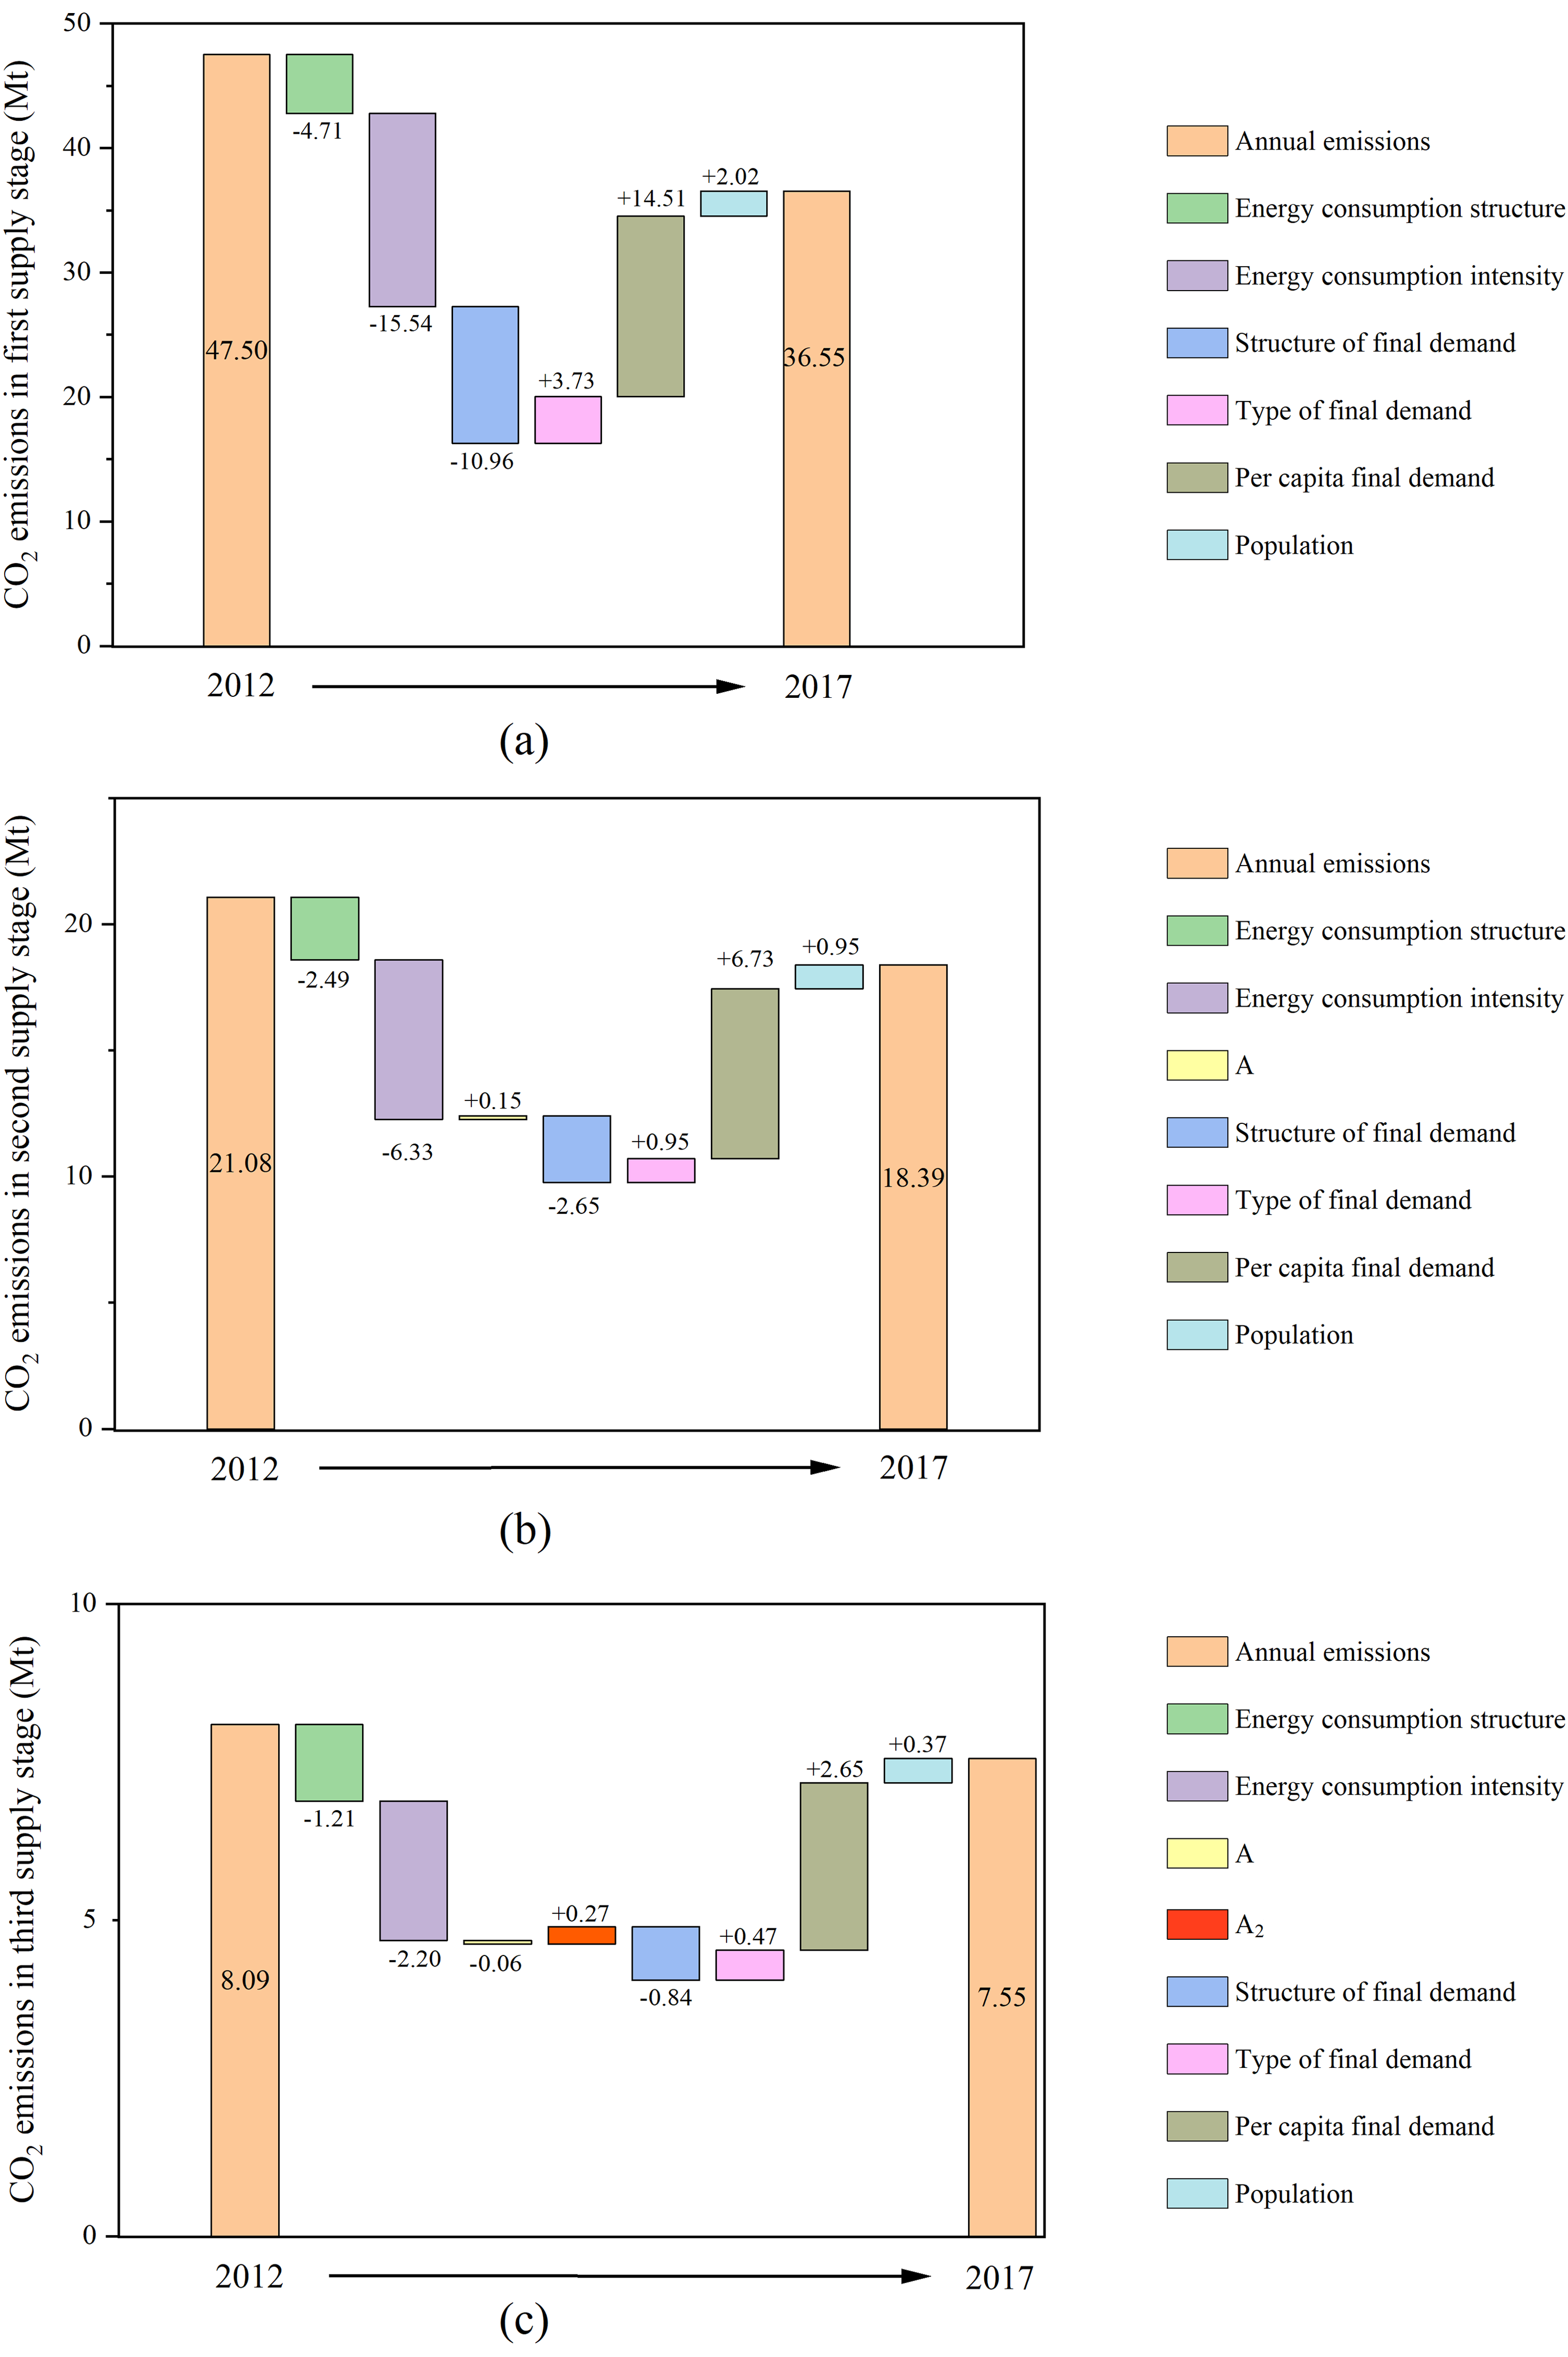
Decomposition of CO2 emissions changes in the first three supply stage during 2012–2017. Note: A1 denotes the matrix of direct consumption coefficients for the first-order sectors to the second-order sectors, A2 denotes the matrix of direct consumption coefficients for the second-order sectors to the third-order sectors, and A3 denotes the direct consumption coefficients for the third-order sectors to the fourth-order sectors. The meaning is the same in Figures 5 and 7.
This indicates that the first supply stage, which is directly triggered by final demand, has higher emissions and has become the focus of Beijing’s emissions reduction efforts. The reason for this may be that, with Beijing’s efforts to decommission non-capital functions, some high-energy-consuming and high-polluting enterprises have gradually moved out of the city, and many of these enterprises are industrial enterprises that provide raw materials for production. 48 Therefore, most of the CO2 emissions triggered by the final demand in Beijing only occur in the first supply stage, i.e. the direct supply sector of the products. In contrast, CO2 emissions from the production and processing of raw materials for products are transferred to other regions through domestic import and foreign import. 49
The decomposition of CO2 emissions in the first three supply stages is relatively consistent with the overall decomposition (Figures 2 and 3). Energy consumption-related effects strongly drive emissions reduction, while final demand structure also plays a positive role. And all final demand-related effects other than final demand structure hinder CO2 emissions reduction in Beijing.
In terms of importance, energy consumption intensity is the dominant driver of emissions reduction at all three supply stages, indicating that low-carbon technologies have been effectively applied in Beijing for energy consumption. Final demand per capita is always the most significant driver of emissions increase, which is consistent with the findings of previous studies. In addition, the importance of the final demand structure for emissions reduction decreases as the supply stage increases (compared to the energy consumption structure). In the third supply stage, the importance of the final demand structure changes from second to third, indicating that the emissions reduction potential of the product supply for final demand needs to be further developed at this stage. The type of final demand and the growth of the resident population play a low role in hindering emissions reduction. Similarly, the input–output structure has a very limited impact on emissions reduction, suggesting that the structure of product inputs and processing between sectors in Beijing is relatively stable at all supply stages.
Changes in CO2 emissions from a supply chain perspective
Supply chains with increased CO2 emissions
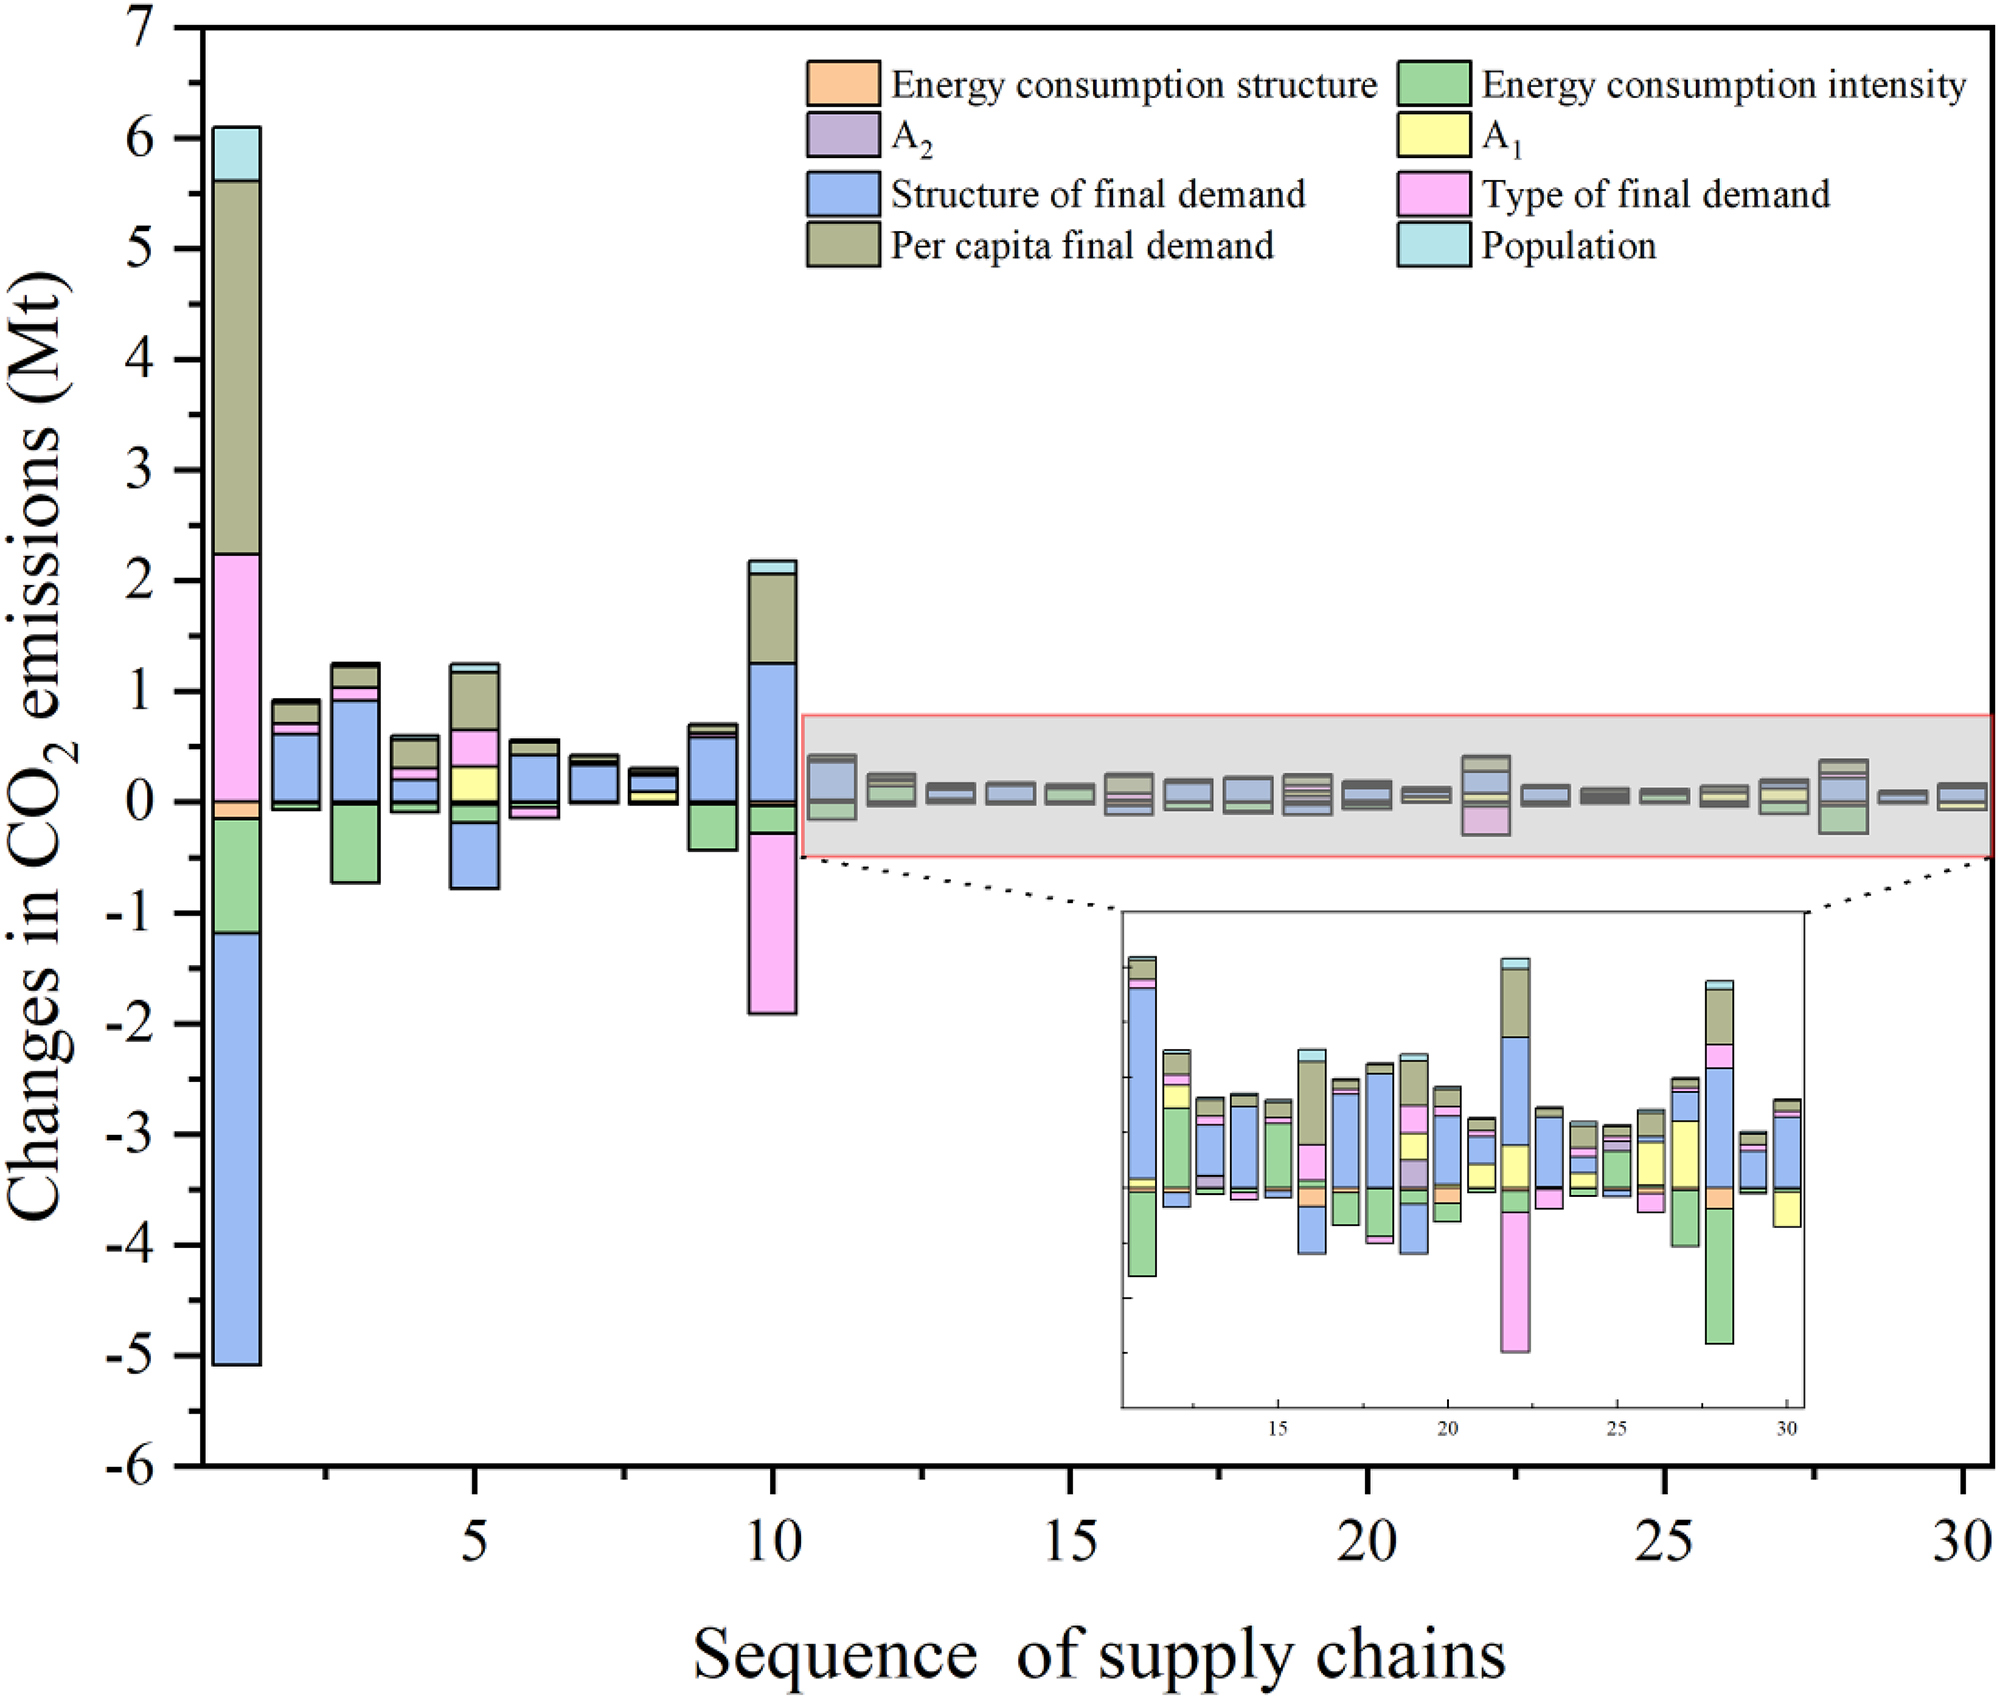
Filtered by the scale of CO2 emissions changes, Figure 4 shows top 30 critical supply chains with increased emissions in Beijing. First, in terms of final demand, 18 of them are related to domestic export, 5 to urban residential consumption, 3 to foreign export, 2 to government consumption, and 2 to fixed capital formation. The contribution to emissions reduction is −52.66%, −35.97%, −24.09%, −3.58%, and −1.92%, respectively. It can be found that domestic export has the largest impact on the supply chains with increased emissions, followed by urban residential consumption and foreign export, while government consumption and fixed capital formation have a smaller impact. This also confirms the analysis above: Beijing, as a trade hub, is characterized by CO2 emissions triggered by domestic export and foreign export. In addition, the strategy of expanding domestic demand in Beijing has led to an increase in CO2 emissions due to the increase in residential consumption.
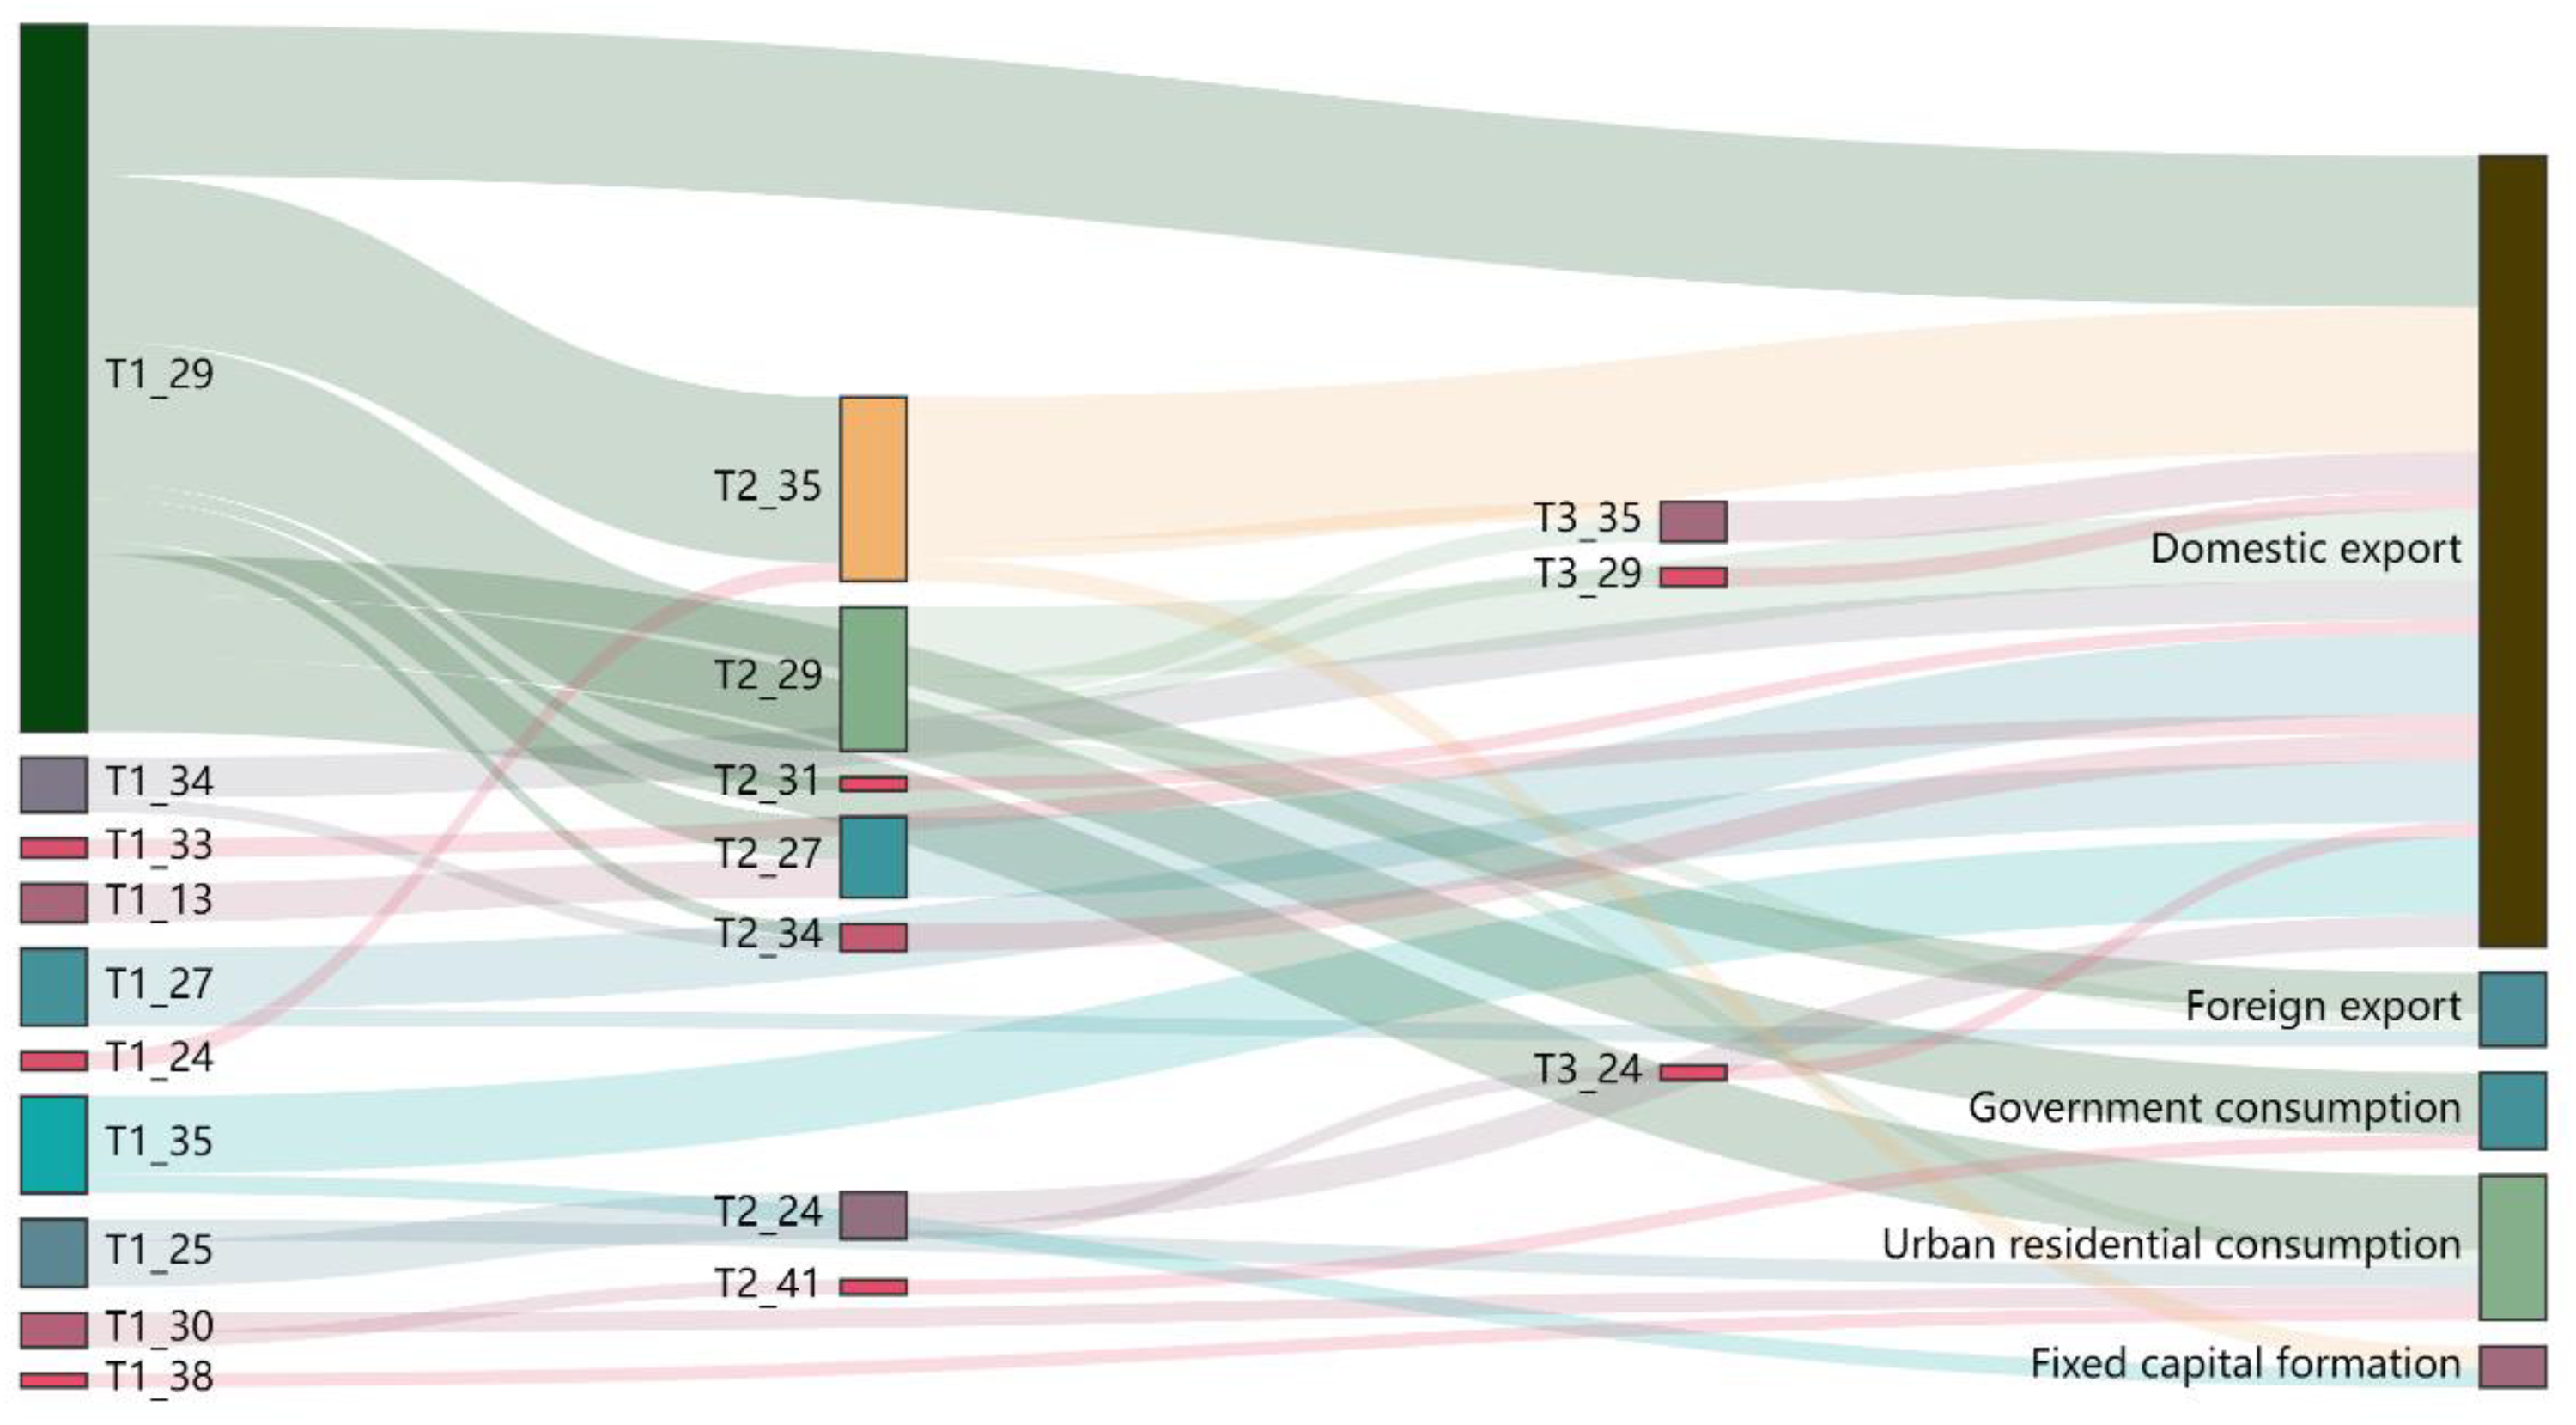
Top 30 critical supply chains that increased CO2 emissions during 2012–2017. Note: “T” has been used to distinguish the fact that some sectors are repeated in different orders of supply chains in this figure and Figure 6. From left to right, the supply sector at the leftmost end of the supply chain is marked “T1_”, the second sector is marked “T2_”, the third sector is marked “T3_”, and so on. In this figure, the widths of the flows represent the increase of supply chain emissions. And in Figure 6, they represent the reduction of supply chain emissions.
In terms of the order of supply chains, there are 13 first-order supply chains, 13 second-order supply chains, and 4 third-order supply chains in 30 supply chains with increased CO2 emissions. The contribution to emissions reduction is −28.80%, −20.44%, and −3.41%, respectively. It can be seen that the number of first-order supply chains and second-order supply chains is higher, and the corresponding contribution to emissions increase is also greater, while the role of third-order supply chains in emissions increase is relatively small. This also corroborates with the above analysis based on supply stages.
As far as the production sectors are concerned, there are 21 sectors involved in these 30 emission-increasing industrial chains, and the two sectors that appear most frequently are sector 29 (21 times) and sector 35 (Scientific Research and Technology, 8 times). sector 24, sector 27 (Construction) and sector 34 (Leasing and Business Services) both appear 4 times, second only to sector 29 and sector 35 in importance. a well-developed transportation sector is a significant configuration for trade hubs, which explains why sector 29 is a key sector for CO2 emissions increase. In addition, Beijing has implemented a general program to strengthen the construction of a national science and technology innovation center, and actively encourages the development of Scientific Research and Technology Services (sector 35). Production and Supply of Electricity and Steam (sector 24) and Construction (sector 27) play a role as basic industries to support the development of other industries, which leads to the increase of emissions.
Taken together, in the supply chains ending in domestic export, the direct supply sector includes both the industrial sectors (sector 24, 27, 29) and the service sectors (sector 31, 33, 34, 35). In the supply chain ending in exports, the direct supply sector includes sectors 27, 29. In the supply chains ending in fixed capital formation, the direct supply sector has only sector 35. In the supply chains ending in government consumption, the direct supply sector has sectors 29, 41. In the supply chains ending in urban consumption, the direct supply sector includes sectors 25, 29, 30, 38. In addition to the traditional industrial sectors still occupy an important position in CO2 emissions, we find that the service sectors are gradually becoming a non-negligible driver of CO2 emissions increase. For example, sector 35 needs to be taken into account when dealing with CO2 emissions from domestic exports and fixed capital. To reduce the emissions caused by urban residential consumption, in addition to reducing their consumption of gas and electricity, the potential for emissions reduction in sector 38 (Education) also needs to be taken into account.
The SDA of the 30 supply chains shown in Figure 4 was carried out to obtain the effects of CO2 emissions increase and their contribution in each supply chain. Since the different sectoral linkages are examined separately, the difference from the previous results of the overall decomposition analysis is reflected in energy consumption intensity, and structure of final demand. For example, the change in energy consumption intensity in sectors 25, 27, and 30 instead contributes to CO2 emissions increase, thus these three sectors need to focus on the green upgrading of production technology. This is a feature that the structural decomposition of the overall and supply stages cannot reveal. Moreover, in the few chains where the changes in the demand structure of sector 29 or sector 25 brought about a decrease in CO2 emissions. The demand structure of most sectors promotes emissions increase, with sectors 31, 33, 34, 35, 41 and other service sectors all on the list. This indicates that the emissions reduction potential of the final demand structure needs to be further explored.
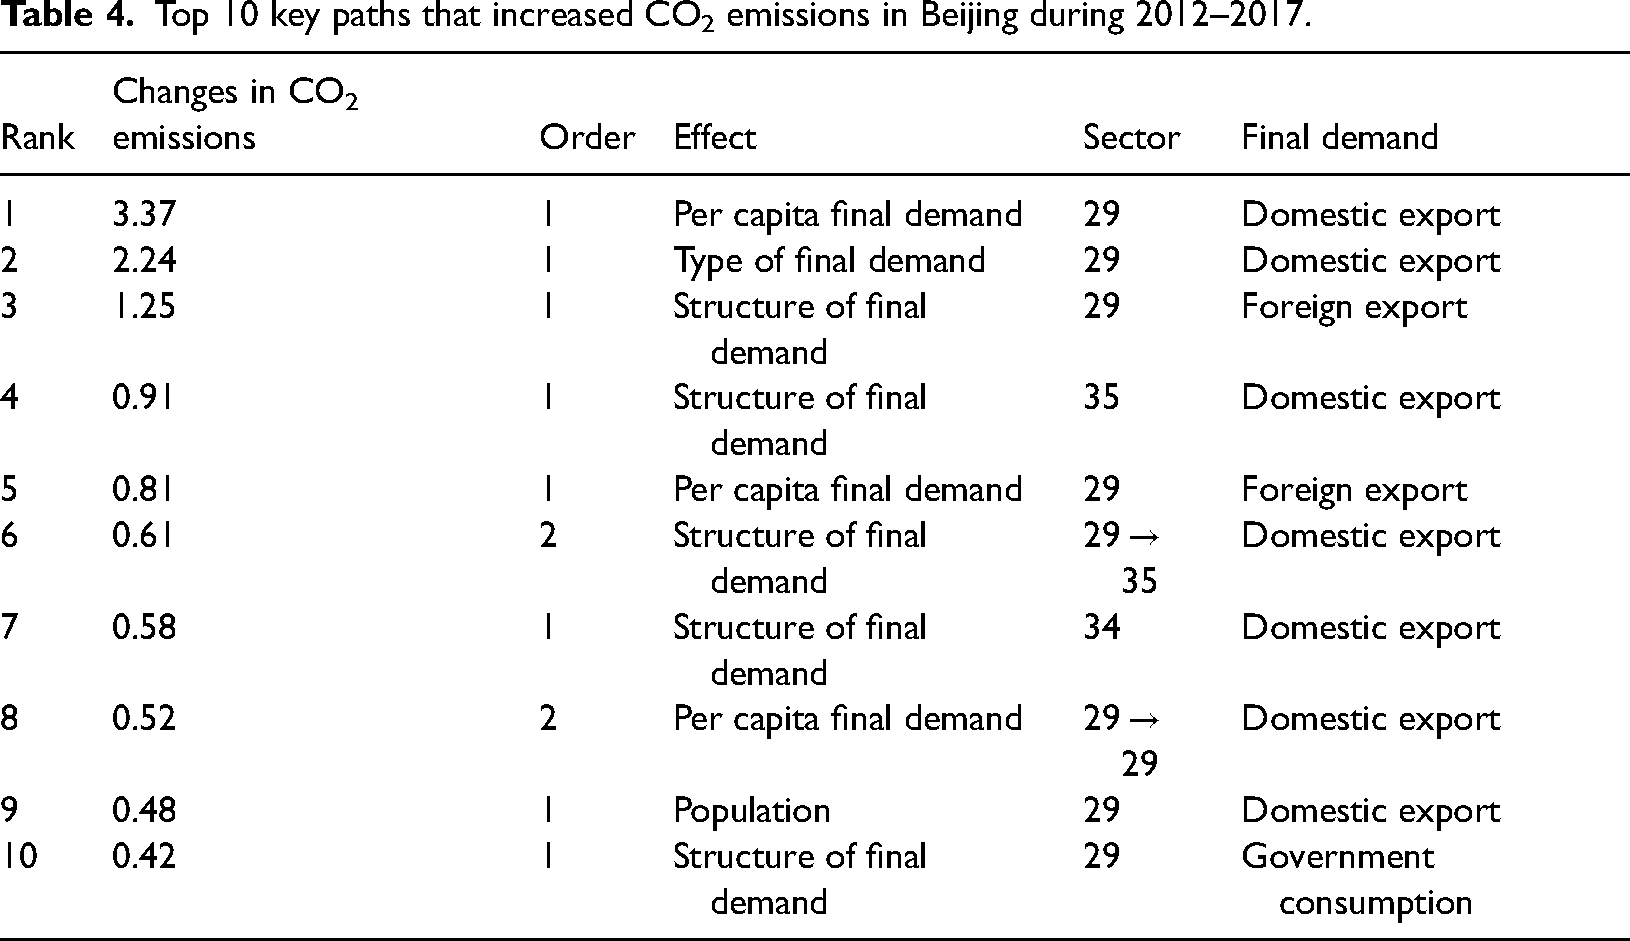
In order to further focus on the key areas of CO2 emissions in Beijing, 30 supply chains were ranked according to the magnitude of each effect, and finally 10 key pathways were screened out (Table 4). Some of paths contain the same supply chains and the contribution of them are large. For “29 → Domestic export,” the effects are per capita demand size, type of final demand, and population, respectively. In terms of sectors, these 10 pathways only consist of sector 29 in the secondary industry and sectors 34 and 35 in the tertiary industry, which means that these three sectors are the top priority for CO2 emissions increase in Beijing. In addition, the effects involved are all final demand related. Among them, the total CO2 emissions reduction contribution of per capita demand scale is −32.84%, the total CO2 emissions reduction contribution of final demand structure is −26.35%, the total CO2 emissions reduction contribution of final demand category is −15.63%, and the CO2 emissions reduction contribution of population growth is −3.39%. The uncovering of these micro information helps Beijing to adopt targeted and specific emissions reduction measures.
Top 10 key paths that increased CO2 emissions in Beijing during 2012–2017.
Supply chains with reduced CO2 emissions
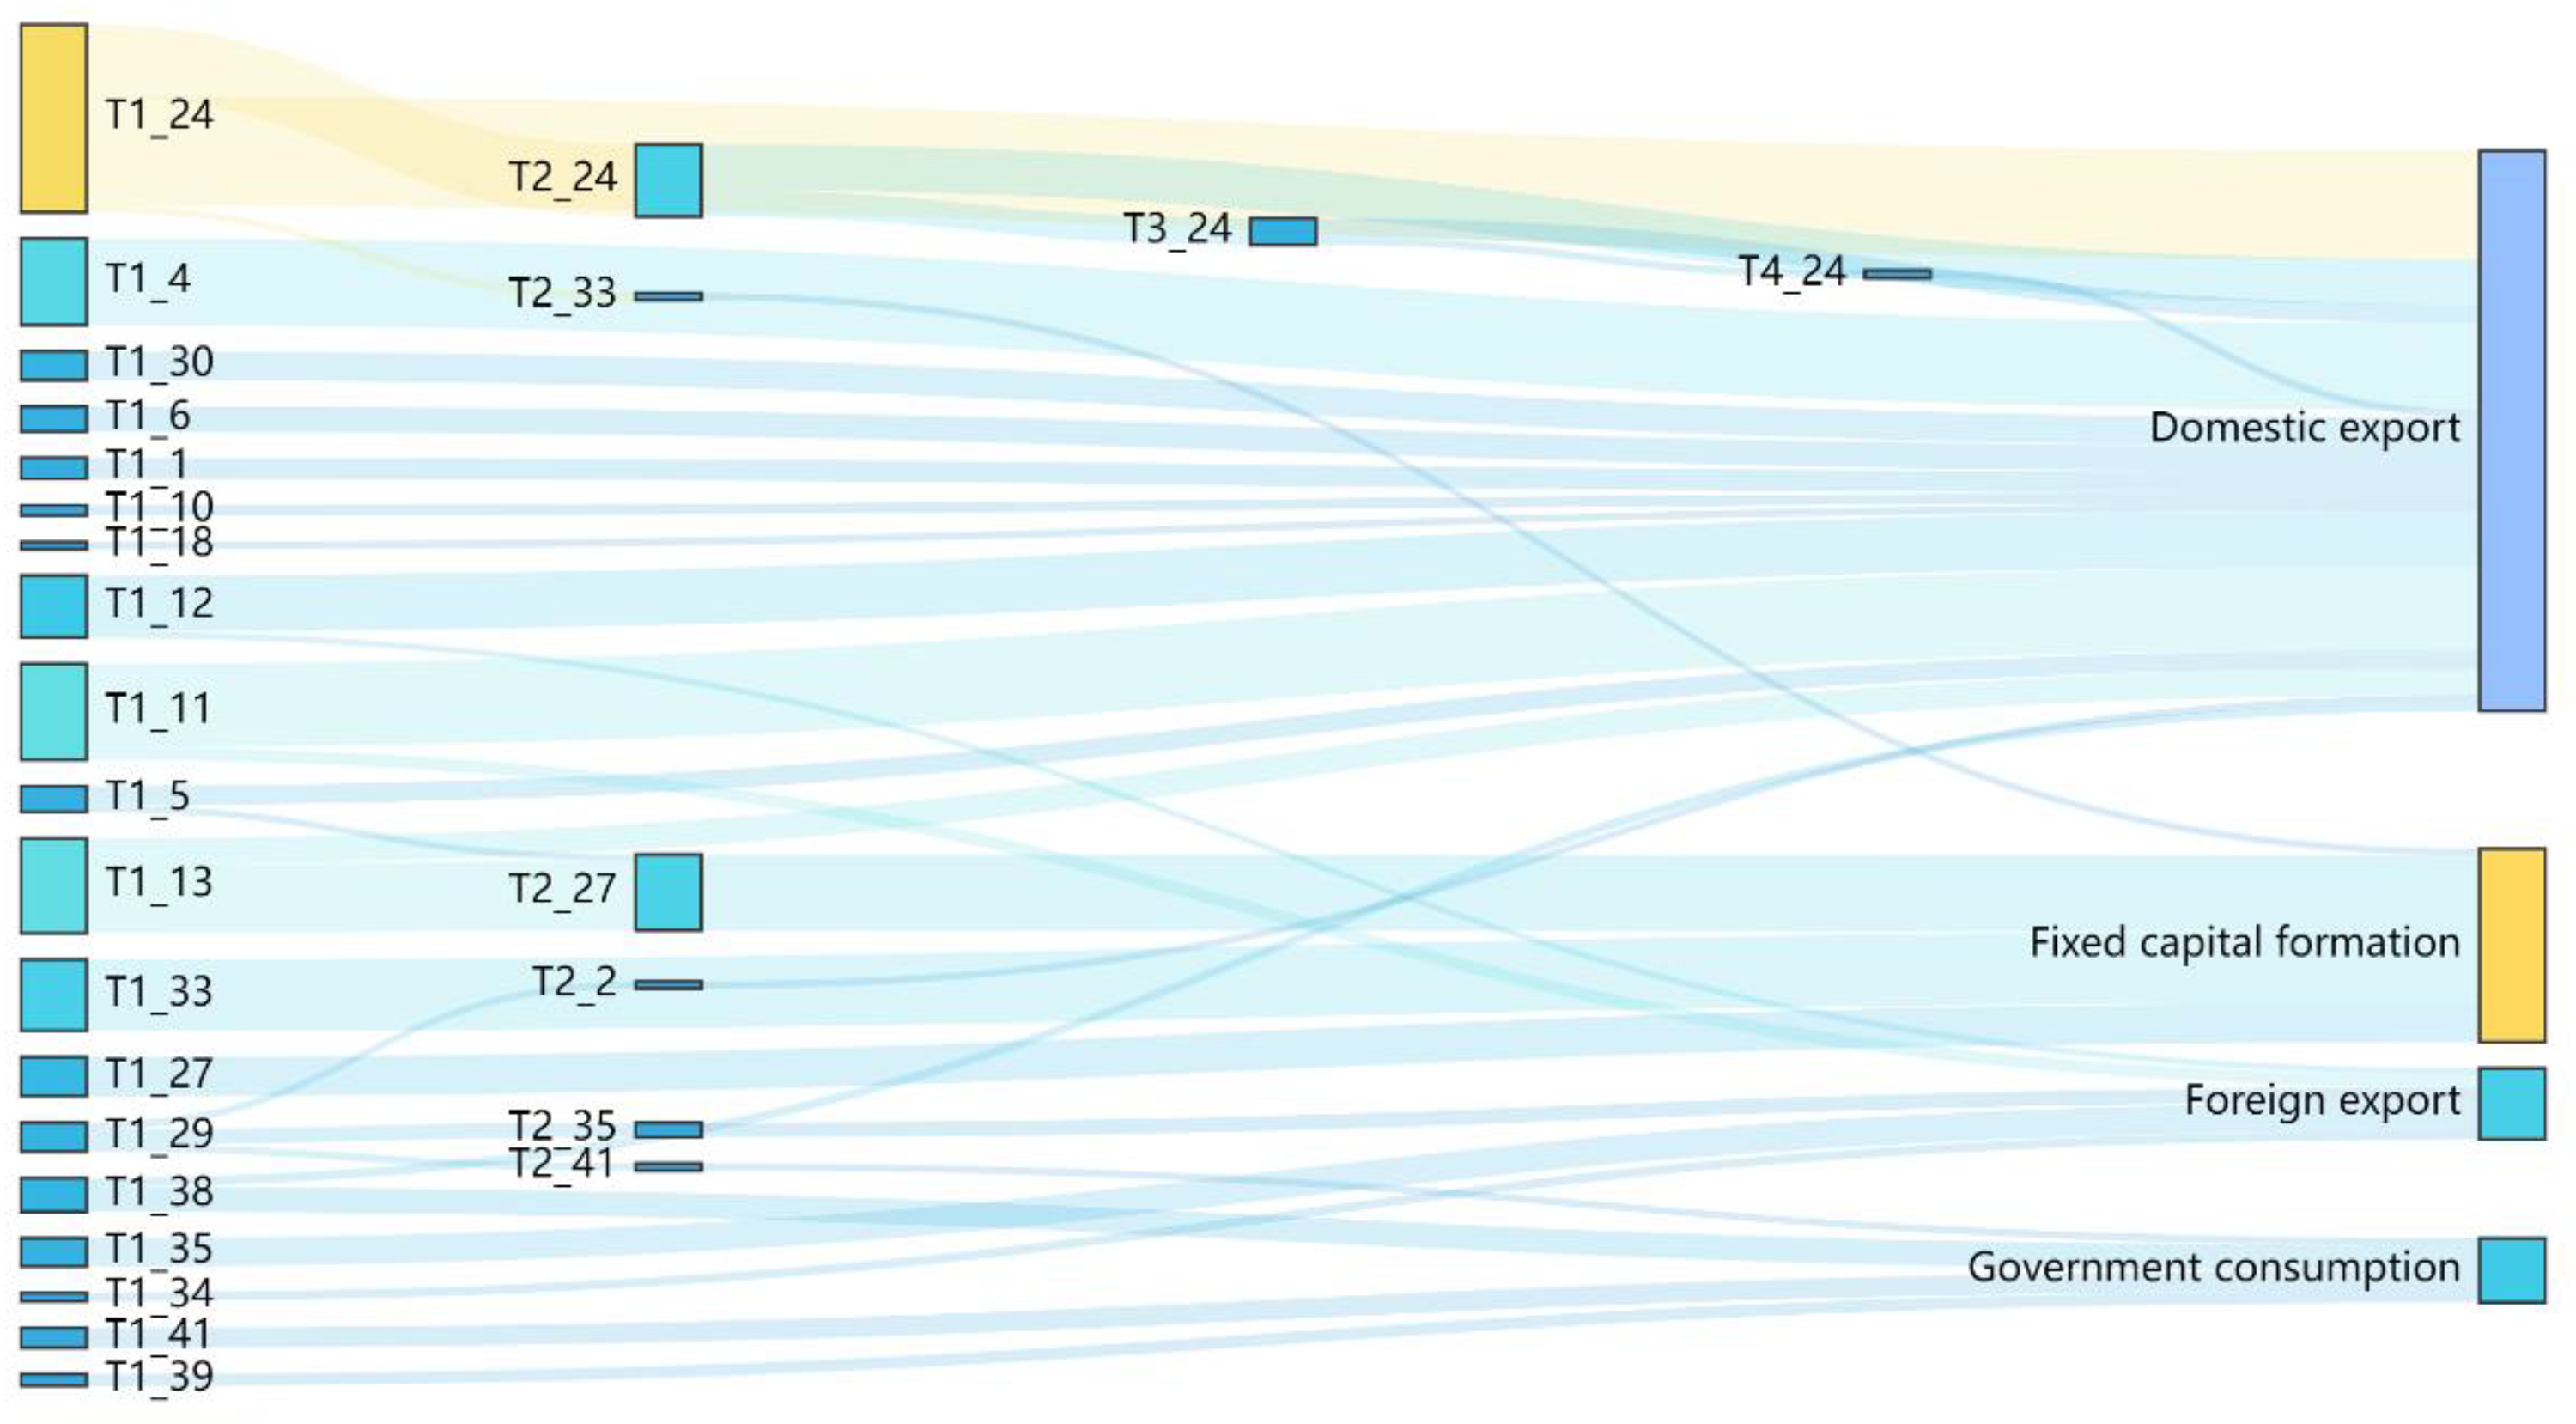
The top critical 30 supply chains that decreased CO2 emissions in Beijing are illustrated in Figure 5. First, in terms of final demand, 16 of them are related to domestic export, 5 are related to fixed capital formation, 5 are related to foreign export, and 4 are related to government consumption. The emissions reduction contribution is 116.74%, 76.71%, 47.37%, and 38.81%, respectively. Domestic export likewise has the greatest impact on the supply chain of emissions reductions, followed by fixed capital formation, followed by foreign export and government consumption.
Decomposition of emissions changes in the 30 supply chains with increased CO2 emissions during 2012–2017.
In terms of the order of supply chains, there are 21 first-order supply chains, 7 second-order supply chains, 1 third-order supply chain and 1 fourth-order supply chain among the 30 abatement supply chains. The contribution to emissions reduction is 92.55%, 20.69%, 2.48% and 1.02% respectively. The first-order supply chains are most significant for CO2 emissions reduction, which is consistent with the previous analysis based on supply stages.
Among these 30 emissions reduction supply chains involving 21 sectors, the three sectors with the highest number of occurrences are sector 24 (11 times), sector 27 (3 times), and sector 29 (3 times). Sector 24 is the most critical sector for emissions reduction in Beijing indicating that the energy structure has basically achieved a clean transformation. On the one hand, Beijing has made significant progress in optimizing its fuel mix, for example by significantly reducing coal consumption and increasing natural gas consumption. On the other hand, it benefits from the formation of a “multi-directional, multi-source, diversified” electricity supply pattern and a “ring network support, multi-point injection, local consumption” grid structure in Beijing.
Taken together, the direct supply sectors in the supply chains ending with domestic export include agriculture (sector 1), industry (sectors 2, 3, 5, etc.) and services (sectors 30, 38), indicating that Beijing has achieved very comprehensive emissions reduction results for many products exported domestically. In the supply chains ending with fixed capital formation, the direct supply sectors include sectors 27, 33, indicating that the construction and real estate industries are the main contributors to the CO2 emissions reduction due to fixed capital formation. In the supply chains ending with foreign export, the direct supply sectors include sectors 11, 12, 34, 35. In the supply chains that end with government consumption, the direct supply sectors include sectors 38, 39, 41. In addition to the first-order supply chains, most of the multi-order supply chains start with sectors 24 and 29, such as “24 → 24 → 24 → Domestic export” and “29 → 35 → Foreign export.” This indicates that Beijing has achieved a decarbonization transition in the electricity consumption and transportation of many products.
The SDA of the 30 supply chains shown in Figure 6 was performed to obtain the effects of emissions reduction and their contribution in each supply chain (Figure 7). As with the treatment in the supply chains of emissions increase, we focus on the energy consumption intensity and structure of final demand in supply chains of emissions reduction. In almost all of the supply chains, energy consumption intensity plays an abatement role. However, there are still two supply chains in which the energy consumption intensity contributes to the CO2 emissions increase (“27 → Fixed capital formation”, “30 → Domestic export”). It is worth noting that the energy consumption intensities of sectors 27 and 30 also lead to increased CO2 emissions in the supply chains with increased emissions mentioned above, and the relevant supply chains should be the focus of subsequent emissions reduction efforts in Beijing. In addition, structure of final demand plays an incremental role in supply chains where sectors 12, 14, 34, and 41 provide products directly to final demand. There is no doubt that the products in these sectors have high-carbon attributes. Furthermore, the structure of final demand for sector 11 is carbon-enhancing in some supply chains (“11 → Foreign export”) and carbon-reducing in others (“11 → Domestic export”). It should be noted that this transfer of high-carbon products between different final demands may have an emissions reduction effect from a unilateral point of view, but it is not helpful to Beijing’s CO2 emissions reduction in general. This should be a point that many cities, including Beijing, need to pay attention to in the low-carbon transition, i.e. to prevent the illusion of emissions reduction caused by the transfer of CO2 emissions among different final demands.
Top 30 critical supply chains that decreased CO2 emissions during 2012–2017.
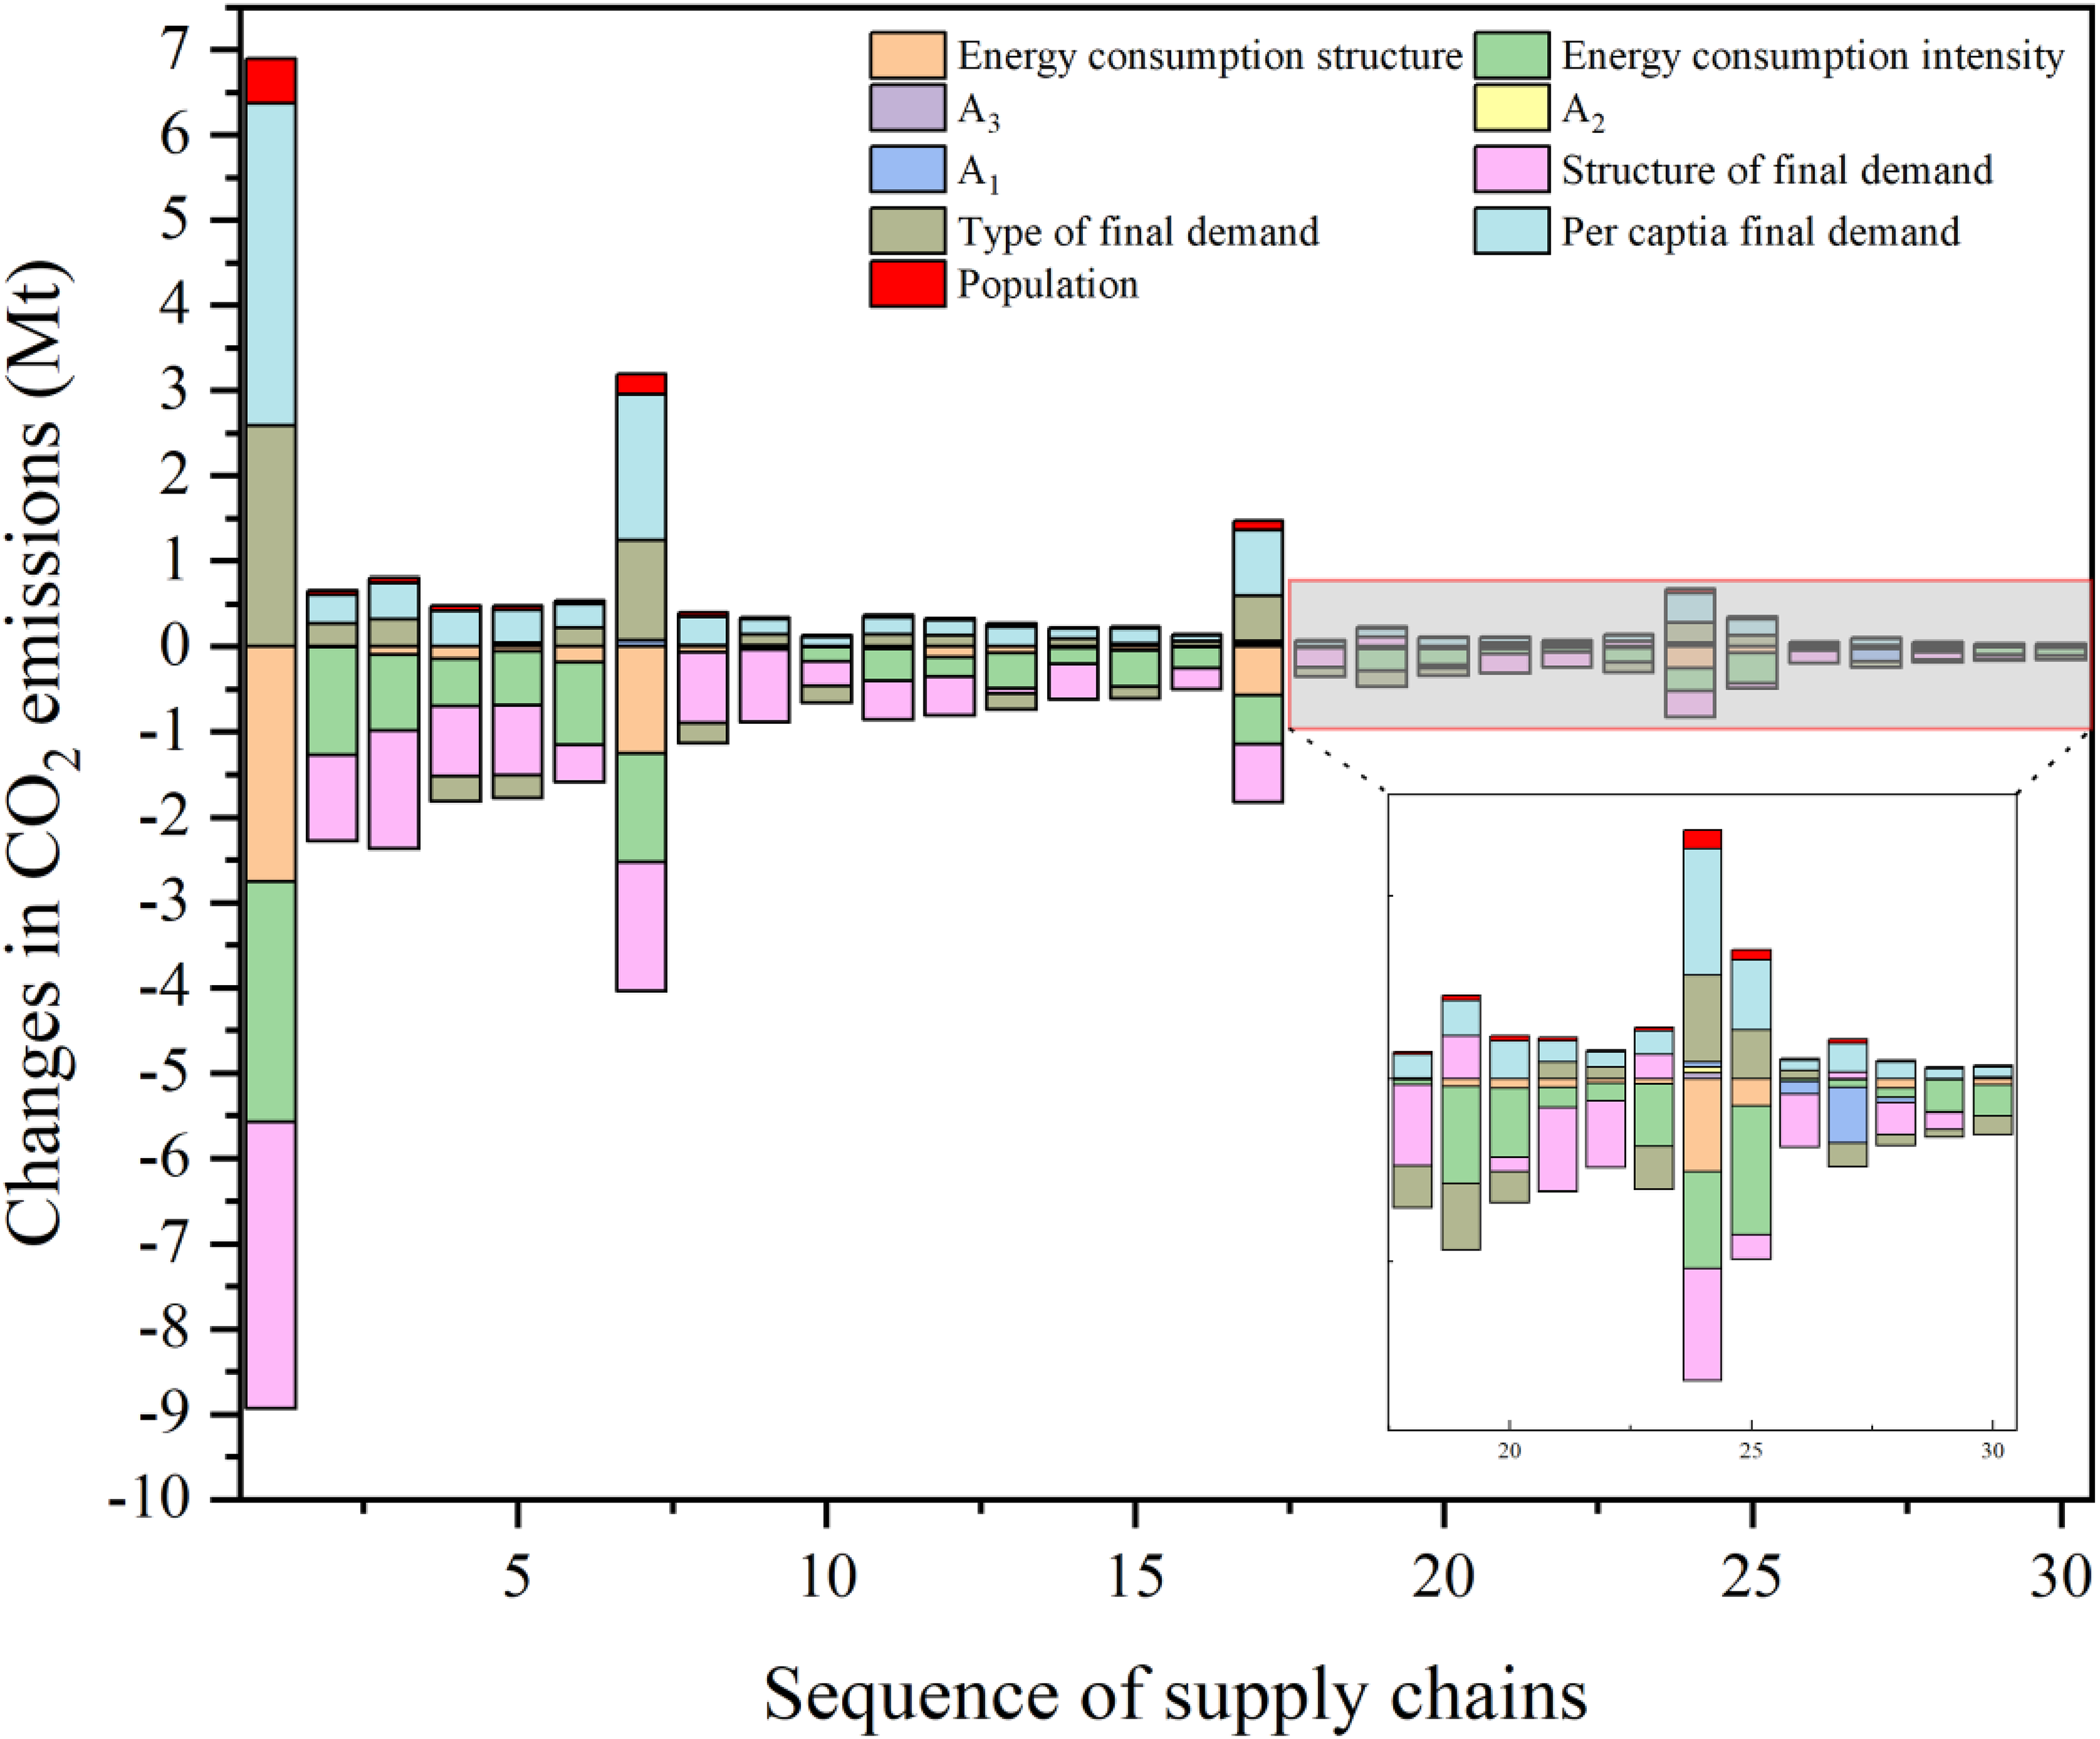
Decomposition of CO2 emissions changes in the 30 supply chains with decreased emissions during 2012–2017.
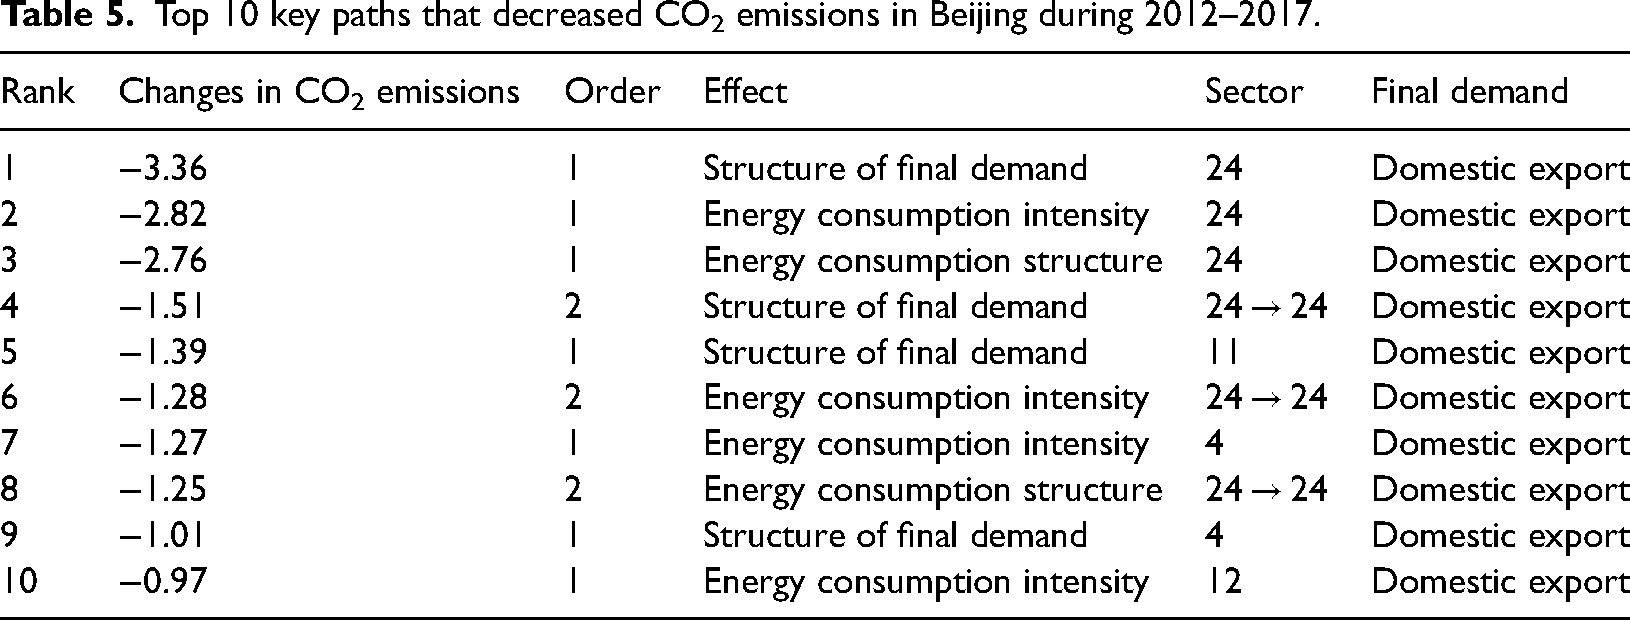
Similarly, in order to focus on the key areas of CO2 emissions reduction in Beijing, the 30 supply chains were ranked according to the magnitude of each effect, and finally 10 critical paths were screened out (Table 5). These 10 paths involve only sectors 4, 11, 12, and 24 in the secondary industry. Of these, sector 24 is the key sector with the highest number of appearances for emissions reduction. In terms of final demand, the endpoints of the paths all point to domestic export. In terms of effects, the total contribution of CO2 emissions increase from structure of final demand is 50.77%, the total contribution of CO2 emissions increase from energy consumption intensity is 44.23%, and the total contribution of CO2 emissions increase from structure of energy consumption is 27.98%. Taken together, Beijing’s emissions reduction results are mainly achieved by the reduction of energy consumption in some industrial sectors (sector 4, 12), together with the reduction of demand for these high-carbon industrial products from domestic export (sector 4, 11), and the reduction of electricity consumption from domestic export.
Top 10 key paths that decreased CO2 emissions in Beijing during 2012–2017.
Discussion of findings
From the overall view, sector 24 takes a positive lead in Beijing’s emissions reduction efforts, thanks to the large amount of electricity demand outsourced and the increasingly clean energy mix. 47 The increase in direct emissions from sectors 25 and 29 slowed down the process of carbon reduction in Beijing. The results of the decomposition of energy consumption structure, final demand structure, and type of final demand confirm the above view. The increase in the scale of domestic export contributes significantly to the emissions increase, and sector 29 clearly plays a major role in this. The reduction in the proportion of energy use such as coal and gasoline has played a huge role in reducing emissions, but the incremental effect of other energy sources, especially the significant increase in the scale of natural gas use, has greatly reduced the overall emissions reductions. 50
In terms of supply stages, CO2 emissions reduction in the first supply stage accounts for 76.5% of the total, indicating that the emissions reduction results mainly come from the direct supply of products to meet final demand. The productive demand for meeting intermediate inputs in the second supply stage triggers 18.9% of emissions reduction. The emissions and emissions reduction shares of the subsequent supply stages are relatively small. During 2012–2017 Beijing has evacuated a total of 1992 general manufacturing industries. 48 The exited firms are mainly concentrated in the traditional high-energy industries of building materials and machinery manufacturing and processing. Considering Beijing’s development plan, 51 we believe that it is inevitable that Beijing’s local supply chain becomes shorter, i.e. a large number of high-carbon industrial production processes are transferred through industries and commodity trade is assumed by other Chinese provinces.49,52
In terms of supply chains, the emissions reduction contribution of the 30 emission-enhancing supply chains and 30 emission-reducing supply chains are −52.66% and 116.74%, respectively. We find that in the supply chains ending with the same final demand, different product supply sectors may lead to different emission effects. For example, “35 → Domestic export” is an emission-increasing chain, while “24 → Domestic export” is an emission reduction chain. This indicates that the emission reduction effect from final demand structure is neutralized by the corresponding emission increase effect. Similarly, in supply chains with the same product supply sector, different final demand will lead to opposite emission directions. For example, “35 → Domestic export” is an emission-enhancing supply chain, while “35 → Foreign export” is an emission-reducing chain. This suggests that CO2 emissions in the same sector can shift in different final demands, triggering the illusion of emissions reduction. In addition, we also find that service sectors are heavily present in the supply chains of emissions increase, while the supply chains of emissions reduction are overwhelmingly dominated by the industrial sectors. This indicates both the effectiveness of emissions reduction in Beijing’s industrial sectors and the urgent need for reducing emissions of service sectors in Beijing. 19
Finally, the 10 emissions increase pathways and 10 emissions reduction pathways further filtered from the supply chains reveal the key to the CO2 emissions changes in Beijing. For sectors 29 and 34, which recur in the emissions increase pathways, subsequent attention needs to be focused. For example, for “29 → Domestic export,” it needs to be improved from three aspects: per capita final demand, type of final demand, and population. The recurring sector 24 in the abatement path is the key factor to explain the abatement effectiveness of Beijing. Beijing’s emissions reduction results rely heavily on the improvement of final demand structure, energy consumption intensity and energy consumption structure in “24 → Domestic export.”
Conclusions and policy recommendations
This study accounts for the sectoral CO2 emissions and compiles a comparable price non-competitive input–output table for Beijing. SDA and SPD are used to decompose and analyze the CO2 emissions changes in Beijing from 2012 to 2017 at three levels: overall, supply stage, and supply chain, thus adding to the literature. In general, the decomposition results of emissions changes in Beijing at the three levels are complementary and corroborate each other.
The results of the overall decomposition show that energy consumption intensity is the most significant driver of emissions reduction, benefiting from measures taken by Beijing to optimize energy mix and improve energy efficiency. For example, the determined move away from coal dependence and the import of electricity from other provinces (Inner Mongolia, Shanxi, and Hebei). 47 In addition, per capita final demand is the biggest effect that increases emissions. On the one hand, it is necessary to guide the low-carbon upgrade of the consumption structure. For example, establishing an incentive mechanism to subsidize the production and consumption of low-carbon products, and a penalty mechanism to impose a carbon tax on high emission behavior. On the other hand, the pressure of population growth needs to be taken seriously by Beijing. Controlling a reasonable total population has been mentioned many times in the relevant plans. Moving part of the population to neighboring areas, such as Xiong’an New Area, would be an appropriate measure. 4
From the decomposition results of supply stages, the first supply stage and the second supply stage explain the vast majority of CO2 emissions reduction. This suggests that supply chains important to Beijing’s CO2 emissions are usually short. The fact that Beijing removes its non-capital functions and relocates its industrial firms out of the city can explain the short local supply chains. For Beijing, the shorter local supply chains suggest that the focus of emissions reduction in Beijing is implemented in the direct supply sector of products that are aligned with final demand. And for foreign provinces that receive these industrial firms, cleaner production technologies are needed to reduce the pressure on CO2 emissions. 49
The decomposition of emission-enhancing supply chains indicates that the expansion of domestic export and thus more demand for sector 29 products is an important cause of CO2 emissions increase in Beijing. The CO2 emissions triggered by a larger proportion of demand for sector 29 products from foreign export, and government consumption cannot be ignored as well. Given the functional positioning of Beijing as a trade hub, it is necessary to build a good intelligent transportation system, promote green travel, and promote CO2 emissions reduction in the transportation sector. In addition, the increase in the share of sector 34, 35 products in the product demand structure of domestic export also contributed to the increase in emissions. Policy measures to reduce emissions in the service sectors are also necessary.
The decomposition of emissions reduction supply chains shows that sector 24 and domestic export are the most important. The energy consumption intensity, structure of energy consumption, and structure of final demand play a significant role in emissions reduction in supply chains composed of both (“24 → Domestic export”, “24 → 24 → Domestic export”). The lower demand for high-carbon industrial products (sectors 4, 11) from domestic export also contributes to emissions reduction. At the same time, the reduction in energy consumption intensity in some industrial sectors (sectors 4, 12) cannot be ignored.
We also find that there are many offsetting effects that make the emissions reduction much less effective. For example, the massive substitution of natural gas for coal use has made the emissions reductions not as significant as expected. On the one hand, Beijing must continue to optimize the consumption structure and efficiency of coal and other high-emission energy sources, and not drive backwards. On the other hand, Beijing should insist on implementing a double control mechanism for energy consumption intensity and total energy consumption, and improve the efficiency of energy use with clean energy. In addition, the improvement of product demand structure of domestic export/urban residential consumption has an emission reduction effect, while the expansion of the scale of domestic export/urban residential consumption increases CO2 emissions. This implies that it is necessary to control the total demand while guiding the upgrading of consumption structure. Furthermore, the divergent demand for different products from domestic export also offsets part of the emission reduction effect. Finally, the transfer of high-carbon products between different final demands should also be given attention. The production and consumption of high-carbon products should be firmly curbed through the use of low-carbon alternatives.
For other provinces and cities, while implementing differentiated emission reduction policies, they can also refer to the emissions reduction experience of Beijing. First, to find the right city positioning, to promote the optimization of industrial structure, to achieve characteristic development. Second, to increase the construction and use of clean energy. Finally, the concept of green and low-carbon should be integrated into every aspect of production and consumption, to promote green and low-carbon transformation of production and lifestyle.
This study has the following two areas for improvement, which are also the directions for our subsequent efforts. First, given the increasingly important role of domestic and international trade in Beijing’s CO2 emissions, Beijing’s low-carbon urban planning should not only focus on its own emissions reduction, but also consider domestic and international supply chains. However, this study only considers Beijing’s local supply chains. In the future, the application of multi-regional input–output tables and related decomposition techniques will be a necessary attempt to promote regional synergistic emissions reduction (e.g., Beijing–Tianjin–Hebei region).
Secondly, the application of SPA generates numerous supply stages and numerous supply chains, and it is generally accepted that this study identifies the more critical supply chains by screening based on the scale of CO2 emissions change. However, different screening criteria and screening scopes inevitably add to the uncertainty of this study. We note that machine learning approaches have been explored somewhat in this area. 53 It would be interesting to consider how to leverage the powerful data processing capabilities of machine learning to analyze more information on supply chains.
Footnotes
Declaration of conflicting interests
The author(s) declared no potential conflicts of interest with respect to the research, authorship, and/or publication of this article.
Funding
The author(s) received no financial support for the research, authorship, and/or publication of this article.