
Abstract
In line with the importance of SDG-7, a number of studies have endeavored to divulge the changes in renewable energy consumption (REC); however, the literature fails to either understand the importance of technology i.e., information communication technologies (ICT) and macroeconomic uncertainty in this context or employ robust econometric techniques. This research paper extends the prior literature by focusing on technology and macroeconomic uncertainty as novel determinants in addition to natural resources, human development, globalization, and economic growth as control variables of renewable energy for the top 10 renewable energy-consuming countries by applying several second and third generation econometric tests on annual data from 1990 to 2017. The empirical estimations determine ICT as a crucial factor of renewable energy, suggesting that it significantly triggers REC in the top economies. Conversely, the detrimental effects of uncertainty tend to shrink REC. Furthermore, natural resources, human development, globalization, and economic growth significantly boost REC as consistent with the existing literature. Based on these findings, this study suggests several SGD-oriented policies.
Keywords
Introduction
Sustainable environmental development has become one of the most pressing challenges in this century. Many recent researchers have shown that renewable energy consumption (REC) works as a leading driver in enhancing the environmental quality by disrupting emissions level.1–4 Energy security in addition to climate change is also linked to renewable energy sources. 5 Furthermore, Tolliver et al. 6 mention that the share of renewable energy in total energy is projected to increase by 60% through 2040 to accomplish the three energy-related sustainable development goals (SDGs). This study argues that the focus on the determinants of renewable energy is paramount given that renewable energy can be a primary source for SDG-7 (affordable and clean energy) as well as a solution to achieve SDG-13 (climate action).
In this context, our study first spite an enormous im introduces information communication technology (ICT) as a novel driver of REC. Recently, it is observed that the emergence of ICT (i.e., internet, software, computers, mobiles, and telecommunications) significantly contributed to human life and caused to occur the fourth industrial revolution by enhancing every sector/institution of an economy. Furthermore, technologies played a considerable role in triggering the energy consumption and boosting economic growth.7,8 Likewise, it is plausible that ICTs can affect REC through various channels by improving financial transactions, lowering production cost, controlling inflation from supply side and by increasing demand for renewable energy and green products through public awareness from demand side. Despite the enormous importance of technologies, the prior literature has not paid an attention to the nexus between ICT and REC.
Macroeconomic uncertainty (MEU) is another important factor in this context. Researchers have also focused on dynamic effects of uncertainty on different economic variables such as inflation, trade, investment, and carbon emissions.9–11 Macroeconomic uncertainty is linked to switches in policy implementation of countries such as fiscal policy monetary policy, tax rules, and subsidies, which likely cause postpones in expenditure and investment by firms and households until the uncertainty is removed. 9 Since uncertainty plays a critical role in shaping several economic variables, it can likely impact REC because it refers to a situation in which the economy's future outlook becomes unpredictable. However, the existing literature provides very limited attention to investigating the link between macroeconomic uncertainty and REC, calling for more empirical examination in this area.
Based on the above discussions, the objective of this study is to analyze the determinants of renewable energy by using ICTs and macroeconomic uncertainty as focal variables in addition to natural resources (NRR), globalization (GLB), human development Index (HDI) and economic growth (GDP) as control variables for the top 10 renewable energy consuming countries using the annual data spanning from 1990 to 2017. The control variables are chosen following the prior studies.12–14 Accordingly, our study extends the prior literature body by presenting the following considerable and novel contributions. First, To the best of our knowledge, this is the first study that introduces ICT as a novel driver of REC. Majority of the prior scholars rely on the single proxy for ICT in order to analyze the effect on different economic indicators. However, the use of single proxy may lead to biased results. To deal with such issue, we not only use individuals using the internet, mobile cellular subscriptions, and fixed telephone subscriptions separately but also develop an index as a proxy for ICT by deploying principal component analysis for robust findings in order to get more informative and detailed findings to suggest the more comprehensive policies. Second, this study seeks how REC responds to macroeconomic uncertainty which is an overlooked indicator for REC. We argue that there are a few studies that endeavor to explore the effects of MEU on REC; however, these studies cannot be generalized to global level due to inappropriate sample selection and poor proxy for uncertainty. Therefore, we use a novel index “economic uncertainty index” by Ozturk and Sheng 15 to capture the macroeconomic uncertainty in top 10 economies. Third, this study selects the top 10 renewable energy-consuming economies for the first time in this subject based on the fact that top countries consume around 71% of global renewable energy as shown in Figure 3. The prime advantage to select top nations is that the policies based on the results can be generalized at the global level. Fourth, it includes interaction terms of ICT & GLB and MEU & GLB to analyze the moderating role of globalization in order to obtain more interesting findings. Last, it deploys several second- and third-generation econometric techniques to attain reliable and robust findings since most of the previous studies rely on the first generation-methods that can be suspected for biased findings.
Trends in top 10 renewable energy-consuming countries
Since the prime purpose of the study is to scrutinize the effects of ICTs and MEU on REC, our article tends to opt 10 economies including China, USA, Germany, India, UK, Japan, Spain, France, Italy, and Canada. There are several reasons to choose the sample of China, USA, Germany, India, UK, Japan, Spain, France, Italy, and Canada for empirical analysis. For example, these are top 10 economies with respect to renewable energy consumption as Figure 1 depicts the overall scenario. Further, China is at the top of the list that consumes 7.79 exajoules of renewable energy followed by USA that consumes 6.15 exajoules, Germany that consumes 2.21 exajoules, India that consumes 1.43 exajoules, UK that consumes 1.2 exajoules, Japan that consumes 1.13 exajoules, Spain that consumes 0.77 exajoules, France that consumes 0.68 exajoules, Italy that consumes 0.67 exajoules, and Canada that consumes 0.54 exajoules of renewable energy.
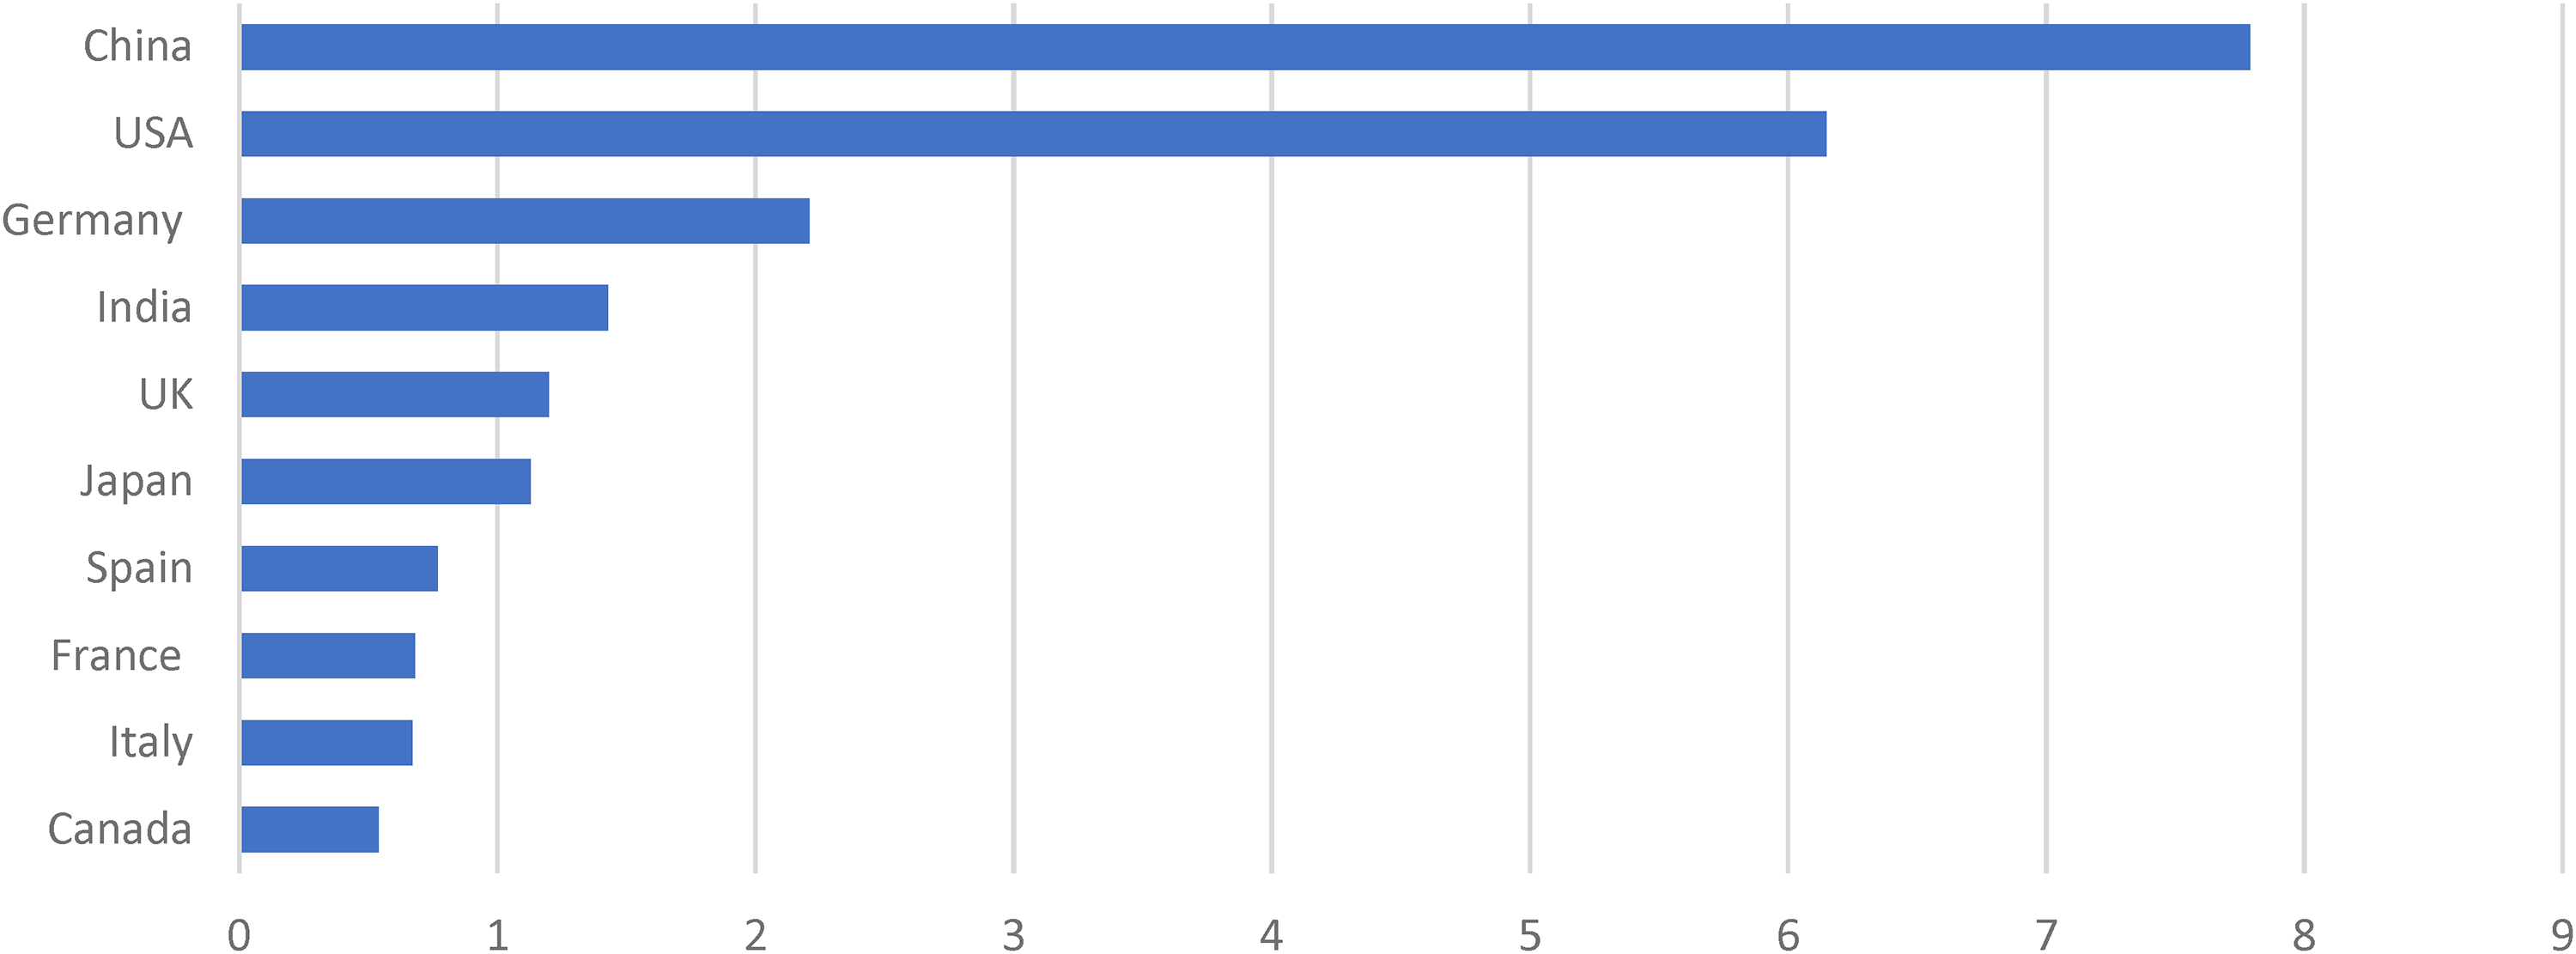
Renewable energy consumption in exajoules. Source: Statistical Review of World Energy 2021.
Another remarkable point is that these economies represent a large share of global REC. For instance, China is at the first place by consuming 24.6% of global renewable energy (GREC) followed by USA that combusts 19.4% of GREC as the details are reported in Figure 2. Overall, these sample economies significantly contribute toward the world green environment by consuming 71% of GREC, while the rest of world deploy only 29% of GREC as documented by Figure 3. Considering the substantial contribution of the selected economies toward the sustainable environment on account of production and combustion of the renewable energy, it is worth exploring the dynamic impacts of ICTs and MEU on REC in the aforementioned countries.
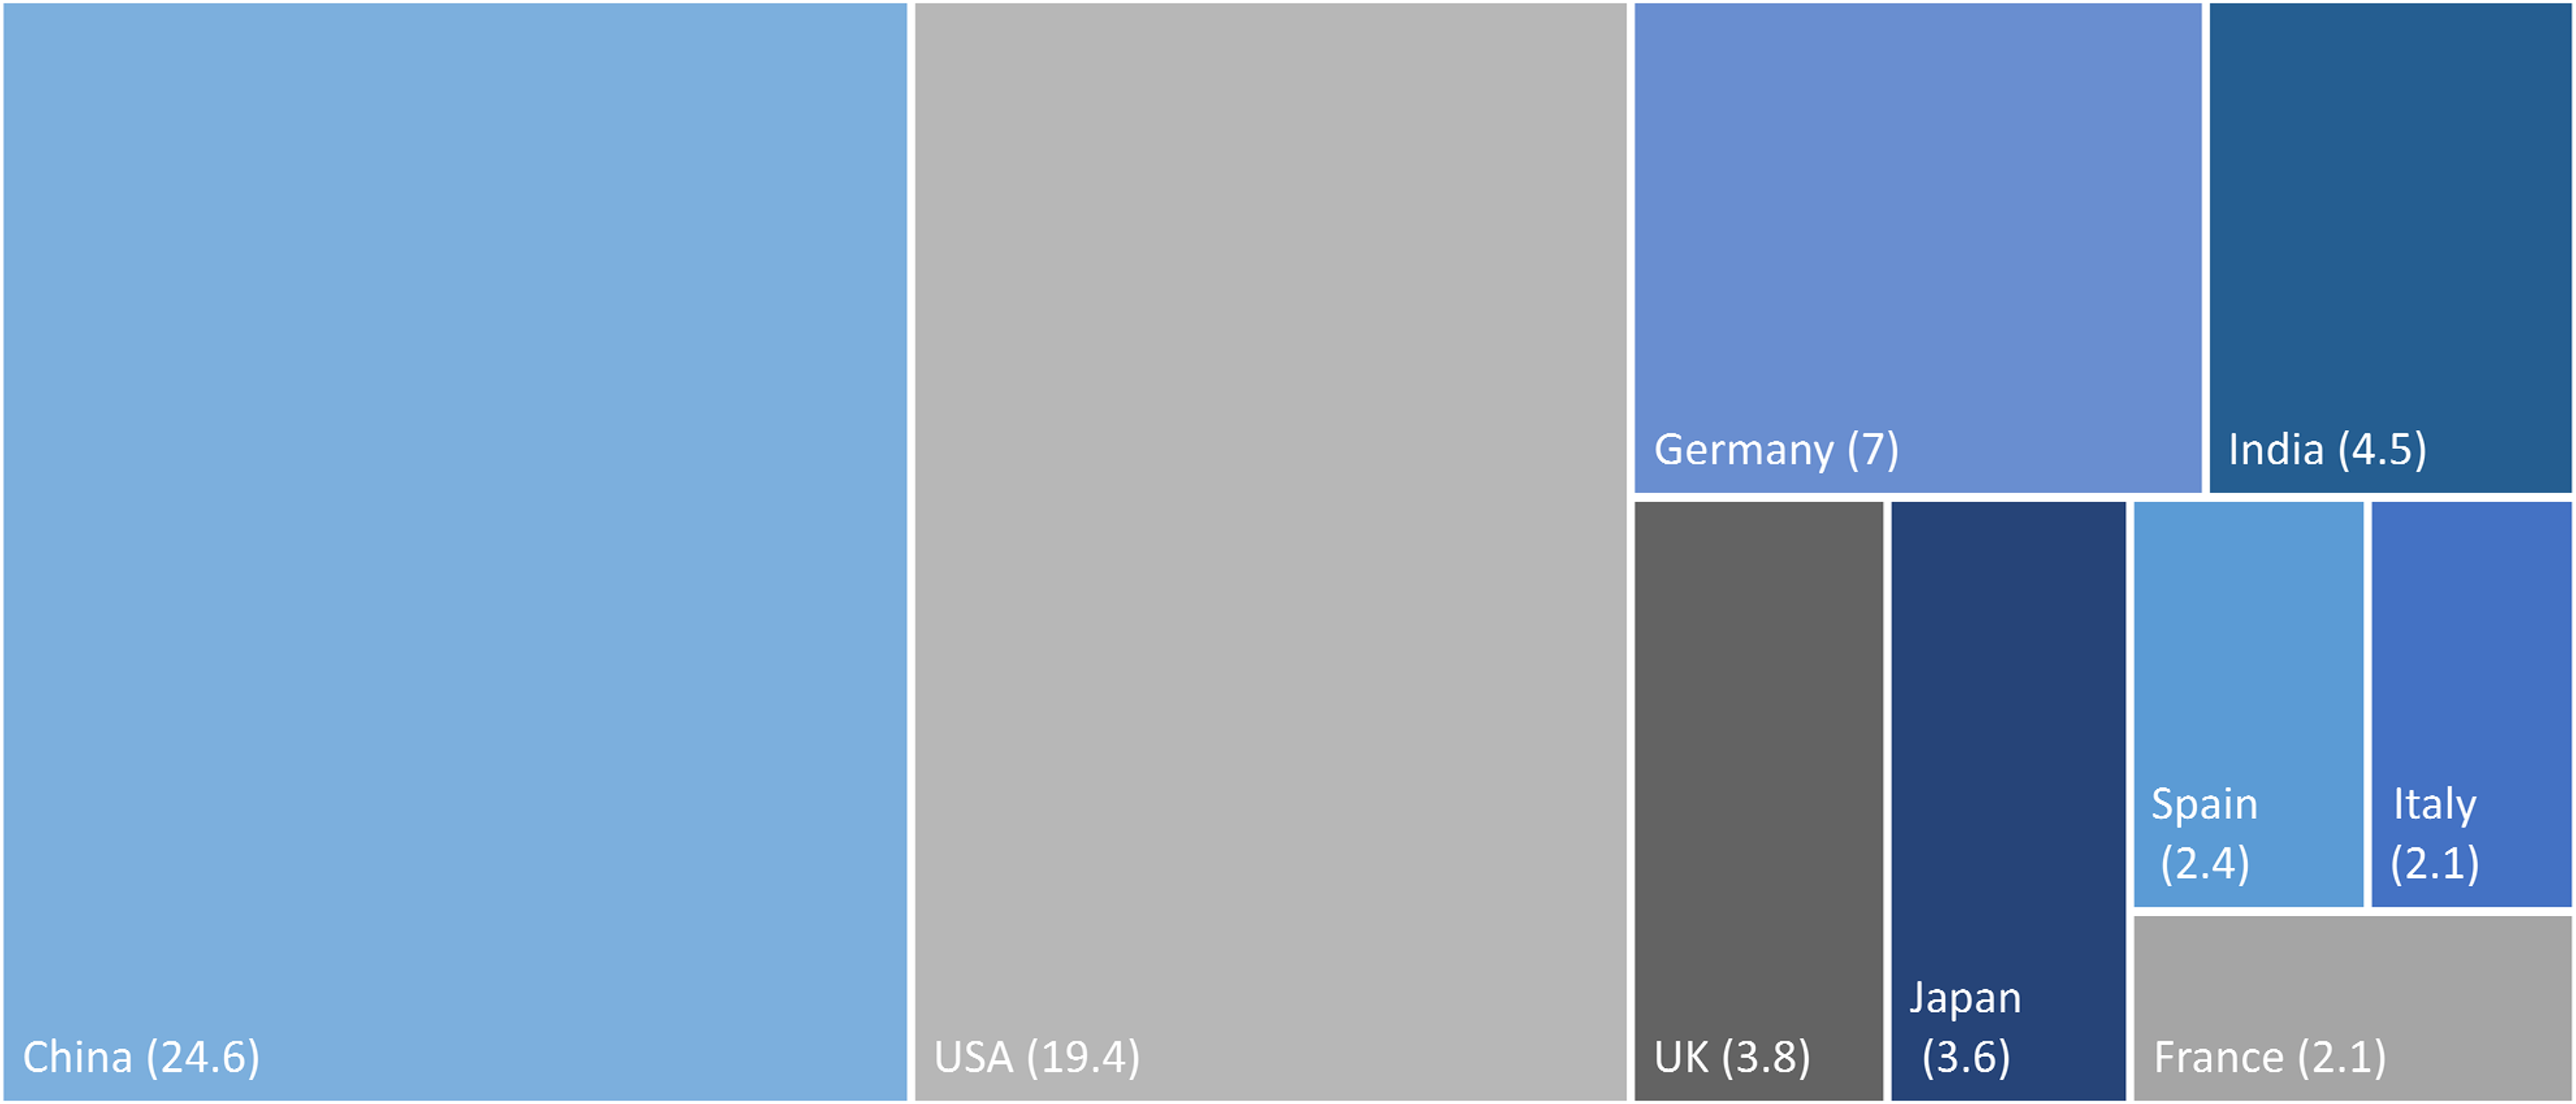
Contribution of the top 10 economies to the global REC (%). Source: Statistical Review of World Energy 2021.
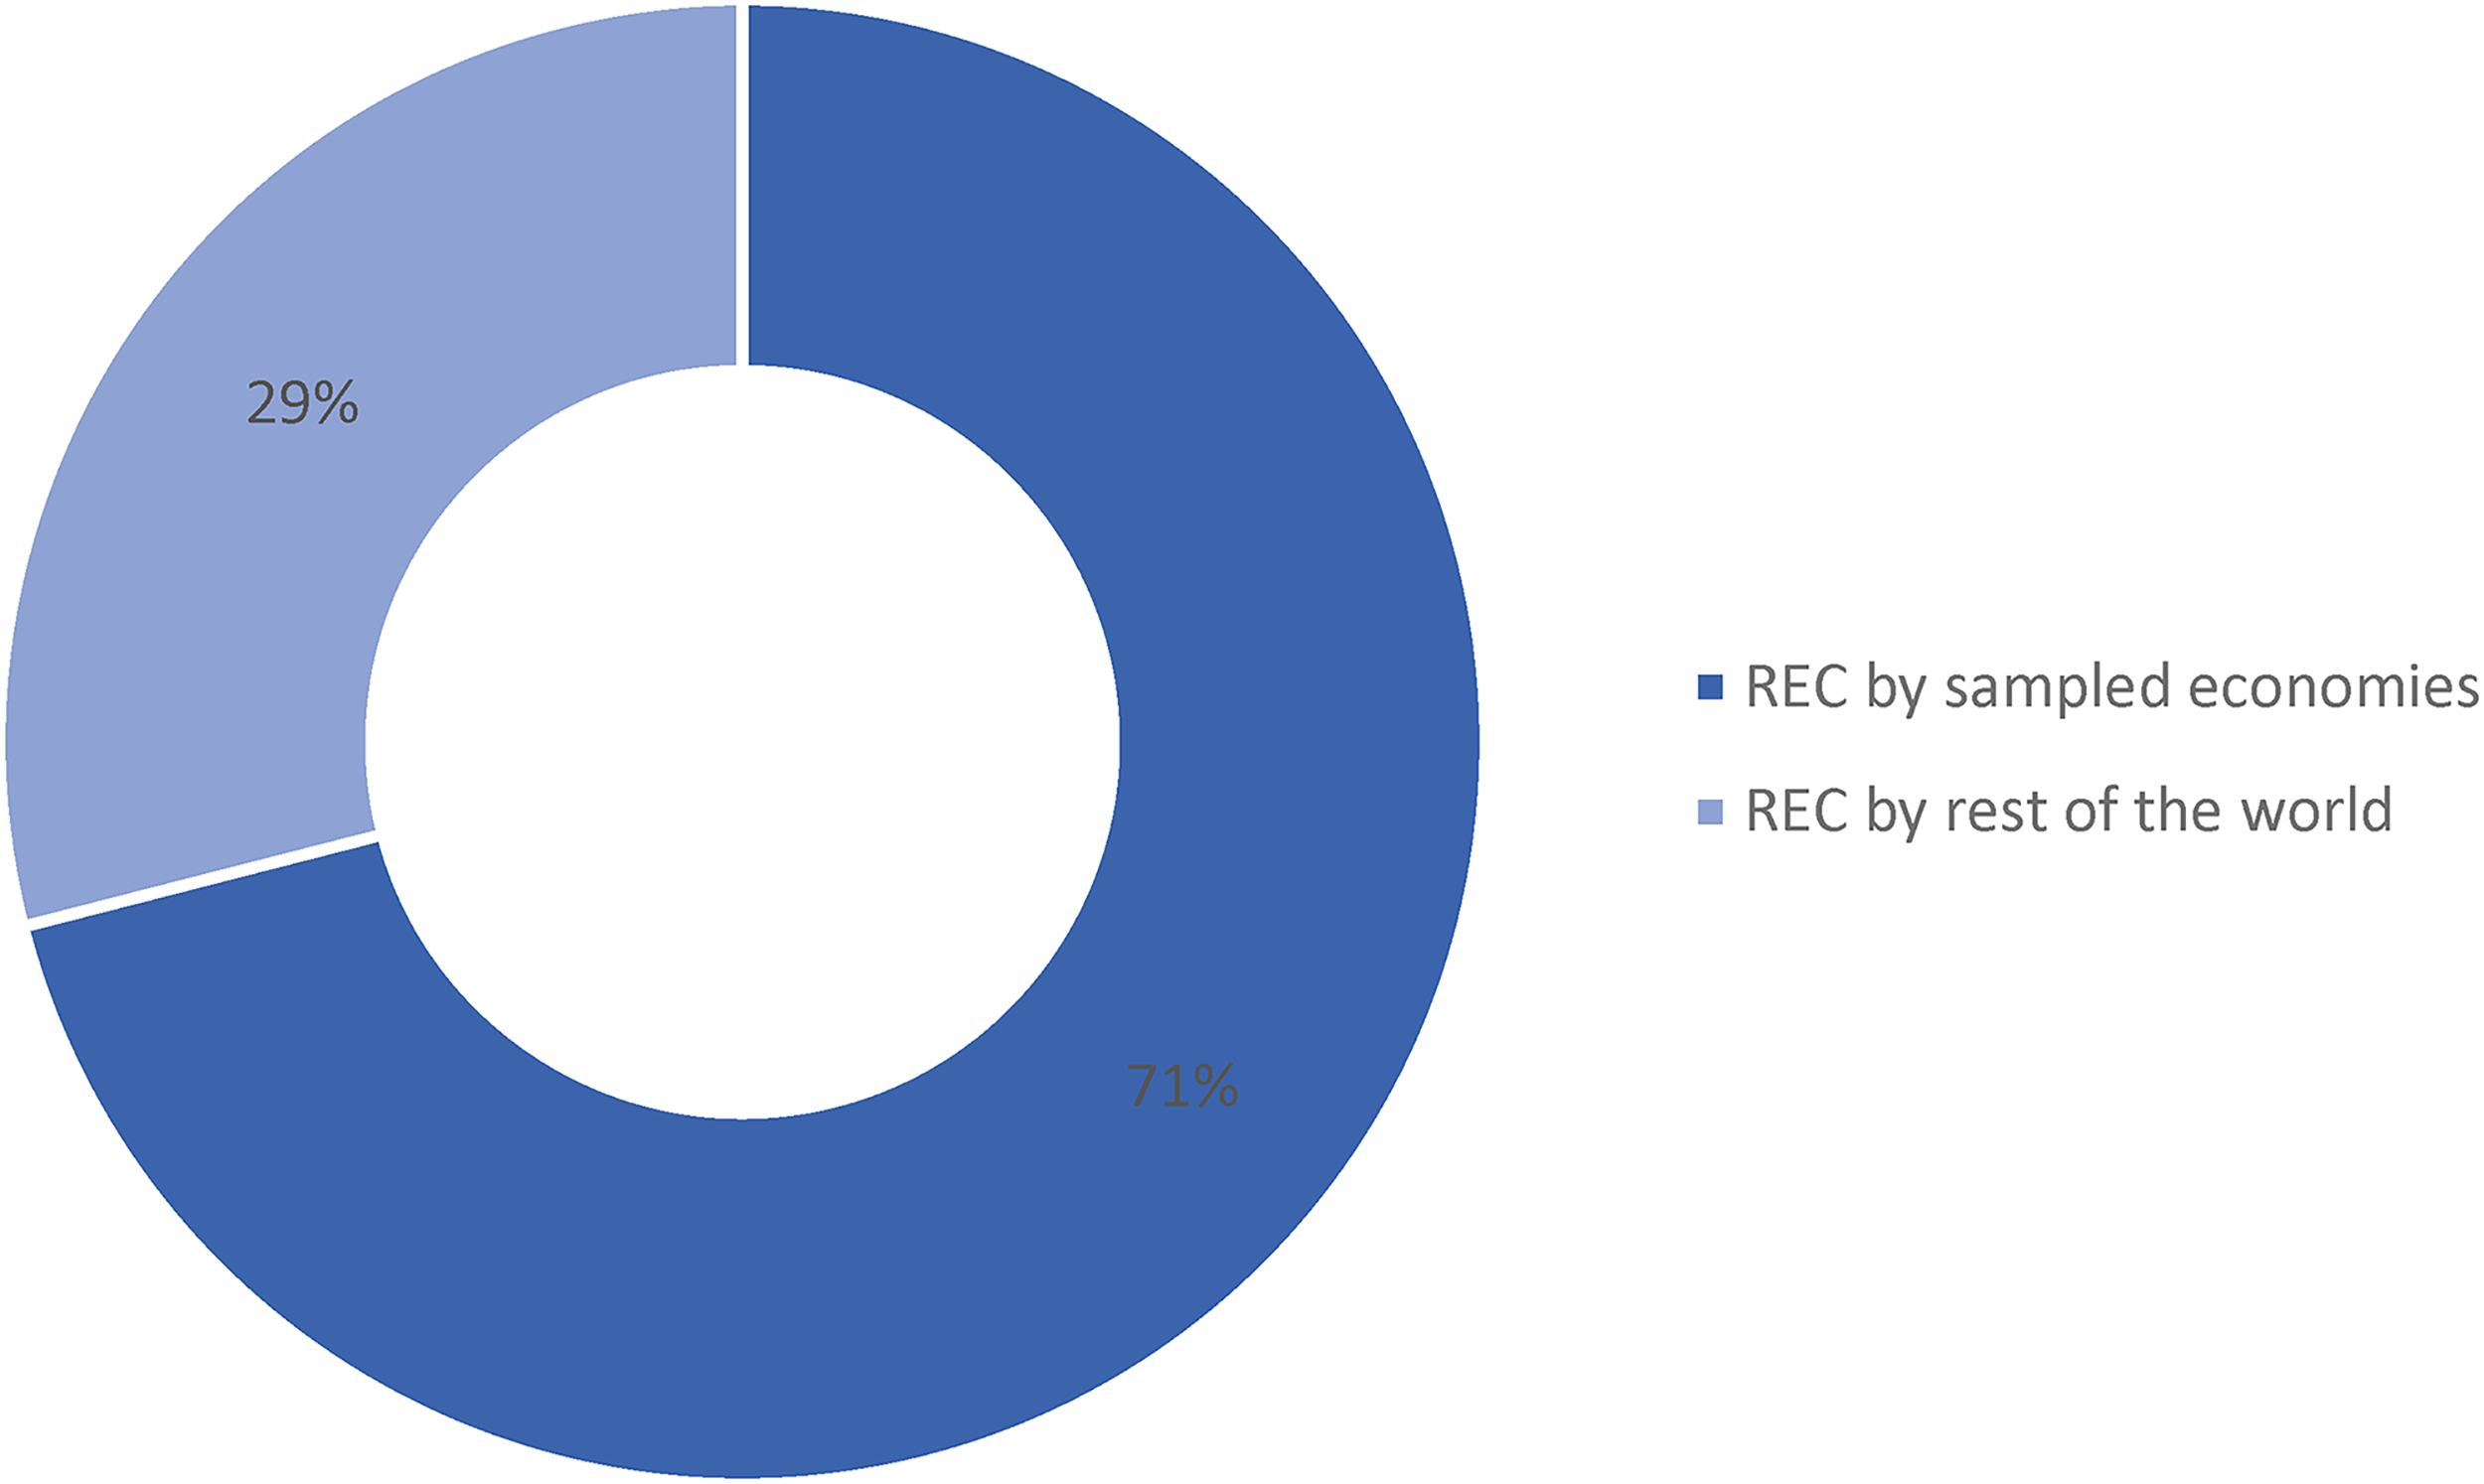
Share of top economies in global consumption. Source: Statistical Review of World Energy 2021.
Also, there are the top economies that significantly contribute to the global GDP. For instance, China produces $14.72 trillion, USA produces $20.89 trillion, Germany produces $3.85 trillion, India produces $2.66 trillion, UK produces $2.76 trillion, Japan produces $5.06 trillion, Spain produces $1.28 trillion, France produces $2.63 trillion, Italy produces $1.89 trillion and Canada produces $1.64 trillion GDP, toward the global GDP according to WDI. 16 Hence, the adoption of such large economies is utterly rational to do the empirical analysis in order to draw the pertinent policies for global level recommendations.
The remaining part of the paper possesses the following order. The second section expresses the prior pertinent literature to highlight the research gap. In the third section, the theoretical framework is established to support the model and the data are presented. The fourth section elaborates the econometric modeling and methods, while the results and discussion are presented in fifth section. The last section summarizes the findings followed by salient policies recommendations.
Literature review
Until 2010, the exploration of REC's drivers could not get a remarkable attention by environmentalists. Later, Kyoto Protocol's first commitment and oscillations in energy prices including rising oil prices tended to exhort the researchers to focus on renewable energy and its determinants. 17 In this regard, this section covers the pertinent literature, while categorizing it into the following three main sub-sections: (i) determinants of renewable energy, (ii) technologies and energy nexus, and (iii) macroeconomic uncertainty and energy nexus. The detailed discussion of each sub-section is given below.
Determinants of renewable energy
This segment documents the prior literature on the overall determinants of renewable energy, along with covering the series included in the model as controlled variables, viz, GDP, NRR, GLB, and HDI. Where the GDP-REC nexus is concerned, many economists endeavor to examine how renewable energy responds to the GDP and deduce inconclusive findings. For instance, Nawaz et al. 12 investigate the likely effects of GDP on REC for N-11 and BRICS economies, while deploying difference in differences technique. The findings unveil that economic growth works as a significant factor in enhancing REC. Likewise, Gozgor et al. 13 aim at analyzing the impacts of GDP on REC, and to do so, the study utilizes the data from 1970 to 2015 for 30 OECD economies. Deploying the first-generation approaches, the authors conclude that REC significantly gains on account of rise in OECD economies’ GDP. Jacqmin, 18 in the similar vein, deploys the panel data for 28 European Union members to check the role of economic development on the production of REC. The results suggest that economic development significantly encourages the production process of REC. Another study by Chen 19 for China's 30 provinces divulges the effects of GDP on REC. To this end, author takes the panel data from 1993 to 2013 and deploys dynamic-system GMM. The outcome asserts that growth in GDP significantly triggers REC in China.
Also, Lin and Moubarak 20 testify to the link between GDP and REC, employing the data from 1977 to 2011 for China. Deploying the ARDL technique, the article's results reveal that economic growth propitiously boosts the renewable energy sector in the both time-periods. Emir and Bekun 21 revealed a unidirectional causality running from renewable energy to economic growth for Romina. Another relevant document by Salim and Rafique 22 examines the dynamic effects of economic development on REC, using the time series data. The article affirms that the upward trends in Turkey and Philippines’ per-capita income caused to improvement of the renewable energy industry. By the same token, Sadorsky23,24 seeks the impacts of GDP (per-capita) on renewable energy demand in G7 and selected 18 emerging economies. Both studies deduce that an increase in per-capita income escalates the demand for renewable energy. On the contrary, many scholars contradict the prior findings, arguing that economic growth possesses the negative association with renewable energy. For example, Aguirre and Ibikunle, 25 taking the panel data from 1990 to 2010, strive to check the effects of output on renewable energy growth. To do so, the authors select the 38 economies and deduce that the growth in GDP significantly impedes the production process of renewable energy. In a similar vein, Marques et al. 26 study the nexus between GDP and REC, employing the data from 1990 to 2006 for the selected European economies. Applying the multiple econometric methods, the study confirms that an upsurge in GDP tends to deteriorate the renewable energy production. Besides, Omri and Nguyen 27 take the data (1990–2011) for 64 economies and classify it into high income, middle income, low-income, and global economies. Intriguingly, the findings determine that GDP has significantly positive link with renewable energy sector in high- and middle-income economies. However, the sample of low-income and global countries reveal that economic growth exhibits a passive impact on REC. Based on the above review, we can infer that the effects of GDP on renewable energy sector are inconclusive and necessitate the more exploration.
As for the natural resources and renewable energy nexus, we argue that inconsequential attention is paid to this area. For example, there is only one empirical study by Ahmadov and Borg, 14 to date, that explores the role of natural resources in renewable energy industry. For this, the study opts the panel data from 1997 to 2015 for the European Union economies. The traditional random effects and fixed effects techniques are deployed for econometric analysis. The findings demonstrate that renewable energy sector gains the benefits and shows a significant response to upwards trend in European Union's output. Based on this study, it can be inferred that natural resources may play a critical role in determining the renewable energy and it highly encourages for more research in this area.
Like the natural resources and renewable energy nexus, the studies on the nexus between globalization and renewable energy are limited. The researchers have asserted that globalization has significant association with energy consumption. For instance, Huang et al. 28 find the relationship between both variables for selected 98 economies. To this end, the study uses the panel data from 1980 to 2016 and results that globalization significantly causes to trigger the energy combustion. Similarly, Shahbaz et al. 29 deploy the data from 1970 to 2015 for selected 98 economies to check the response of energy consumption to globalization. The outcome suggests that 64 (out of 98) economies tend to decrease the energy consumption on account of an increase in globalization. Also, Saud and Chen, 30 deploying the ARDL method, concludes that globalization shrinks the demand for energy usage in China. Additionally, Sadorsky 31 analyzes the nexus for eight Middle Eastern economies for 1980–2007. The FMOLS estimates show that globalization significantly amplifies the demand for energy use. Further, the same results are documented by Cole 32 for 32 developed and developing economies, while employing the data from 1975 to 1995. The previous studies confirm that the globalization is the prime driver of energy sector and we can infer that it is highly plausible that globalization can also affect REC which is central factor of environmental quality.
The literature body, on the other hand, exhibits that less attention is paid to this side and only one study by Gozgor et al. 13 is available that explores the impacts of Eco-globalization on REC. To do this, the authors choose the sample of OECD economies for 1970–2015. The findings suggest that REC shows a significantly positive response to the globalization. The scant literature induces to divulge the nexus between both variables in the context of sustainable development. Besides, Paramati et al. 33 take the sample of 20 developing and 23 developed economies for 1991–2011 to investigate the effects of stock markets on REC. The results extrapolate that REC has the significant positive link with stock markets in developed nations. Further, environment of the developed economies gets improvement due to stock markets. However, the sampled developing nations endure environmental degradation on account of negative association between stock markets and REC. Another study by Paramati et al. 34 confirm that investment and stock markets lead to boost the renewable energy projects through facilitating the investors by green finance in G20 economies. In addition, (domestic and foreign) capital stock in EU, OECD, and G20 nations plays a remarkable role through triggering the investment in renewable energy sector. 35
ICTs-energy nexus
Recently, it is widely acknowledged that ICTs’ impacts on all aspects of human life are swiftly increasing. 36 Similarly, it is also noticed that the astonishing expansion in ICTs has the considerable contribution in the energy sector. 7 In this context, several scholars inspect the role of ICTs in the energy sector and reports different results. For example, Arshad et al. 7 examine the effects of ICTs on energy combustion for South and Southeast Asia region, taking the data from 1990 to 2014. The article unveils that the intensity to consume energy tends to rise due to ICTs. Also, Shabani and Shahnazi 37 conclude that ICTs significantly affects the energy use in industrial sector in the case of Iran. Likewise, Van Heddeghem et al. 36 assert that the three categories of ICTs (i.e., data center, personal computers, and communication networks) significantly escalate the use of energy from 2007 to 2012. In a similar vein, Salahuddin and Alam 38 analyze the nexus and conclude that energy use spurs on account of internet. The same results were also documented by Sadorsky 39 for emerging economies and Cho et al. 40 for Korea.
On the other hand, some researchers are of the view that ICTs contract the energy consumption by increasing the efficiency in energy sector. For example, Collard et al.
41
seek the role of communication networks in energy sector for France. The results suggest that digitalization plays a remarkable role in reducing the energy consumption. Another relevant study by Ishida
8
tends to check how energy usage responds to the ICTs. The outcome confirms that ICTs ameliorate the environmental quality by declining the dependency on conventional energy through increasing the efficiency. Since the renewable energy is part of energy sector that, it is highly possible that ICTs can affect this sector. Further, there is, approximately, a mutual consensus on that REC significantly enhances the environmental quality by decreasing the carbon emissions.
42
However, the prior literature neglects the considerable nexus between ICTs and REC despite an enormous importance of this area. To fill the gap in existing literature, it is worth exploring the role of ICTs in determining the REC. On the basis of the above discussion, we formulate the following hypothesis.
MEU-energy nexus
The debate on macroeconomic uncertainty and its effects of different economic indicators is also one of the hot issues in the current era. 9 In this context, there are several studies that strive to analyze the dynamic effects of MEU on international trade, 9 economic growth, 43 industrialization, 44 tourism, 45 investment, 46 FDI, and inflation. 47 Likewise, the economists also investigate the nexus between MEU and energy sector. For instance, Ma et al. (2021), Ratti, 48 Zhang et al., 49 and Reboredo and Wen 50 check the effects of macroeconomic uncertainty on energy consumption and conclude that uncertainty significantly hinders the energy combustion.
Likewise, some environmentalists scrutinize the effects of eco-uncertainty on REC and report inconclusive outcome. For example, Lei et al.
51
probe the relationship between economic-uncertainty and REC in China, using the time series data from 1990 to 2017. The results affirm that the graph of REC tends to fall due to increase in MEU. Similarly, |Balcilar et al.
52
report that renewable energy investors hesitate to the invest in renewable energy sector during the period of high uncertainty. Another study by Shafiullah et al.
53
also employ the data from 1986 to 2019 for USA and conclude that the investment level in renewable energy sector declines due to the rise in MEU. However, some scientists contradict the previous outcomes and suggest that the link between both variables is weak and insignificant. For instance, Zhang et al. (2019) and Lundgren et al.
54
examine the effects of MEU with the consort of different variables on REC and deduce that in the long run, renewable energy does not exhibit any response to the macroeconomic uncertainty. Considering the above discussion, the available literature on nexus between macroeconomic uncertainty and REC indicates two important gaps. First, there are only few studies on this area, while the excessive importance of this area requires more investigation. Second, the inconclusive outcome also necessities the need of more study in this area. REC. On the basis of the above discussion, we formulate the following hypothesis.
Based on the aforementioned discussion, we endorse the literature gap in following ways. First, the entire pertinent literature demonstrates that despite an enormous importance of ICT, a single study investigates how ICT affects the REC. Since ICT has a significant role in affecting the various macroeconomic variables, it seems rational to explore the dynamic effects of ICT on REC. Second, the previous literature also highlights that a few studies seek the impacts of MEU on REC despite that many scholars have reported the notable association of MEU with many economic variables as Table 1 shows. Also, the available studies target only single economies; hence, we cannot draw the global level policies from these findings. The remarkable role of ICT and MEU in determining the REC but limited literature encourage the recent study to divulge the impacts of both variables on REC that is a vital variable for sustainable and green development growth. Third, Table 1 underlines that majority of the relevant studies rely on the first-generation technique that cannot handle the advanced econometric issue such as heterogeneity, cross-section dependence, and structural break effects. Hence, is imperative to deploy such techniques that can handle the all-advanced econometric issues to attain the robust and reliable findings in the context of policy recommendations. Hence, to address the aforementioned literature gaps, the recent article aims at probing the nexus between ICT, MEU, and REC with the consort some other economic indicators for top renewable energy-consuming nations.
Determinants of REC.
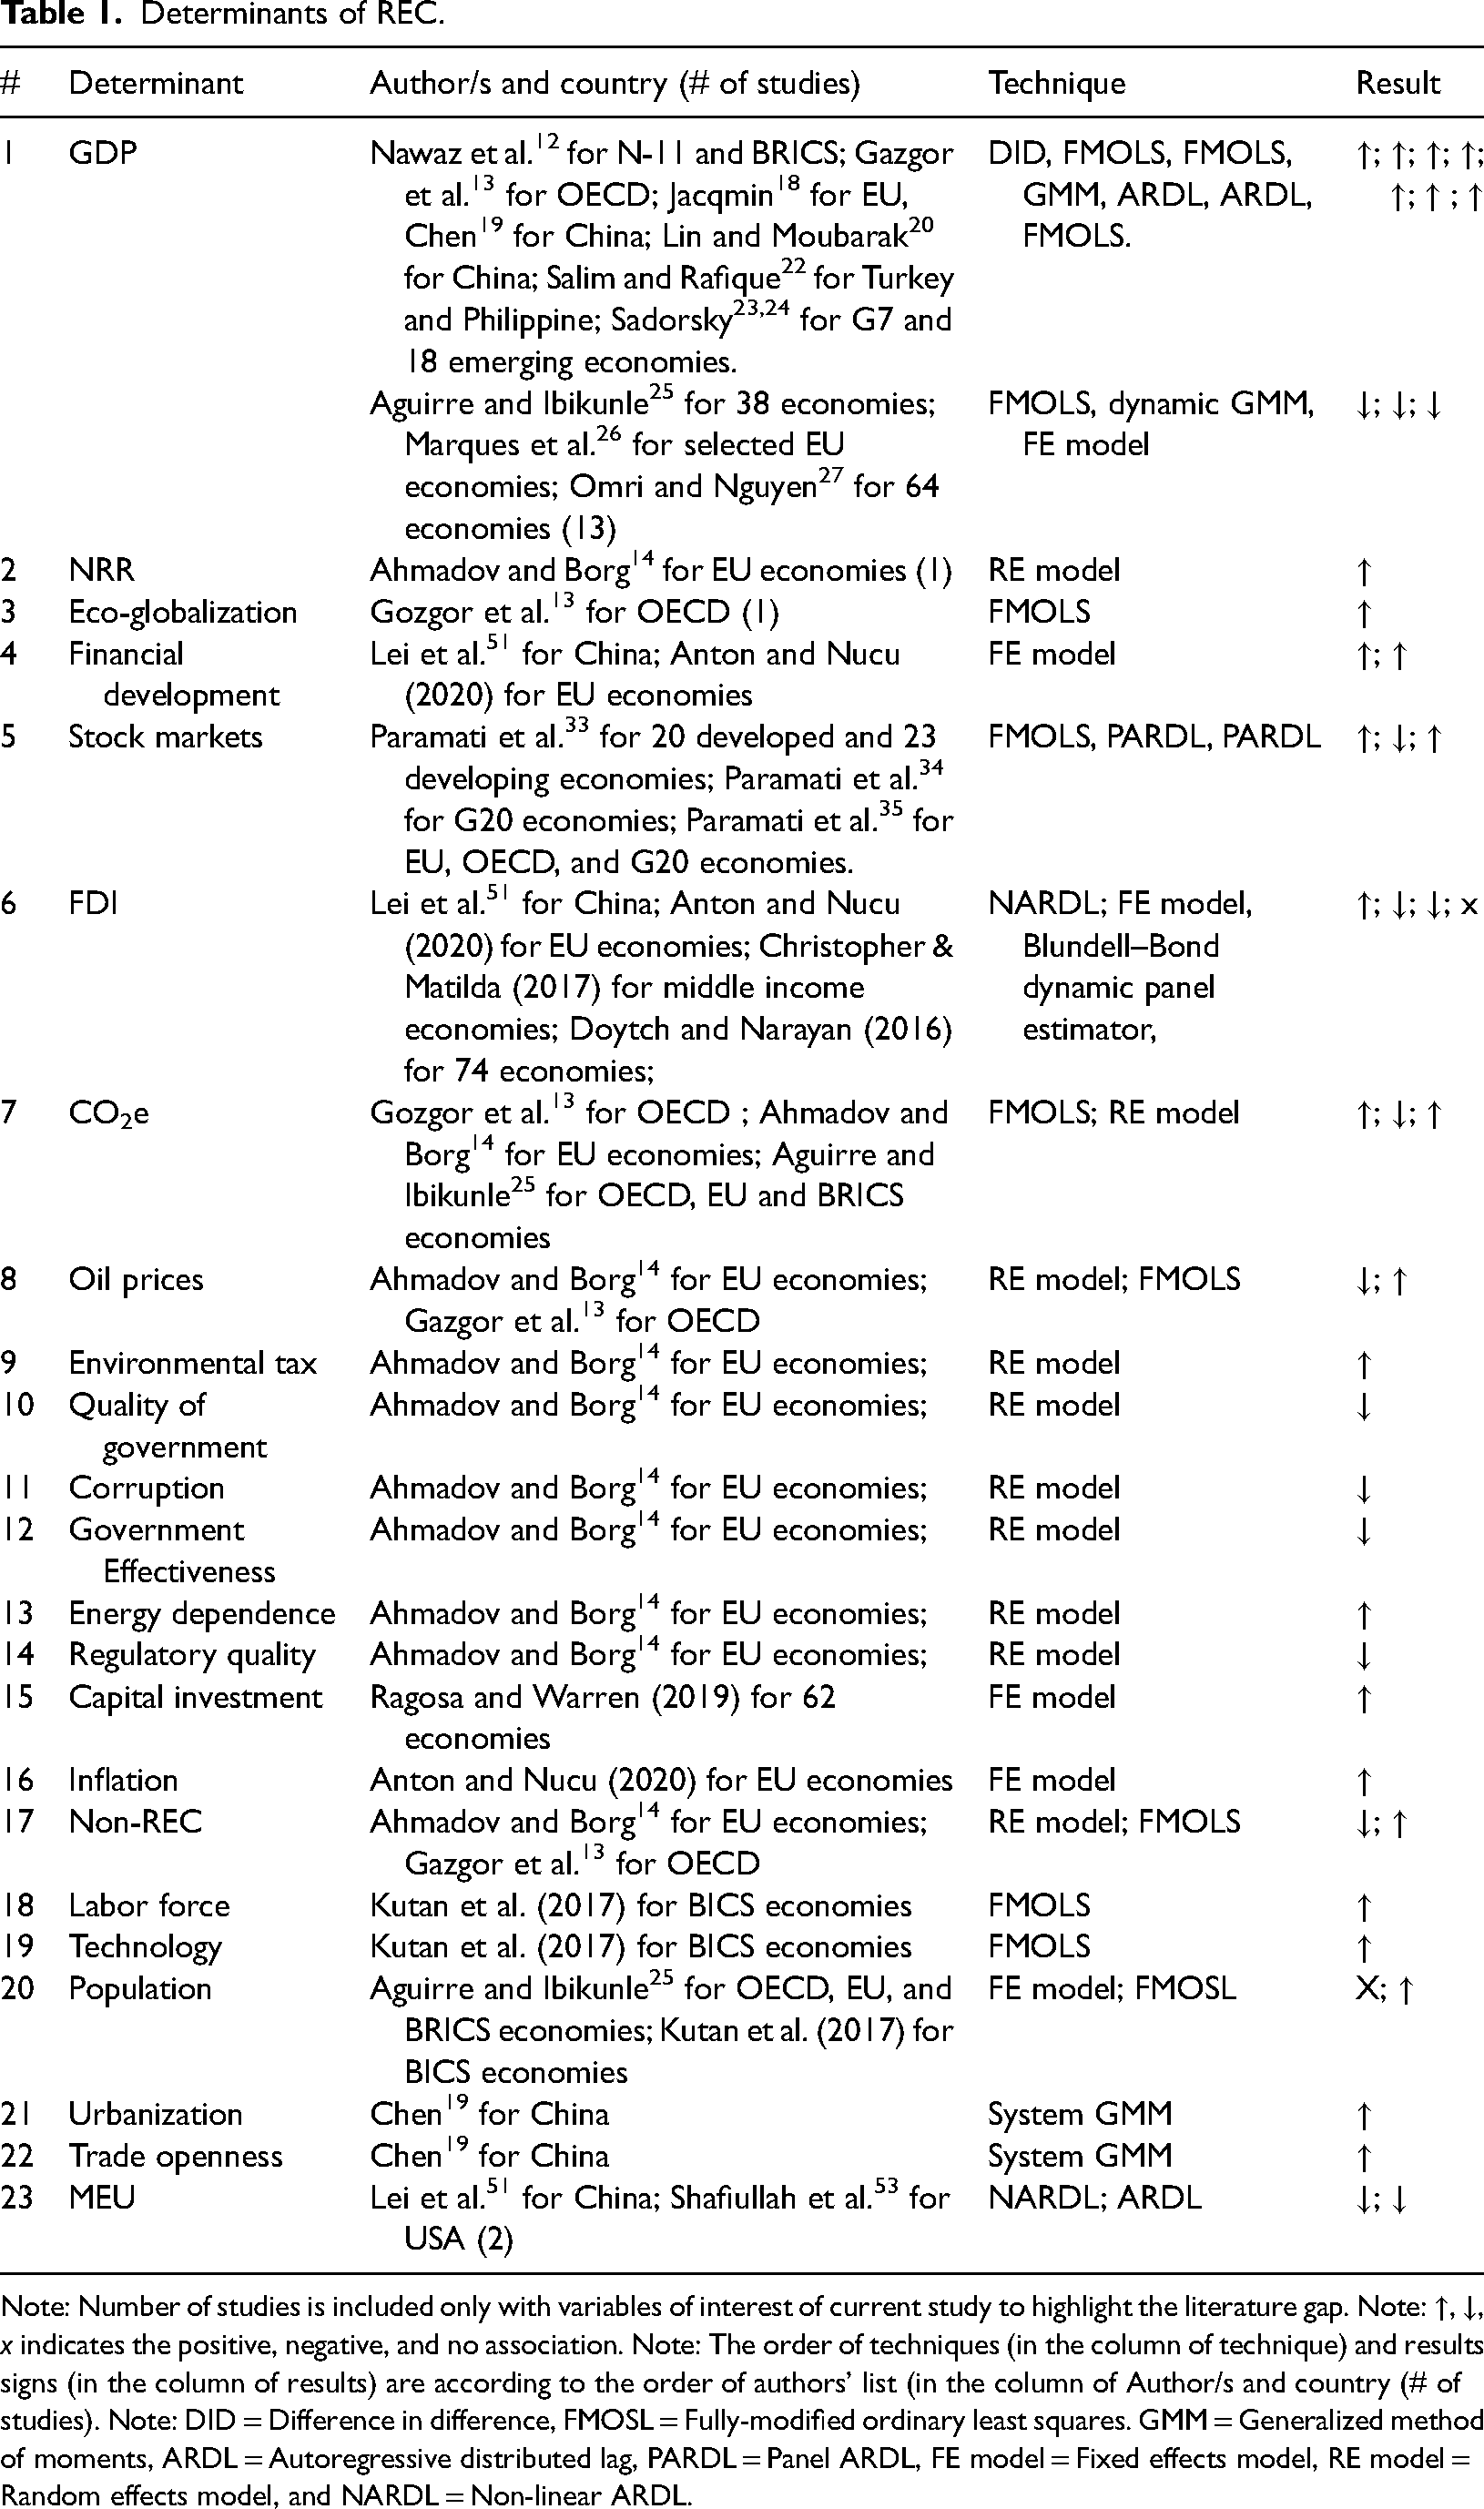
Note: Number of studies is included only with variables of interest of current study to highlight the literature gap. Note: ↑, ↓, x indicates the positive, negative, and no association. Note: The order of techniques (in the column of technique) and results signs (in the column of results) are according to the order of authors’ list (in the column of Author/s and country (# of studies). Note: DID = Difference in difference, FMOSL = Fully-modified ordinary least squares. GMM = Generalized method of moments, ARDL = Autoregressive distributed lag, PARDL = Panel ARDL, FE model = Fixed effects model, RE model = Random effects model, and NARDL = Non-linear ARDL.
Model and data
Conceptual framework
Since the core focus of the current article is to analyze the dynamic effects of ICTs and MEU on REC, taking NRR, GDP, GLB, and HDI as controlled variables, this part tends to erect the theoretical underpinning to express how the modeled series affect REC variables. In this context, Figure 4 depicts the several channels by which ICTs contributes to trigger the REC. In general, these channels can be classified into three main parts: supply side effects, positive externalities and demand side effects. The supply side effects can be further split into four channels: (i) to create ease in green financing, (ii) to lower the production cost, (iii) to build smart-grid stations, and (iv) to reduce asymmetric information. The first and the foremost supply-side channel is that ICTs boost REC by facilitating the green finance to renewable energy sector. For instance, the penetration of the mobile banking and the internet banking help in reducing complexity regarding the finance information and maintaining the direct link with green-investors. Similarly, such kind of banking also enables the producers to make comparison regarding the different bank offers and facilities on the finance and loans. Also, ICTs-based digital banking enhances the financial institutions’ infrastructure that fosters the financial intermediation's operational efficiencies. All such improvements tend to create the easiness for green financing. Accordingly, it encourages the green-investors to do more investment in renewable energy sector; consequently, the rise in the sector results in increase in REC.
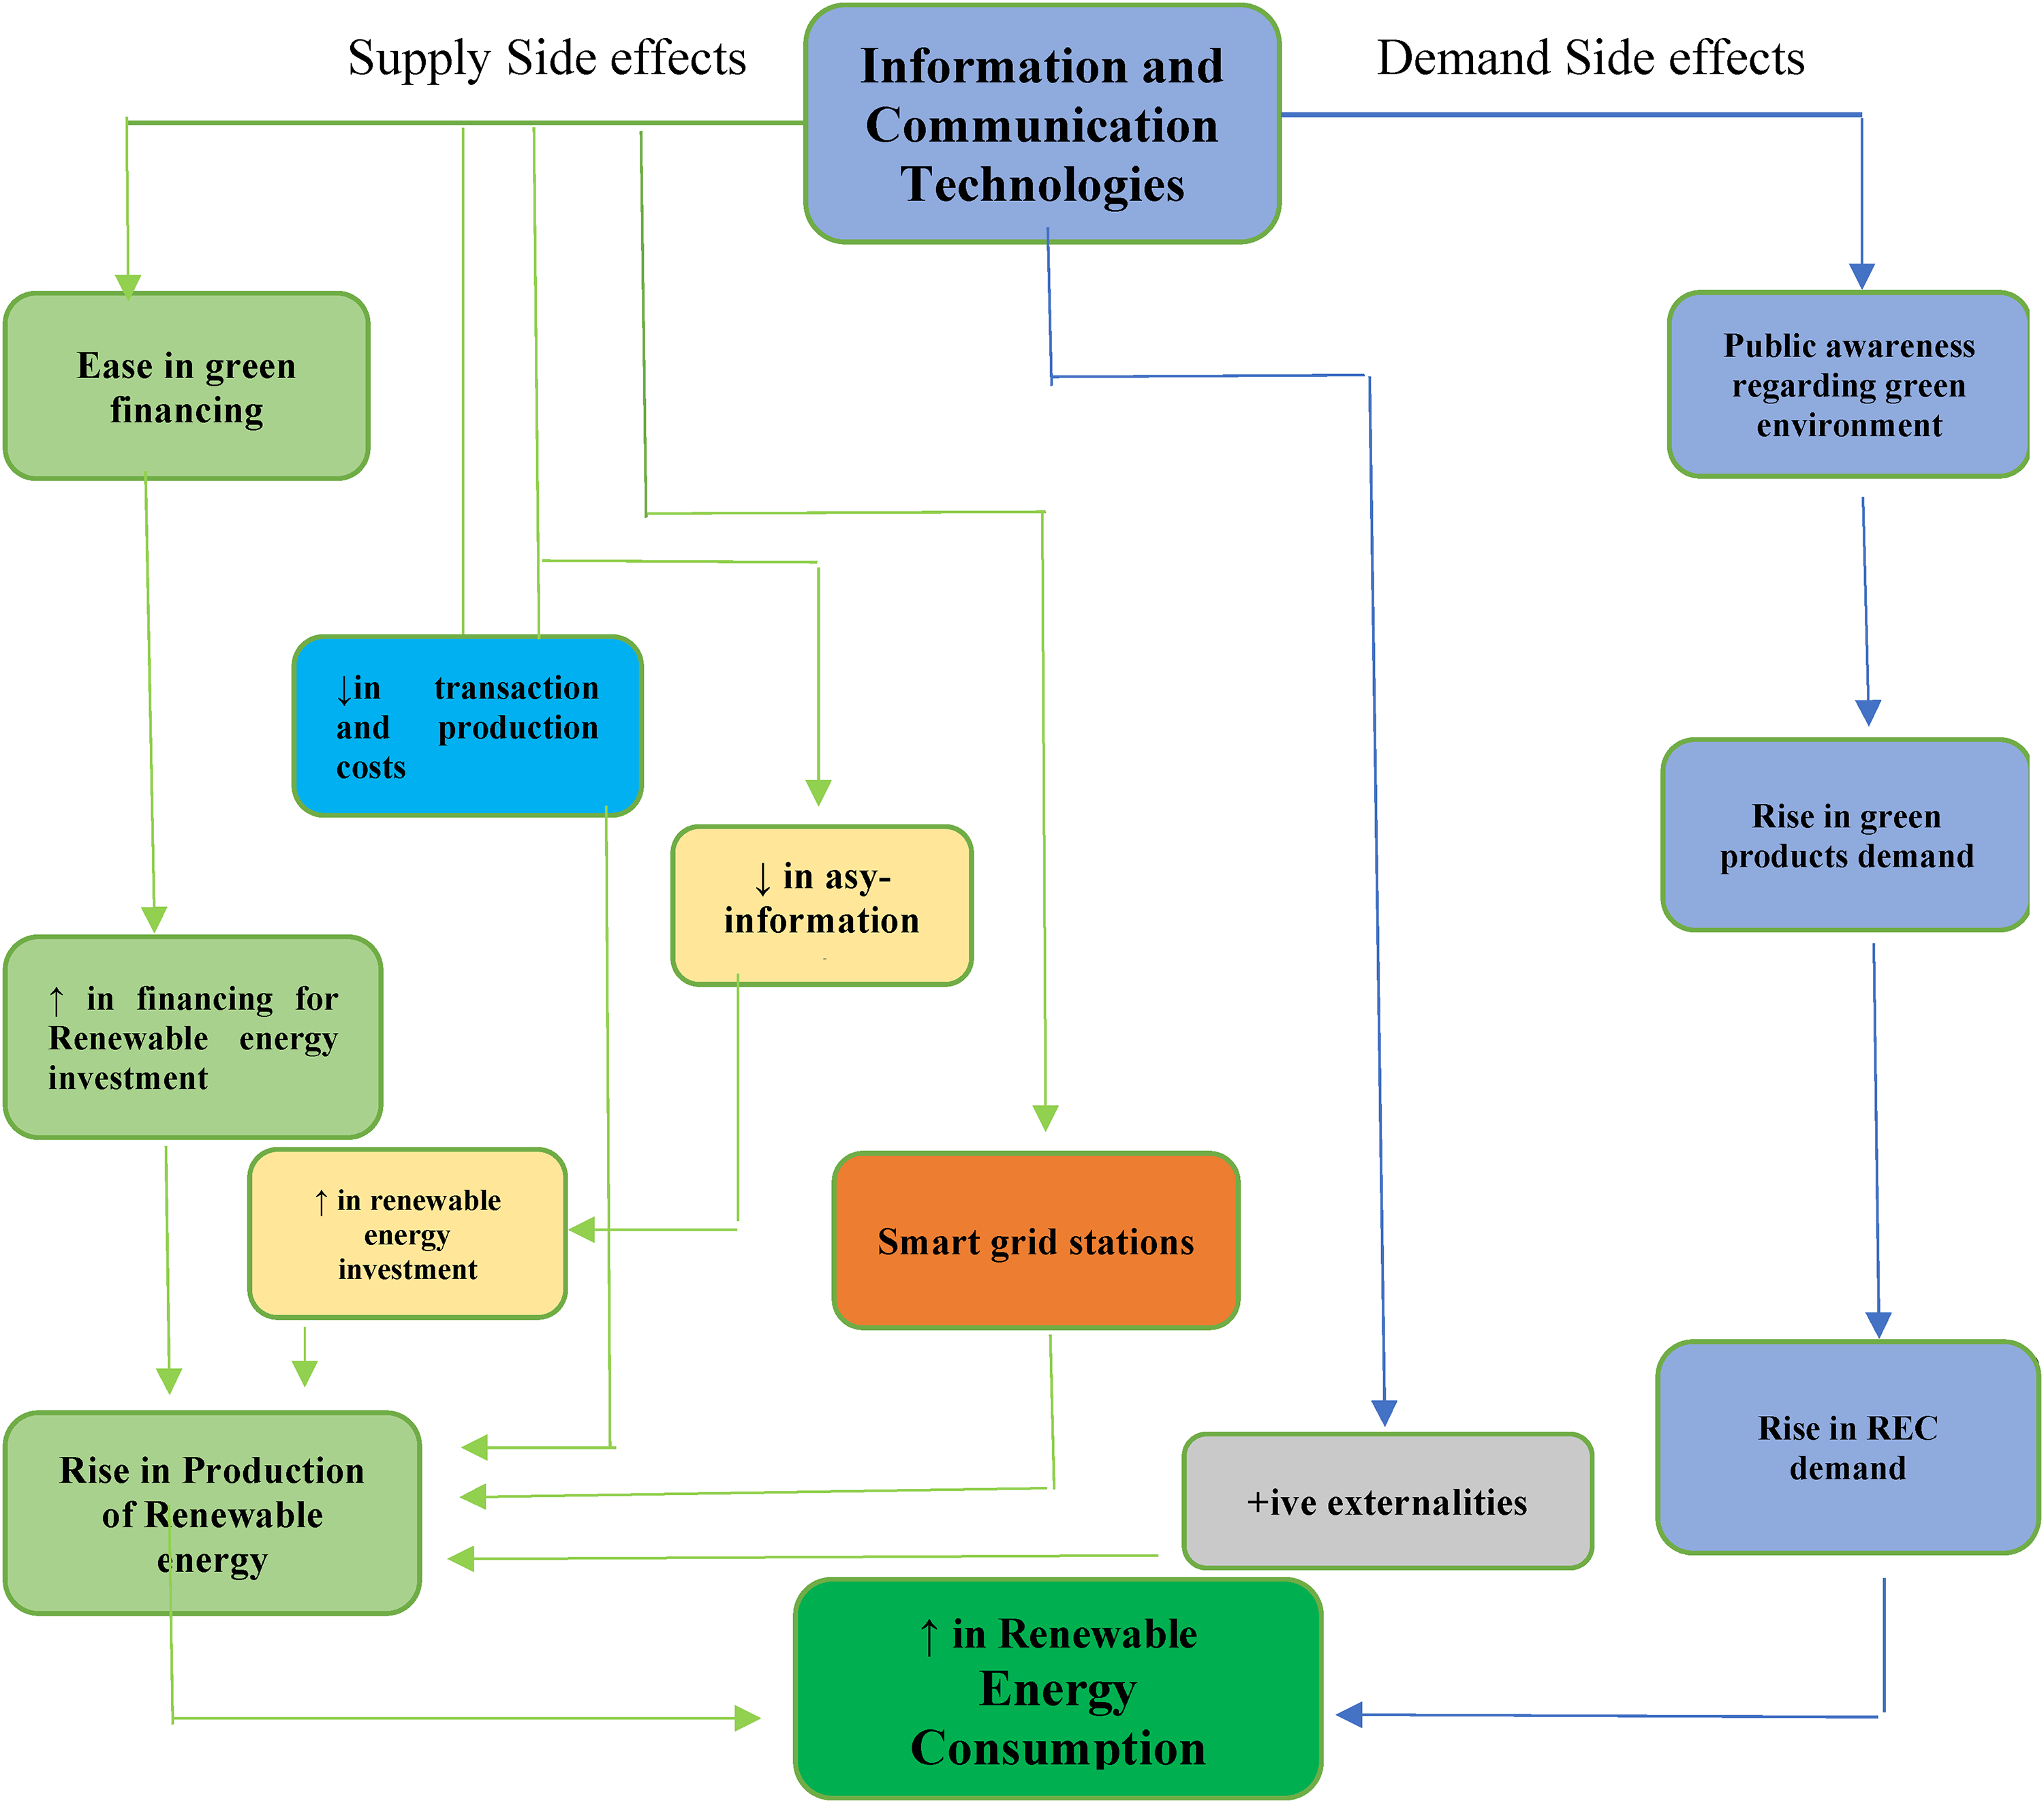
The channels of ICTs to improve REC.
The second supply-side channel is ICTs play a remarkable role in reducing the production cost in several ways. For example, online and mobile banking contract the cost of financial transactions by providing accurate and time-saving information. Likewise, ICTs also dwindle the search cost, smooth the monitoring and controlling the performance, and yield the more production flexibility: all these processes result in reducing the assets’ transaction and production costs. Accordingly, the environment-oriented investment is increased which leads to increases REC. The third supply-side channel is: the use of ICTs’ tool declines the cost of communication, computation, and data processing and this process gives the faster and broader access to obtain the symmetric and required information regarding finance facilities and investment decisions. In this way, ICTs minimize the probability of asymmetric information that motivates the producers to do take certain decisions for investment in renewable energy; thus, it increases REC.
The last supply-side channel is that ICTs cut down the complexities in conventional grid station and improve the grid's infrastructure of transmission, storage, management, and distribution by injecting the resiliency, reliability, and efficiency: accordingly, conventional grid turns into “smart grid station.” The process tends to facilitate the production and distribution of renewable energy from different sources to various destinations such as houses and shopping malls etc., as Figure 5 depicts the overall scenario. As a result, the REC's trend moves upward.
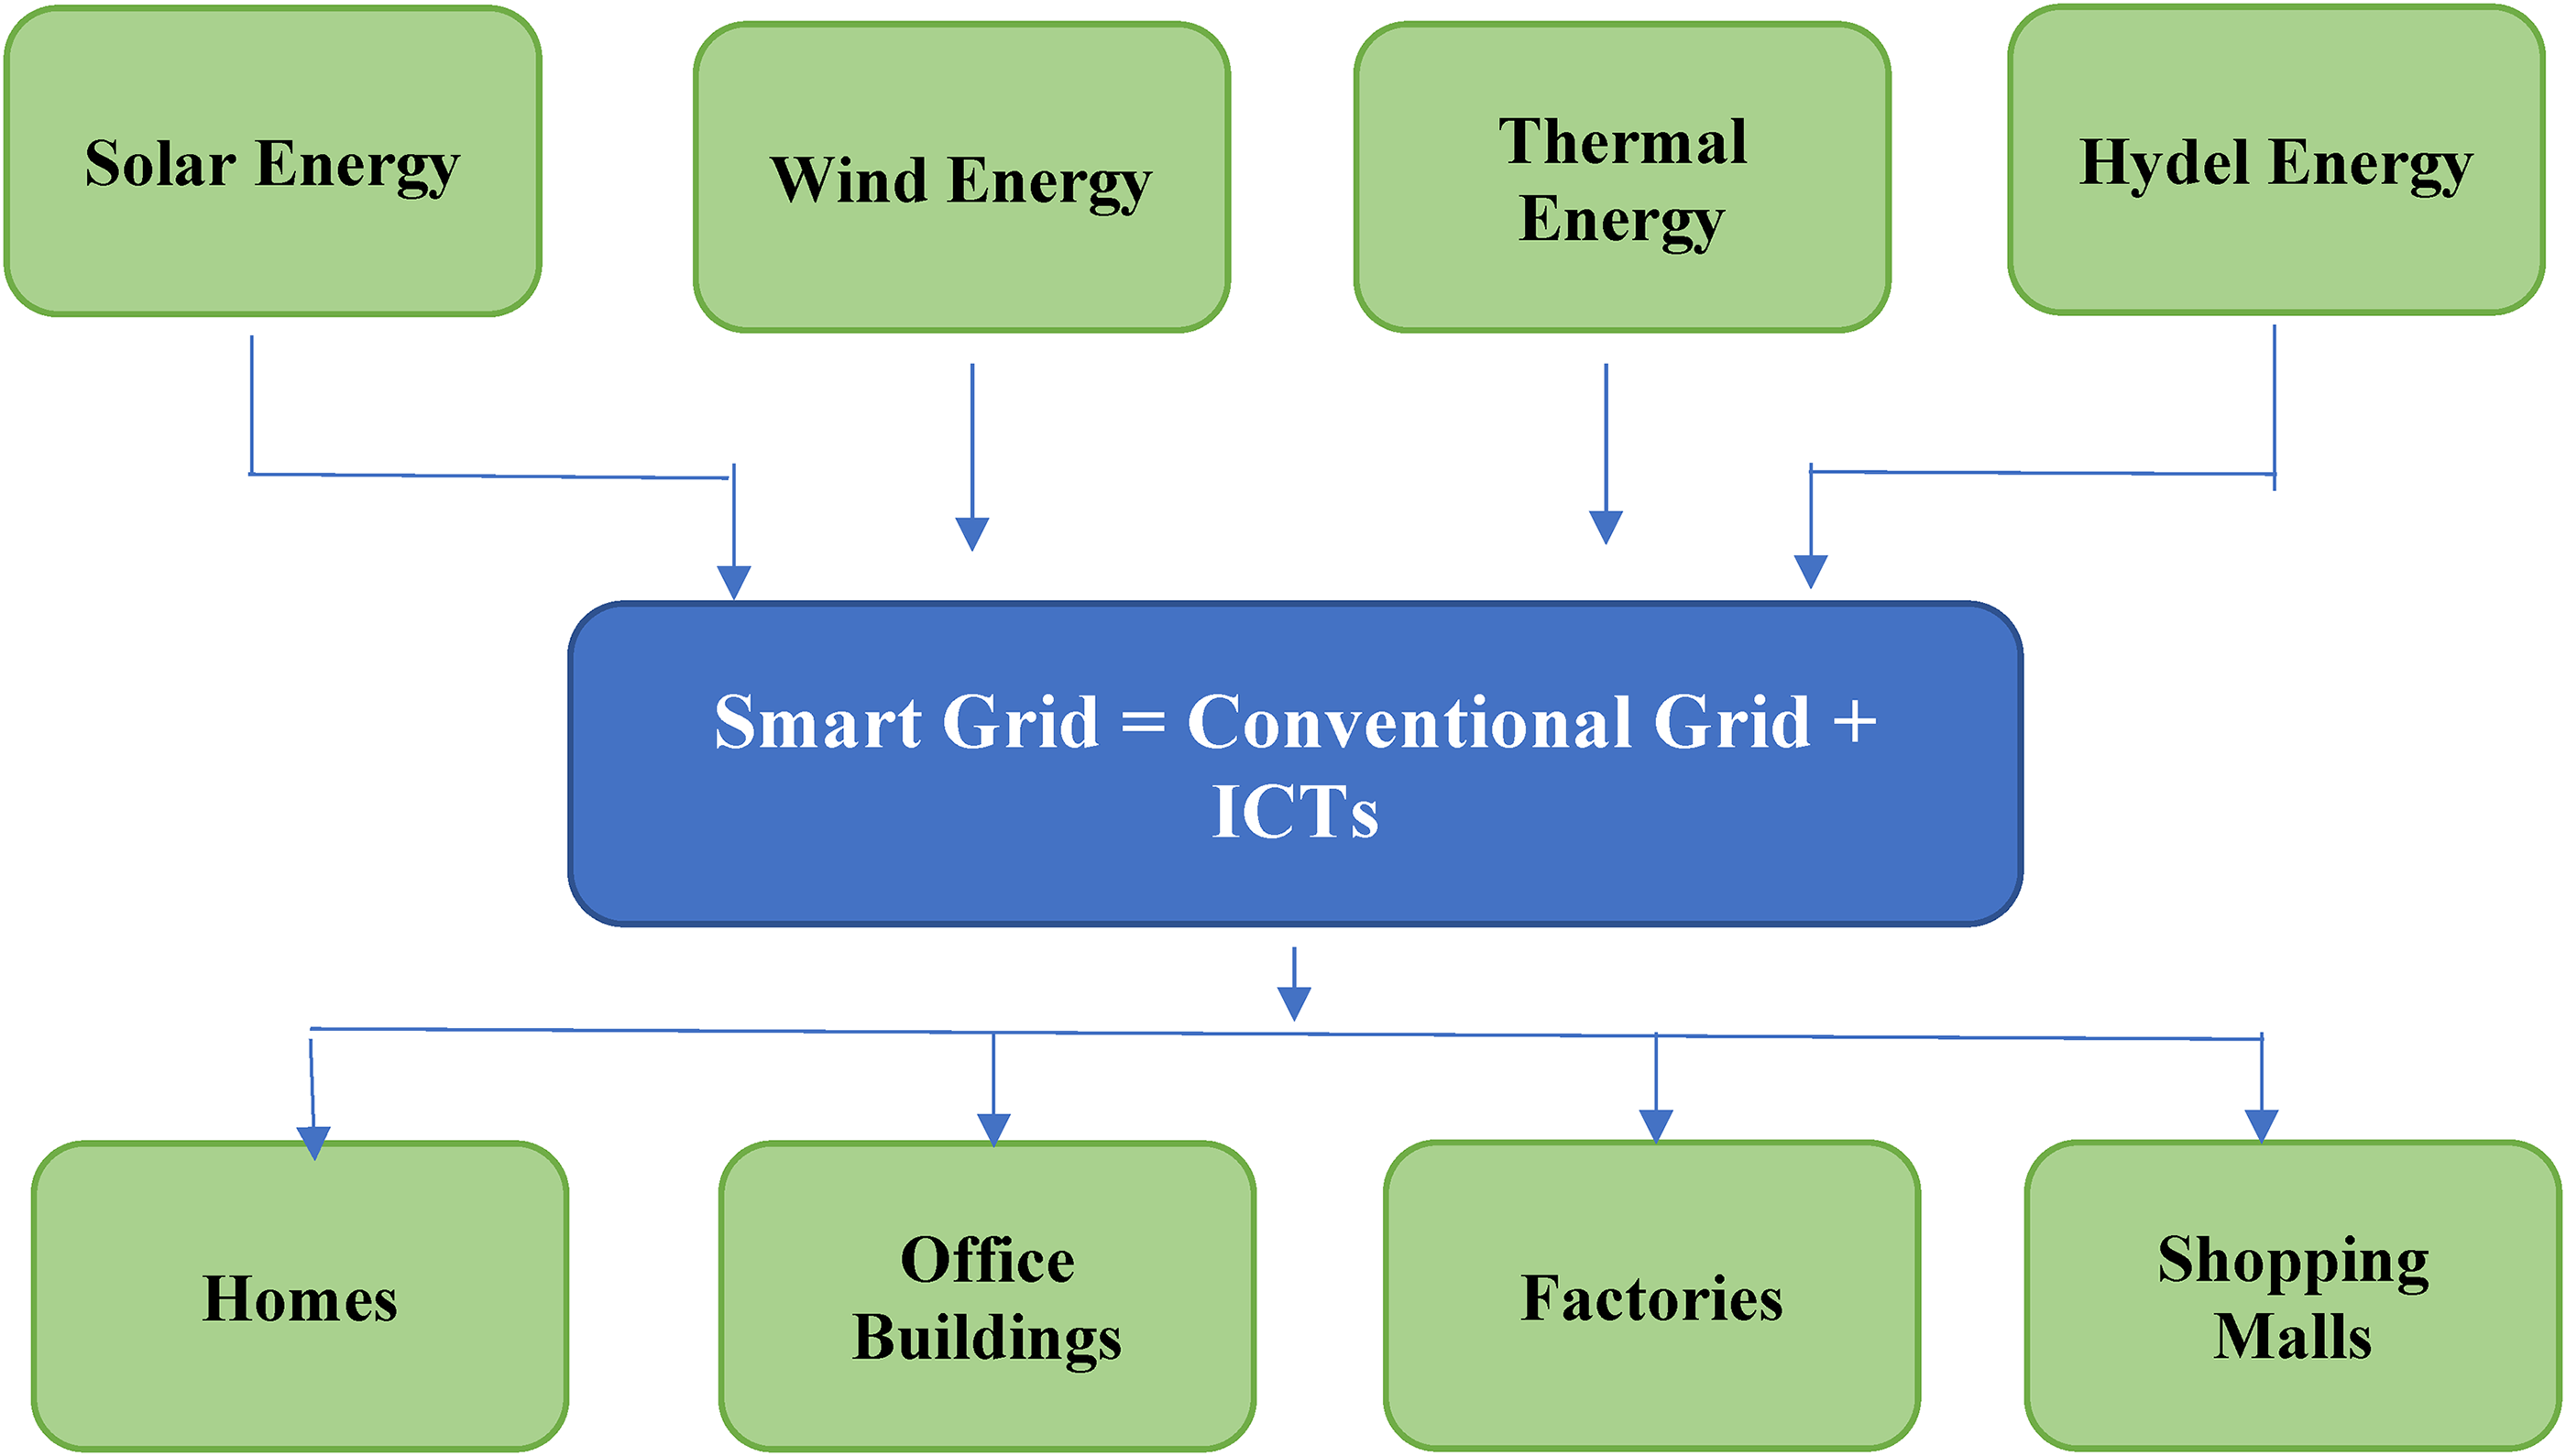
Role of ICTs in improving grid stations to enhance REC.
Similarly, ICTs also possesses the demand-side effect on REC. The reason being, ICTs’ tools (mobiles and internet, etc.) catch the consumers’ attention to focus on environmental quality along with economic development. Through the faster and broader environment-related information, ICTs spread the considerable awareness regarding the importance of green-products. This process escalates the demand for green energy and environmental-friendly products. It puts the pressure on production sector which results in more REC. Beyond that, ICTs sector also create positive externalities (external positive effects) that enhance the REC. For example, the awareness regarding the importance of green environment and products induces the society for sustainable development along with deploying the renewable energy that results in an increase in REC. Additionally, online (digital) transaction system assists in transferring the international green-investment rapidly that also trigger the REC.
Macroeconomic uncertainty, the second main variable of the study, also exhibits a notable impact on the REC as reported in Figure 6. Theoretically, the impact can be classified into: producer-side and consumer-side effects. As for as the producer-side effects are concerned, MEU creates the uncertainty in the market that makes the future profits uncertain. Accordingly, the investors decide to delay the further investment. The decline in investment squeezes the overall production process, including the renewable energy production and as a result, REC tends to fall.
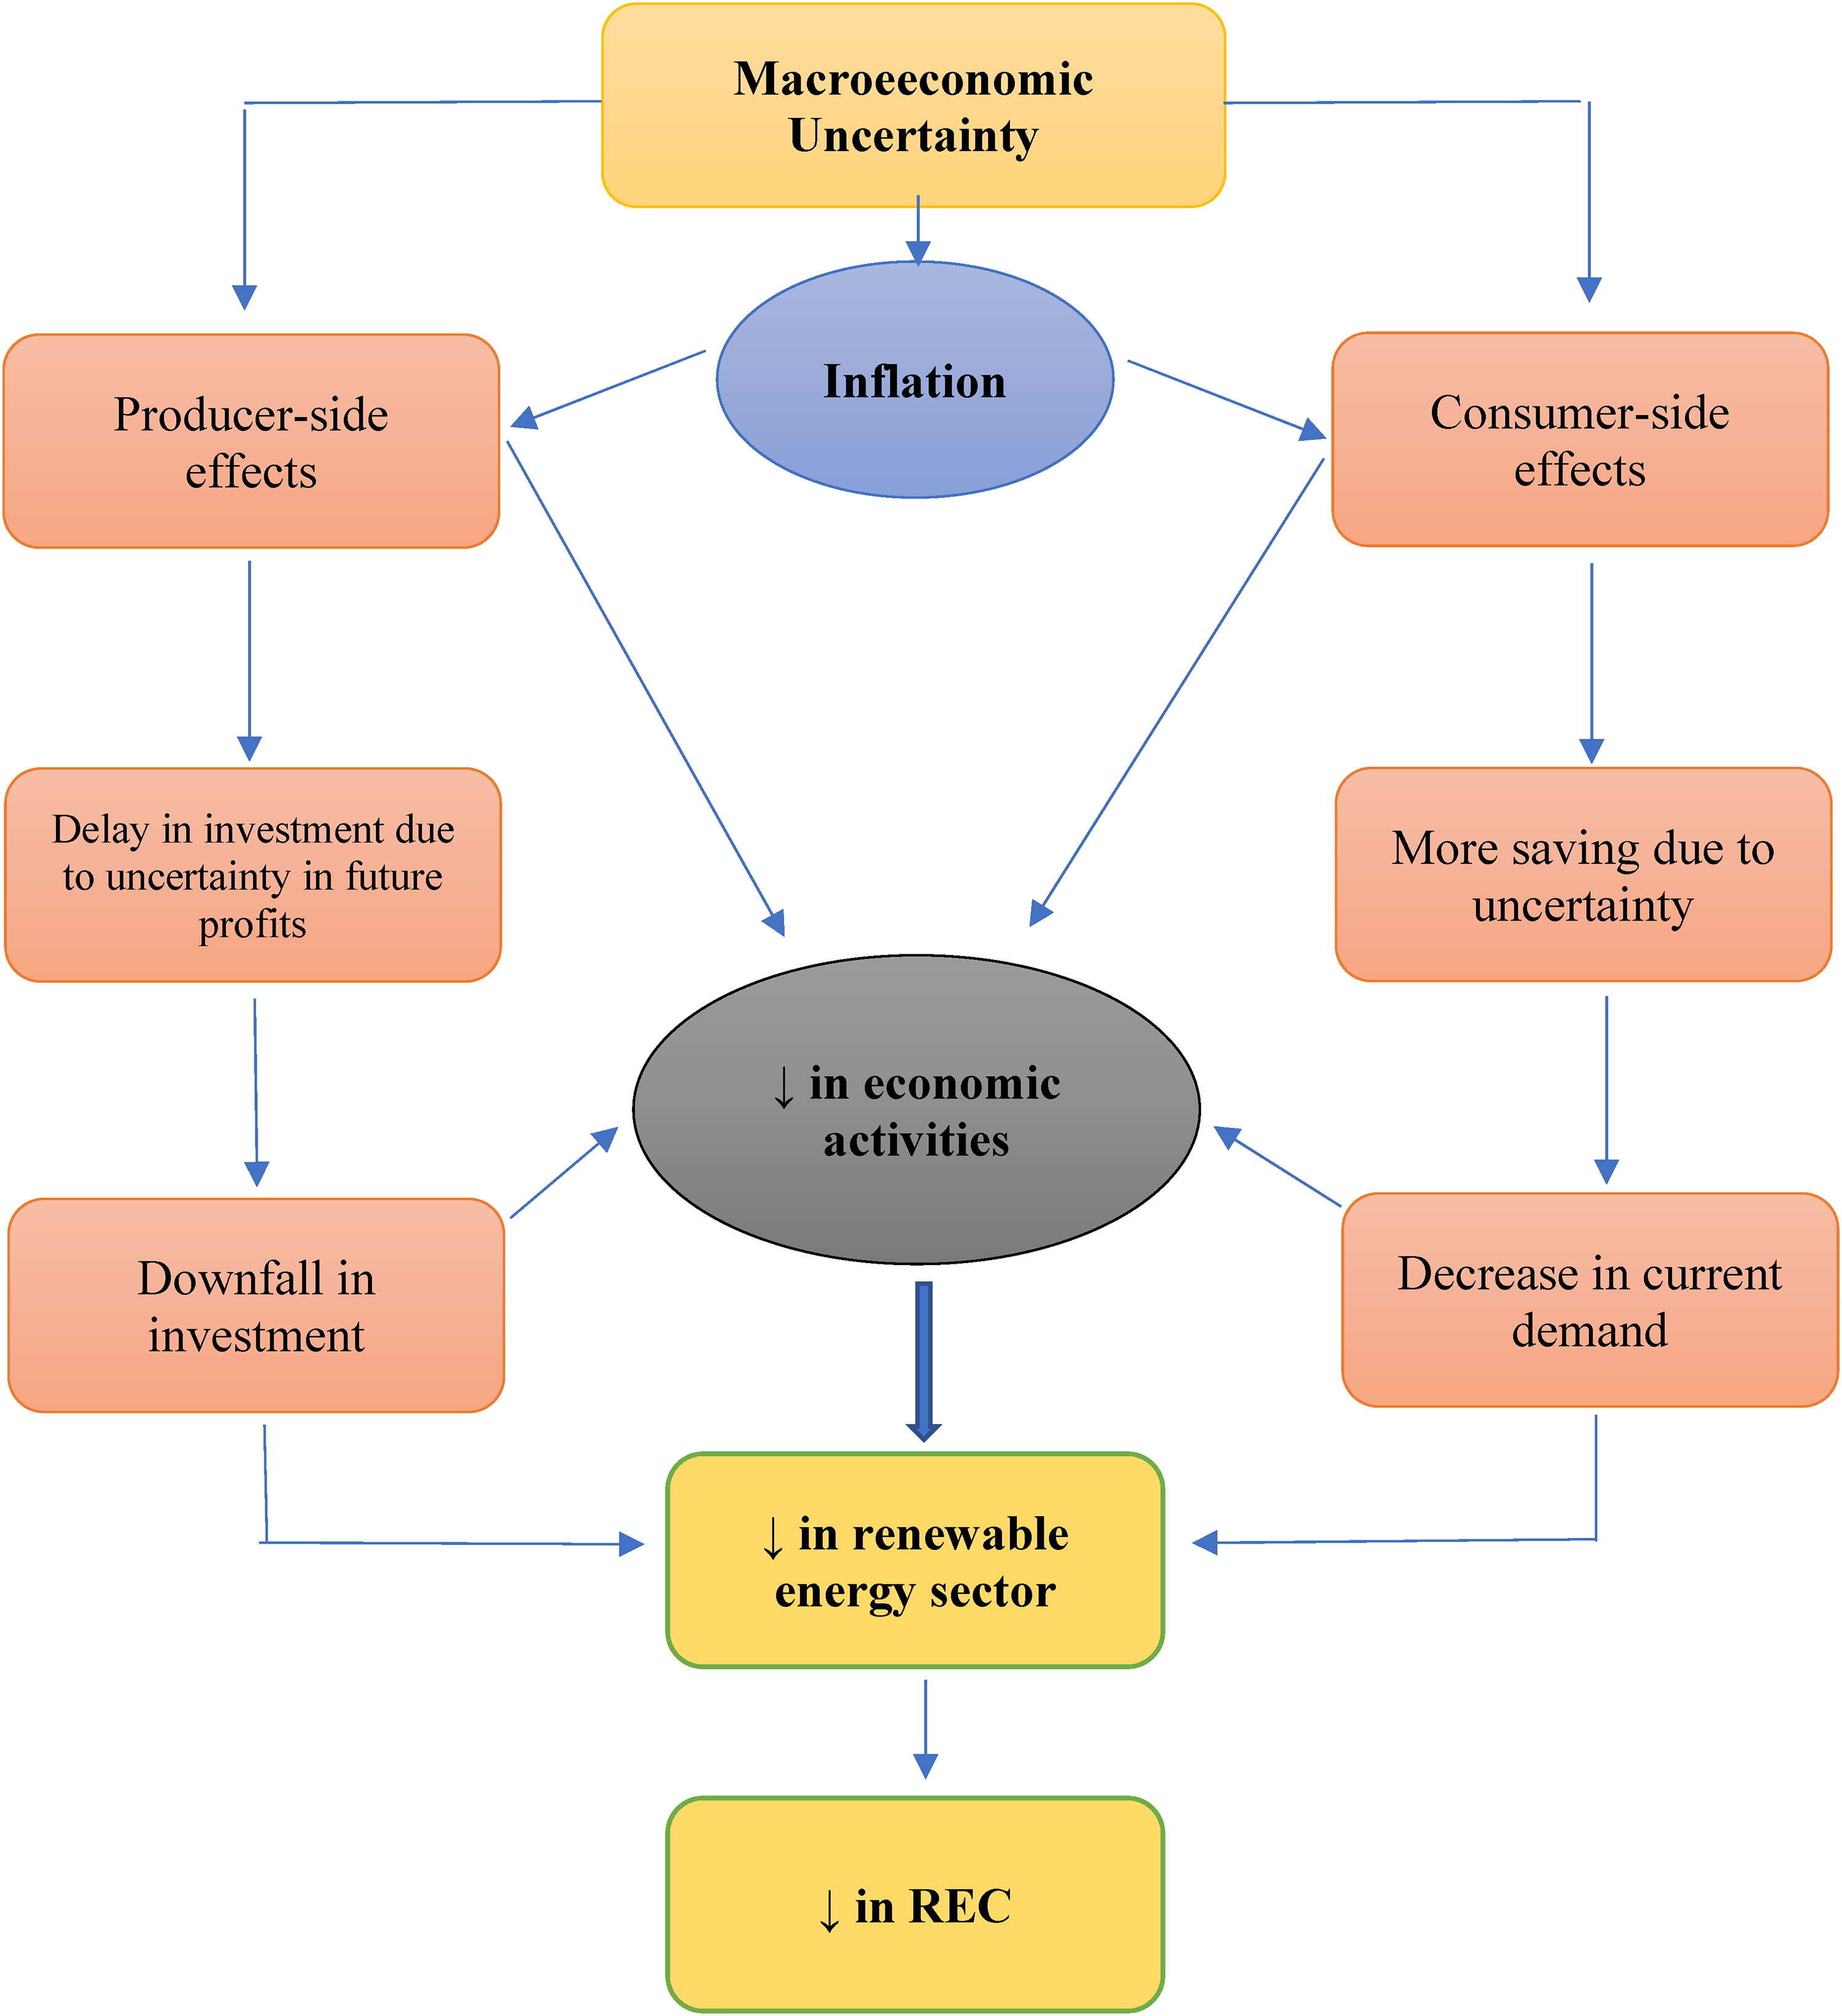
Effects of MEU on REC.
On the other hand, MEU also affects the consumers’ economic decisions such that consumers opt to do more saving and less consumption on account of anticipating the likely changes in their income stem from uncertainty. Correspondingly, the demand tends to shrink that causes to decrease the economic activities including the decrease in the demand for green-products. Consequently, it results in the low REC. Another plausible impact of MEU is that it causes to generate the inflation in market that affect consumer as well as producer side. Accordingly, it slows down the economic activities that ultimately results in a fall of REC. Additionally, we expect that human development index can also increase the demand for REC through rising the public awareness emphasizing on the importance of green environment and avoiding the detrimental effects of environmental pollution that impedes the economic development. Consequently, an increase in human capital may leads to enhance the combustion of renewable energy.
Econometric models and data
Based on the discussion in literature review and conceptual framework, we erect the econometric model. To this end, we, first, formulate the models in which three proxies; namely, individuals using the Internet (percent of population), mobile cellular subscriptions (per 100 people) and fixed telephone subscriptions (per 100 people) as proxies for ICTs are deployed separately. After that, we build the model that possesses an index based the three proxies to analyze the effects of ICTs on the REC. Besides, two further models are erected in which two interactions terms are introduced in order to check the moderating effects of GLB and ICTs as well as GLB and MEU. Hence, the econometric models are expressed as follows:
To attain the primary aim of the current study, the data for the modeled series are retrieved from 1990 to 2017 for top 10 renewable energy-consuming economies (China, USA, Germany, India, UK, Japan, Spain, France, Italy, and Canada). The share of renewable energy in total final energy consumption (REC), natural resources rent as a share of GDP (NRR), and GDP per capita (constant US$) are taken from the site of the World Bank's World Development Indicators.
16
In addition, the data for human development index (HDI) and economic globalization (GLB) index are retrieved from United Nations Development Program (UNDP) and KOF Globalization Index, respectively.


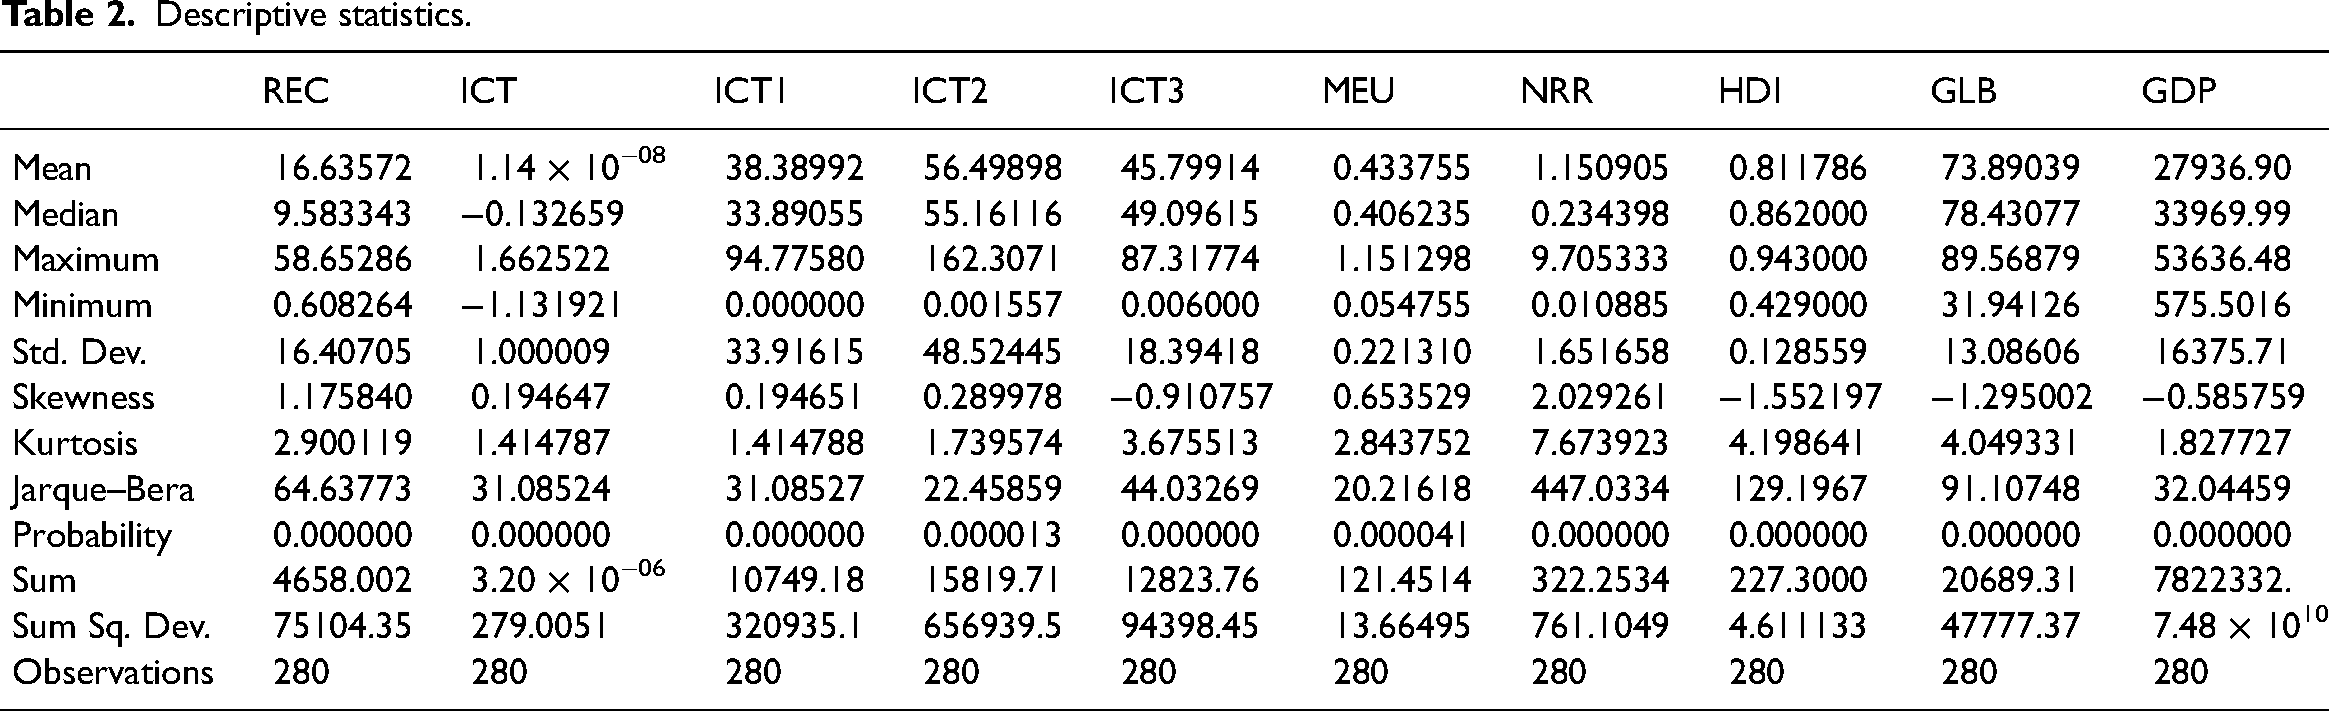
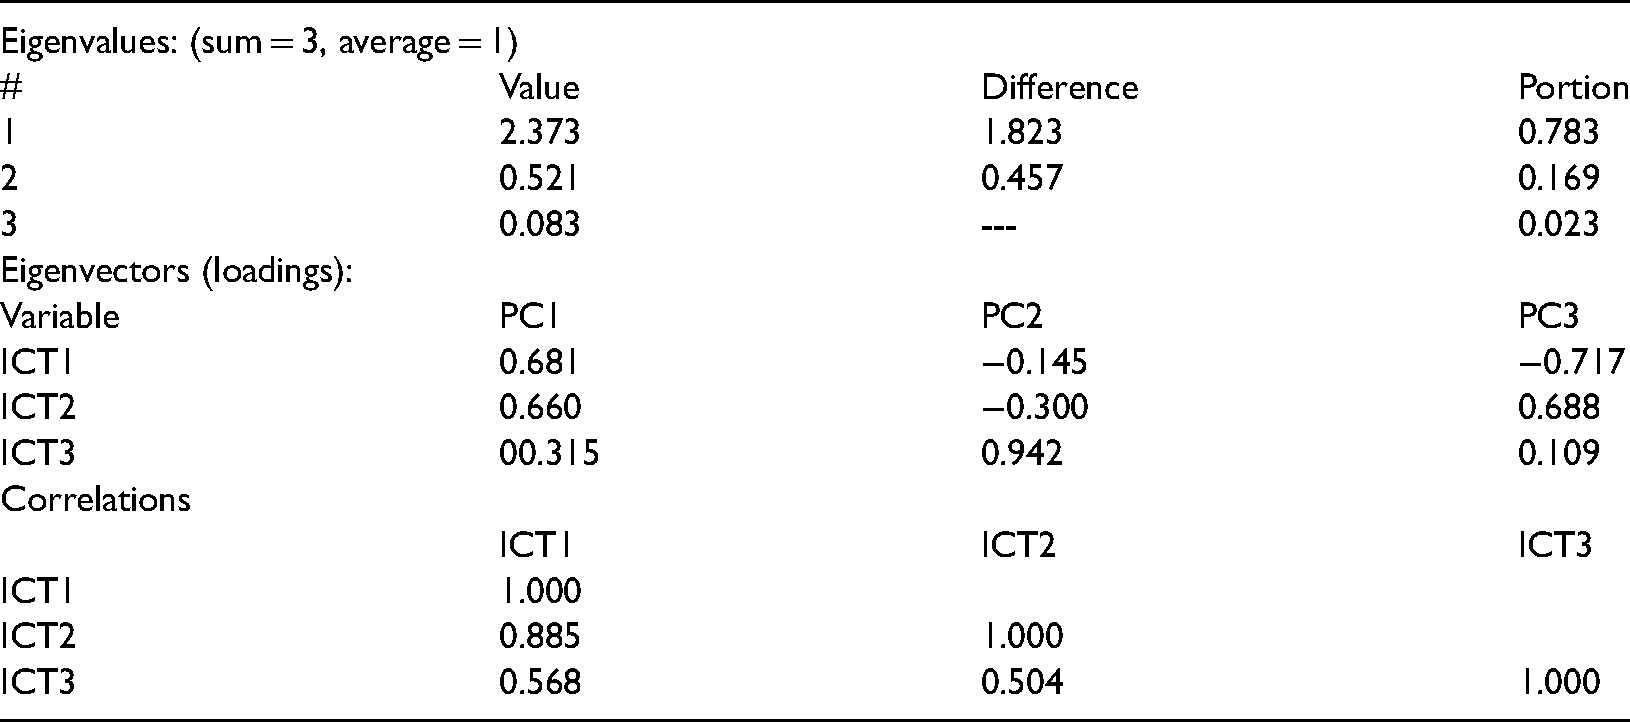
Macroeconomic uncertainty data is taken from Ozturk and Sheng 15 ; in addition, the data for individuals using the internet (percent of population), mobile cellular subscriptions (per 100 people) and fixed telephone subscriptions (per 100 people) as a proxy for ICTs are taken from the World Bank's World Development Indicators as in line with Omri et al. 55 which use these indicators as proxy for ICTs to understand the life satisfaction. Besides, we also have developed an index for ICTs using the series of individuals using the internet (% of population), mobile cellular subscriptions (per 100 people) and fixed telephone subscriptions (per 100 people). To this end, we deploy principal component analysis (PCA) method which can transform the series into principal components that can provide the maximum data information regarding the concerned variable. We opt to deploy the first PCA as it possesses the most information regarding the ICT data due to the following reasons. First, the first component contains the highest ratio of variations such that it can explain the ICT industry data by 78%. Second, again, the first component shows the high value of eigenvectors, unlike the other two components that have negative eigenvectors value, as the Appendix A depicts. Table 2 reports the descriptive characteristics of the modeled series. Among the series, GDP has the largest mean followed by GLB while ICT possesses the smallest mean. Also, all the series have the significant difference between their minimum and maximum values, indicating the high the oscillations in the variables.
Descriptive statistics.
Methods and econometric techniques
The recent research work aims at divulging the dynamic impacts of ICT and MEU on REC with the consort some controlled variables. To this end, the several advanced econometric tests and methods are utilized and we follow the following steps. First, Pesaran 56 cross-section dependence test is deployed to explore the potential cross-section dependence (CSD) across the modeled series. In addition, to check the likely heterogeneity among the series, slope heterogeneity test is utilized. Secondly, we testify the stationarity characteristics of the selected variables by applying second generation cross-sectionally augmented Dickey-Fuller test and cross-sectionally augmented panel unit root test and third generation “Bai and Carrion-i-Silvestre” 57 unit root tests. Thirdly, the second-generation and third generation58,59 cointegration tests are deployed to affirm the long-run association across the modeled series. Fourthly, cross-sectionally augmented autoregressive distributed lag and augmented mean group, so-called second-generation generation techniques, are employed to compute the long-run estimates and to verify the robustness of the results. Lastly, we use heterogenous panel causality test as a second robustness check for our findings.
Cross sectional dependence and heterogeneity tests
The global level integration and unions have turned the world economies into a global village; therefore, the global economies depend on each other. Econometricians name it “cross-sectional dependence i.e., CSD” and argue that the application of traditional methods in the presence of CSD may bring the misleading and biased findings.
60
Thus, it is necessary to check the CSD before proceeding with the findings. To handle the CSD issue, we deploy the CSD test by Pesaran
56
and the test's mathematical form can be expressed as
Additionally, the null hypothesis the test is: “panel data series are cross-sectionally independent”. Next, another issue as the scholars have pointed out is the plausible heterogeneous characteristics of the panel series that invalidate the deployment of first-generation techniques. Hence it is imperative to confirm the heterogeneity; therefore, we deploy the Pesaran and Yamagata
61
heterogeneity test. The equation of the heterogeneity test can be written as:

Second and third generation unit root tests
The literature provides a strong base on the argument that the traditional panel unit root test may compute the misleading and biased outcome if the modeled series possess the CSD and heterogeneity
42
as in the case of recent study. Thus, the scientists suggest the alternative solution: to use the second-generation unit root tests (cross-sectionally augmented Dickey–Fuller test, viz., CADF and cross-sectionally augmented panel unit root test, viz., CIPS) that can calculate the robust results, handling the CSD and heterogeneity. To affirm that panel series are not I(2),we follow Pesaran
62
test as
Cointegration tests
Once we have confirmed that all the panel series are stationary after first difference, we move toward the testifying the long-run association among the selected variables, applying cointegration tests. Since the traditional cointegrations tests cannot handle the CSD, heterogeneity, and structural shifts effects, we deploy advanced tests, i.e., Westerlund
58
and Westerlund and Edgerton
59
cointegration tests. The former test presents the robust findings in the presence of CSD and heterogeneity; however, its outcome becomes biased on account of structural shifts in the panel series. Therefore, we also deploy the third-generation
59
cointegration test that possesses the ability to generate robust results, tackling the all issue including CSD, heterogeneity and structural shifts in the panel series. Besides, the mathematical form of Westerlund
58
test can be exhibited as:
Long-run estimators
After confirming the long-run association among the panel series, the next step is to compute the long-run coefficients for the sampled economies. To this end, we have deployed cross-sectionally augmented autoregressive distributed lag, viz., CS-ARDL technique for estimating the LR as well as SR coefficients. The mathematical expression of the technique can be documented as:
Robustness check
The study also performs the robustness check of the findings by deploying augmented mean group, i.e., AMG method and Dumitrescu Hurlin's (2012) panel causality test. As for the AMG technique, it not only caters the issues of CSD, heterogeneity, and structural breaks but also handle the unobservable factors by including year dummies to estimate the reliable long-run coefficients. 63 Lastly, another robust check is the deployment of Dumitrescu Hurlin's (2012) causality test. This test is commonly applied for balanced and heterogeneous panel series to explore the policy oriented causal nexus. 64
Results and discussion
Table 3 documents the outcomes of cross-sectional dependence (CSD) test by Pesaran 56 and heterogeneity test. Before proceeding toward the unit root and cointegration tests, it is imperative to divulge the CSD and heterogeneity across the selected series. Otherwise, it may lead to biased stationarity and cointegration findings. 65 The results of CSD test rejects the null hypothesis of “no cross-sectional dependence” for all modeled series (viz, REC, ICT, ICT1, ICT2, ICT3, MEU, NRR, HDI, GLB, and GDP) is not accepted at 1% significance level, implying that all the opted nations are cross-sectionally dependent such that any shock in one economy may affects the economy of other nations in the sample. In a similar vein, the heterogeneity test's results reject the hypothesis of homogeneity for all models at the significance level of 1%, confirming that all the sampled economies are heterogeneous.
Cross-section dependence and slope heterogeneity tests.
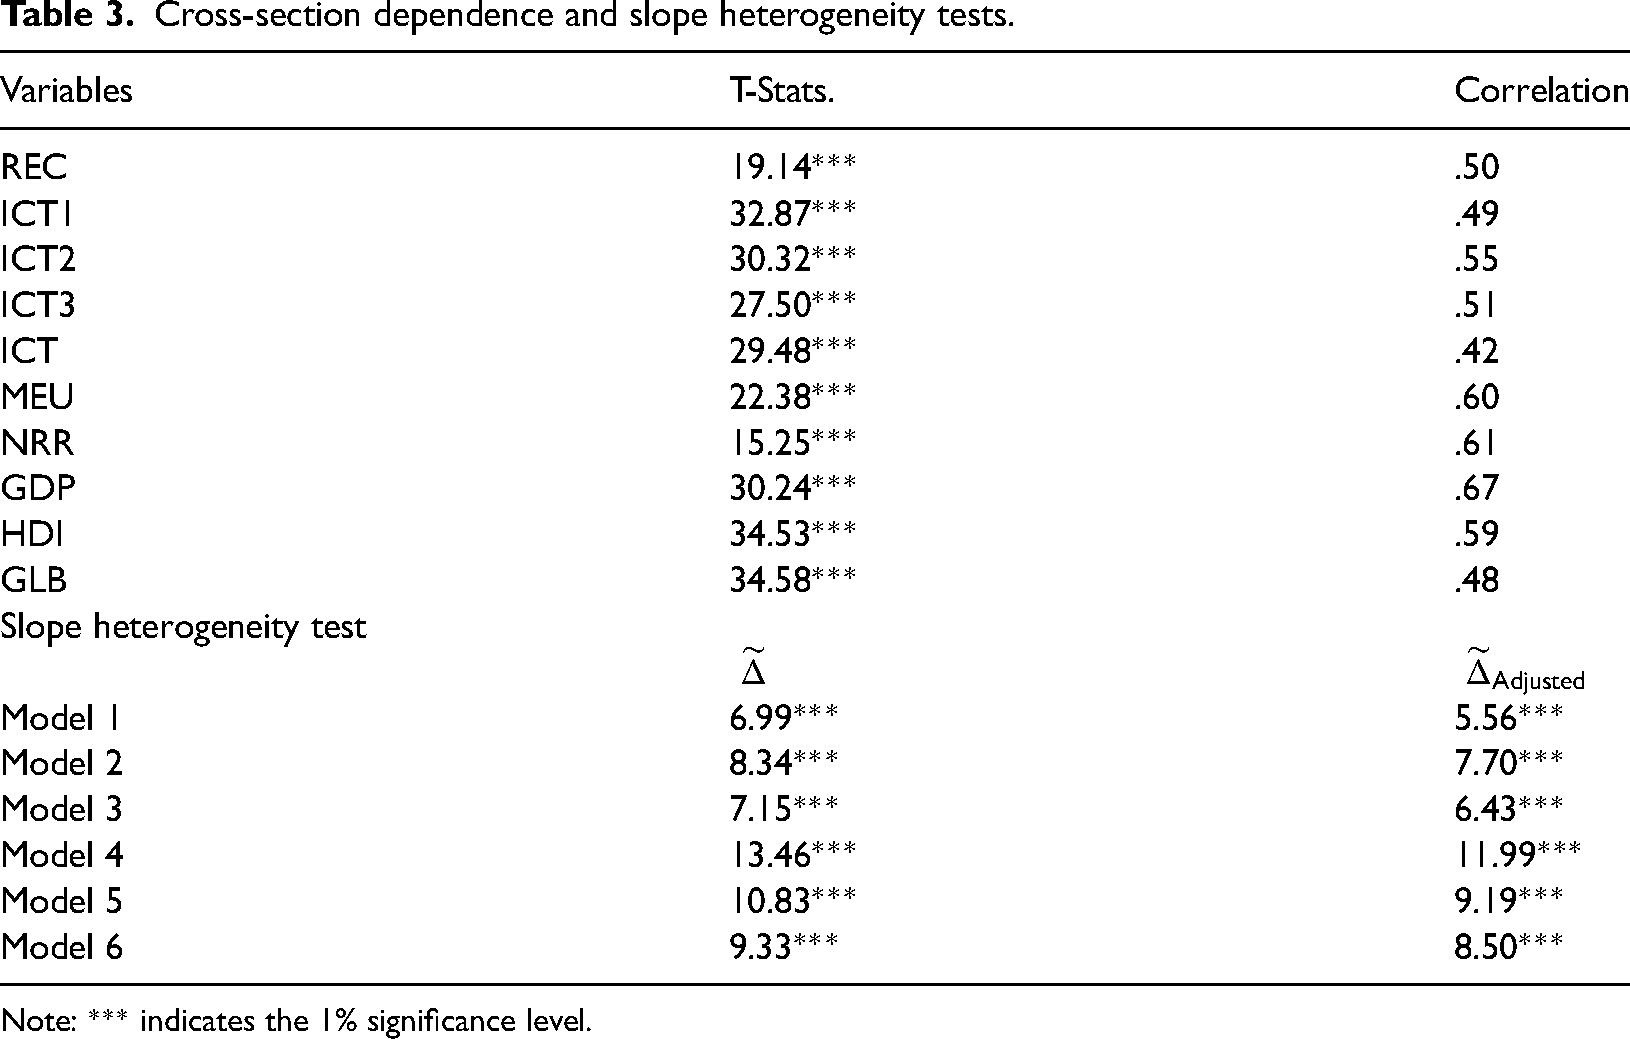
Note: *** indicates the 1% significance level.
Since the first-generation tests and methods computes the biased results in the presence of CSD and heterogeneity, therefore, we deploy second and third generation methods for robust findings. Next, we deploy the second-generation unit tests to handle the influence of CSD and heterogeneity.
To this end, first, CIPS and CADF tests are used as Table 4 reports. The results demonstrate that all modeled series become stationary after first difference, indicating that the null hypothesis of non-stationarity is rejected. Second, Bai and Carrion-i-Silvestre structural break unit-root test 57 is executed in order to tackle the effects of expected structural breaks along with handling the CSD and heterogeneity in the variables. The findings determine the presence of structural breaks and reject the hypothesis of unit-root after first difference. It implies that not a single series is I(2). Hence, we can proceed for the next step.
Second-generation unit root tests.
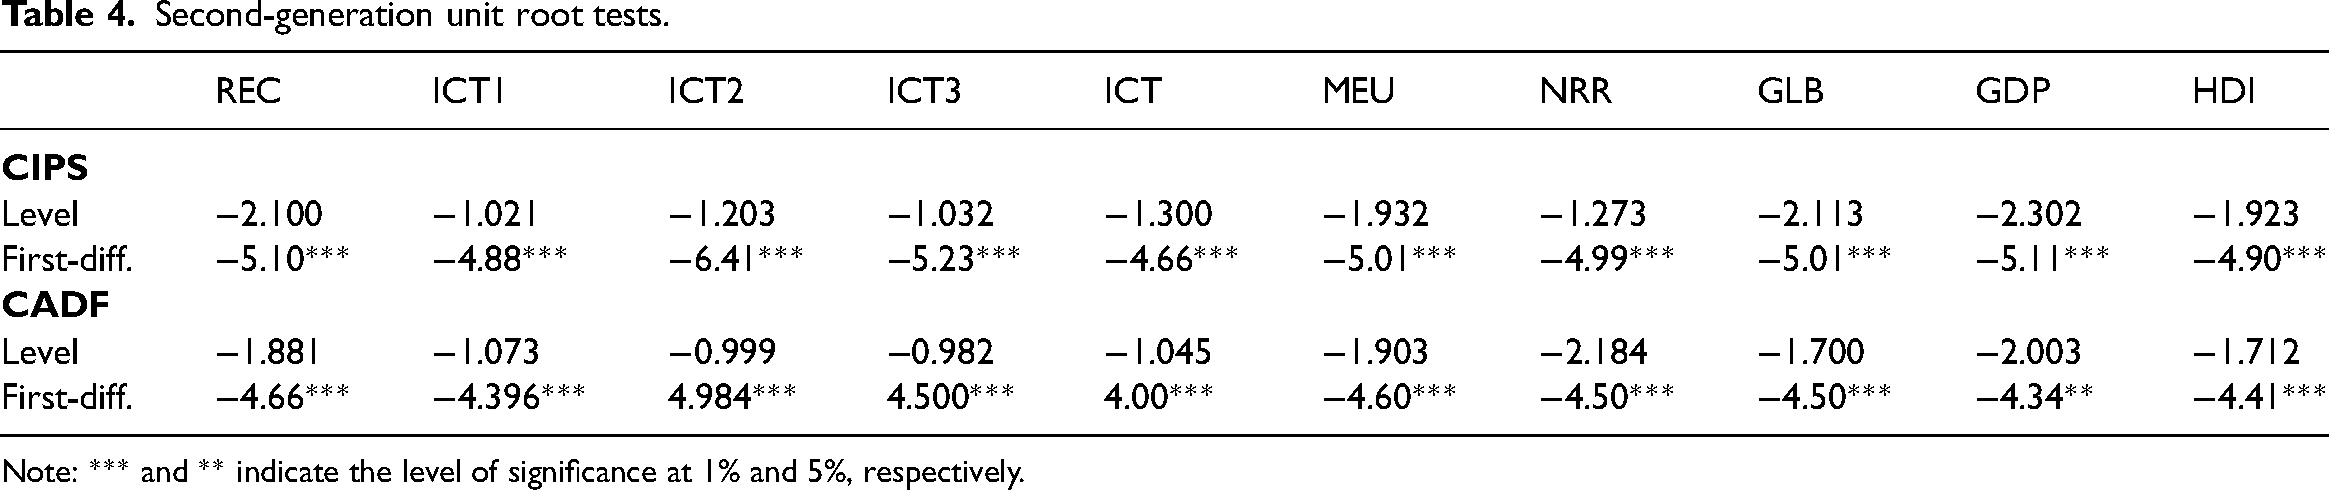
Note: *** and ** indicate the level of significance at 1% and 5%, respectively.
The presence of structural breaks in panel series of the selected economies is quite logical. For instance, the sampled economies are crippled with many financial crises such as United States Savings and Loan crisis in 1989–91, Japanese asset price bubble in 1990, Black Wednesday in 1992–1993, Asian Financial Crisis in 1997–1998, Global financial crisis in 2007–2008, and European sovereign debt crisis in 2010, that resulted in structural shifts in global as well as selected economies. Similarly, the crisis occurred in other economies not in the sample can also affect the selected economies due to global integration and union. Table 5 confirms that all variables are I(I).
Bai and Carrion–i–Silvestre 57 test.
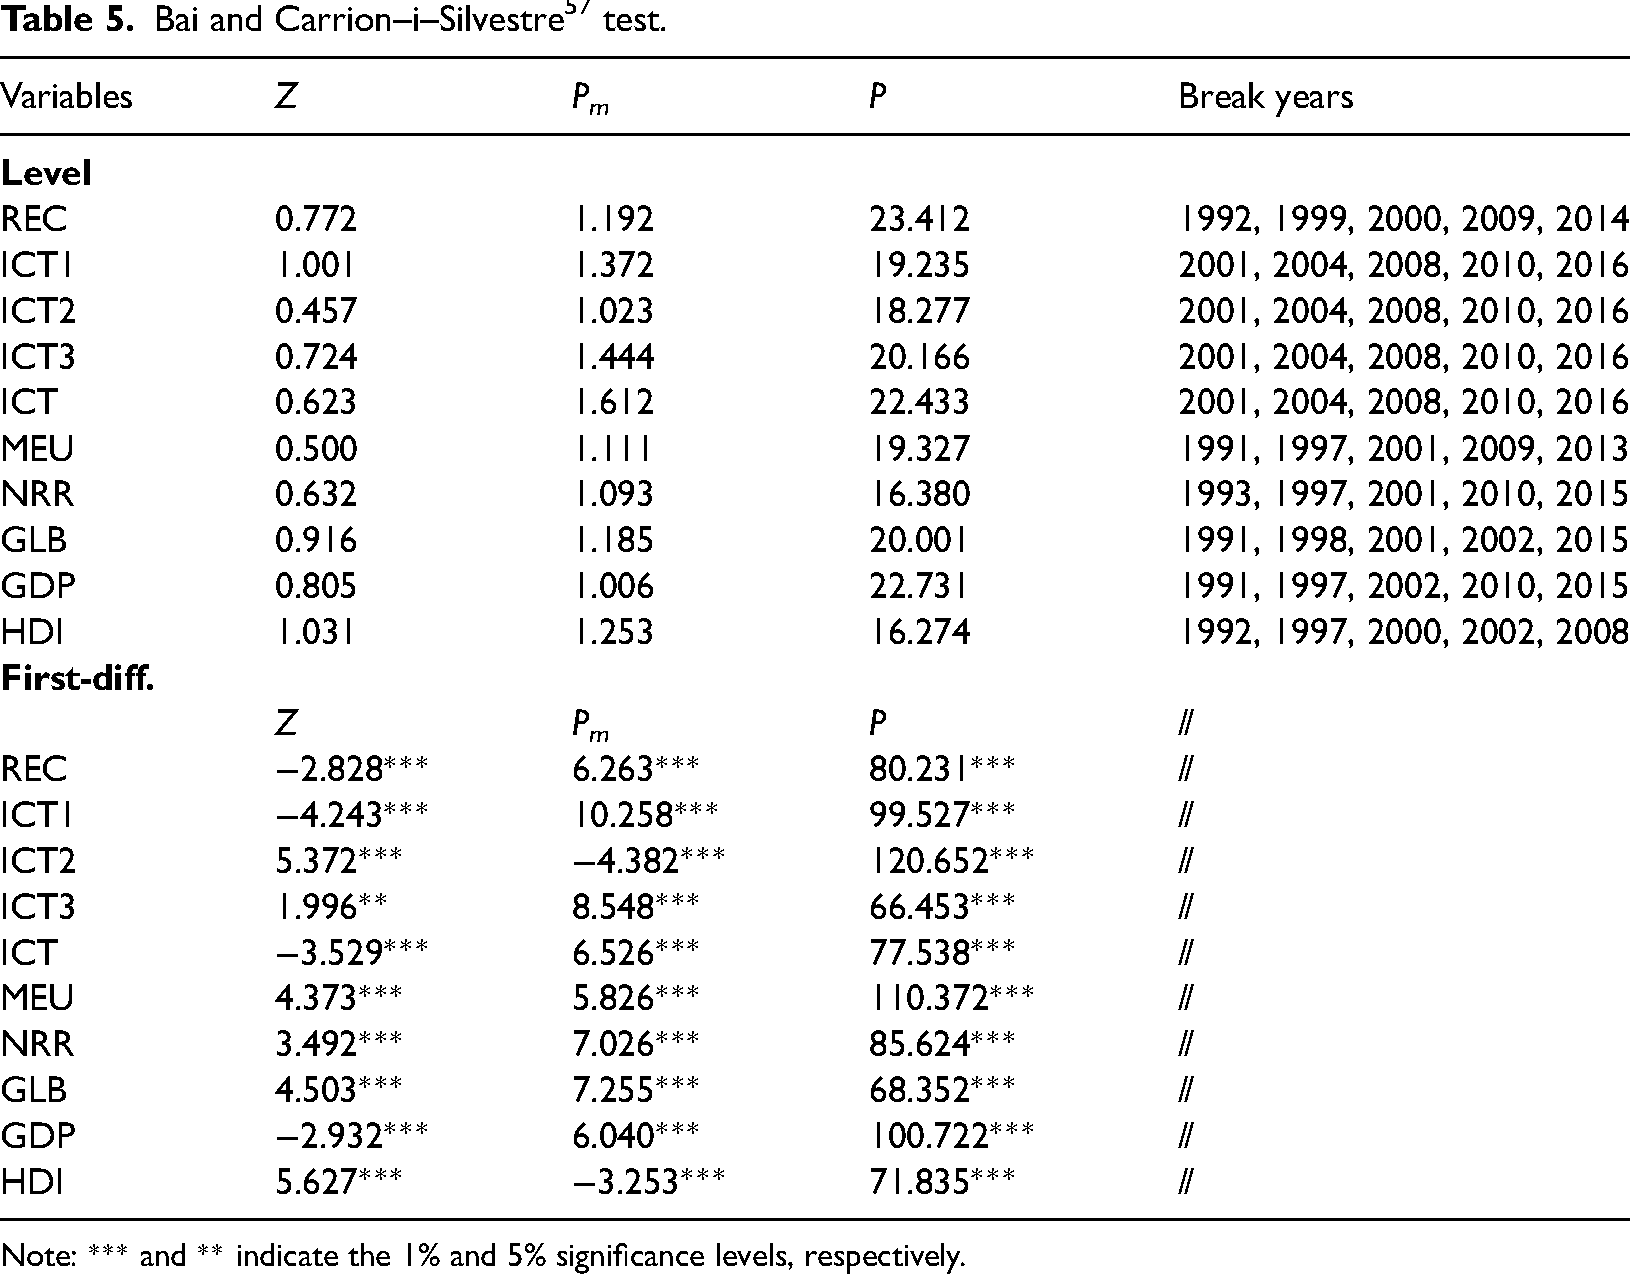
Note: *** and ** indicate the 1% and 5% significance levels, respectively.
After that, we conduct the cointegration tests to affirm the long-run association among the modeled series. Thus, we, first, employ Westerlund 58 cointegration test and the results support the hypothesis of cointegration,” indicating that long-run association exists across all the models as reported in Table 6. Second, we also utilize the Westerlund and Edgerton 59 cointegration test as Table 7 depicts the results since the former cointegration test performs the biased results in the presence of structural breaks. Again, the outcome of the latter test corroborates the long-run association among the series in all models. Hence, the outcomes of CSD, heterogeneity, unit root and cointegration tests entail the deployment of advanced techniques such as CS-ARDL, and AMG to handle the exigencies of CSD, heterogeneity, and structural breaks in the selected variables for robust findings.
Westerlund 58 cointegration test.
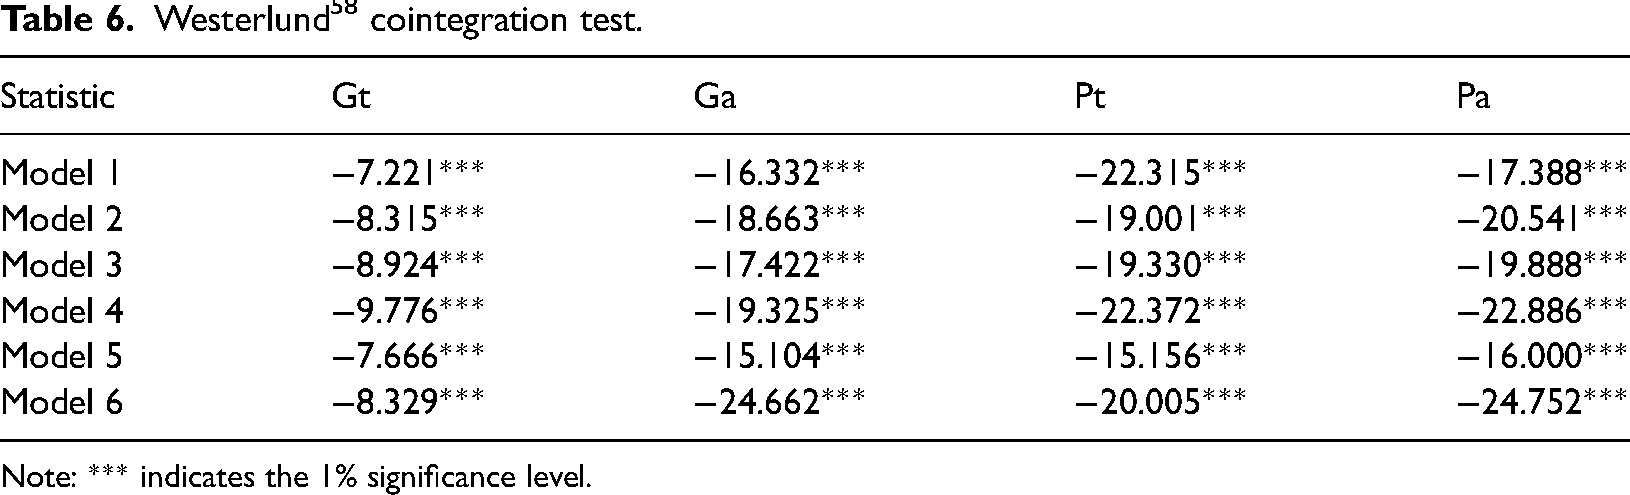
Note: *** indicates the 1% significance level.
Westerlund and Edgerton 59 panel cointegration analysis.
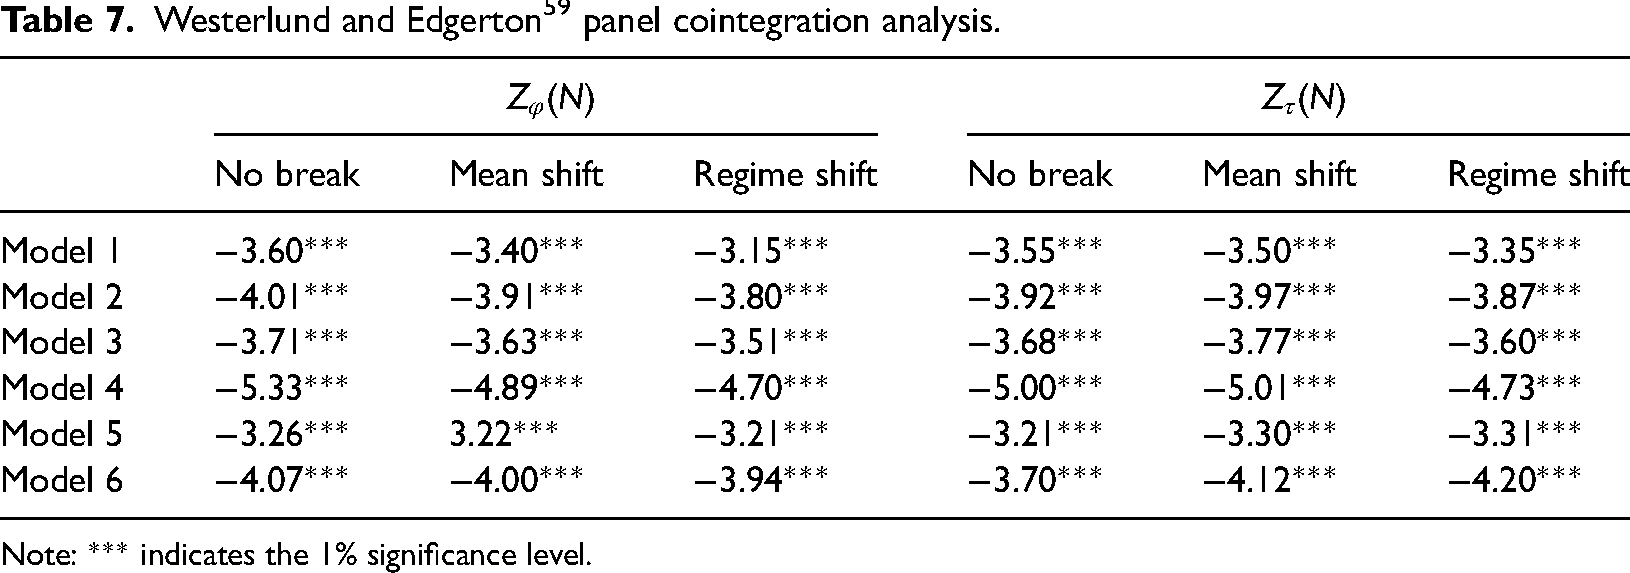
Note: *** indicates the 1% significance level.
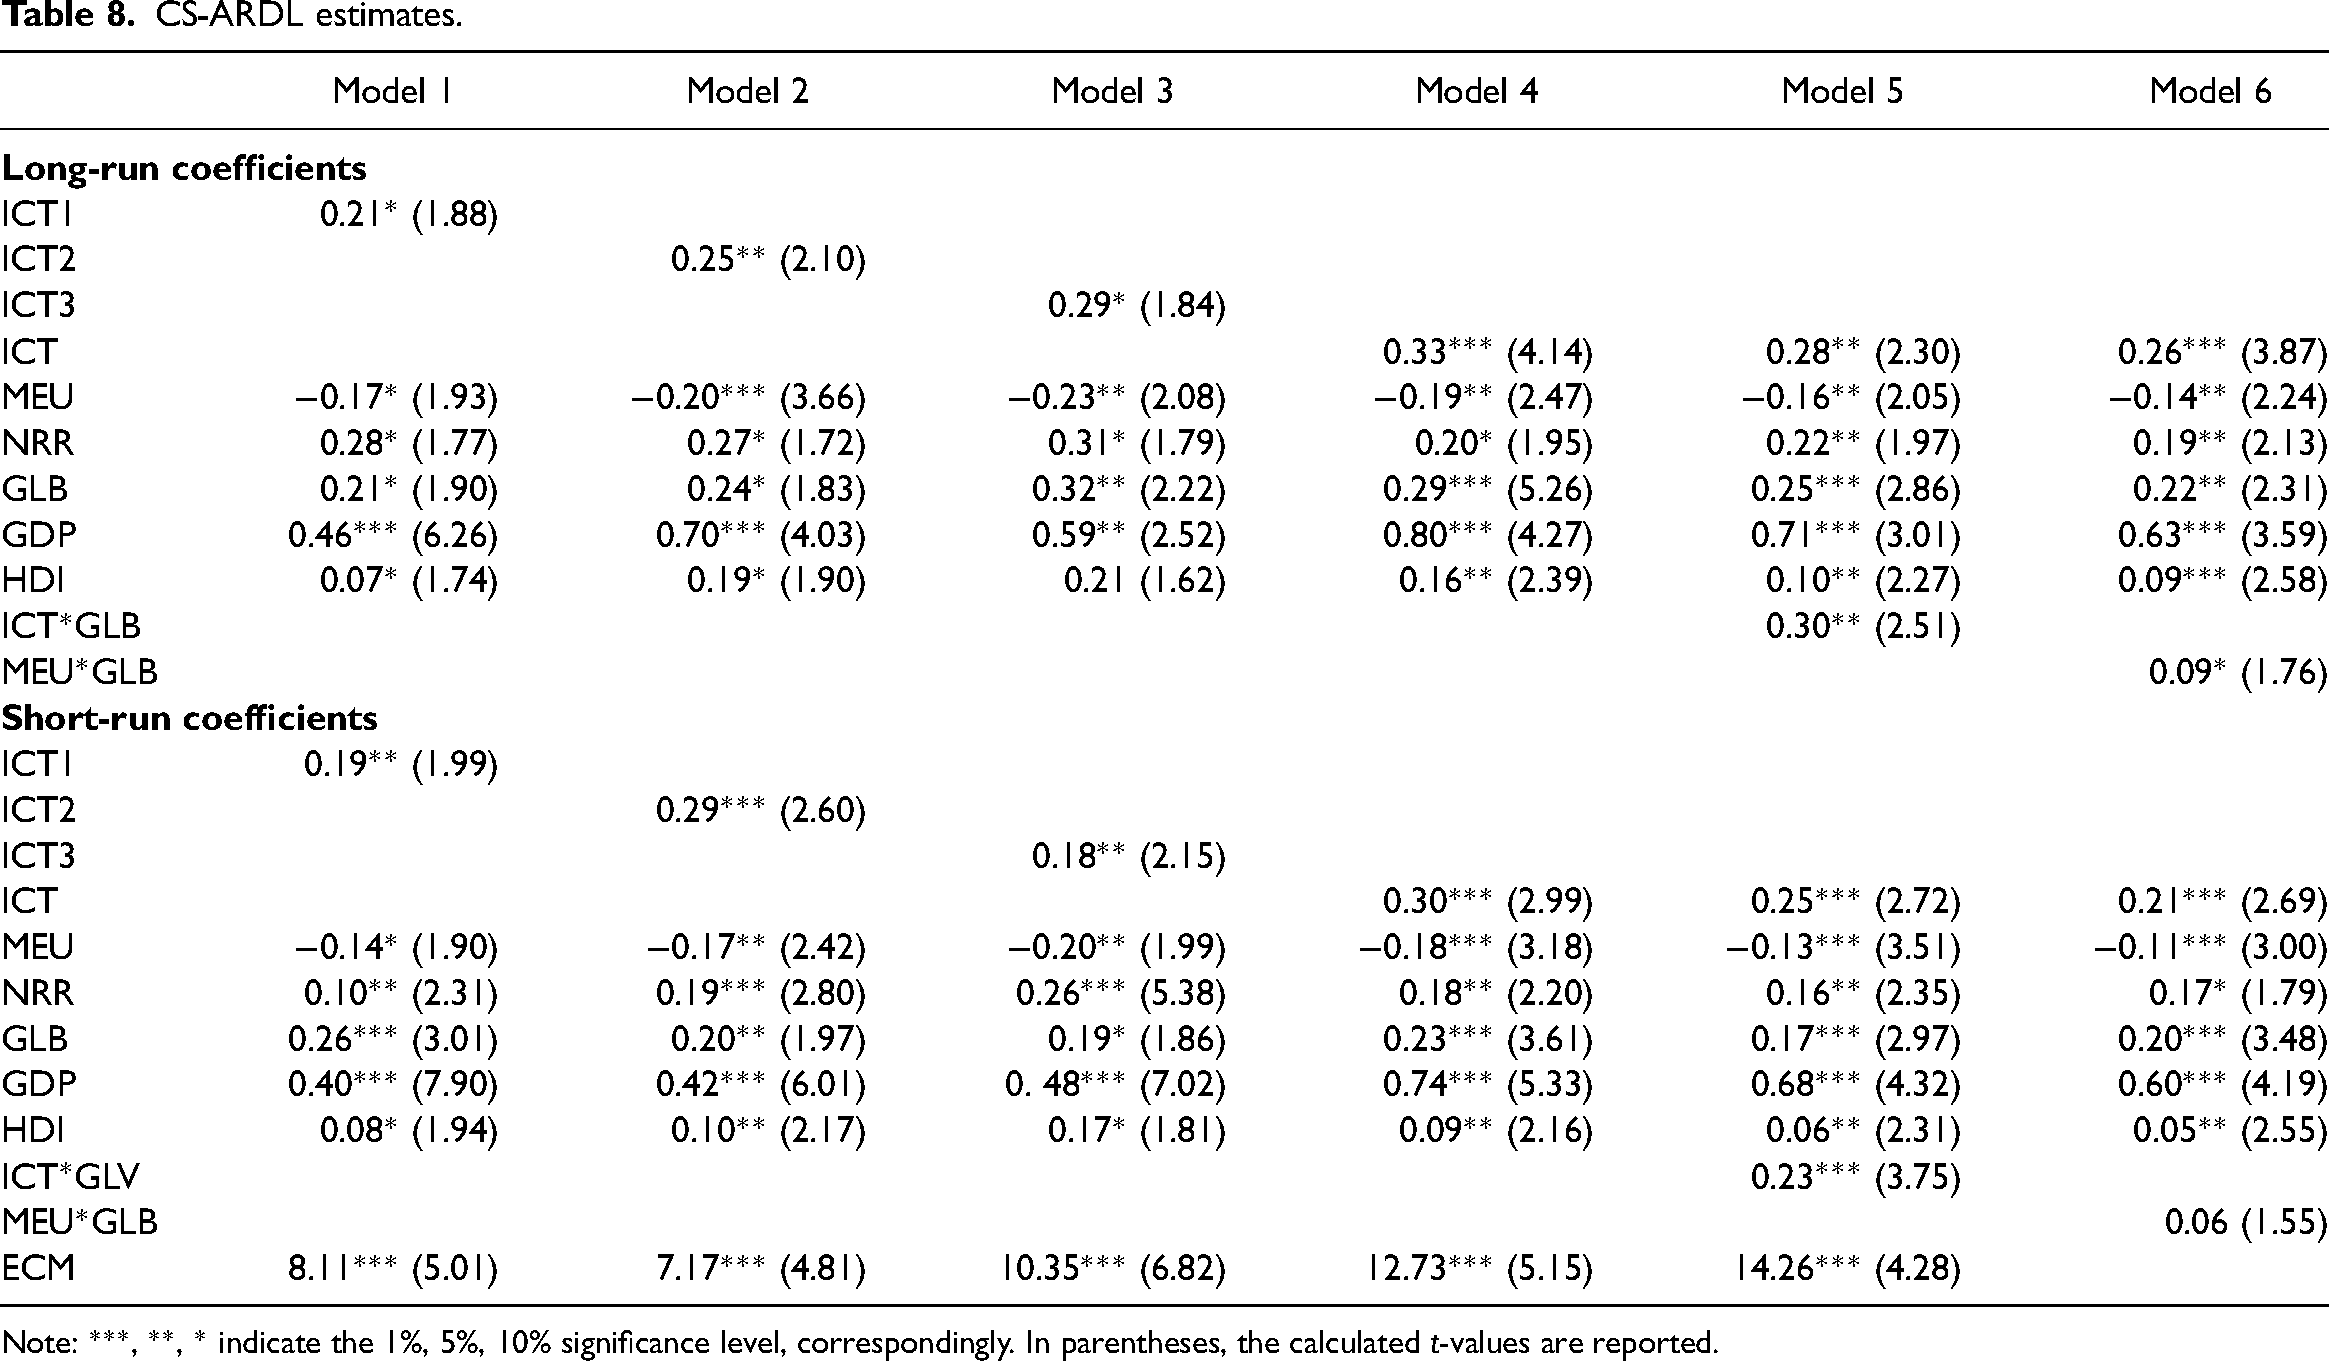
In Table 8, the short and long-run (SR and LR) estimates of CS-ADRL are reported. The empirical findings exhibit a significant positive association between ICT and REC such that a 1% increase in the ICT industry tends to enhance the consumption of green energy by 0.21% (model 1), 0.25% (model 2), 0.29% (model 3), 0.33% (model 4), 0.28% (model 5), and 0.26% (model 6) in the LR. The SR findings also support the long-run results, indicating the positive nexus between ICT and REC. Unlike the prior literature, this is the unique finding of our study. On the contrary, The CS-ARDL estimates suggest that the ratio of REC declines by 0.17% (model 1), 0.20% (model 2), 0.23% (model 3), 0.16% (model 4), 0.16% (model 5), and 0.14% (model 6) on account of a 1% rise in MEU in LR. The likewise findings also are reported by the SR coefficients, implying the significant negative link between MEU and REC.
CS-ARDL estimates.
Note: ***, **, * indicate the 1%, 5%, 10% significance level, correspondingly. In parentheses, the calculated t-values are reported.
In addition, we find a significant and positive association between NRR and the green energy in the LR such that the deployment of renewable energy increases by 0.28% (model 1), 0.27% (model 2), 0.31% (model 3), 0.20% (model 4), 0.22% (model 5), and 0.19% (model 6) due to rise in the amount of NRR by 1% in the selected sample. The short-run estimates also provide the same outcome, supporting the long-run estimates. Like NRR, GLB also demonstrates the beneficial effects for the renewable energy as REC surges by 0.21% (model 1), 0.24% (model 2), 0.32% (model 3), 0.29% (model 4), 0.25% (model 5), and 0.22% (model 6) due to increase in the level of GLB by 1% in the LR. Also, the short-run coefficients confirm the same influence of GLB on REC. As for the effects of GDP, we observe that a 1% escalation in GDP in the LR tends to trigger the use of green energy by 0.46% (model 1), 0.70% (model 2), 0.59% (model 3), 0.80 (model 4), 0.71 (model 5), and 0.63% (model 6). The LR outcome also has the SR findings’ support. Lastly, the results confirm that an increase in HDI by 1% boosts the combustion of renewable energy by 0.07% (model 1), 0.19% (model 2), 0.21% (model 3), 0.16% (model 4), 0.10% (model 5), 0.09% (model 6). Fascinatingly, the interaction term of ICT*GLB in model 5 suggests the considerable moderating role of globalization such that GLB foster the use of green energy by 0.23% via affecting the ICT industry. Ironically, the interaction term of MEU*GLB assures that GLB can mitigates the adverse influence of macroeconomic uncertainty and REC gains the benefits of 0.09% due to the moderating effects of GLB.
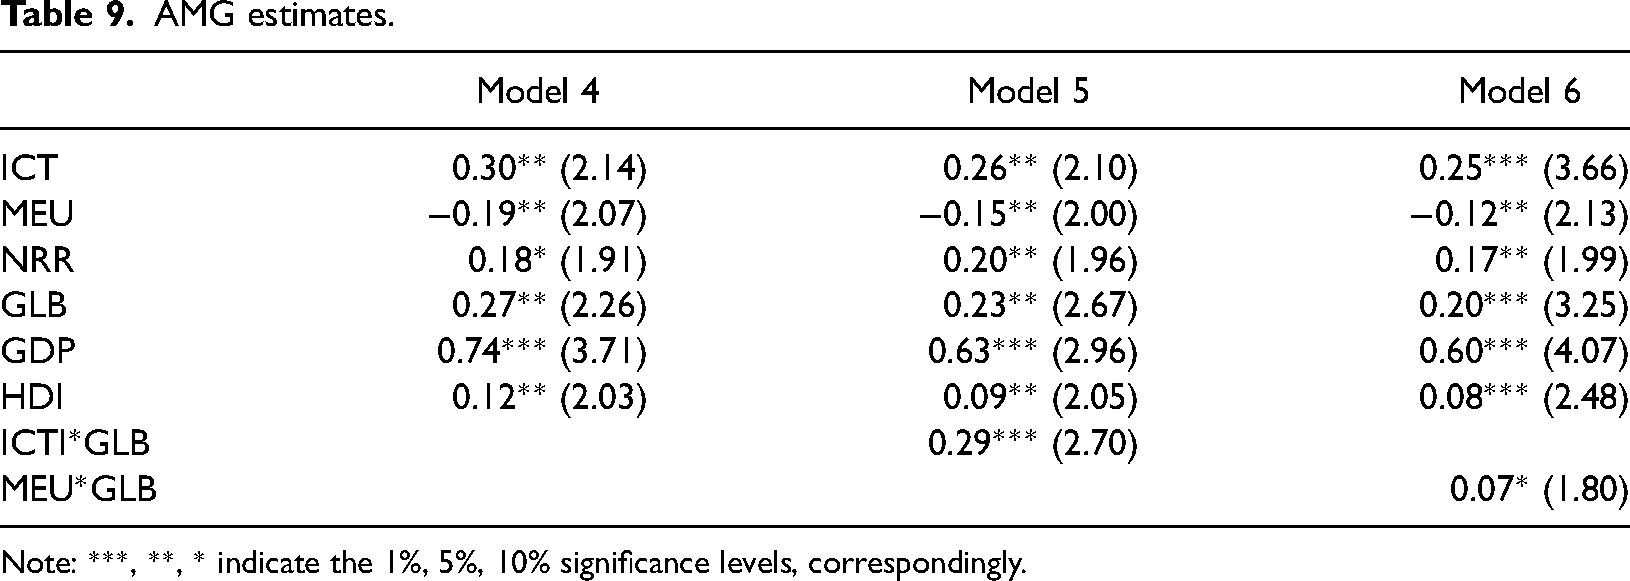
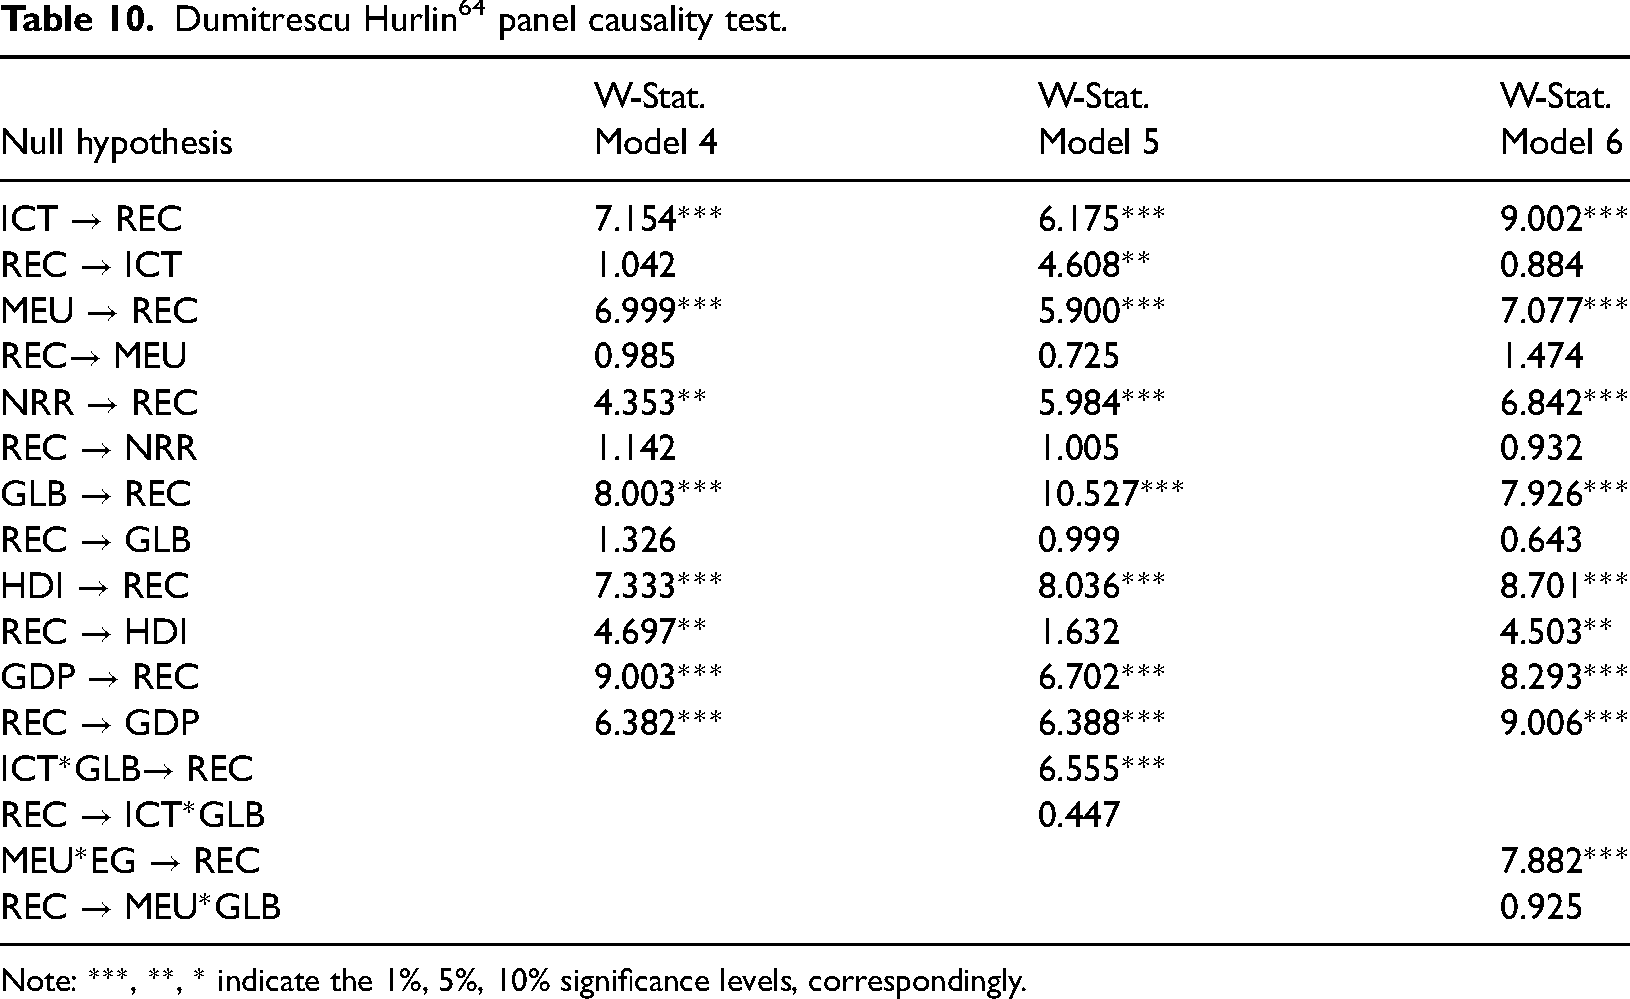
To affirm the robustness of the findings, we apply two cross-checks, i.e., AMG method and panel heterogenous causality test Overall, the AMG estimates show the consistency with the CS-ARDL findings as reported in Table 9. We estimate only models 4–6, deploying the AMG technique since these are the comprehensive models of the study. The AMG's coefficients are slightly smaller than the estimates of CS-ARDL. The results determine that all the modeled series (ICT, NRR, GLB, GDP, HDI, ICT*GLB, and MEU*GLB) are the crucial determinants of REC for selected nations. In addition, the panel causality test validates our results, confirming the unidirectional and bidirectional casual nexus across the selected series reported in Table 10. For instance, the outcome shows the one-way causality from NRR, MEU, and GLB to REC in model 4, 5 and 6. However, the bidirectional causality is observed between ICT-REC (model 5), HDI-REC (models 4 and 6), and GDP-REC (models 4–6). Also, the both interaction terms in models 5 and 6 exhibit the unidirectional causality to REC.
AMG estimates.
Note: ***, **, * indicate the 1%, 5%, 10% significance levels, correspondingly.
Dumitrescu Hurlin 64 panel causality test.
Note: ***, **, * indicate the 1%, 5%, 10% significance levels, correspondingly.
Discussions
In sum, our results demonstrate that ICT plays a pivotal role in triggering the REC, supporting our first hypothesis (i.e., positive nexus between ICT and MEU) for the sampled economies. The economic reasons behind this can be explained as follows. The selected economies have paid a remarkable attention to boost the ICT industry. For instance, USA, Germany, UK, Spain, France, Italy, and Canada have devoted 16.40%, 9.82%, 14.46%, 16.76%, 22.90%, and 9.82%, of the gross capital formation, respectively, toward the sector of ICT in 2019. 66 Likewise, China has invested 36.2% of its GDP for the digital economy and ICT in 2019. 67 Similarly, India has invested 120 billion dollars to trigger ICTs in 2021. 68 There may be several channels through which ICT foster thrive the green energy in the selected economies. The first channel is: ICTs boost REC by facilitating the green finance to renewable energy sector. For instance, the penetration of the mobile banking and the internet banking help in reducing complexity regarding the finance information and maintaining the direct link with green-investors. Similarly, such kind of banking also enables the producers to make comparison regarding the different bank offers and facilities on the finance and loans. Also, ICTs based digital banking enhances the financial institutions’ infrastructure that fosters the financial intermediation's operational efficiencies. All such improvements tend to create the easiness for green financing. Accordingly, it encourages the green-investors to do more investment in renewable energy sector (RES); consequently, the rise in RES results in increase in REC.
The second channel is that ICTs plays a remarkable role in reducing the production cost in several ways. For example, online and mobile banking contract the cost of financial transactions by providing accurate and time-saving information. Likewise, ICTs also dwindle the search cost, smooth the monitoring and controlling the performance, and yield the more production flexibility: all these processes result in reducing the assets’ transaction and production costs. Accordingly, the environment-oriented investment is increased that leads to increases the REC. The third channel is: the use of ICTs’ tool declines the cost of communication, computation, and data processing and this process gives the faster and broader access to obtain the symmetric and required information regarding finance facilities and investment decisions. In this way, ICTs minimize the probability of asymmetric information that motivates the producers to do take certain decisions for investment in RES. Thus, it increases the REC. The last channel is: ICTs cut down the complexities in conventional grid station and improve the grid's infrastructure of transmission, storage, management and distribution by injecting the resiliency, reliability, and efficiency: accordingly, conventional grid turns into “smart grid station.” The process tends to facilitate the production and distribution of renewable energy from different sources to various destinations such as houses and shopping malls, etc. As a result, the REC's trend moves upward. Unlike the prior studies, this is first unique outcome of our study.
Further, the results suggest that MEU can be a serious threat for the green energy since it exhibits a significantly detrimental effect on the ratio of REC, validating our second hypothesis. It implies that MEU reduces the deployment of renewable energy in the selected nations. The same findings were also documented by Lei et al. 51 for China and Shafiullah et al. 53 for USA. There are some economic channels that can explain the plausible reasons behind this. For instance, MEU creates the uncertainty in the market that makes the future profits uncertain. Accordingly, the investors decide to delay the further investment. The decline in investment squeezes the overall production process, including the renewable energy production and as a result, REC tends to fall. On the other hand, MEU also affects the consumers’ economic decisions such that consumers opt to do more saving and less consumption on account of anticipating the likely changes in their income stem from uncertainty. Correspondingly, the demand tends to shrink that causes to decrease the economic activities including the decrease in the demand for green-products. Consequently, it results in the low REC. Another plausible impact of MEU is that it causes to generate the inflation in market that affect consumer as well as producer side. Accordingly, it slows down the economic activities that ultimately result in a fall of REC.
Next, we deduce that the natural resources of the opted economies exhibit the direct link with REC such that the deployment of green energy increases with the increases in the quantity of natural resources. Based on the results, it can be inferred that natural resources may play a critical role in determining the renewable energy. This outcome is in the line with the study by Ahmadov and Borg 14 for European Unions. In addition, the findings suggest that GLB is an important indicator for boosting the REC. Also, Gozgor et al. 13 conclude the same results for OECD nations. Possibly, GLB crates the positive effects on the green energy consumption via transferring the knowledge, green technologies, green environmental policies, public awareness across the territories under study. Interestingly, we find that GLB also creates the benefits for renewable energy sector by facilitating the ICT industry and ameliorating the detrimental repercussions of the MEU when we interact the GLB with ICT and MEU, respectively. This is another uniqueness of our study, unlike the previous literature.
In a similar vein, economic growth is also a primary factor that enhances the green energy combustion in the sampled territories. Nawaz et al. 12 for N-11 and BRICS, Gozgor et al. 13 for OECD, Jacqmin 18 for EU, and Chen 19 for China also report the same results. However, our findings are contradictive to the studies by Aguirre and Ibikunle 25 for 38 economies, Marques et al. 26 for selected EU economies, and Omri and Nguyen 27 for 64 economies that deduce the adverse effects of GDP growth on the REC. Lastly, the unique finding is that our results assert the positive effects of HDI on the REC. The likely explanation for this nexus is: HDI increases the demand for REC by raising the public awareness, emphasizing on the importance of green environment, and avoiding the detrimental effects of environmental pollution that impede the economic development. Consequently, an increase in human capital may leads to enhance the combustion of renewable energy. Finally, the panel causality divulges the important outcome for policy-making authorities. Based on the causal nexus, we can infer that any policy (positive or negative) shock to ICT, GDP, NRR, GLB, HDI, and MEU may create sensitive impacts on REC.
Conclusions and policy recommendations
By far, the effects of ICT and MEU with the consort of NRR, GDP, HDI, and GLB on REC are testified for China, USA, Germany, India, UK, Japan, Spain, France, Italy, and Canada. We find the several interesting and unique findings. For example, the results confirm that ICT plays a remarkable role in boosting REC, while MEU causes to reduce the green energy usage in the short as well as long run. Also, we find that GDP, NRR, GLB, and HDI exhibit the significant and positive impacts on REC. Interestingly, the results also assert the moderating role of GLB for REC through affecting ICT and MEU such that GLB plays a critical role in shrinking the adverse effects of MEU when it is interacted with GLB. Likewise, the AMG coefficients also support the CS-ARDL findings. Finally, the causality tests also confirm that ICT and MEU significantly cause the REC in the sampled economies. The analysis in the recent study is done to suggest some important policies for the selected economies.
Core-policy framework
Based on the results, the study claims that the information and communication technologies (ICT) are the crucial determinant of the green energy. It is matter of fact that the sampled nations are erecting the digital economies by
triggering the ICT sector. Although the global economic growth is swiftly rising; however, it is also observed that the ratio of uncertainties also has been increased. Therefore, several risk factors are witnessed to be associated with green ICT projects; Consequently, the private investors may hesitate in investing these projects. On the other hand, the public investment may increase the fiscal burden on the governments. Hence, it is imperative to devise some comprehensive policies that may help me obtaining the sustainable and green development. Thus, we recommend phase-wise policies to handle this exigency and to get the planned outcome more effectively. The recommended policy can be classified into three phases. In first phase, the economies should focus on importing the clean technologies to foster the local green ICT sector; to do so, FDI route can play a pivotal role. This step will help in thrive the ICT industries without increasing any fiscal burden. In the second phase, the authorities may consider to subsidize the green ICT industries that boosting the green energy production and impose high tax ratio on cheap and polluting ICT industries. This step will lead to a stable and green ICT sector. In third phase of stability, the unclean ICT industries can be considered to replace with green ICT via imports route. Besides, the economic globalization can also escalate REC by influencing the ICT sector. In this context, governments of selected economies should consider a global level coordination to boost economic globalization through preparing the global level and effective economic policies and measures. Consequently, this process may trigger the provision of environmental-friendly technologies including green ICTs that can foster green energy process and economic growth. In addition, the authorities should deploy ICT sources to boost the use of green energy through advertising the importance of green development. It will induce the consumers to utilize the green products; this process, ultimately, may triggers the green energy production through putting the pressure on demand-side.
Another results-based policy that can be recommended is about MEU. Since the uncertainty is phenomenon that exists at local and global level and deteriorates the global economies, it is important to take serious steps to tackle this exigency. First, global authorities must defy the policy of anti-globalization resolutely because such activities tend to create macroeconomic uncertainty that trickles in affecting the economic factors adversely. Second, global economies should do aware the people the harmful effects of anti-globalization on economic activities. This step, ultimately, may reduce the negative effects of uncertainty. Third, the global territories should do a step forward to do global coordination and make the joint policies to eradicate the global MEU. Consequently, it will lead to increase the economic activities, foster country-wise GDP, and enhance the productivity of green economic indicators such as ICT (SGD 9) and NRR, and HDI (SGD 3 and 4), moving toward sustainable and green growth (SGD 7, 8, and 13). Another remarkable advantage of the global coordination is that it may help in decreasing the chances of global conflicts such as economic and political war and retaliation that results in global uncertainties. In consequence, it will enhance the pace of global sustainable and green development.
Regarding the future directions, the recent study focuses on exploring the effects of ICT and MEU on REC, while taking NRR, GDP, GLB, and HDI as controlled series for 10 selected economies. The same model can be testified for developed nations such as G-7, G-20, and OECD countries, emerging and developing economies for comparison, and more detailed policies. Also, our study ICTs, MEU and HDI as determinants of REC that is basic pillar for sustainable and green growth. The same variables can be testified for other panel of developed and developing economies, enriching the current model with some other economic indicators such as exchange rate, global value chain, carbon emissions, international trade, and labor market. Finally, the researchers are suggested to explore the expected non-linear nexus among the current study's series for more detailed interesting findings.
Footnotes
Declaration of conflicting interests
The authors declared no potential conflicts of interest with respect to the research, authorship, and/or publication of this article.
Funding
The authors received no financial support for the research, authorship, and/or publication of this article.
Appendix A: Principal components analysis
| Eigenvalues: (sum = 3, average = 1) | |||
| # | Value | Difference | Portion |
| 1 | 2.373 | 1.823 | 0.783 |
| 2 | 0.521 | 0.457 | 0.169 |
| 3 | 0.083 | --- | 0.023 |
| Eigenvectors (loadings): | |||
| Variable | PC1 | PC2 | PC3 |
| ICT1 | 0.681 | −0.145 | −0.717 |
| ICT2 | 0.660 | −0.300 | 0.688 |
| ICT3 | 00.315 | 0.942 | 0.109 |
| Correlations | |||
| ICT1 | ICT2 | ICT3 | |
| ICT1 | 1.000 | ||
| ICT2 | 0.885 | 1.000 | |
| ICT3 | 0.568 | 0.504 | 1.000 |