
Abstract
As conflicts between emissions reductions and economic growth intensify, an increasing number of countries and regions are focusing on green total factor productivity (GTFP). Financial agglomeration (QWS), resource endowment (SE), and innovation-driven (ID) are the main factors that cause regional differences in GTFP. However, few scholars have comprehensively considered the impact of the interaction between SE, ID, and QWS on GTFP. This article uses the Global Malmquist-Luenberger (GML) index to calculate the GTFP of 30 Chinese provinces from 2003 to 2020 and constructs a dynamic panel model to present the first comprehensive study of the interactions between SE, ID, and QWS and their relationship with GTFP. The conclusions are as follows. (1) SE is positively correlated with GTFP, which is different from the “resource curse” theory proposed by existing research. (2) There is a crowding-out effect between SE and ID, and their interaction will restrain the growth of GTFP. (3) QWS promotes ID, and the interaction between the two promotes the growth of GTFP. (4) There is a restraining effect between QWS and SE, and their interaction will hinder the growth of GTFP. (5) The key policy directions to improve China's GTFP are to undertake strategic planning from a comprehensive perspective, including encouraging innovation, guiding financial development reasonably, and avoiding excessive consumption of resources.
Keywords
Introduction
The accelerated industrialization of the economy will lead to a continued rise in carbon emissions. 1 The United Nations has proposed the Sustainable Development Goals to promote green production. The government is generally seen as an important guide for green development. 2 China is currently striving to achieve peak emissions by 2030 and carbon neutrality by 2060. Therefore, it is important to explore in depth the impact of the main factors affecting green total factor productivity (GTFP), that is, resource endowment (SE), innovation-driven (ID), and financial agglomeration (QWS), on GTFP and thus promote green economic development.
Total factor productivity (TFP), a core indicator of high-quality economic development, has been recognized by most countries.3,4 However, TFP fails to take into account the loss of environmental resources brought about by economic growth, which may mislead policy recommendations. 5 As a modification of traditional TFP, improving GTFP can be used as a driving force of the green economy. 6 Liu and Xin 7 similarly indicated that the essence of green development is to improve GTFP. Consequently, GTFP, TFP considering productivity improvement and environmental protection, has attracted extensive attention from various countries (Figure 1).
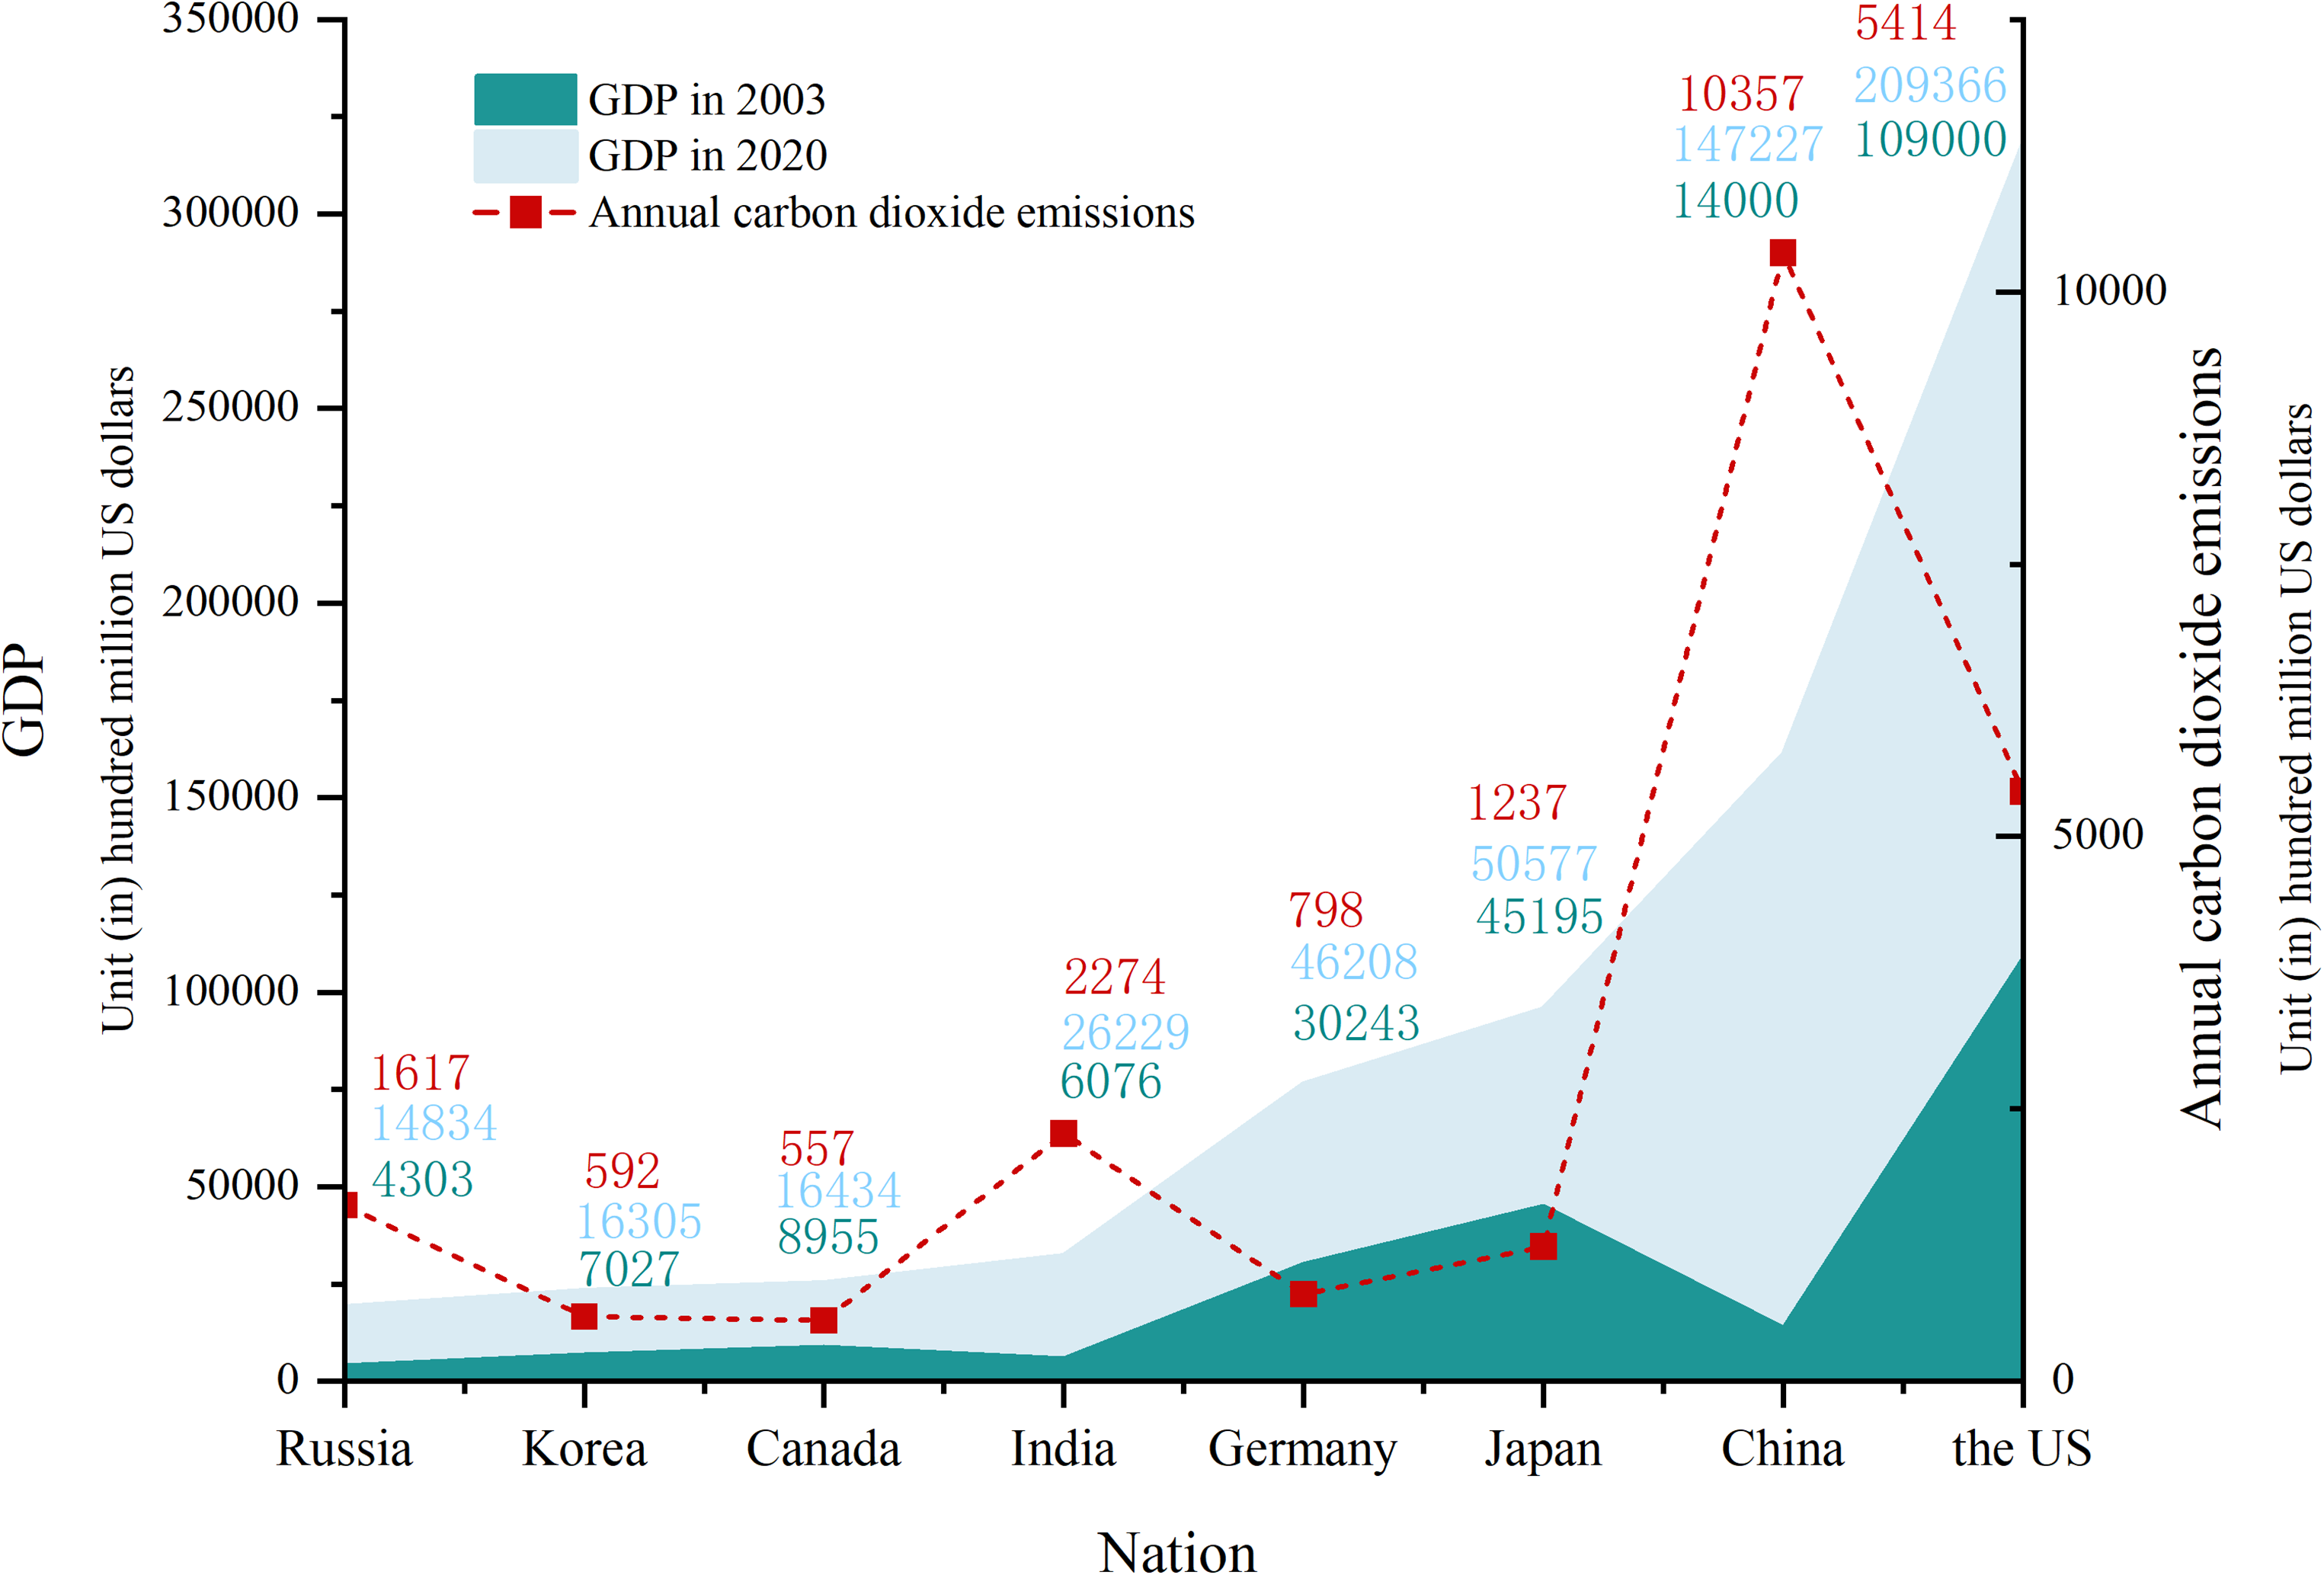
Carbon dioxide emissions and GDP growth trends in some countries.
A consensus on global economic growth is that natural-rich areas tend to perform poorly in the conservation of resources and the environment. Thus, these regions face more complex factors and challenges in the development of the green economy. 8 However, there are two entirely different views, that is, the “resource curse” and the “resource Gospel”. 9 Abundant natural resources are a limitation, rather than a favorable condition, for regional green economic growth. 10 However, some scholars believe that SE can promote the development of green economic growth. 9 In conclusion, empirical studies between SE and GTFP have not reached a consistent conclusion.
In the era of global promotion of new technologies and new energy, China is transforming into an intensive growth model driven by efficiency improvement and innovation. In the state of QWS, large-scale centralized savings, incentive managers, and other services will promote entrepreneur innovation.11,12 Meanwhile, the economy promotes GTFP growth mainly by promoting technological progress, improving technological efficiency, and narrowing the technological gap. 13 The increased demand for external financing by QWS can reallocate scarce capital to high-productivity investment projects, promote the efficient use of SE, and promote regional ID levels. 14 Obviously, QWS plays a key role in the development of a green innovation economy.
However, few scholars have considered the effects of the three variables SE, ID, and QWS and their interactions on GTFP in an integrated manner, and these relationships have not been fully elucidated. Prior studies, surprisingly, neglect to explore the effect of ID on GTFP from the perspective of SE and QWS. To bridge these gaps, this article answers two questions. (1) How is the comprehensive effect of the interaction between the three variables of SE, ID, and QWS on GTFP? (2) From the perspective of SE and QWS, what is the deep impact of ID on GTFP?
From a research methodology perspective, there is already a large body of literature that uses panel methods. Although the subjects and spatial and temporal scopes of the studies differ, they generally involve long periods of time and large amounts of data.15,16 Different topics and temporal and spatial ranges have been discussed by different researchers.17,19 However, they usually involve large amounts of data and long timelines and take into account that the variables may be endogenous.
Based on this, this article constructs a dynamic panel model to examine the interactions between SE, ID, and QWS and their relationship with GTFP in 30 Chinese provinces over the period 2003–2020. First, this study focuses on China, with dynamic observations over a long period of time, allowing the panel method to provide a reference specifically for other areas. Second, in terms of variables, this article presents the first comprehensive study of the interactions between SE, ID, and QWS and their relationship with GTFP and then enriches the research subjects of the panel method.
In addition, the innovation of this study is mainly reflected in the following four aspects. (1) Innovations in the relationship between the variables in the GTFP dynamic regression model. Specifically, a dynamic panel regression model was constructed to study the internal relationship between the three variables SE, ID and QWS and their impact on GTFP, allowing for a more comprehensive analysis of the mechanisms of green development. (2) More detailed research was conducted at the provincial level, and the research time was updated. This article uses GML to scientifically measure GTFP and explores the temporal and spatial differences in GTFP from 2003 to 2020. (3) Unlike the previous literature focusing on theoretical variable relations, this article actively explores the complex relationship between SE, ID, and QWS and GTFP from both theoretical and empirical aspects. (4) Choosing the typical developing country, China, as the subject of the study, the findings may provide references and recommendations for similar countries. In particular, what is the mechanism of SE, ID, QWS, and GTFP in other developing countries homogeneous or heterogeneous? Moreover, the methods and indicators of this article can provide a reference when conducting related studies in other regions.
The main goal of this article is to explore the mutual influence of QWS, ID, and SE and the comprehensive impact of the three on GTFP. This study uses China's provincial panel data for 2003–2020 to build a dynamic panel regression model. Meanwhile, the GML index is adopted to estimate GTFP, and the comprehensive effects of SE, ID, and QWS on GTFP are analyzed through the generalized moment method (GMM).
Research hypotheses
The SE on GTFP
There are two contrasting views on the relationship between GTFP and SE, that is, the “resource curse” and the “ resource gospel”. Neoclassical trade theory proposes that abundant SE can provide sufficient resource demand for the region.
20
Natural resources are a driver of economic growth and have a positive impact on economic growth. The overconsumption of resources leads to abnormal economic growth.
21
However, Adams et al.
22
believe that natural resources have a negative impact on the economic development and governance of countries with weak institutions. In addition, Zhao and Zhang
9
analyzed the impact of SE on green development in the Yellow River basin and showed that there is a “ resource curse” in the Yellow River basin. The siting of the Yellow River basin in China is specific. At the national level, resource-rich areas may instead enhance green development due to economic upgrading and technological change. Therefore, the performance of SE on green economic development remains an issue worthy of further exploration. Therefore, hypothesis 1 is as follows:
SE and ID
SE is an important factor affecting GTFP. 23 Liu et al. 24 proposed in 2016 that ID is an important factor in improving GTFP. Some theoretical and empirical studies show that SE is an important factor affecting ID, but the relationship between the two remains to be explored.
On the one hand, some scholars believe that resource advantages can promote innovation. On the other hand, studies have found that local ID with abundant SE tended to be low. To achieve green development initiatives, sufficient resources need to be allocated to create new technologies, meaning that resources are the drivers of innovative development.
25
However, Fan
26
found that compared with resource-rich areas, resource-poor areas will instead encourage people to innovate, and resource-poor areas can promote the growth of GTFP through ID. Regions with sufficient SE typically tend to rely on existing resources and ignore the development of ID, which may ultimately hinder the development of GTFP..
27
The effect of green innovation on GTFP is more significant in nonresource-based cities.
9
From the above, areas rich in natural resources may not be able to drive innovation. Given the above analysis, Hypothesis 2 is proposed:
QWS effects through resource allocation
The concentration of financial resources between regions is accelerating, and financial institutions are becoming highly concentrated.28,29 Judging from the literature, QWS has always been the core research content of economic development. However, in the context of green production, there is still a lack of comprehensive research on QWS, ID, and GTFP.
The relationship between QWS and ID has received much attention. Ang 30 believes that QWS can promote the allocation of capital and talent flow and provide support for ID. Meanwhile, as the main factor affecting GTFP, ID may have a more significant promoting effect on GTFP when it depends on QWS to be promoted. In addition, some researchers have revealed that the contribution of QWS to technological innovation increases with the level of QWS. 31 Although these two variables have received much scholarly attention, the relationship and the impact of the process should be further investigated in the context of promoting green production.
On the other hand, many scholars are focusing on the complex relationship between QWS and SE and their combined impact on GTFP. Zhao
32
proposed that QWS can improve the efficiency of the cross-regional allocation of financial resources in China so that regional SE can be effectively utilized. However, when the SE is excessively consumed, GTFP performance deteriorates. Xie et al.
33
discovered that QWS facilitates GTFP growth in a given city, but it significantly reduces GTFP in surrounding areas of the city, but the reason is not further discussed. Therefore, it can be speculated that improving resource allocation through QWS can improve the utilization rate of SE, and the combined effect of QWS and SE will hinder the growth of GTFP. Considering the above situation, the following conclusions are presented:
In general, Figure 2 is the theoretical model for the hypothesis constructed in this article. As shown in Figure 2, SE will influence GTFP by providing the resources needed to promote economic development. Therefore, Hypothesis 1 (H1) is proposed. Furthermore, there is a crowding-out effect between SE and ID. Therefore, Hypothesis 2 (H2) is proposed. At the same time, QWS promotes the development of regional ID by introducing capital and technology, increasing the manufacturing industry. Meanwhile, there is a positive correlation between innovation and GTFP. Therefore, Hypothesis 3 (H3) and Hypothesis 4 (H4) are proposed. Furthermore, QWS can improve resource allocation, consume SE, and hinder the growth of GTFP. Therefore, Hypothesis 5 (H5) is proposed.
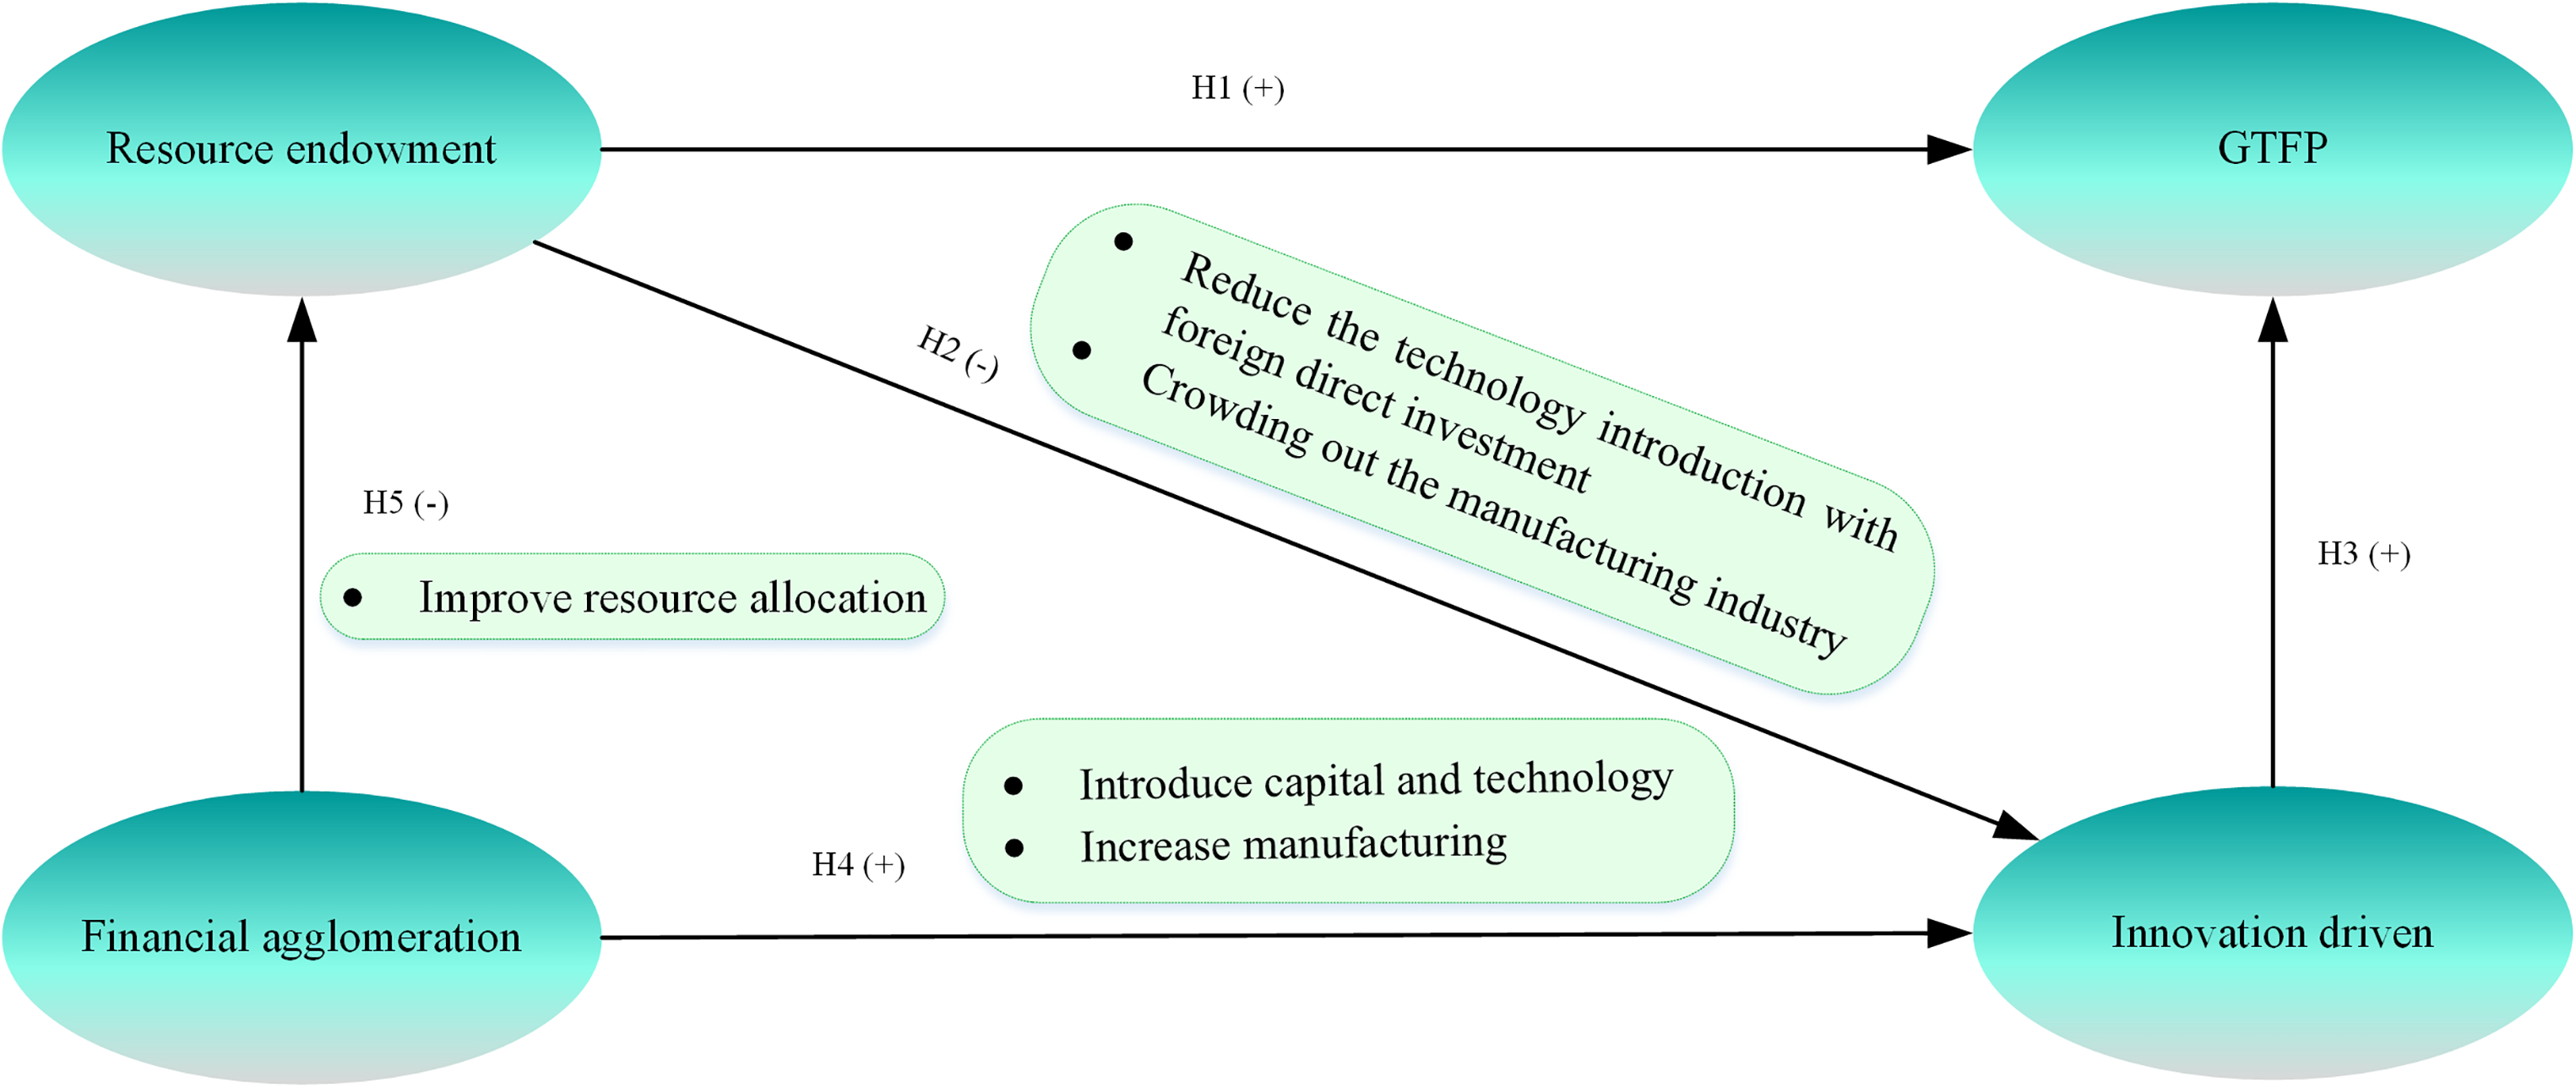
The hypothetical theoretical model.
Model establishment and data description
Model establishment
Considering that the change in GTFP is a dynamic accumulation process, based on the New Growth Theory, capital, labor, and technological progress are the main driving factors of economic growth.
34
Additionally, previous studies have shown that technological progress is mainly promoted through environmental regulation (ER), foreign direct investment (FDI), and energy consumption (EC).
35
The resulting production function is described as follows:


According to the connotation of the GTFP, equation (3) is divided into two sides by F (Kit, Lit) to obtain the following formula:


Considering the impact of past productivity, ID and SE on the current productivity, this article uses
Adoption and interpretation of variables
Dependent variable
The dependent variable in this article is GTFP. Previous studies have generally used Malmquist–Luenberger (ML) established by Chung et al.
37
and Pastor and Lovell
38
to measure GTFP:
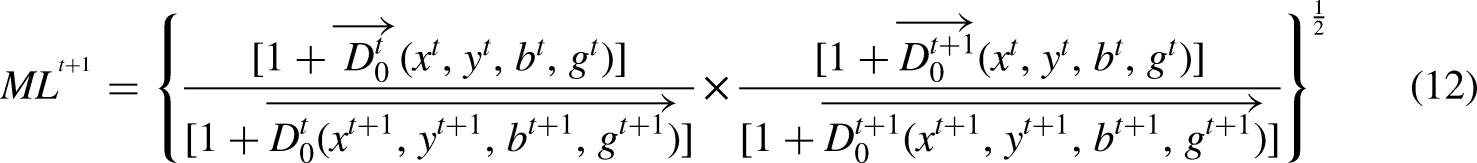
However, the geometric average form of ML has some defects: it may face issues such as false technical regression and infeasibility of linear programming. Therefore, a global benchmarking technique should be defined to improve ML. The enhanced Global Malmquist‒Luenberger (GML) index is expressed as follows:

Core variables
QWS: Location entropy is simple to calculate and widely used.
39
Therefore, the location entropy is used to quantify the degree of QWS. The formula is as follows:
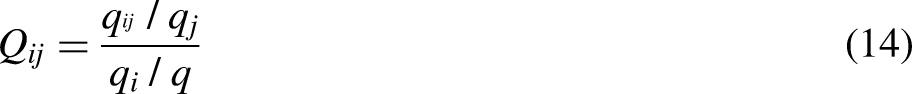
In equation (14), i and j represent the financial industry and prefecture-level city, respectively; ID: ID is conducive to improving production efficiency and promoting resource utilization and is the fundamental driving force for green development.40,41 A large number of studies have shown that innovation is inseparable from economic support, so this study mainly uses R&D investment to measure the level of ID. SE: SE is the total amount of natural resource wealth owned at a certain point in time.
10
Referring to the literature, the impact of SE mainly depends on the degree of dependence on resources, so many scholars emphasize the index of resource dependence.
42
Resource dependence is a ratio indicator, among which, since the extractive industry includes subsectors directly related to natural resources such as coal, oil, and natural gas, it can comprehensively measure the degree of dependence of the economy on natural resources. Therefore, the ratio of the number of mining employees to the total number employed at the end of the year can be used to measure SE.
Control variables
Many control variables are introduced to the model based on previous literature to attenuate the endogenous issues of dependent variables, so the estimation accuracy of the literature is improved. The variables are included as follows:
ER: ER is an overall assessment by the government to influence industrial transformation through industrial transfer effects and ultimately improve the quality of the environment.
43
Environmental pollution control investment, as the capital used to form fixed assets in the process of industrial pollution control, includes investment in urban environmental infrastructure construction, investment in new and old industrial pollution source control projects, and “three simultaneous” environmental protection investment. According to the existing research, this article adopts environmental pollution control investment to measure the intensity of ER. EC: China is an economic system dominated by extensive development. This rapid development has caused excessive resource exploitation and substantial pollution, which has an adverse impact on ECO development.44,45 Among them, electricity is widely used and consumes a great deal of energy, and its electricity consumption is an important EC index. Therefore, this article selects the annual electricity consumption of each province to represent EC. FDI: Foreign capital tends to invest in industries with excellent development potential and high structural levels. Expanding FDI can help industrial cities improve the quality and sustainability of their development.
46
This article selects foreign investment for analysis. Factor endowment structure (K/L): Factor endowment structure is the fundamental factor determining economic growth. In the factor endowment structure, the market development levels of capital and labor are different, and the proportion of capital factors is slightly higher.
47
Hence, K/L is adapted to represent the factor endowment frame of provinces and cities.
Data resources
In panel data, we usually face the problem of serial correlation and heteroskedasticity. Feasible generalized least squares (FGLS) allows the model to have heteroskedasticity and no cross-sectional correlation, and for large sample sizes, FGLS can overcome the heteroskedasticity and autocorrelation problems more effectively. Meanwhile, GMM reduces the problems of serial correlation and heterogeneity. 48 Taking into account the applicability and technicality, the GMM model and FGLS model are used as robust results to estimate the relationship between variables in this study.
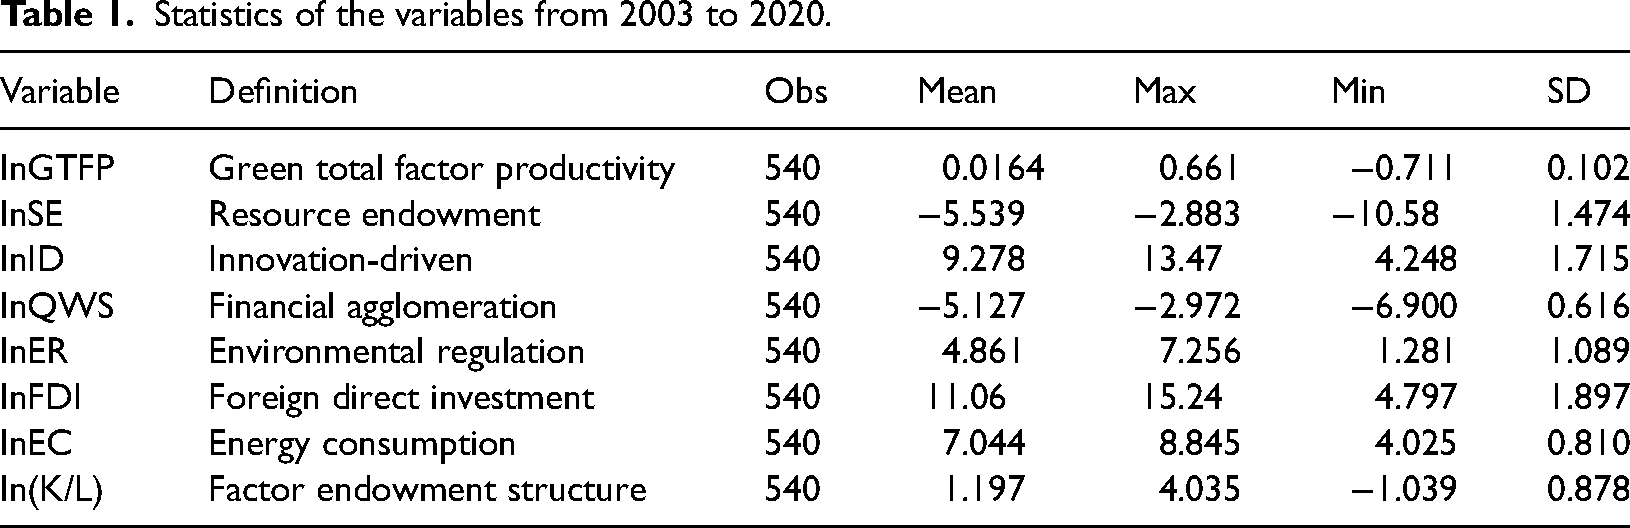
To ensure scientific and reliable data, this article selects China's provincial panel data from 2003 to 2020 to conduct an empirical study on GTFP. Specifically, the sample covered 2003–2020 data from 30 provinces, cities, and autonomous regions in China. Due to insufficient data, Hong Kong, Macau, Taiwan, and Tibet are not included. “China Statistical Yearbook” and “China Environmental Statistical Yearbook” are the main sources of sample data for this study. For the missing data in some years and regions, this article uses the moving average method and interpolation method to supplement and establishes a sample set of 540 observations in 17 years for each region. In addition, this study converts variable values to logarithmic form to reduce heteroskedasticity and compresses all nominal variables into real variables with constant prices in 2003 through the GDP deflator to eliminate price effects. Table 1 shows the descriptive statistical results of the above variables.
Statistics of the variables from 2003 to 2020.
Results
Regression analysis of the feasibility test
To overcome the pseudoregression problem, the accuracy of the regression structure is confirmed. This article uses the Levin-Lin-Chu , Im-Pesaran-Shin, Fisher-Augmented Dickey-Fuller, and Fisher-Phillips and Perron methods to test the unit root of all variables. The results are shown in Table 2. The original data series of each variable is stable since most variables passed the significance tests more than three times. Moreover, to detect whether there is multicollinearity between variables, the variance expansion coefficient (VIF) test is carried out on the variables. On the basis of the results in Table 2, if VIF is below 10, regression analysis can be carried out.
Root of unit and VIF test results.
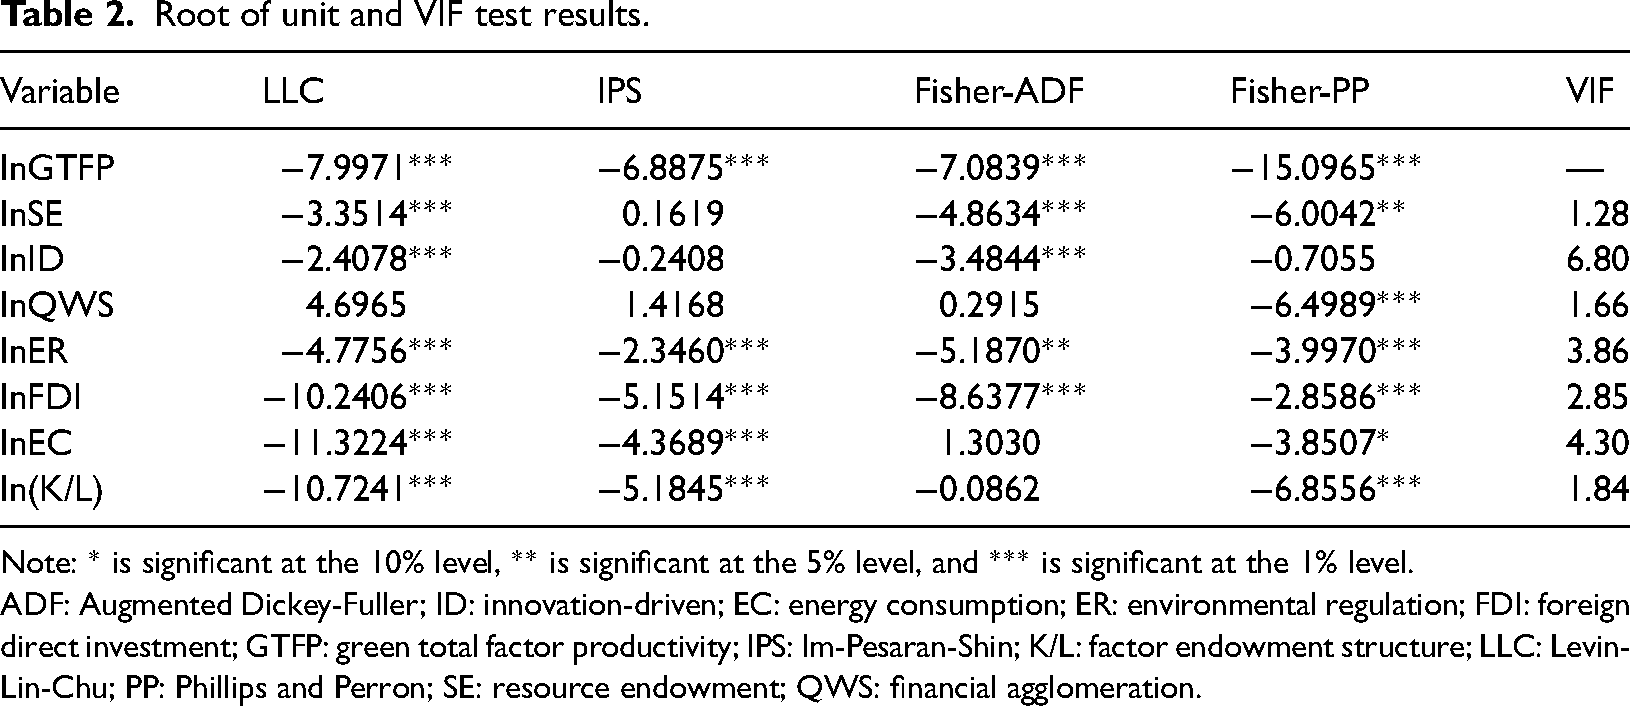
Note: * is significant at the 10% level, ** is significant at the 5% level, and *** is significant at the 1% level.
ADF: Augmented Dickey-Fuller; ID: innovation-driven; EC: energy consumption; ER: environmental regulation; FDI: foreign direct investment; GTFP: green total factor productivity; IPS: Im-Pesaran-Shin; K/L: factor endowment structure; LLC: Levin-Lin-Chu; PP: Phillips and Perron; SE: resource endowment; QWS: financial agglomeration.
Granger causality test results
The Granger causality test was used to explore the relationship of variables (Table 3). It can be seen that (1) at the 5% significance level, GTFP is the Granger of the ID factor and (2) at the 1% significance level, GTFP is the Granger of the QWS factor. The Granger causality test is primarily used to test for causal relationships between variables from a statistical point of view, and the results could be explored further. 49 To further explore the specific relationship between variables, we will use GMM and FGLS for detailed argumentation.
Granger causality test results.
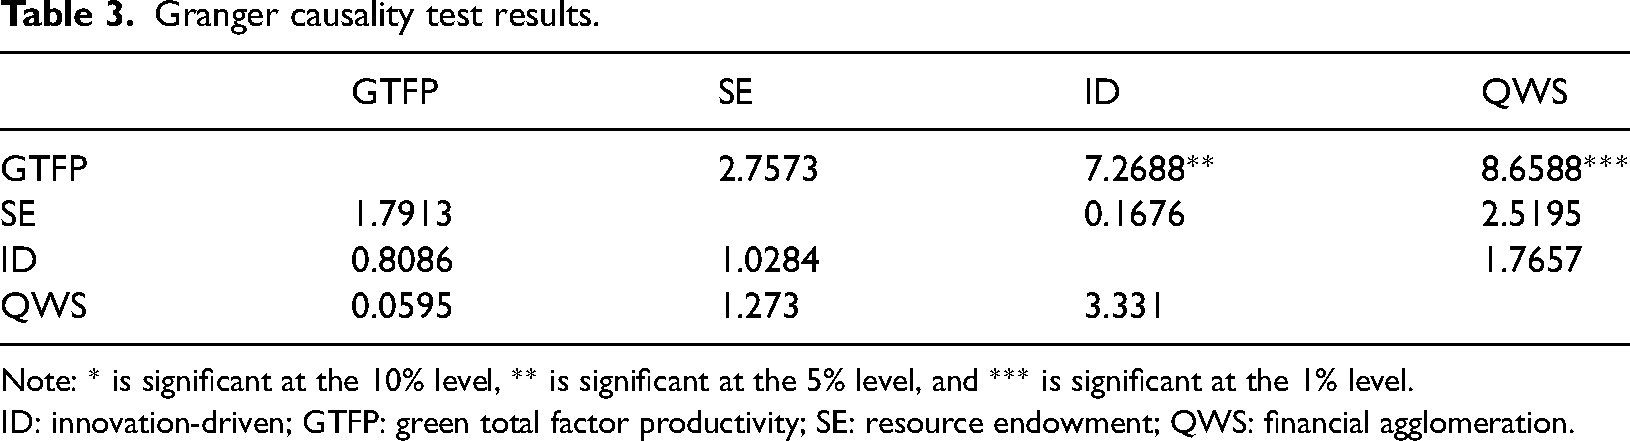
Note: * is significant at the 10% level, ** is significant at the 5% level, and *** is significant at the 1% level.
ID: innovation-driven; GTFP: green total factor productivity; SE: resource endowment; QWS: financial agglomeration.
Spatial–temporal changes in GTFP in various regions of China
The DDF and GML are adopted to calculate the GTFP according to data from China's 30 provinces from 2003 to 2020. The general trend of GTFP in the regions of eastern, central and western China is shown in Figure 3.
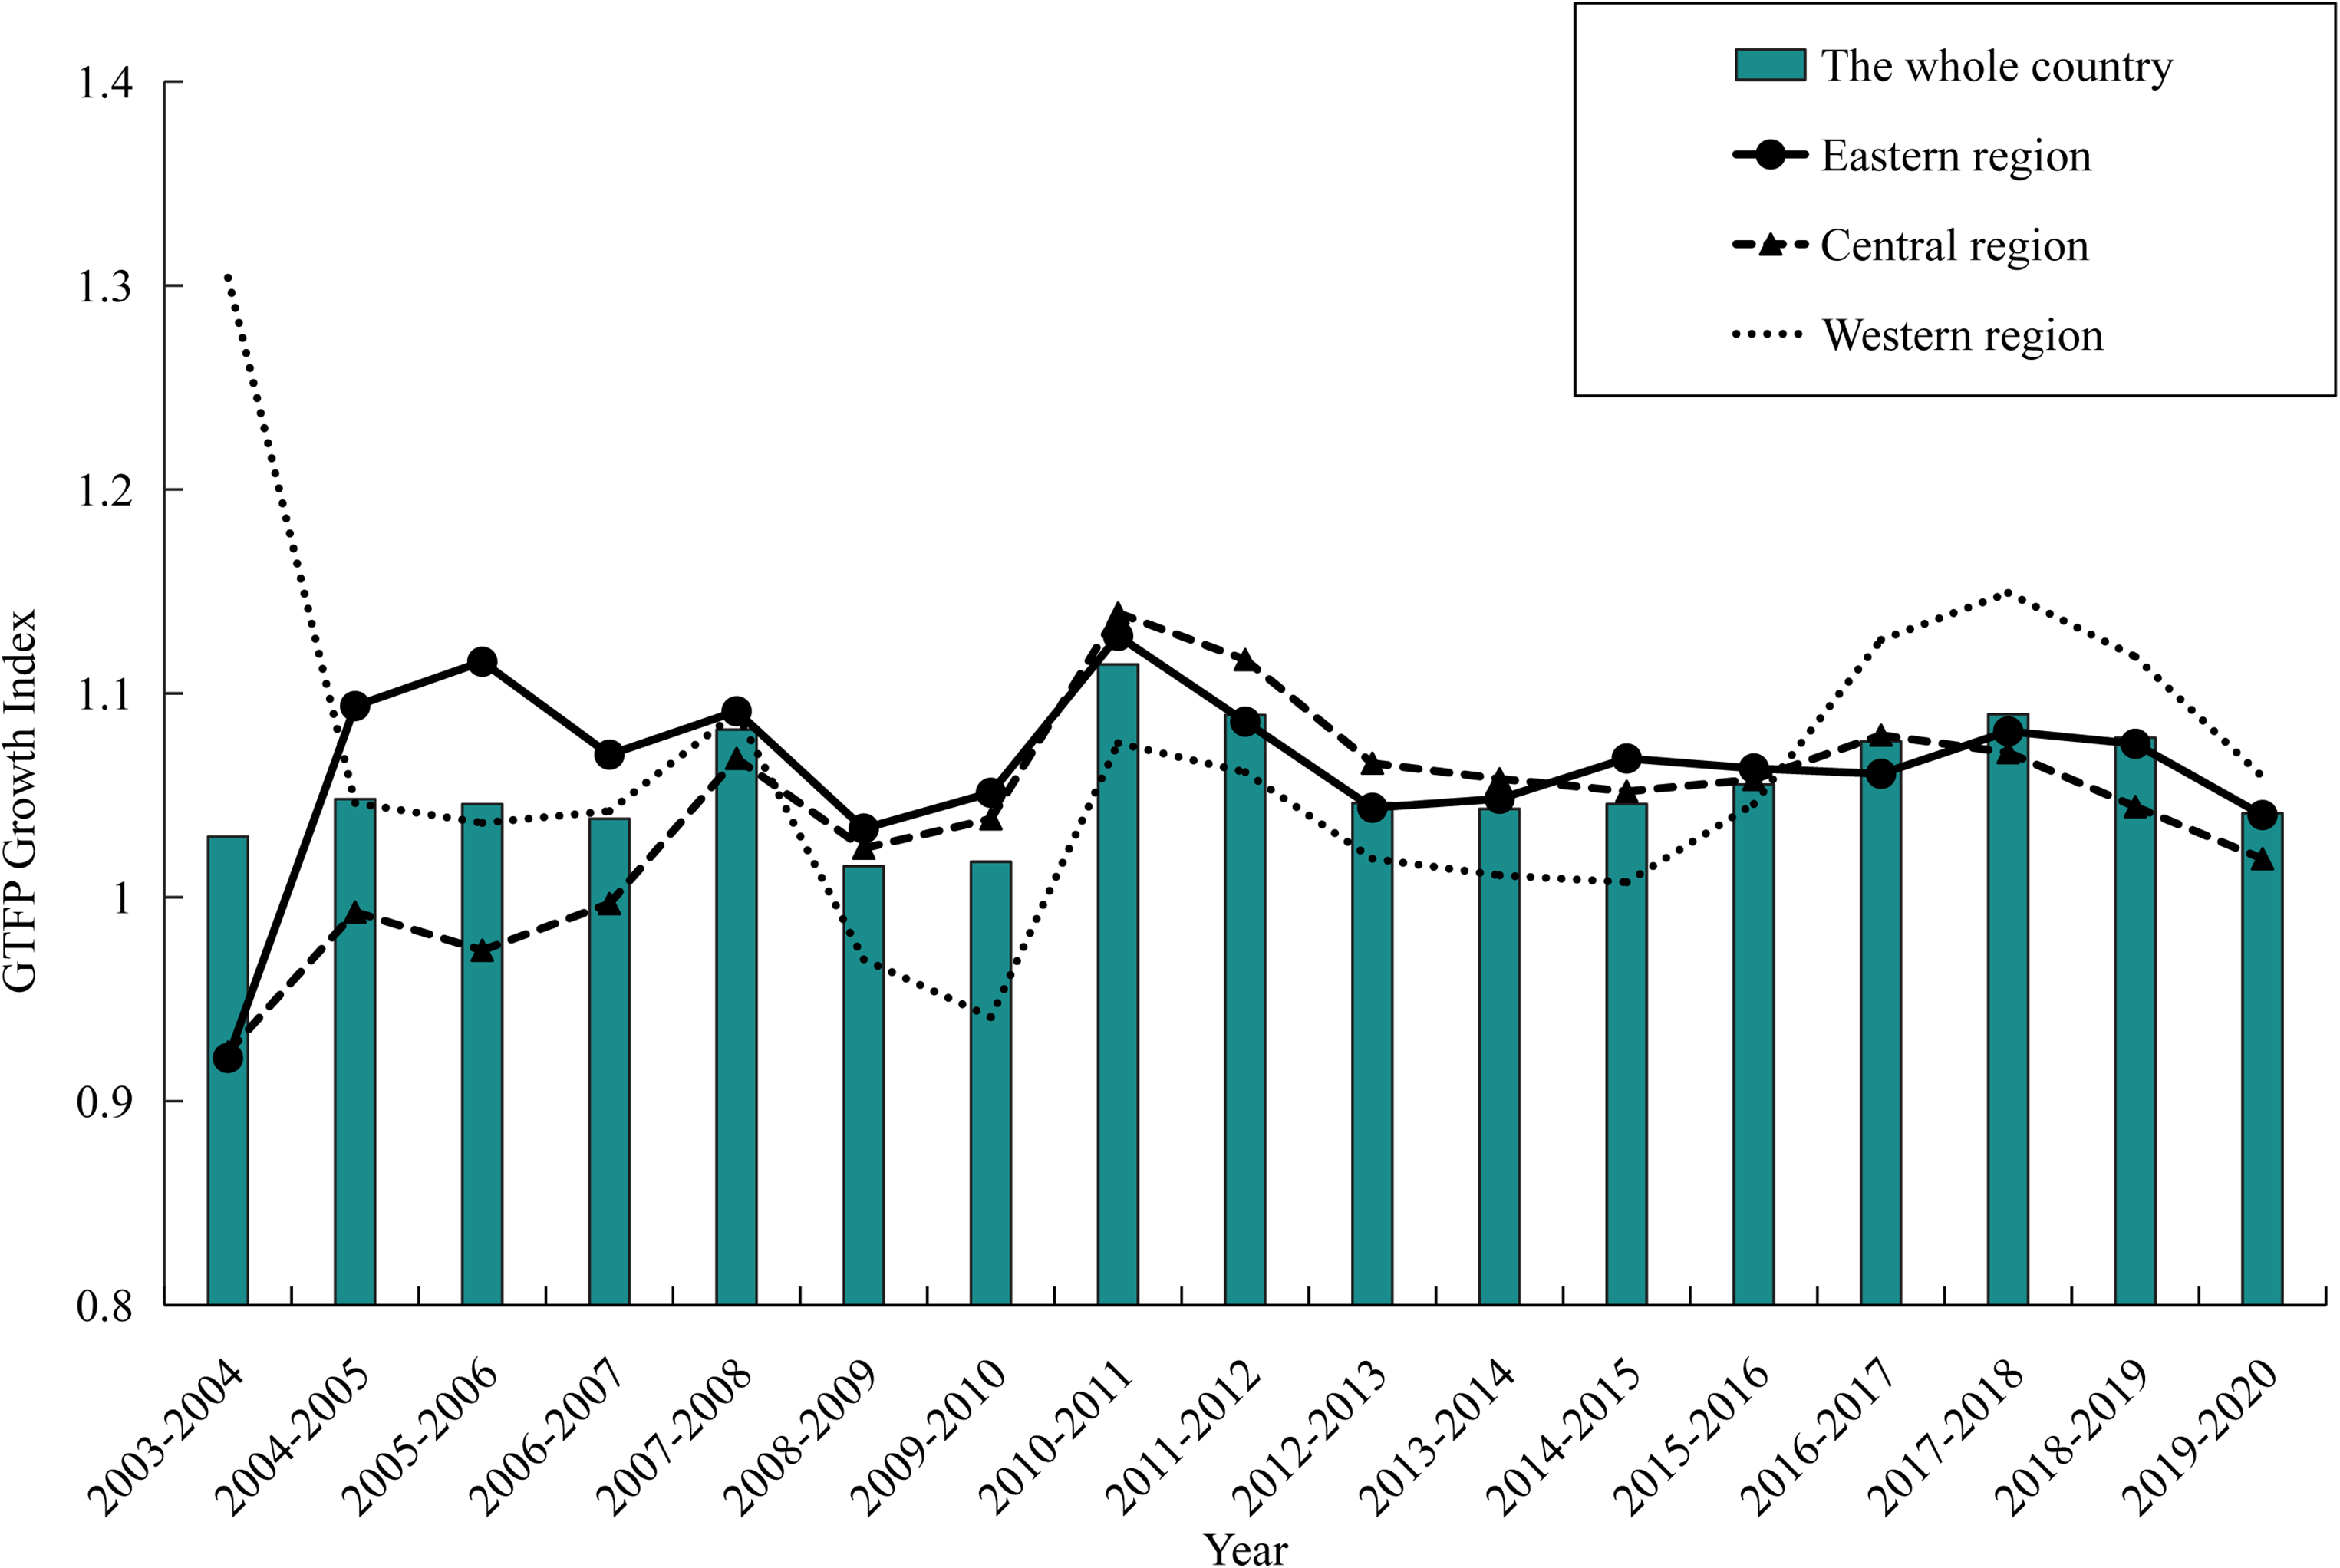
China's average green total factor productivity (GTFP) growth index from 2003 to 2020.
The overall trend of GTFP in China from 2003 to 2020 is shown in Figure 3. During the 18 years, the GTFP increased from 1.0297 in 2003 to 1.0411 in 2020. The overall growth is small enough to see the difficulty of restoring environmental quality. Overall, GTFP fluctuated significantly in the early stage and gradually stabilized.
Specifically, GTFP rose slightly from 2003 to 2008. From 2008 to 2010, GTFP decreased significantly. Combined with the international environment at the time, it is conceivable that the financial crisis in 2008 reduced China's environmental quality. At this stage, the midwest GTFP received more impact than the East. Therefore, it is not difficult to imagine that rich natural resources can indeed promote economic development. Under the normal state, SE is relatively high, which can promote green economic development; that is, SE can promote GTFP. However, when the consumption of resources intensifies, high investment and high waste will lead to the decline of resource and environmental benefits. If the development and adjustment of the manufacturing industry is not timely, the SE will transform the promoting effect into constraints. Therefore, in the face of such situations, the government should actively adjust its policies to promote the transformation of manufacturing to a green development model.
Further analysis, this study improves the intuitiveness of the results. It is undeniable that significant policy changes and national strategic changes will profoundly affect GTFP outcomes. In 2003, environmental protection, as an important historical task in China, was placed in a very prominent position. In 2008, China first proposed the “construction of ecological civilization” (EOEC). This shows that environmental and resource protection has become China's focus of attention. In 2013, EOEC was added to the five-in-one overall layout, clarifying the priorities of China's environmental policy. The constitution introduced EOEC in 2018, and eco-civilization construction was mentioned to an unprecedented height.
To avoid major policy changes affecting the research results, 2003 to 2020 were divided into four time periods and then analyzed to make the results clearer and more objective, as shown in Figure 4.
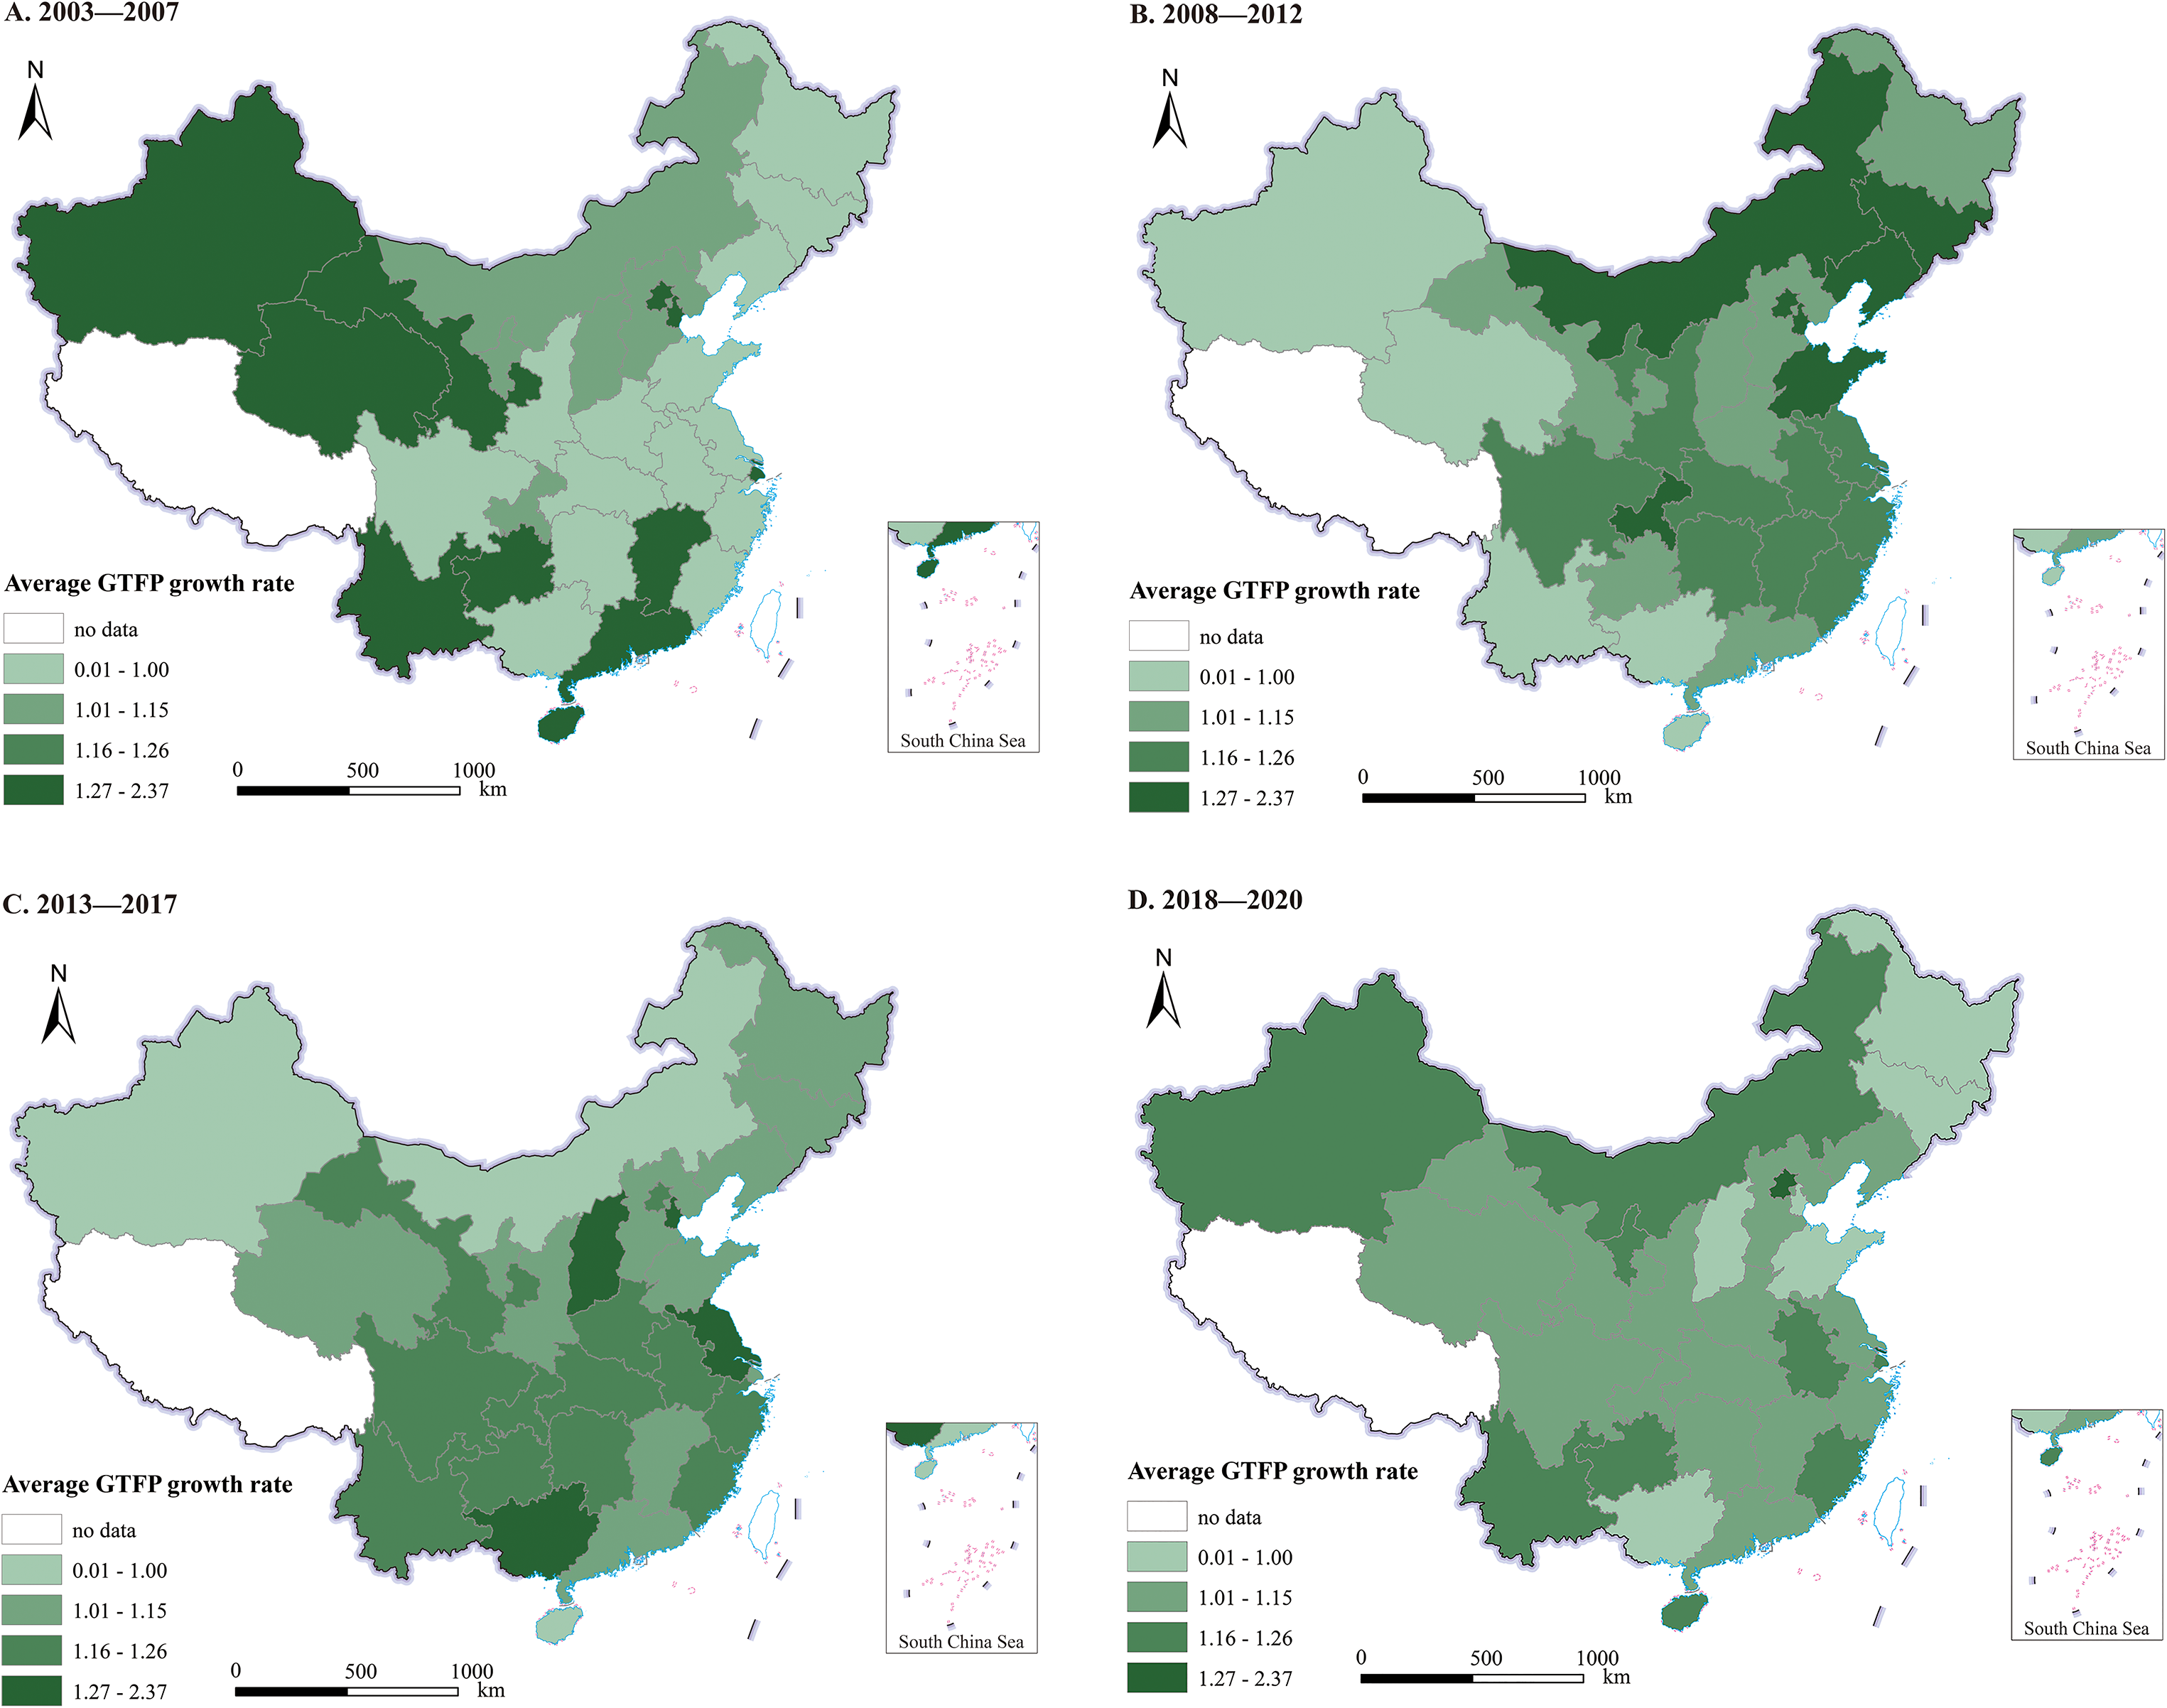
The spatio–temporal differentiation characteristics of the regional average green total factor productivity (GTFP) growth rate in China.
GTFP changes also vary according to regional differences due to different developments in the eastern, central, and western areas. From 2003 to 2007, the economic growth of the central and eastern regions grew rapidly, and the GTFP growth rate was relatively low. However, most of the western part maintained high GTFP growth rates. The reason may be that the west‒east gas transmission project, a landmark development project from west China, was supplied through all gas lines in December 2004, which became a pivotal link to drive the economic development of the west and optimize the energy structure. This also once again emphasizes the need for ecological innovation and the development of clean energy sources. The growth rate of GTFP in the western areas decreased from 2008 to 2017, and the central and eastern regions improved significantly. In addition to the extensive financial crisis, it is also an important reason for its long-term impact on economic development. Meanwhile, economic progress has brought about an increasing improvement in quality of life, which may lead to the destruction of environmental quality. The eastern region is indeed limited by environmental policy. However, its GTFP growth rate is rising, proving that economic development and environmental protection can make expected progress. After the GTFP growth rate in most parts of the country was balanced, the growth rate of GTFP in the western areas increased.
Since the reform and opening up, local governments have relaxed their constraints on environmental pollution to achieve rapid economic growth in the eastern and central areas. However, this extensive economic development is clearly unsustainable. We still find that the GTFP is not optimistic in the eastern and middle areas. Although environmental issues have become the focus of society as a whole, most areas are still unable to eliminate the development model of heavy pollution.
The western parts of China are rich in resources and have great potential for economic progress. Benefiting from the implementation of the western great development strategy, the economy of the western region grew rapidly. However, this also inevitably accelerates emissions of environmental pollutants, leading to poor long-term performance of GTFP.
Empirical results analysis
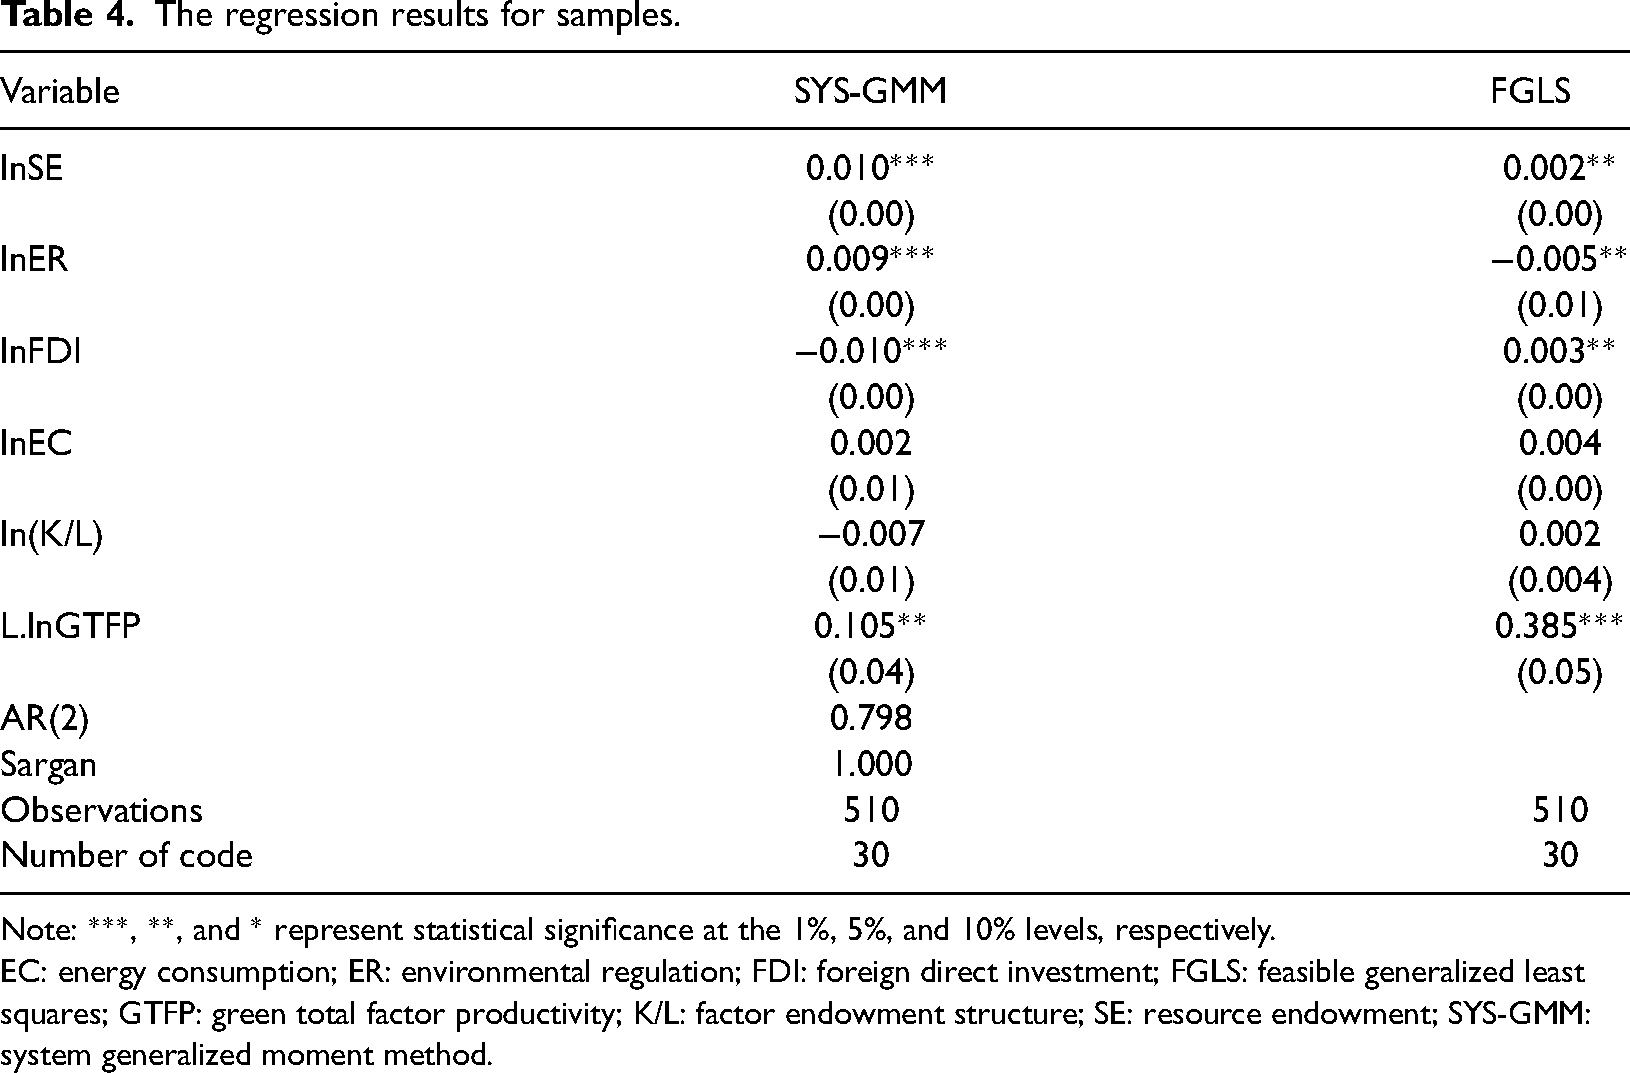
This article first verifies the effect of SE on GTFP using FGLS and system GMM (SYS-GMM). Table 4 shows the estimated results. According to the comprehensive data of the two methods in the figure, SE has a promoting effect on GTFP; that is, an increase in SE can promote the improvement of GTFP.
The regression results for samples.
Note: ***, **, and * represent statistical significance at the 1%, 5%, and 10% levels, respectively.
EC: energy consumption; ER: environmental regulation; FDI: foreign direct investment; FGLS: feasible generalized least squares; GTFP: green total factor productivity; K/L: factor endowment structure; SE: resource endowment; SYS-GMM: system generalized moment method.
As shown in Table 4. Among them, the AR(2) test is greater than 0.05, and the overidentification test (Sargan) is greater than 0.1, which proves that it accepts the null hypothesis; that is, the model established in this article is standardized.
In models (7) to (9), the coefficient of the first-order lag term of GTFP is significantly positive, indicating that the growth of GTFP is a path-dependent positive feedback dynamic accumulation process. Both the SYS-GMM and FGLS estimation results showed that the linear coefficients of SE were significantly positive, indicating that there was a positive correlation between SE and GTFP. This can be explained by the fact that places with higher SE content can provide more green resources, thus promoting the growth of GTFP.
Further discussion
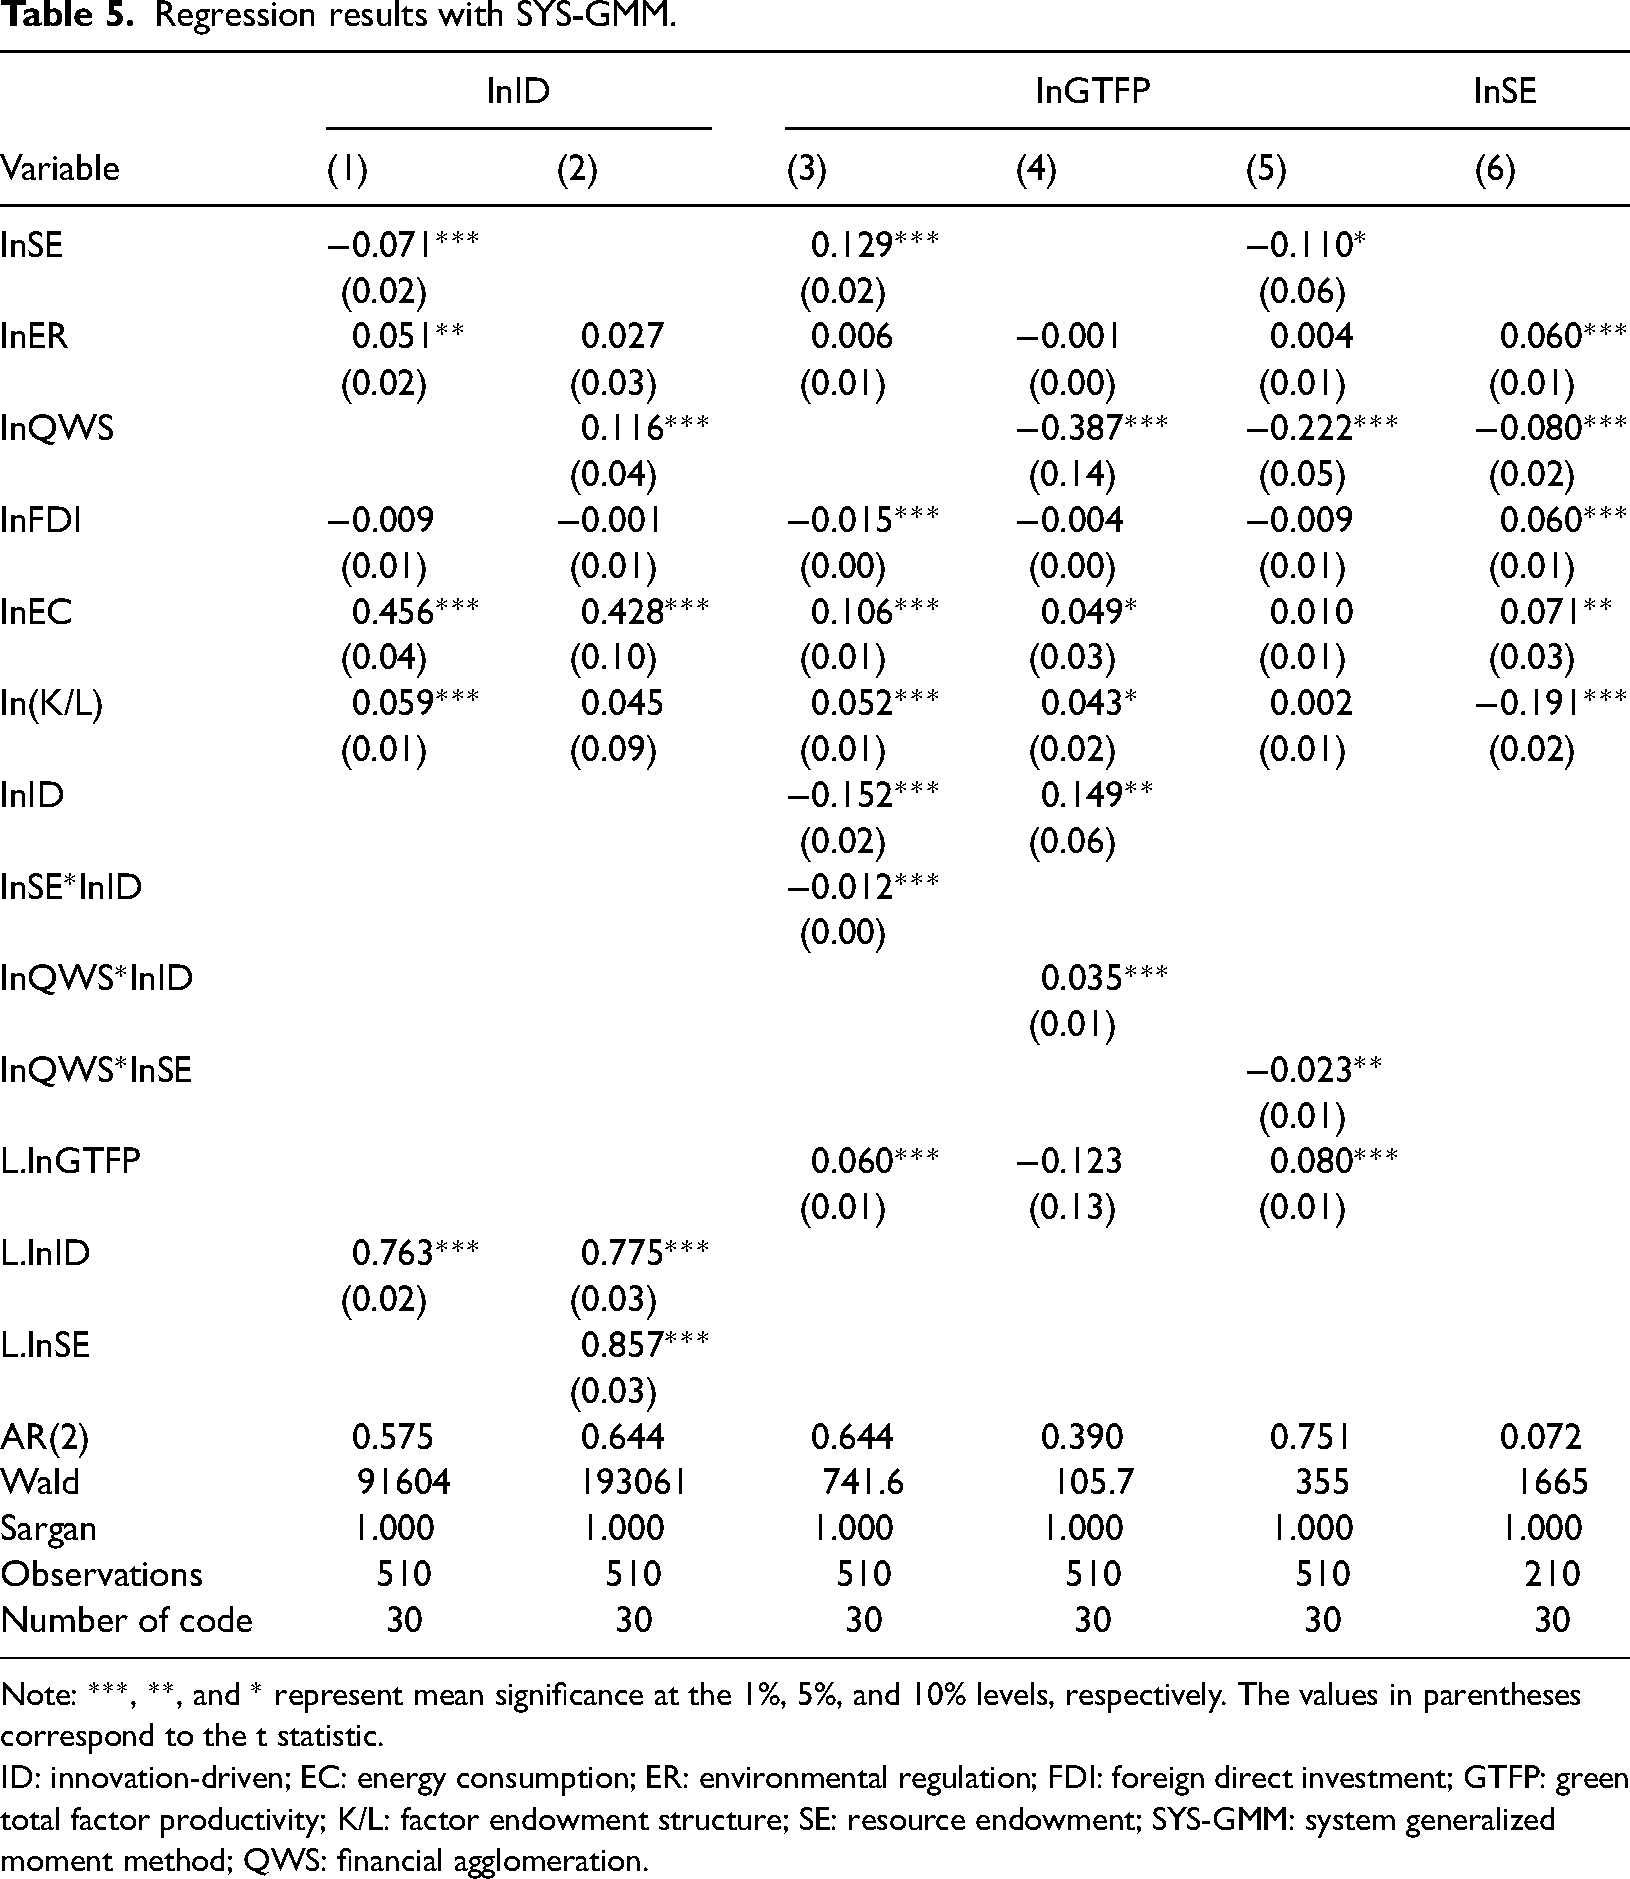
With the trend of China's economy turning to high-quality development, the role of QWS, SE and ID on GTFP is strengthening daily. The impact of the joint action of the three and how to better improve GTFP need to be considered. In response to these problems, the three linear terms and the interaction terms between QWS and ID, SE and ID, and QWS and SE were introduced into the model to study the interaction between QWS, SE and ID and the impact of the interaction terms on GTFP. The results are shown in Table 5.
Regression results with SYS-GMM.
Note: ***, **, and * represent mean significance at the 1%, 5%, and 10% levels, respectively. The values in parentheses correspond to the t statistic.
ID: innovation-driven; EC: energy consumption; ER: environmental regulation; FDI: foreign direct investment; GTFP: green total factor productivity; K/L: factor endowment structure; SE: resource endowment; SYS-GMM: system generalized moment method; QWS: financial agglomeration.
The estimation results in Table 5 show that the SE coefficient in equation (1) is significantly negative, and the interaction term coefficient between SE and ID in equation (3) is significantly negative, proving that the interaction between SE and ID may hinder the growth of GTFP. As shown in Table 5, SE and ID have a crowding-out effect. Therefore, Hypothesis 2 (H2) is proved.
Equation (2) shows that the QWS coefficient is positive. A strong explanation for this result is that the increase in regional QWS can provide a source of funds for the development of ID and promote the development of local ID levels. In equation (4), the coefficient of the interaction term between QWS and ID is significantly positive, indicating that the interaction between QWS and ID can promote the growth of GTFP. In layman's terms, ID relies on the funds provided by QWS, which can vigorously promote the development of local ID, and it has a significant effect on promoting GTFP. Therefore, formulating relevant policies and introducing the financial industry on demand can promote the development of local ID levels and accelerate the growth of regional GTFPs to a certain extent. Therefore, Hypothesis 3 (H3) and Hypothesis 4 (H4) are proven.
Finally, from the fact that the QWS coefficient in equation (6) is significantly negative and the coefficient of the interaction term between QWS and SE in equation (5) is significantly negative, it can be concluded that QWS has an inhibitory effect on SE, and the interaction between QWS and SE will hinder the growth of GTFP. The practical significance of the response is that the higher the regional SE is, the weaker the QWS capability and the fewer economic sources, which may lead to a low level of regional ID, and ID, as an important driving factor of GTFP, will slow the growth of regional GTFP. Hypothesis 5 (H5) is proved.
Discussion
SE and GTFP
This article found that SE is positively correlated with GTFP growth, which is different from the “resource curse” theory proposed by some existing studies. The reason for such speculation is that the study was conducted in different periods and regions. Hu et al. 4 selected 14 energy resource-rich provinces in China from 2001 to 2016, and Zhao et al. 9 selected cities in the Yellow River basin from 2005 to 2017. This article selected 31 provinces in mainland China from the years 2003 to 2020. Compared with other studies, the reference range is wider, and the time period is longer. This article enriches the existing SE theory and proves that there is a positive correlation between SE and GTFP in China.
At the same time, it cannot be ignored that because of the SE and GTFP positive correlation, when the region rich in resources relies on existing resources, it can promote the development of production and improve the level of GTFP. When the SE overexploitation, along with the regional SE content, is greatly reduced, it is unable to supply enough resources, which will hinder the growth of the regional GTFP. The results of this study have certain reference values for GTFP policy making in resource-rich regions similar to China.
SE, ID, and GTFP
This article confirms that there is a crowding-out effect between SE and ID, and the interaction between SE and ID will hinder the development of GTFP. This is because abundant natural SE faces smaller resource constraints and weaker resource efficiency in economic development and lacks motivation for technological innovation. 50 This is consistent with the findings of Wang and Cui 51 that rich natural resources crowd out manufacturing and reduce regional GTFP. In addition, SE is not conducive to the promotion of ID level, and the overall impact of their interaction on GTFP is also negative.
QWS, ID, and GTFP
Increasingly mature financial institutions can allocate financial resources to advanced enterprises, provide financial support to entrepreneurs who are most likely to achieve innovation, and promote technological progress. 52 From the perspective of financial structure, most scholars believe that market-oriented financial structure is more conducive to promoting technological innovation.53,54 Therefore, the point of view proposed in this article is that QWS promotes the ID level, and the interaction between the two can promote the development of GTFP, which has solid theoretical support. At the same time, the conclusions based on the China region make the results more reliable and powerful and broaden the scope of adaptation of this conclusion.
QWS, SE, and GTFP
As the main reason for the formation of industrial clusters, competition to a certain extent will promote the development of the local economy. Therefore, as a special industry, the degree of QWS plays a significant role in economic growth and in the growth industry of GTFP. 11 However, natural resources provide a continuous source of wealth, which reduces people's demand for transferring existing capital to the future, hinders the development of the regional financial industry, and reduces the degree of QWS, thus hindering the development of GTFP. 42 Based on the above analysis, the results of this article are as follows. There is a negative correlation between QWS and SE, and their interaction will hinder the growth of GTFP, which has been proven theoretically sufficient. The conclusion of this study is based on the data of 31 provinces in China from the years 2003 to 2020, with a large time span and wide scope, which confirms that this conclusion is still valid within China.
Conclusions and policy implications
Conclusions
Countries are actively seeking ways to balance ecological conservation and economic development, but there is no comprehensive discussion of the relationship between SE, ID, and QWS and GTFP, mostly focusing on the impact of a single factor on GTFP and ignoring the influence between factors. To fill in the research gap and expand the observation perspective, this study constructs a dynamic panel regression model according to panel data from 30 provinces in 2003–2020 and explores the relationship between the three variables of SE, ID, and QWS and their interaction effects on GTFP. The following conclusions were drawn.
Taken together, there is a crowding-out effect between SE and ID, and their interaction will restrain the growth of GTFP. QWS promotes ID, and the interaction between the two promotes the growth of GTFP. There is a restraining effect between SE and QWS, and their interaction will hinder the growth of GTFP. There is a positive correlation between SE and GTFP, indicating that there is a “resource gospel” in China's normal development state. If resources are overexploited, then the decrease in SE will also hinder the growth of GTFP accordingly. At the national level, GTFP has significant spatio–temporal heterogeneity and is greatly influenced by policies. The GTFP in the west is chronically underperforming. The development level of the green economy in the central and eastern regions is more stable than that in the western regions, but the overall performance is poor.
Policy implications
The conclusions of this study have specific reference significance for strategic planning in various countries. Based on the above conclusions, the following recommendations are proposed:
SE was positively correlated with GTFP, but this means that a reduction in SE can hinder the development of regional GTFP. Therefore, each region should pay attention to not relying too much on existing resources and should control, plan exploitation, rationally use existing resources, and promote the growth of GTFP. QWS can promote ID, and the interaction between the two can promote the growth of GTFP. Each region should optimize the relevant management system and encourage and support the diversified development of the financial industry to promote technological innovation, improve the level of regional ID, promote urban economic development, and improve GTFP. Regions with abundant SE tend to rely on resources and neglect the development of regional ID levels. Therefore, SE-rich areas should promote GTFP growth by effectively utilizing local resources within reasonable limits and focusing on promoting local innovation levels. Promoting QWS is essential for GTFP. Regions should encourage the development of the financial industry and improve relevant policies to avoid excessive consumption of existing resources by the financial industry, thus hindering the growth of GTFP.
Similar to most studies, this study has certain limitations. Regarding indicator selection and model construction, due to the difficulty in obtaining data on QWS and SE, it is challenging to select alternative variables. In addition, GTFP is also affected by various factors, such as the macro regional nature and micro building EC. The above factors that are difficult to quantify have not been examined in this article. This means that the investigators can further verify the effect of these factors on GTFP. Finally, the provinces of China have been chosen for this article, and subsequent researcher may consider going deeper to the city level, which can put forward more targeted suggestions on economic green development for cities.
Footnotes
Declaration of conflicting interests
The authors declared no potential conflicts of interest with respect to the research, authorship, and/or publication of this article.
Funding
The authors disclosed receipt of the following financial support for the research, authorship, and/or publication of this article: This work was supported by the National Natural Science Foundation of China, Scientific Research Startup Foundation for Introducing Talents of Sichuan Agricultural University, and Natural Science Foundation of Sichuan, China (grant numbers 72204178, 2122996022, and 2023NSFSC1053).
Statement of exclusive submission
This article has not been submitted elsewhere in identical or similar form, nor will it be during the first 3 months after its submission to the publisher.