
Abstract
The energy-saving effect of financial development is directly related to the formulation and implementation of financial policies. Considering the inertial characteristics of energy consumption, this study tested the energy-saving effect of financial development and examined its heterogeneity in terms of low-carbon cleaning and policy change. The results were as follows: First, when energy consumption was at the lower quantile, as consumption increased, the promoting impact of financial development on energy consumption decreased. When energy consumption was at the upper quantile, as consumption increased, the restraining impact of financial development on energy consumption increased. Second, an increase in the quantile level showed that financial development exerted an increasingly stronger influence on promoting clean energy consumption. When non-clean energy consumption was at the upper quantile, financial development exerted an increasingly strong inhibitory effect on non-clean energy consumption. Third, before green credit policy changed, the energy-saving effect of financial development was not widespread and obvious. After green credit policy changed, the restraining impact of financial development on energy consumption increased with the level of consumption. Fourth, after green credit policy changed, compared with the increase of financial development toward promoting clean energy consumption, the inhibitory effect of financial development on non-clean energy consumption significantly improved relative to the second case.
Introduction
Energy is crucial for a nation's development and prosperity because it is an essential component of production. 1 The world's energy consumption (EC) is anticipated to rise by approximately 50% between 2018 and 2050, according to the International Energy Outlook 2019. China will continue to be the world's largest energy consumer up to 2050, according to the BP World Energy Outlook 2020. The China Statistical Yearbook 2020 reveals that despite China's increasing demand for clean energy, non-clean energy still accounts for more than 70% of the country's total EC. If the growth rate of EC is not controlled, the pressure on China's energy supply will continue to increase, increasing the difficulty for sustainable economic growth. The global community has paid attention to the environmental issues brought on by rising EC in the context of global warming. Therefore, the management of China's rapid growth in EC is not only related to China's ecological civilization construction but also to China's international responsibility.
Economic growth is believed to be the key determinant of EC, while simultaneously being closely related to financial development (FD). Therefore, FD can directly promote economic growth, and can ultimately affect EC by using financial systems functions such as financial intermediaries and financial markets. Although most scholars focus on the relationship between economic growth, FD, EC, the impact of household characteristics, urbanization, and other factors on EC, studies on the multiple impacts of FD on EC are insufficient.2–5 First, FD can provide capital for energy-consuming enterprises to expand production through the financial resource agglomeration function, which is conducive to promoting EC. Second, FD can also finance the transformation of green technology enterprises through financial resource allocation function, which is conducive to inhibiting EC.6–8 Finally, the development of carbon financial markets can also increase the opportunity costs of carbon emissions, guide enterprises to upgrade industries, and ultimately promote low-carbon production.9–11 Therefore, it is imperative to understand whether FD conserves energy. As EC varies greatly between regions in China, the question can be extended to whether the impacts of FD on China's EC differ at different stages of EC. These problems are directly related to the formulation of China's differentiated policies on energy, finance, and industry, thus affecting the implementation effect of China's sustainable development strategy.
In terms of measuring FD indicators, three main methods are used, and academic consensus thereof has not been attained. First, FD indicators are measured by macroeconomic indicators, such as the financial-related ratio and the ratio of money stock to gross domestic product.12,13 However, this method is not suitable for China's national conditions as China's financial market and economic development requires improvement. Second, from the perspective of different financial markets, FD can be measured by the ratio of bank credit and security financing to gross domestic product, respectively.14–16 As the method divides the financial markets, it does not highlight the total financial support of the non-financial enterprise from the financial sector, resulting in unreliable results. Third, some scholars first establish a multi-index FD evaluation system and then create a FD index by employing statistical methods.17,18 Due to the arbitrariness of index selection and the error of statistical method, the FD measured through this method may be distorted. Currently, the scale of social financing compiled by the People's Bank of China (PBC) according to the financial overview and the Monetary and Financial Accounting framework of the International Monetary Fund is more suitable for measuring FD.
In terms of mechanisms, FD primarily influences EC through the channels listed below. First, FD promotes people to take out loans at more affordable rates and in more accessible ways, which encourages people to buy energy-intensive goods such as cars and home appliances. The manufacturing and usage of these products will increase EC, referred to as the consumption effect. 15 Second, if enterprises can easily obtain debt and equity financing, they will invest more capital and liquid assets in business, which increases the energy demand in the enterprise production process, referred to as the business effect. 11 Third, FD can promote economic growth by stimulating public investment, increasing household savings, and optimizing greater capital allocation, while a large amount of energy ought to be consumed as power support during economic growth, namely, economic growth effect. 19 Fourth, FD can attract foreign direct investment. The technological spillover brought about by foreign investment improves the energy efficiency of the host countries, thus reducing the EC, referred to as the technological progress effect. 20 Finally, FD promotes the agglomeration of capital in financial intermediaries, guides the flow of capital reasonably through financial intermediaries, reduces financial friction, improves the efficiency of capital allocation, and adjusts the industrial structure, which can optimize the EC structure, referred to as the upgrading effect of industrial structure. 21
In terms of empirical research, there are sufficient studies on the linear, causal, and cointegration relationships between EC and FD. Among them, some studies argue that FD promotes EC. According to Komal and Abbas, 22 Pakistan's EC is positively impacted by FD through economic expansion. According to Anton and Nucu, 23 three aspects of FD can affect the proportion of renewable EC in 28 EU countries: Capital market, bond market, and banking sector. Other studies suggest that EC has decreased as a result of financial growth. EC in economies with transition is influenced in various ways by FD. For example, EC decreased as stock markets developed in China and Poland; with the exception of Georgia, EC has decreased as a result of financial liberalization. 16 Chiu and Lee 11 reported that FD can reduce national EC in an environment of stable national risk. Lahiani et al. 24 revealed that short-term FD can have a significant impact on the consumption of renewable energy in the United States, facilitating carbon neutrality. The nonlinear effect of FD on EC has also been the subject of research in recent years by a number of academics. Mahalik et al. 10 tested the existence of an environmental Kuznets curve relationship between FD and EC by using the square number of FD as an explanatory variable in the driving factor model of EC. Wang and Gong 25 argued that there was an obvious threshold effect between FD and EC in China. Uddin et al. 26 argued that the degree to which FD inhibited EC in EU countries was affected by the threshold of technological innovations. The literature shows varying conclusions on whether FD exerts an energy-saving effect; in addition, in different stages of EC, the heterogeneous nonlinear impact of FD on EC is poorly studied.
The existing literature reveals a connection between EC and FD, according to existing research; however, it also has the following limitations: First, in the selection of indicators, most studies consider economic growth and urbanization as the driving factors affecting EC, while ignoring the role of FD factors that only possess marginal connections with EC on the surface. Although some studies have explored the effects of FD on EC, they often consider FD from the perspectives of macro economy, financial market, and comprehensive indicators. It is difficult to highlight the total financial support that the financial sector provides to the economic sector using these measurement methods. Second, regarding the research content, the linear, causal, cointegration, and threshold relationships between FD and EC have received the most attention in existing literature, while ignoring the regional divisions of China's EC. It is impossible to accurately describe the characteristics of the distribution of the effects of FD and urbanization on EC in various regions. Few studies have examined the nonlinear heterogeneity of FD and EC at various stages of consumption. Finally, in terms of estimation methods, previous nonlinear studies mainly used static models and did not consider EC lag parameters in the models, ignoring the inertial characteristics of EC. Although the EC lag term has been included in some nonlinear studies, the estimation is still conducted according to the static model method, causing errors in the model estimation.
The following are the potential academic contributions of this study: First, in terms of the selection of indicators, FD is included in the EC driving factor model together with factors such as urbanization and economic growth. Because the social financing scale measures the economic sector more comprehensively from the perspectives of financial sector and inflation in the process of FD, this study used the ratio of social financing scale increment to gross domestic product to measure FD. Second, in terms of research content, it examines not only the characteristics of the quantile impact of FD on EC at various stages of EC but also the heterogeneity of the quantile influence of FD on EC from the perspective of low-carbon cleaning and policy change. Finally, in terms of an estimation method, the EC lag term was added into the static panel quantile regression model, and the dynamic panel quantile regression model (DPQM) was estimated using the quantile regression dynamic panel data instrumental variables method (QRPIV) with an individual fixed effect, which reduced the model's estimation error.
Methodology and data
Establishment of the DPQM
The concept of quantile regression was initially proposed as a statistical method that is effective in describing the shape and error range of the conditional distribution of explanatory variables toward the explained variables. 27 Quantile regression can provide a more comprehensive description of the distribution's tail characteristics when explanatory variables exert distinct effects on the distinct distributions of explained variables. Moreover, ordinary least squares (OLSs) regression estimation is less reliable than quantile regression estimation. 28 In addition, the panel quantile regression model, which combines quantile regression with panel data model, can better analyze the relationship between variables on the basis of controlling individual heterogeneity.29,30 Because EC, like food consumption, has inertial characteristics, the panel quantile regression model must include the inertial characteristics of EC as explanatory variables.31,32 However, the DPQM was formed after the EC with one stage lag was included in the panel quantile regression model as an explanatory variable, which exhibited endogeneity. Galvao 33 proposed the QRPIV with an individual fixed effect as a means of resolving the DPQM's endogeneity issue. This method introduces instrumental variables, uses trial algorithm to transpose lag variables to construct new dependent variables, and introduces instrumental variables into regression models to solve the bias of model parameter estimation caused by endogeneity.
The application of DPQM in the EC discipline is still immature. The main reasons for investigating the varied effects of FD on EC at various EC stages by using the DPQM are as follows: First, the total EC in different regions in China varies significantly. Therefore, it is difficult to describe the characteristics of EC in different regions through simple regression. However, the quantile regression model can be used to divide EC into different stages and describe the heterogeneity of EC in different regions of China more accurately. Second, traditional assumptions are required for the mean regression; however, in reality, it is difficult to satisfy the requirements of EC, urbanization, FD, and other indicators. If forced to use, it will cause a large estimation error, and quantile regression does not require the population to comply with normal distribution and other conditions. Finally, because of the residents’ income level, family structure, and because enterprise production scale possesses certain stability, EC is likely to exhibit inertial characteristics. Meanwhile, explanatory variables may also be endogenous. The dynamic model can effectively identify the inertial characteristics of EC and solve the endogeneity problem.
For the case where the independent variable includes the dependent variable lag term, we built a generic dynamic panel model with individual fixed effects, given as follows:


For wide-panel data, with relatively few observed values for each individual, it is difficult to accurately estimate individual effects at different quantiles. Similar to OLS regression, quantile regression is biased to estimate individual fixed effects in models with lag terms related to the explained variables.33,35,36 According to the practices of Chernozhukov and Hansen,
37
wit = (w1it, w2it,…, wkit)′ was used as the appropriate instrumental variable, and QRPIV with individual fixed effect was used to estimate the DPQM with one lag period, and subsequently, the estimates of the parameters were obtained.
The specific calculation formulas are shown in Formulas (4), (5), and (6):


In the first step, we define the objective function as shown in Formula (7):

In the third step, we identified the value of
In the fourth step, we substituted

Variable selection
According to Dietz and Rosa,
38
the basic factors affecting the environment (I) are population size (P), asset (A), and technological progress (T). The advantage of this model is that the basic factors can be extended according to different research purposes. Its basic form is shown as follows:

Because of the stability of equipment and capacity of enterprises, household structure, and income level of residents, EC is characterized by inertia. Early EC behavior exerts a positive impact on current EC.
39
Due to urbanization, investment in infrastructure construction has increased, and more rural residents have entered urban life, thus increasing EC.
40
However, when there is some degree of urbanization, the intensive effect and technological progress effect brought by urbanization will also reduce EC.
41
Manufacturing dominates the secondary industry, with high EC per unit of output, whereas services such as finance and commerce dominate the tertiary industry, with low EC per unit of output. Therefore, optimizing the industrial structure and increasing the output value ratio of the tertiary industry promotes energy conservation.
42
In theory, foreign direct investment will not only help domestic enterprises to introduce foreign advanced technology and promote their energy conservation but also help to strengthen the market competition between domestic and foreign enterprises and force domestic enterprises to improve their energy use efficiency.
43
However, the pollution paradise hypothesis is demonstrated by foreign direct investment, which may cause more EC and environmental pollution.
44
Consequently, this study expanded the Formula (9), given by:


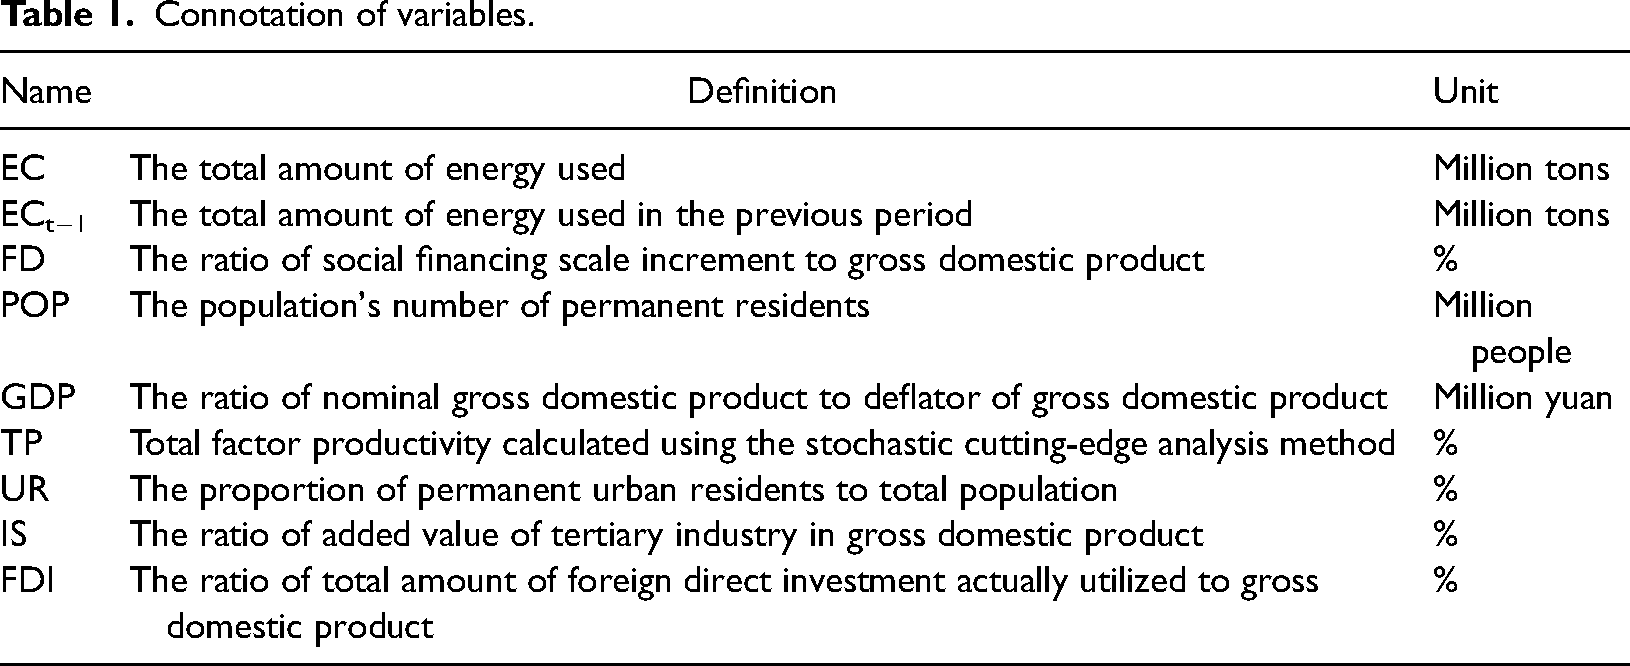
Connotation of variables.
Data sources
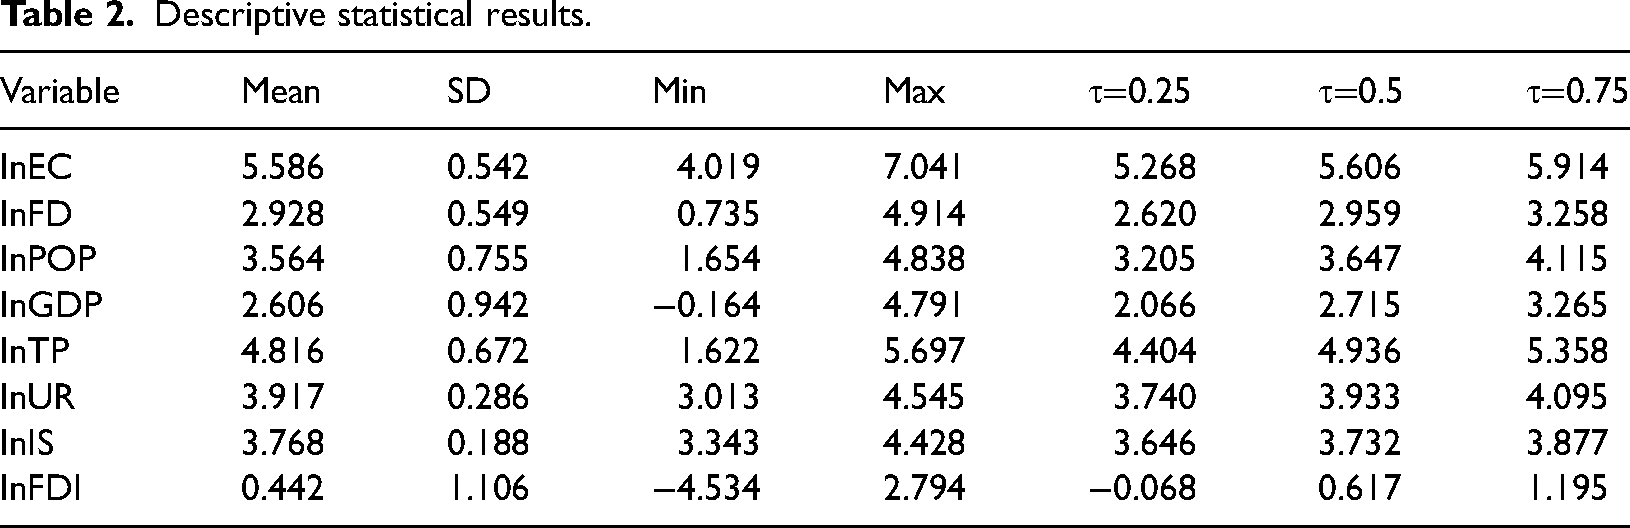
This study, which excluded Tibet, Hong Kong, Macao, and Taiwan, used 30 provinces in mainland China as its research subjects, and the research period was from 2001 to 2020. The China Energy Statistics Yearbook provided the data on total EC during the study period. The website of the PBC provided data on social financing scale in each region. As the PBC only published the regional social financing scale data for 2013 and after, the regional social financing scale before 2013 was substituted by the financing volume, which was derived from the Report on China's Regional Financial Operation in 2012. It should be noted here that the statistical caliber of regional financing volume includes loans, bonds, and stocks, and there is only a marginal difference in the statistical caliber of regional social financing scale. The number of permanent resident population, the number of permanent urban resident population, nominal gross domestic product, gross domestic product deflator, added value of the tertiary industry, and the number of employees were derived from the China Statistical Yearbook for the study period. The statistics yearbooks of each province were used to compile the total foreign direct investment actually utilized. Among them, the gross domestic product deflator was based on 2001, and the measurement unit that actually used the total foreign direct investment was converted into RMB using the average exchange rate of the current year. We logarithmized the original variables and performed descriptive statistical tests because empirical analysis was required. Table 2 is a list of the outcomes.
Descriptive statistical results.
Results and discussion
Dynamic quantile impact of lnFD on lnEC
To comprehensively reflect the change in the dynamic impact of lnFD on lnEC under the different distributions of lnEC, this study selected 0.1–0.9 quantiles to conduct the dynamic quantile regression, and the results obtained are listed in Table 3. To intuitively reflect the differential distribution characteristics of the impact of different variables on EC, this study also drew the impact trend chart of different variables on lnEC under nine quantiles, as shown in Figure 1. Table 3 shows that the elastic coefficients of lnFD were significantly positive from 0.1 to 0.6 quantiles. The elasticity coefficients of lnFD were significantly negative in the range of 0.7–0.9 quantiles. This indicates that when lnEC is at the lower quantiles, lnFD can promote it. When lnEC is at the upper quantiles, lnFD can restrain it. Figure 1 shows that the impact curve of lnFD on lnEC generally exhibited a continuous decreasing trend, which indicates that when lnEC is at the lower quantiles, the promotional effect of lnFD on lnEC becomes weaker with the increasing quantile. However, when lnEC is at the upper quantiles, with the increase in quantile, lnFD exerts an increasingly stronger restraining effect on lnEC.
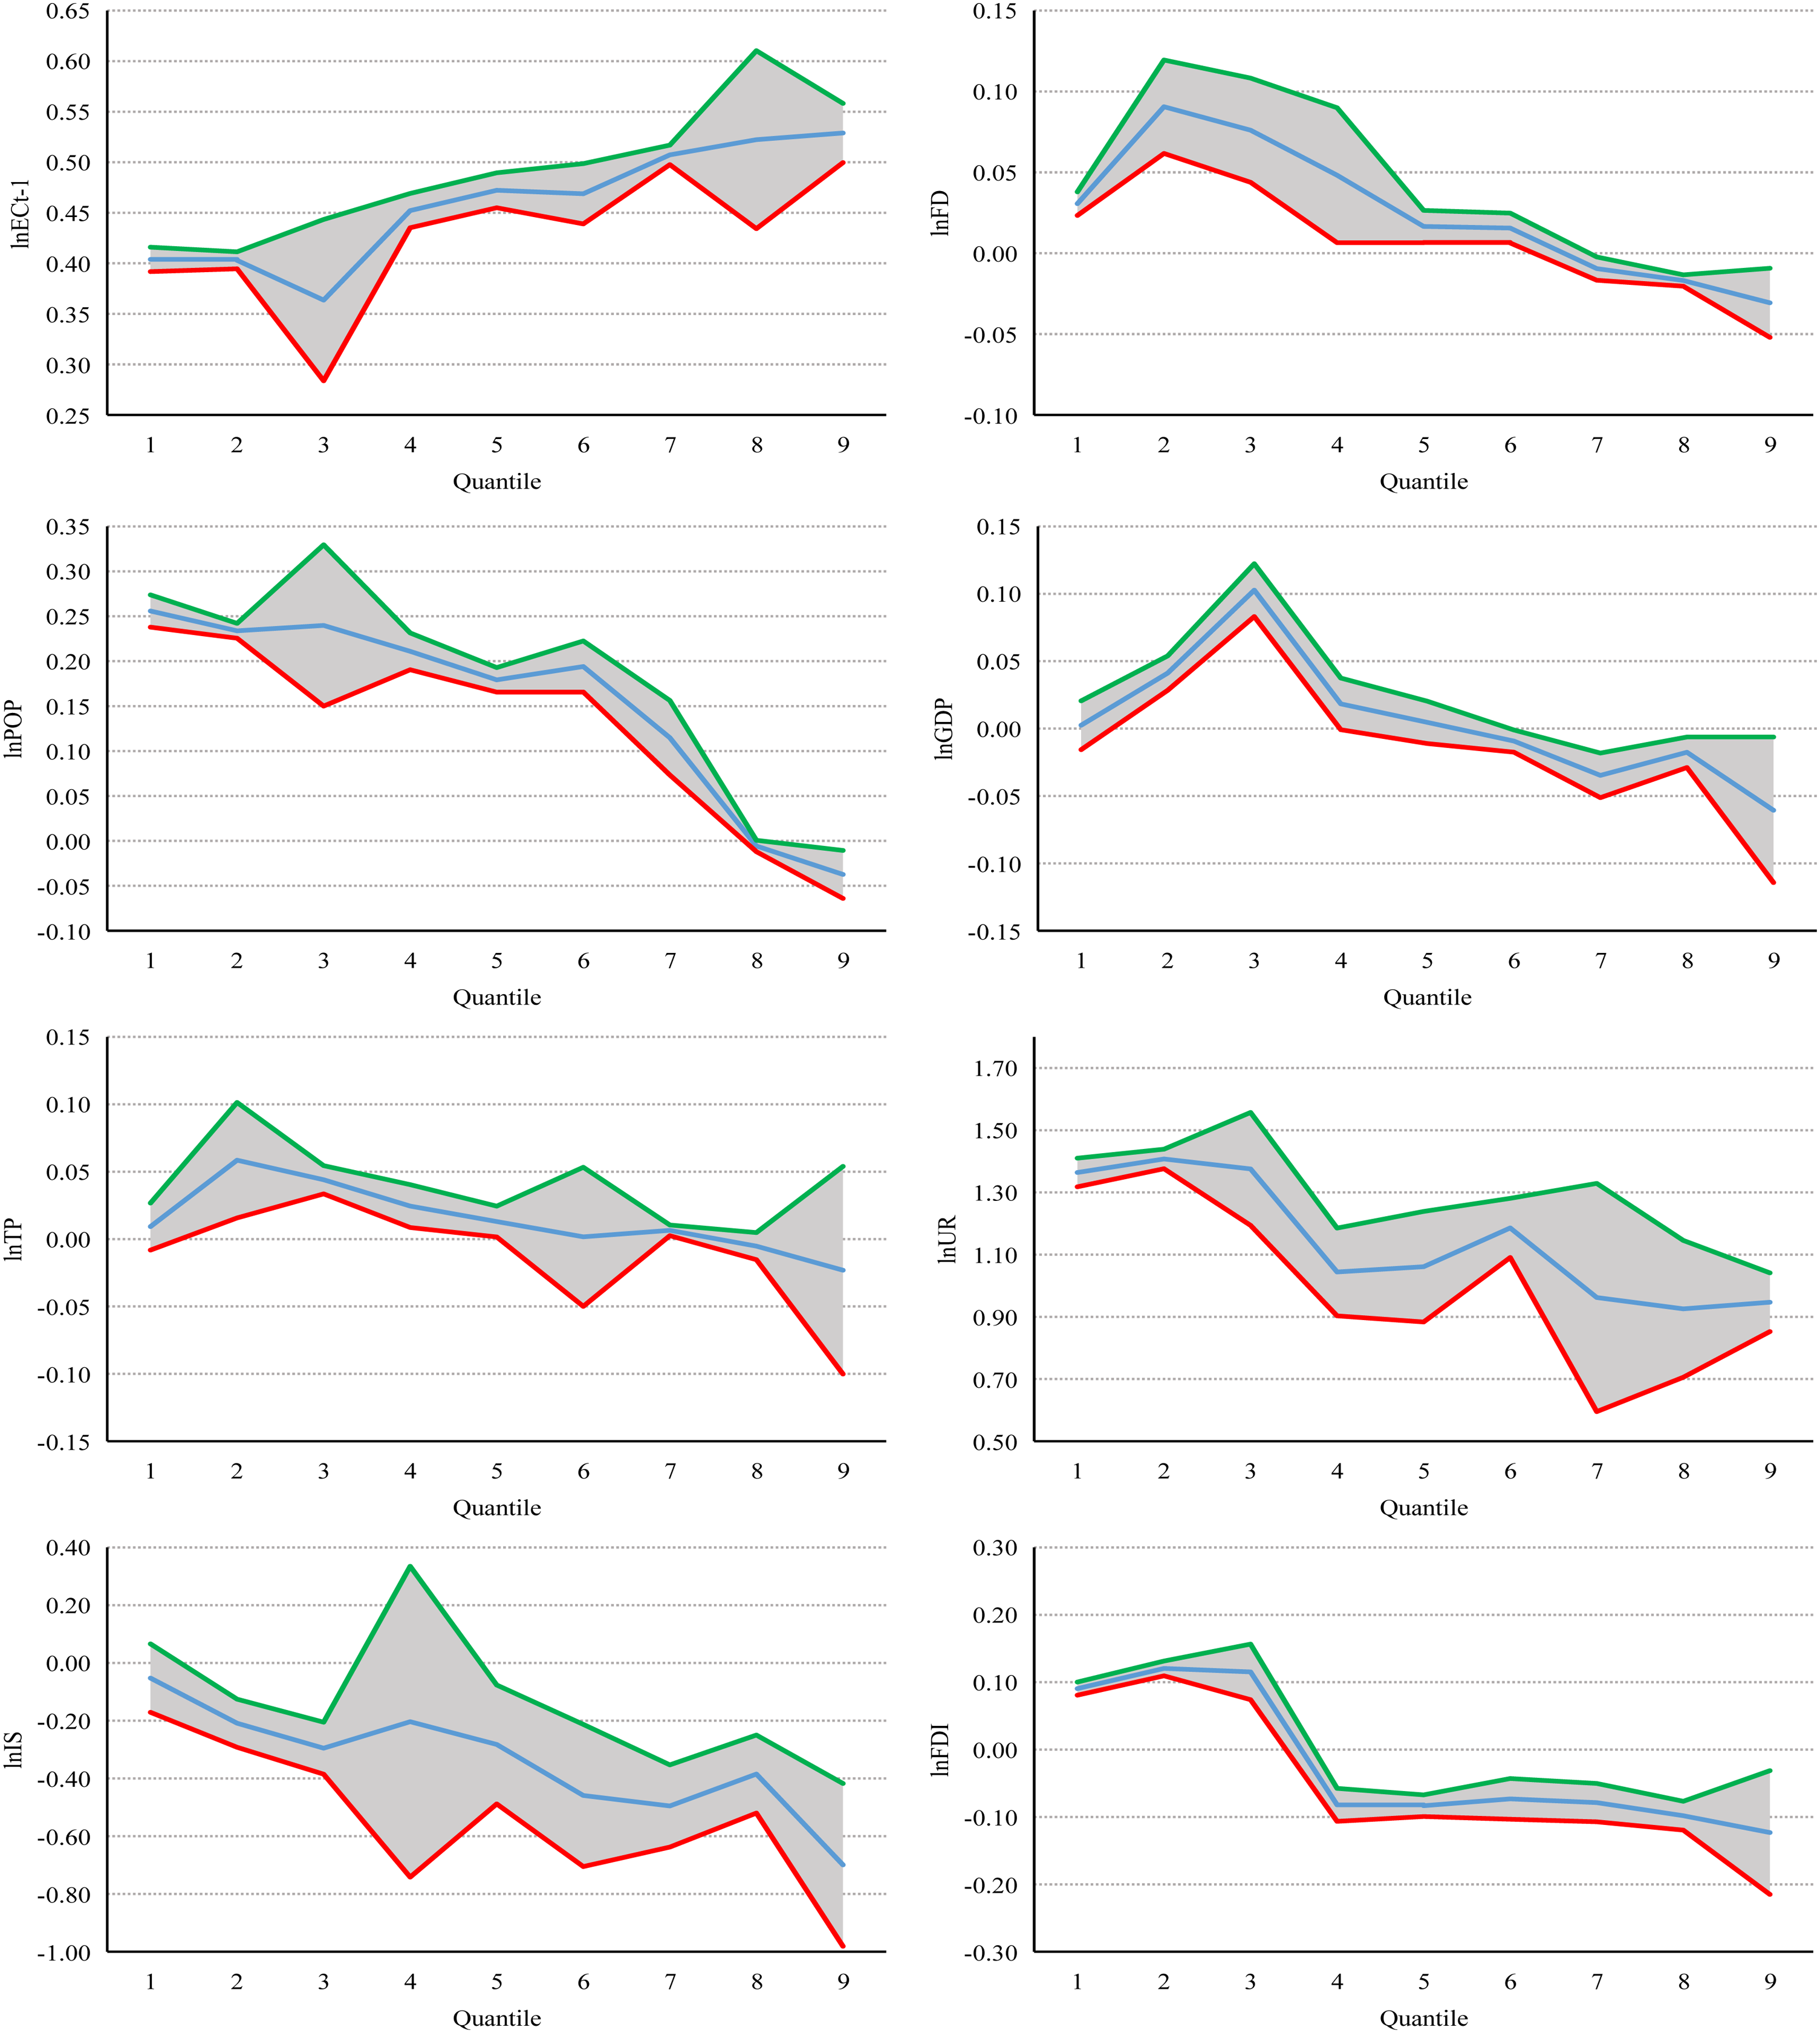
The impact trend chart of different variables on lnEC under different quantiles.
Dynamic quantile regression results of
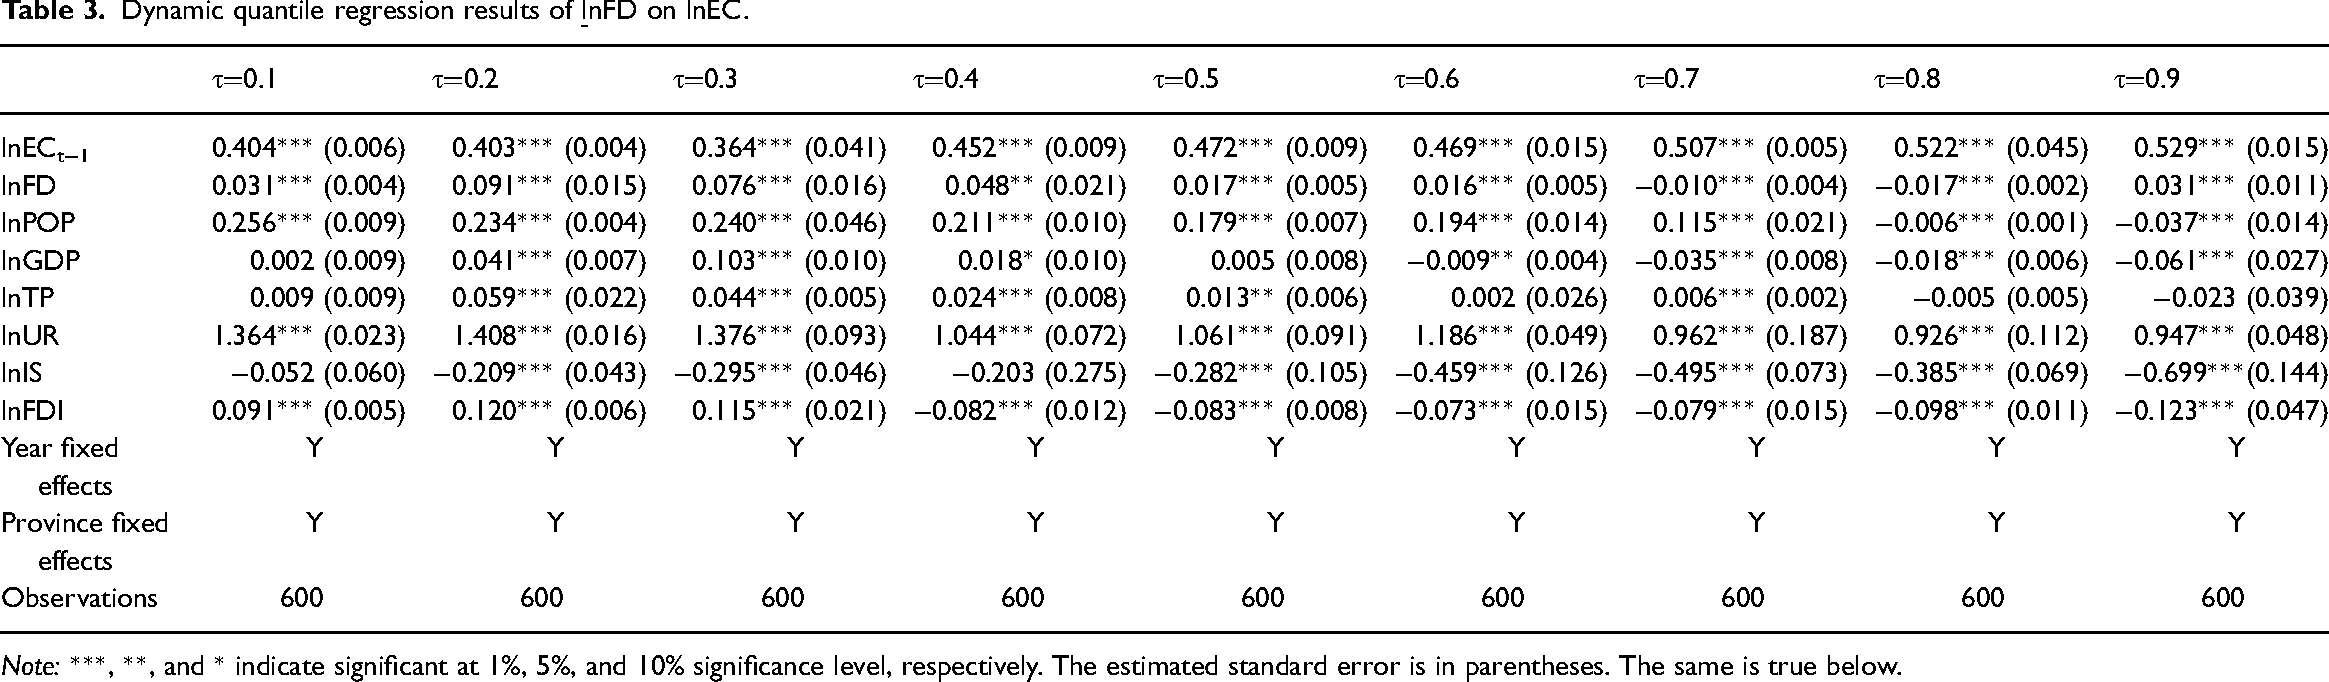
Note: ***, **, and * indicate significant at 1%, 5%, and 10% significance level, respectively. The estimated standard error is in parentheses. The same is true below.
When EC was at the lower quantiles, the energy supply pressure and environmental governance was small and the economic growth mode was extensive. Economic growth is achieved at the expense of extensive EC. Finance is the blood of economy and serves economic development. When FD is aimed at promoting extensive economic growth, financial resources mainly flow to the traditional manufacturing and construction sectors, resulting in large-scale EC that does not consider the ecological environment. 45 When EC was in the higher quartile, the pressure on energy supply increased and energy security became fragile. Furthermore, the severity of environmental pollution increased, and environmental management becomes imperative. Economic growth pattern changes to high-quality intensive and connotative. At this time, economic growth is no longer driven mainly by the expansion of energy and other factors of production, but by optimizing the ratio between the factors of production and technology, using advanced green technology and other means in combination with industry characteristics.46,47 To achieve high-quality economic growth, under the correct guidance of credit policy and direct financing policy, financial resources are bound to be tilted toward new industries, modern service industries, and other technology-based and energy-efficient industries. This will help promote technological progress, increase green total factor productivity, and ultimately achieve financial energy conservation. FD is a “double-edged sword,” which has an obvious differentiated impact on EC. If financial resources flow into factor-driven sectors to maximize economic growth, it will have adverse consequences on resources and the environment. If financial resources flow into technology-driven or factor and technology-driven sectors, it will have the effect of energy saving and green growth.
Table 3 and Figure 1 show that at different quantiles, the elastic coefficient of lnECt−1 is significantly positive, and an upward trend can be observed in the impact curve of EC inertia. At the lower quantiles, the elastic coefficients of lnPOP and lnGDP were significantly positive, however, significantly negative at the upper quantiles. The elastic coefficients of lnTP and lnUR were mostly significantly positive, and the impact curves of technological progress, urbanization, population, and economic growth showed a downward trend. At different quantiles, the elastic coefficient of lnSTR was most significantly negative. The elastic coefficient of lnFDI was significantly positive from 0.1 to 0.3 quantiles, and significantly negative from 0.4 to 0.9 quantiles. In conclusion, EC inertia and urbanization can promote EC, whereas industrial structure upgrading can inhibit EC. At the lower quantiles, population, economic growth, and foreign direct investment can promote EC, whereas at the higher quantiles, these factors can restrain EC.
Urbanization has a dual effect on EC. On the one hand, with the promotion of urbanization, the economy can develop, and the living standard of residents can improve. This will stimulate the demand for EC by enterprises and residents.2,48 On the other hand, when urbanization develops to a certain level, the industrial structure distribution and resource allocation become more reasonable; technology-driven production replaces factor-driven production as the new economic growth point, and the intensive effect of urbanization gradually manifests. 49 Therefore, urbanization and EC theoretically possess an inverted U shape.50,51 However, in reality, when EC is at the lower quantiles, the traditional extensive urbanization process results in a rapid increase in EC despite the significant marginal EC cost. When EC is in the higher quartile, although people realize the harm caused by past crude urbanization, we cannot achieve the purpose of controlling EC by suppressing the demand for energy from enterprises and residents. In the face of the scale effect of higher urbanized EC, the government has also implemented certain environmental regulation measures, the industrial structure has been gradually advanced, technological innovation activities have been promoted, and the residents’ awareness of energy conservation has been enhanced. Although the pressure on EC growth has eased, total EC remains high.52,53 Currently, one of the most important objectives of new urbanization in these regions is to cross the inflection point of the inverted U-shaped curve for regions with EC at the upper quantiles, where the impact of urbanization on EC is currently close to that point. The initial task for regions with lower EC quantiles is to further decelerate EC growth.
When EC is in the low quartile, the purpose of EC is simply to stimulate economic growth, with little consideration given to energy efficiency in economic development. In contrast, when EC is in the higher quartile, ecological conservation becomes a primary prerogative. In addition, the pressure on energy supply is highlighted, in that EC ought to consider sustainable economic development by developing and using more energy-efficient and clean energy sources. The choice between increasing production capacity and conserving energy will ultimately determine how technological advancements ultimately affect EC. In general, technological progress has served economic growth; however, with the increasing EC, technological progress has become more inclined toward energy conservation, and the role of technological progress in promoting EC has weakened. Industrial structure upgrading optimizes resource allocation and realizes the virtuous cycle of economy, population, environment, and resources. When EC is at the lower quantiles, the technological innovation brought by foreign direct investment is mainly production-oriented. When EC is at the upper quantiles, under the concept of green development, the technological innovation brought through foreign direct investment gradually shifts to ecological-oriented innovation, and the comprehensive impact of foreign direct investment changes from promotion to suppression. 54
Heterogeneity test from the perspective of cleanliness
This study examined the heterogeneity of the dynamic quantile impact of FD on EC from a cleanliness perspective, to study the differential distribution characteristics of the impact of FD on different types of EC. This study also divided energy into clean energy and non-clean energy. Clean energy in a narrow sense refers to renewable zero-carbon energy that is mostly used in the form of electricity. Natural gas and low-carbon energy, such as electricity produced from fossil fuels and treated with clean technology, are also considered clean energy from a wide perspective. Clean energy in a broad sense also includes natural gas and low-carbon energy such as electricity from fossil energy sources that have been transformed by clean technology treatment. As zero-carbon EC data at the interprovincial level were difficult to obtain, clean EC (CEC) in this study includes the use of natural gas and electricity, whereas non-clean EC (NEC) includes EC beyond clean energy.55,56 Table 4 shows the empirical results of the dynamic quantile models of FD on CEC and NEC. Figure 2 illustrates the trend chart of the dynamic quantile impact coefficient of FD on CEC and NEC. In Table 4 and Figure 2, the value of the elasticity coefficient corresponding to lnFDc and lnFDd represents the impact of FD on CEC and NEC, respectively.
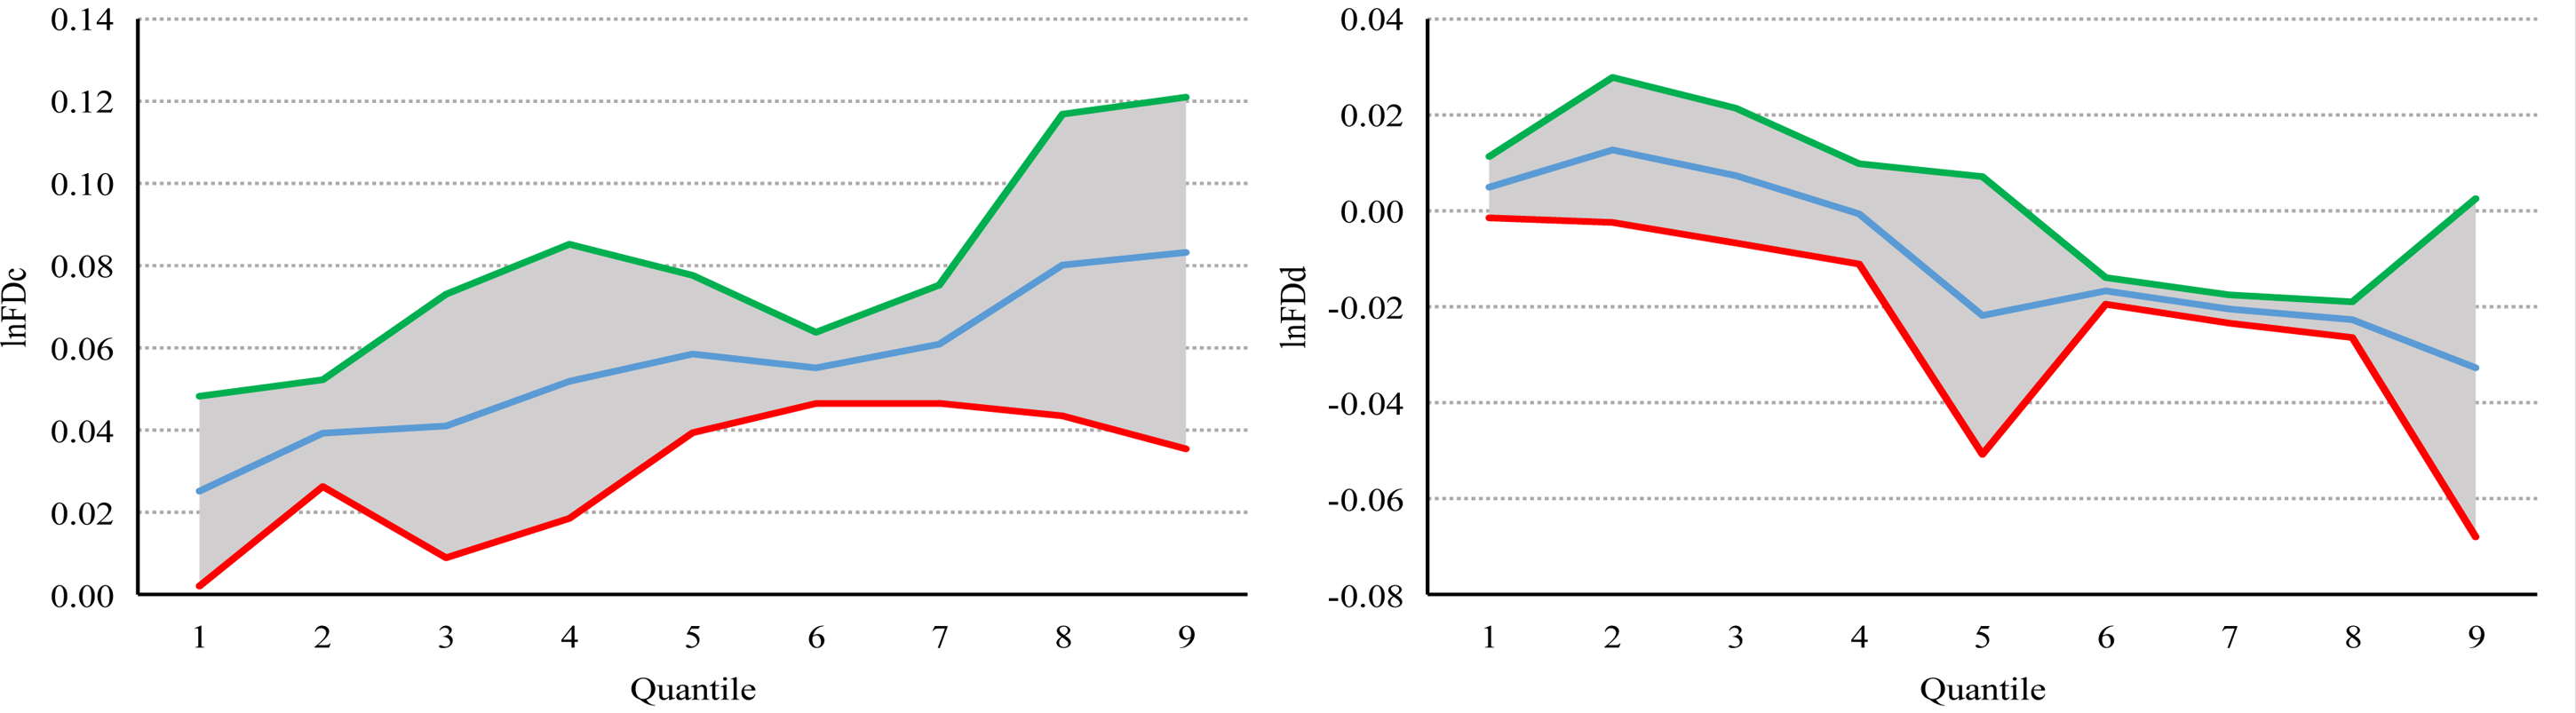
Trend chart of the dynamic quantile impact from the perspective of cleanliness.
Dynamic quantile regression results from the perspective of cleanliness.
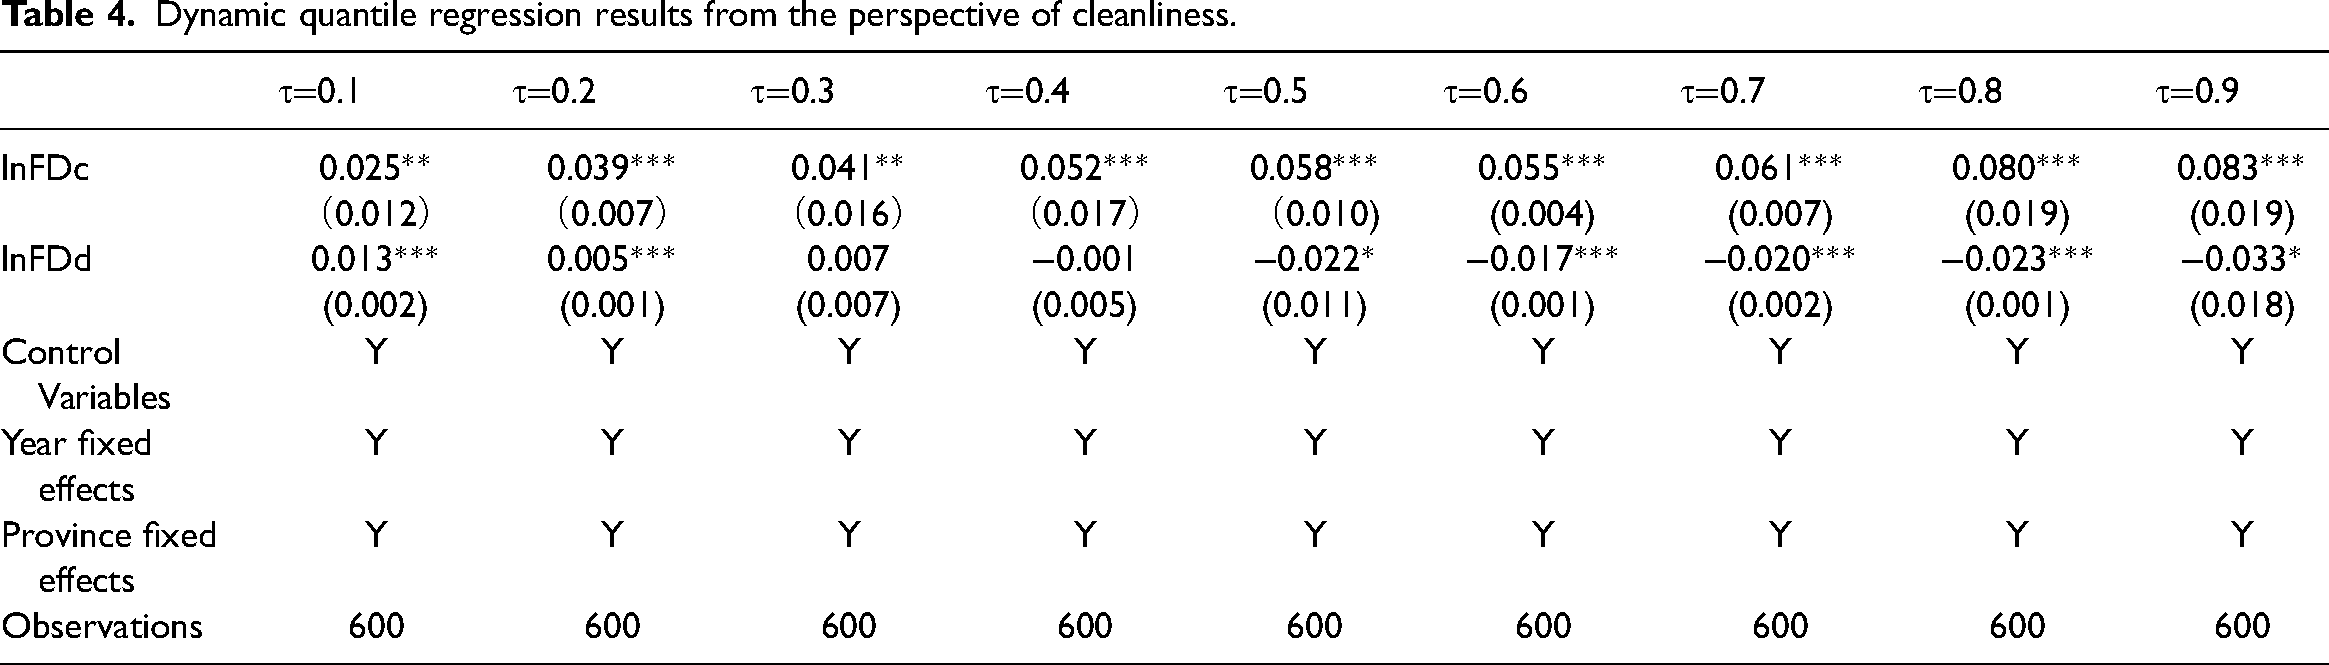
For CEC, the elasticity coefficients of lnFDc were significantly positive at different quartiles, and the curve of the coefficients of lnFDc showed an upward trend. This indicates that FD promotes CEC at different stages of CEC. With increasing quantile levels, FD increasingly promotes CEC. FD not only helps consumers buy new energy vehicles and household appliances such as gas equipment but also helps enterprises eliminate polluting production lines, thus stimulating CEC; whereas rapid FD provides an environment for the smooth promotion of green finance, which is conducive to the clean production of fossil energy and the large-scale consumption of clean energy. Compared with low CEC areas, high CEC areas upgrade industrial structure at a faster pace, show strong green bias in technological progress, exhibit a higher degree of green transformation in economic growth, and more financial resources flow to the production, circulation, and consumption of clean energy.
For NEC, the elasticity coefficients of lnFDd were significantly positive at 0.1 and 0.2 quantiles. At 0.3 and 0.4 quantiles, the elasticity coefficients of lnFDd were not significantly negative. At other quantiles, the elasticity coefficients of lnFDd were significantly negative. The curve of the coefficients of lnFDd showed a downward trend. This indicates that when NEC is in the low quartile, FD can promote NEC; however, the promotion effect weakens. When NEC is in the high quartile, FD can restrain NEC and the inhibitory effect is stronger. In regions with low NEC, although upgrades in the industrial structure have begun and technological innovation activities have improved, the upgrade in the industrial structure has been slow, and there has been a stronger output preference for technological progress. Economic activities are also less likely to consider green outputs under the pressure of economic growth.57,58 Therefore, at this time, the channels of FD such as industrial structure upgrading play a smaller role in reducing non-clean energy than its consumption. In regions with high NEC, the necessity of energy conservation and environmental protection is highlighted. Under the guidance of green development concept and green financial policies, FD can limit NEC.
Heterogeneity test from the perspective of policy change
In 2012, to comprehensively consider the role of financial institutions in preventing risks of environmental deterioration, the Green Credit Guidelines (GCG) was issued in China. Compared with previous green credit policies, the GCG mandate that financial institutions restrict credit to industries that do not adhere to green development policies and increase credit support for green industries. This indicates to the market that the central government will use financial means to implement green development. The promulgation of the GCG is a significant incentive for businesses to undergo a green transformation.59,60 Therefore, to investigate the heterogeneity before and after the policy change, this study considered the introduction time of the GCG as the dividing line and divided the research time interval into 2001–2012 and 2013–2020. Table 5 listed the results of the heterogeneity test from the perspective of policy change. Furthermore, Figure 3 shows the trend chart of the dynamic quantile impact coefficient before and after the policy change. In Table 5 and Figure 3, the elastic coefficient values corresponding to lnFDb and lnFDa, respectively, represent the impact of lnFD on lnEC before and after the policy change.
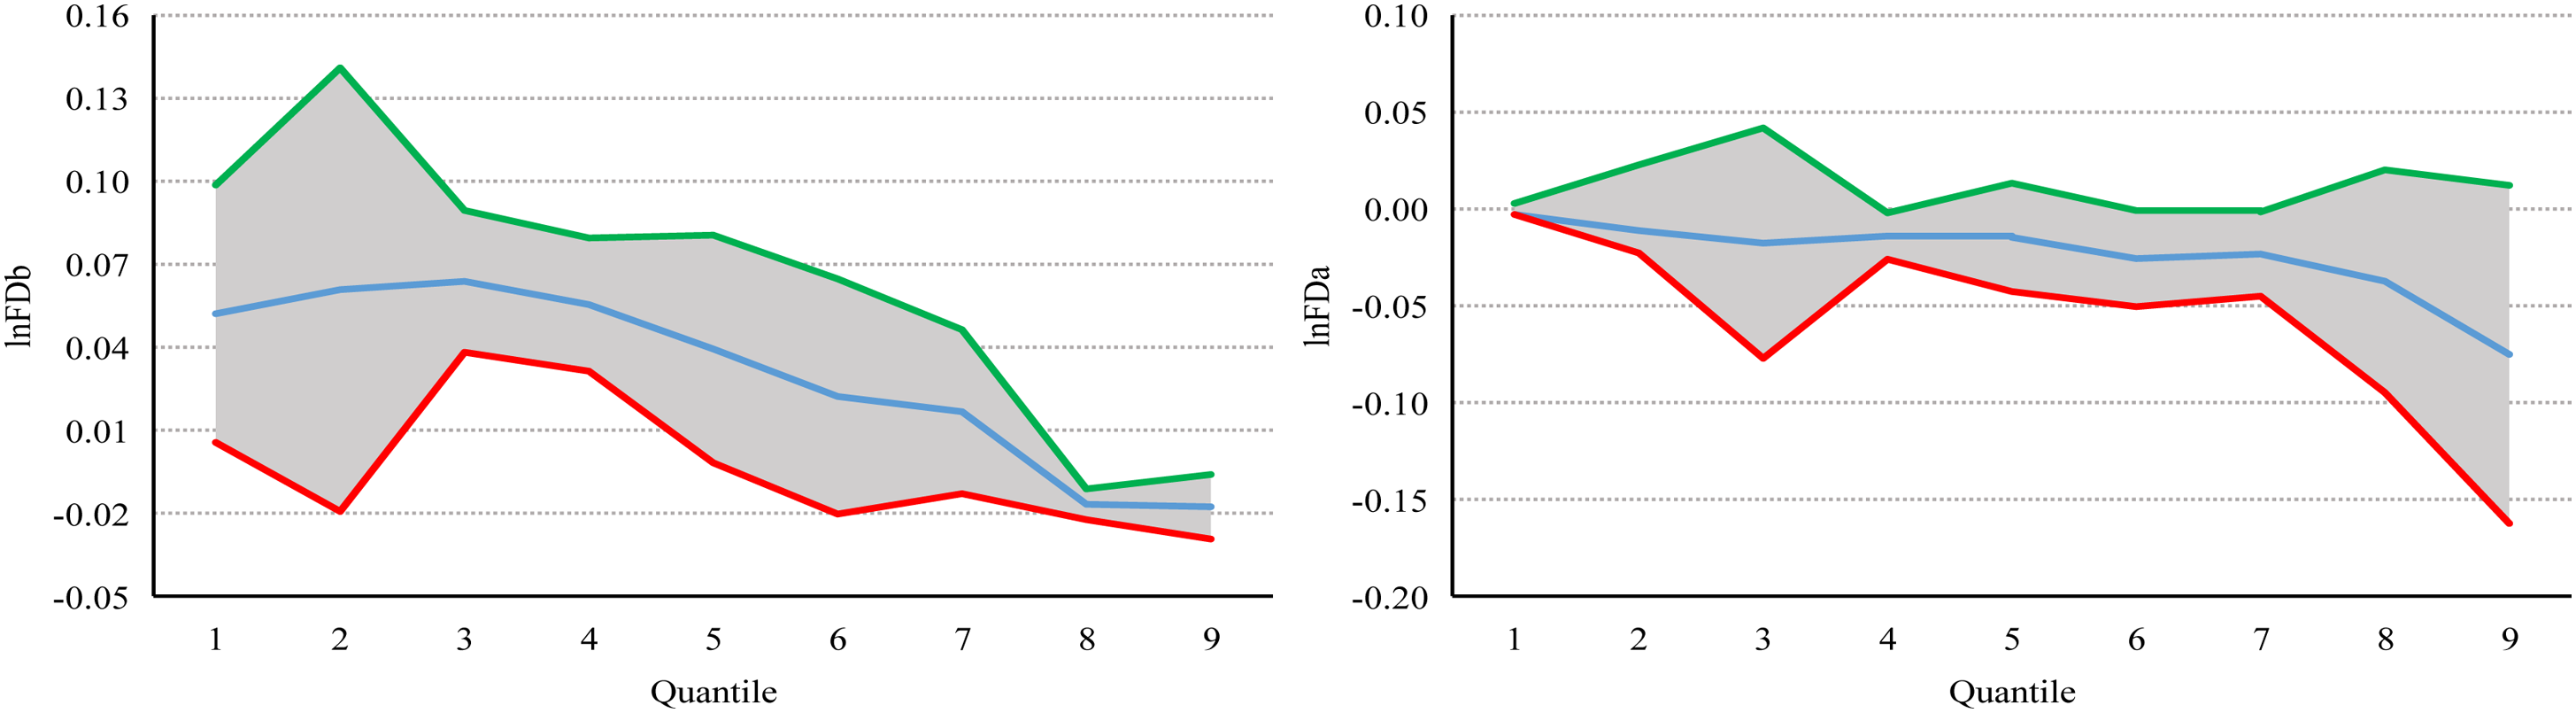
Trend chart of the dynamic quantile impact from the perspective of policy change.
Dynamic quantile regression results from the perspective of policy change.
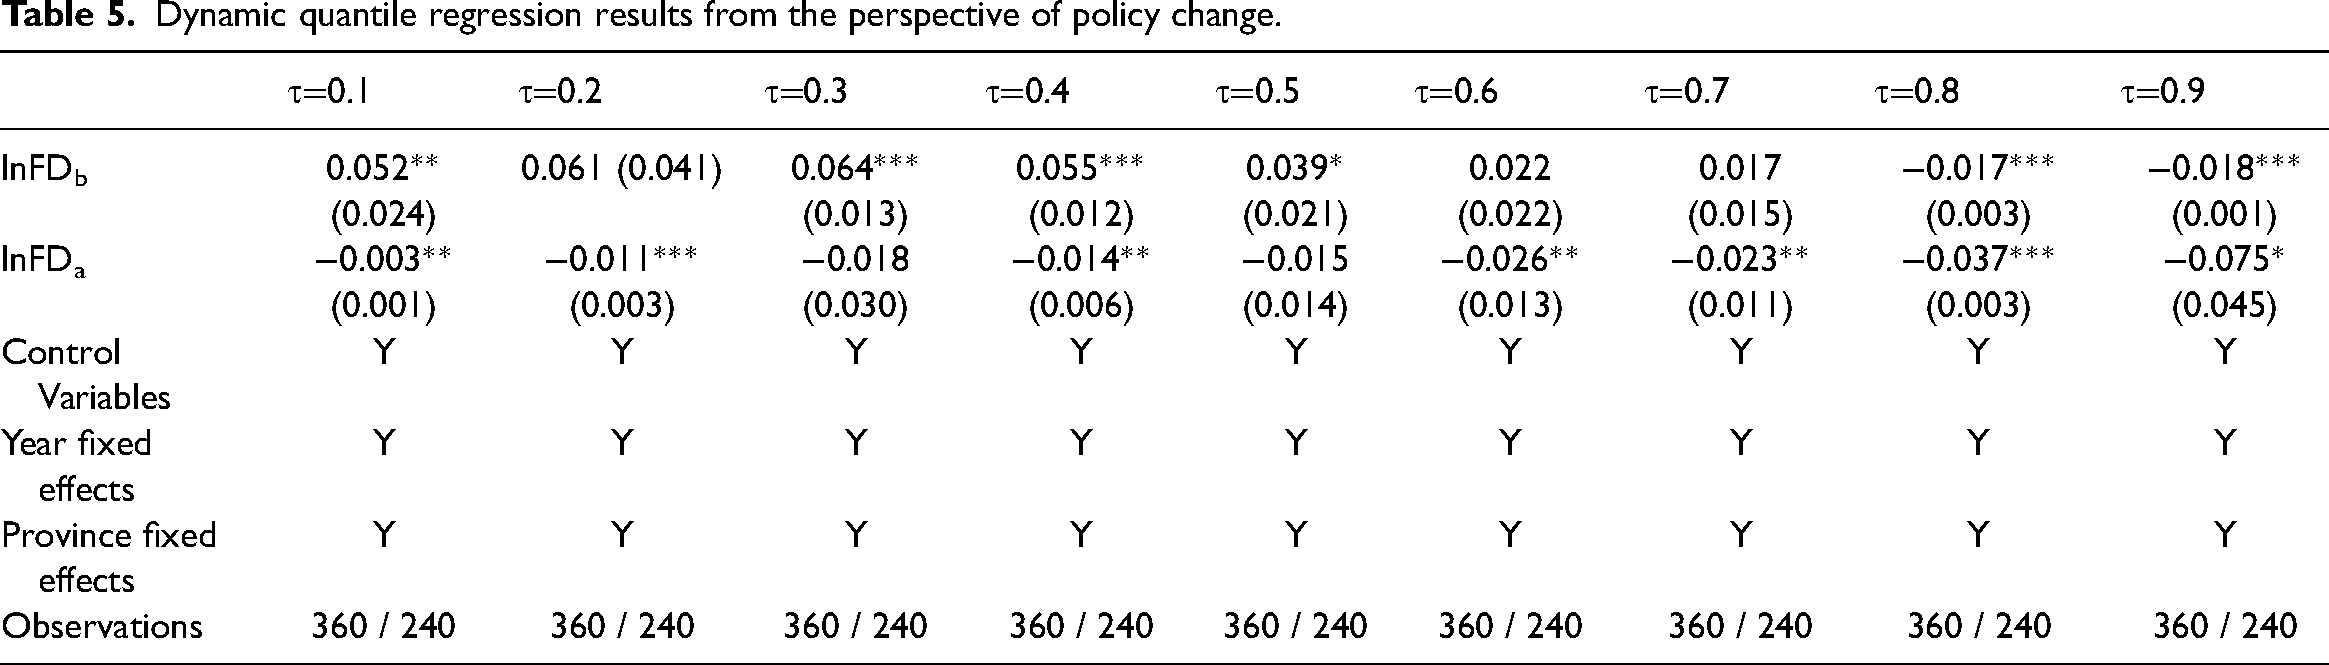
Before the policy change, when EC was between 0.1 and 0.5 quantiles, the elastic coefficient of lnFD was significantly positive. When EC was at 0.6–0.7 quantiles, the elastic coefficient of lnFD was not significant. When EC was at 0.8 and 0.9 quantiles, the elastic coefficient of lnFD was significantly negative. In general, with an increase in the quantile, the impact curve of lnFD on lnEC showed a continuous decreasing trend. This indicated that before the policy change, FD promoted EC when it was at the lower quantiles and became weaker as the quantile increased. However, when it was at the upper quantiles, FD played a diminishing role in EC. Before 2012, although some green credit policies were also introduced, these policies only played a guiding role and did not really become a strategic decision at the national level. Therefore, the understanding of green credit by financial institutions was limited to fulfilling social responsibilities, and the energy-saving effect of FD was not widespread and obvious.
After the policy change, when EC was at all the quantiles, the elastic coefficient of lnFD was most significantly negative. With an increase in the quantile, the impact curve of lnFD on lnEC showed a continuous decreasing trend. This indicates that after the policy change, when lnEC was at the lower quantiles, EC was inhibited by FD, whereas the inhibitory effect was decreased by an increase in the quantile. When lnEC is at the upper quantiles, with the increase of the quantile, EC was shown to be more tightly controlled by FD. With the introduction of the GCG, green credit exerts an obvious punitive financing and inhibitory financing effect on businesses with high EC and guides more funds into environmental protection and resource-saving industries.61,62 The promulgation of the GCG has improved the green innovation ability and the allocation efficiency, which is conducive to green industrial structural upgrades and green industrial development.63,64 Therefore, after 2012, significant energy savings have resulted from FD. We further observed that at the lower quantiles, the inhibitory effect did not change considerably with an increase in the quantile. This may be because the economy in the regions with low EC is still underdeveloped, and green credit policies are less effective because local governments have the incentive to intervene in financial resources to boost economic growth. Green development and inclusive development should be considered when EC is still within the resources and environment's carrying capacity. However, the wrong economic development model of pollution first and governance later should be avoided.
Further discussion
Before and after the GCG were implemented, we also examined the dynamic quantile heterogeneity impact of FD on CEC and NEC. Table 6 presents the empirical results. Figure 4 illustrates a trend chart of the dynamic quantile impact coefficient of FD on CEC and NEC before and after the introduction of the GCG. In Table 6 and Figure 4, the elastic coefficient values corresponding to lnFDcb and lnFDca show the impact of FD on CEC before and after the promulgation of the GCG, respectively; and the elastic coefficient values corresponding to lnFDdb and lnFDda show the impact of FD on NEC before and after the promulgation of the GCG, respectively.
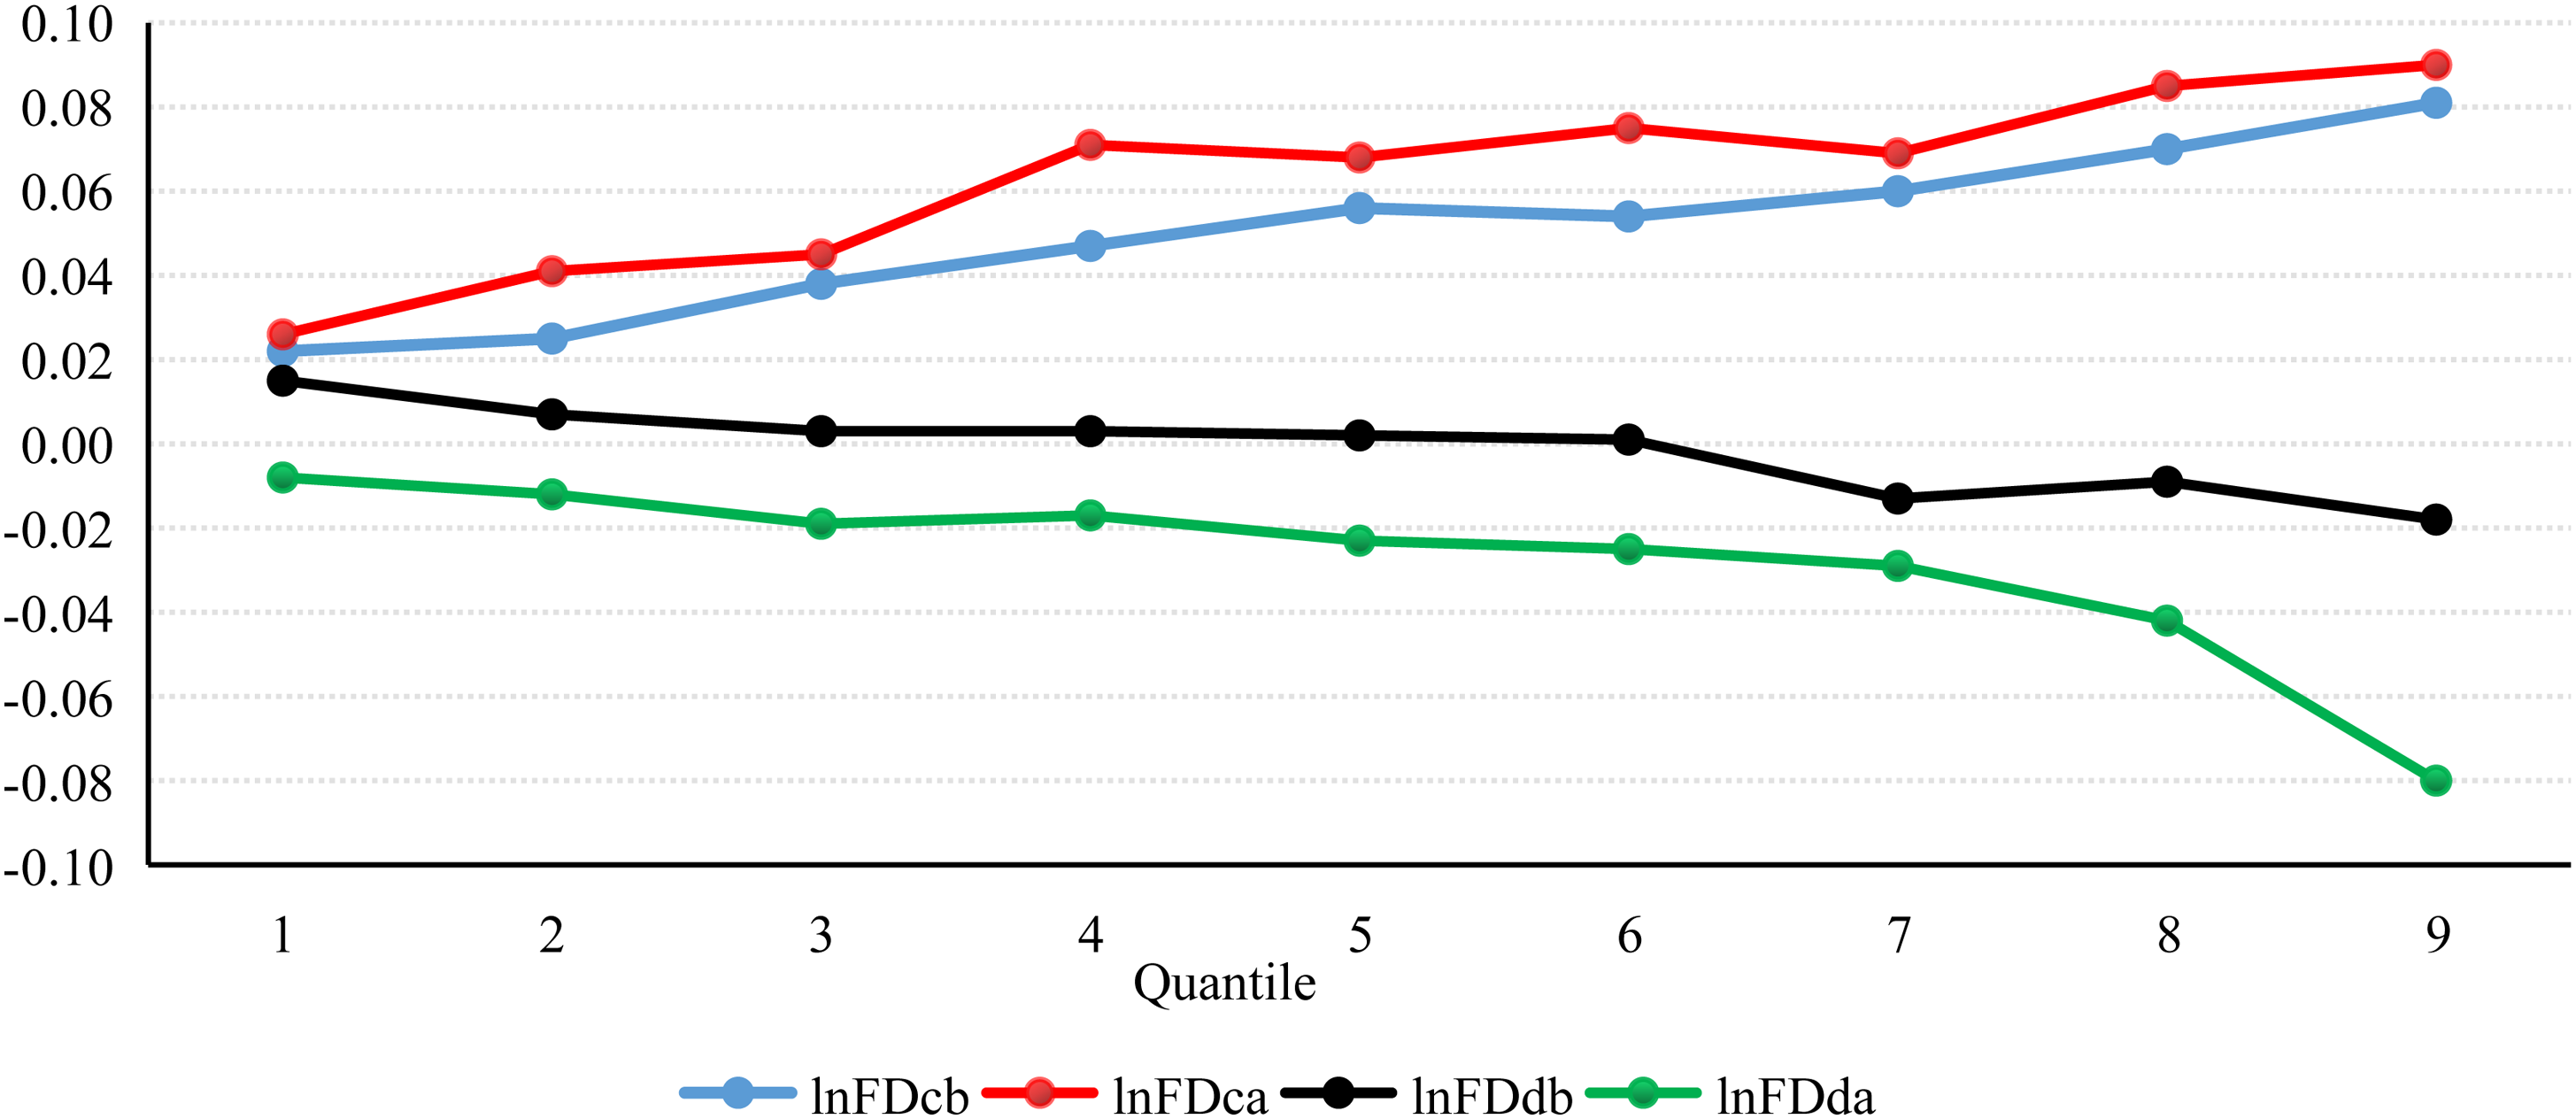
Trend chart of the dynamic quantile heterogeneity impact coefficient of lnFD.
Dynamic quantile regression results of FD on CEC and NEC from the perspective of policy change.
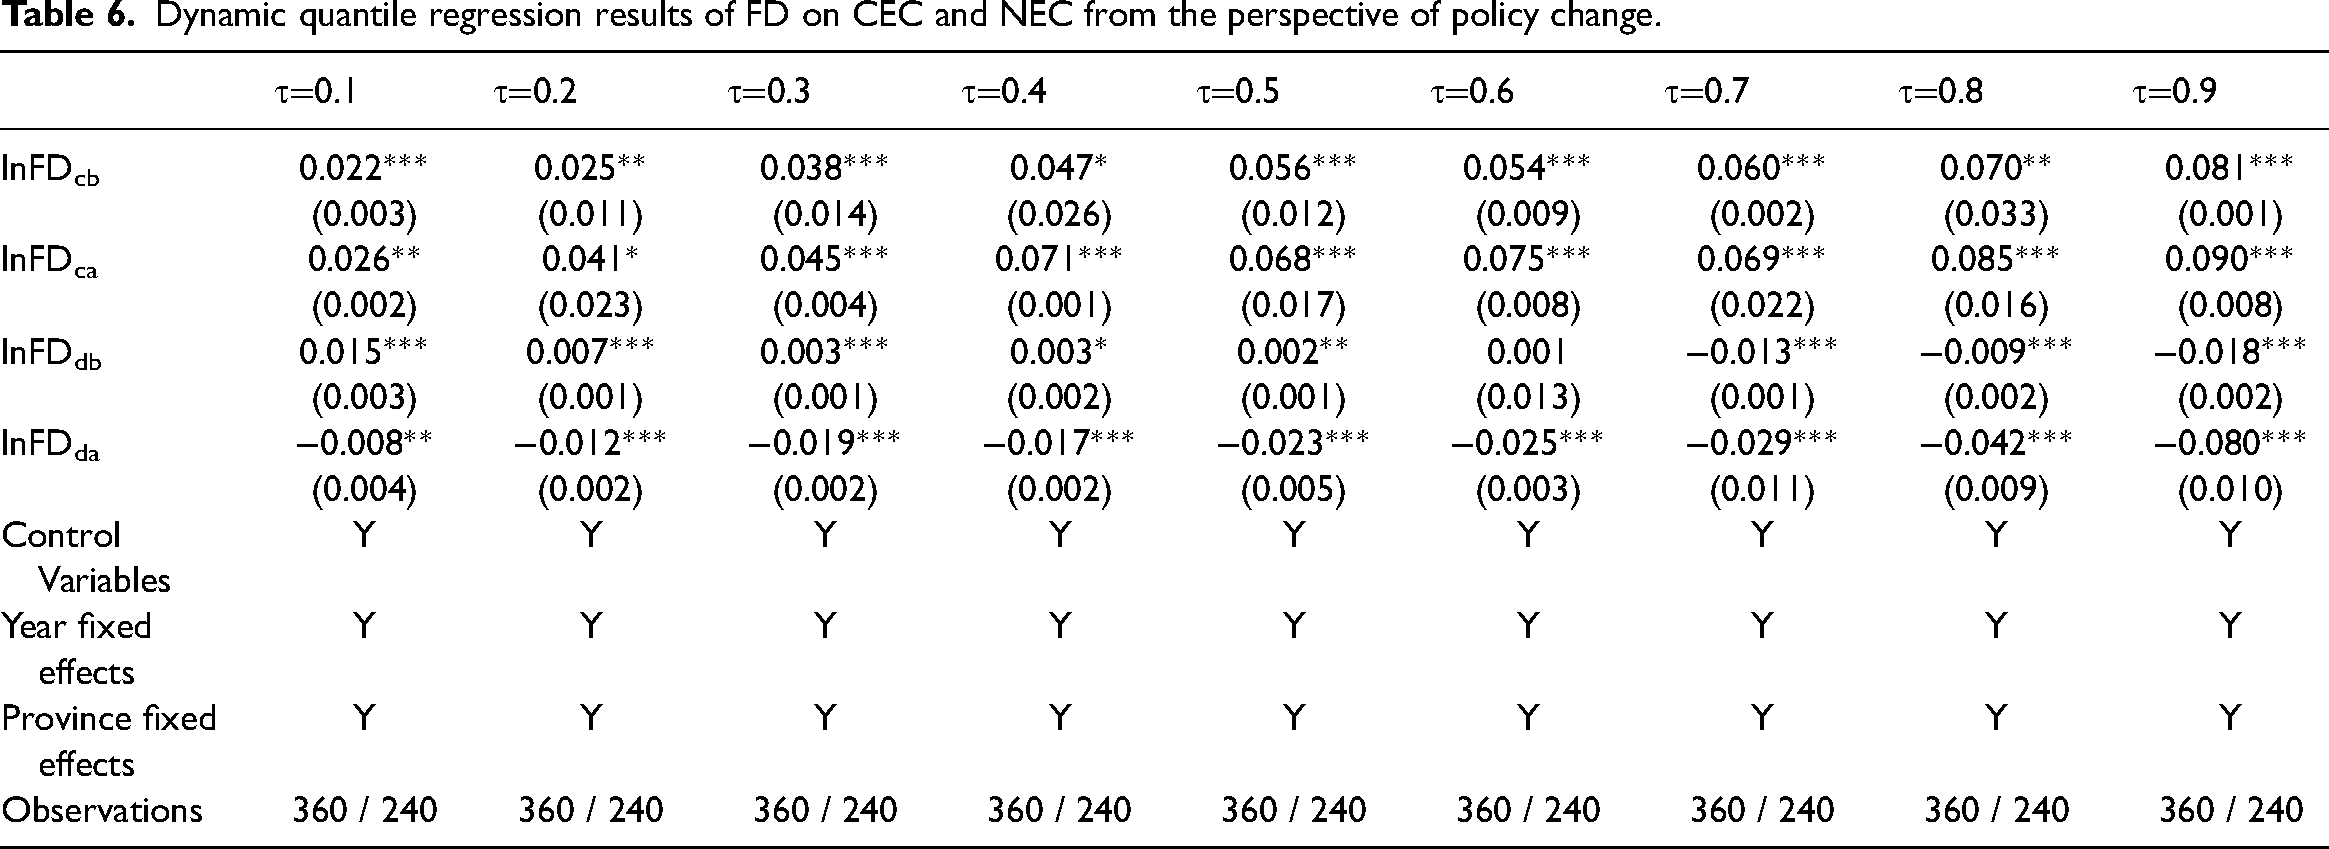
Table 6 and Figure 4 show that for clean energy at different quantiles, the elastic coefficient of lnFD is significantly positive, and the impact curve of lnFD on lnEC shows an upward trend. In addition, the elastic coefficient of lnFD after the promulgation of the GCG was greater than that before the introduction. For non-clean energy, at different quantiles, the elastic coefficient of lnFD was mostly significant before the policy change. After the policy change, the elastic coefficient of lnFD was significantly negative. Before and after the policy change, the impact curve of lnFD on lnNEC showed a downward trend. In addition, the elastic coefficient of lnFD after the policy change was smaller than before the introduction. Table 6 and Figure 4 show that before and after the policy change, the impact of FD on CEC exhibited a lower absolute coefficient difference than that of the effect of FD on NEC. This indicates that after the GCG, compared with the increase in FD in promoting CEC, the inhibitory effect of FD on NEC is even greater.
After the policy change, although FD has weakened the support for NEC, the support for CEC is still not sufficiently strong. Since the policy change, China has experienced economic processes such as supply-side structural reform and the reduction of coal overcapacity. Financial markets, especially bank credit funds, have rapidly decreased their support for the exploitation and consumption of non-clean energy. However, the first time green finance was included in the government work report was in 2015. Compared with traditional energy industries, the clean energy industry requires more research, development, and investment has correspondingly higher costs and is less profitable. Under the background of the Chinese government's strong advocacy of green development, although green finance has grown, driven by financial profit-seeking, the actual support of financial market funds for CEC ought to be improved.
Conclusion and policy implications
This study used a DPQM based on Chinese provincial panel data from 2001 to 2020 to investigate the dynamic quantile impact of FD on EC and its heterogeneity using DPQM, to determine whether FD has effects that save energy as well as differential distribution characteristics. First, when EC was at the lower quantiles, with an increase in the quantile, the promotion effect of FD on EC weakened. However, when EC was at the upper quantiles, with the increase in the quantile, FD exerted a stronger restraining effect on EC. Second, with the increasing quantile levels, EC inertia and total population strongly contributed toward promoting EC, whereas economic growth, technological progress, and urbanization exhibited weakening roles in promoting EC. Third, FD can promote CEC. With the increase in the quantile, FD played an increasingly stronger role in promoting CEC. When NEC is at the upper quantiles, FD can restrain NEC, causing a stronger inhibitory effect. Finally, before the introduction of the GCG, the energy-saving effect of FD was not widespread and was unobtrusive. After the policy change, when EC was at the upper quantiles, the energy-saving effect of FD became stronger with increasing quantiles.
First, the energy-saving role of FD must be developed. FD policies ought to be tailored to local conditions, and the flow of financial resources should consider factors such as regional economic growth, financial market construction, and EC. The complete influence of the guidance of financial policies ought to be considered; thereby, more funds can be guided into the field of green development, which will promote the low-carbon transformation of low-efficiency industries to stimulate the energy-saving effect of FD in various regions to the greatest extent.
Second, energy-consuming factors must be curbed. Green energy conservation must be strengthened and the EC habits of enterprises and residents ought to change. Local governments should take green gross domestic product as the assessment index so that green development can be deeply rooted in people's actions. Enterprises should enhance the preference for green technological progress, accelerate research, and develop and apply novel processes and technologies to achieve clean and energy-saving production. The construction of smart, sponge, and green cities should be accelerated and high-quality urbanization is promoted.
Third, financial support for the clean energy sector should be increased. Focus should be given to wind and photovoltaic power generation and other industries. Financial institutions should expand the financing channels for clean energy industries and reduce its financing costs. Financial regulators must continue to carry out comprehensive evaluation and assessment of the energy-saving effect of FD and establish a long-term mechanism for the financial support of low-carbon and clean development. Local governments should promote the development of carbon trading and make complete use of the available financial support tools for carbon emissions reduction.
Finally, we ought to strike a balance between financial support for traditional and renewable energy sources. Financial institutions shall provide reasonable credit support to qualified coal power and coal enterprises and projects and shall not blindly cutoff or withdraw loans. Financial regulators should continue to implement the financial policies of clean production and clean utilization of coal and improve the financial service preservation mechanism with a stable traditional energy supply. In addition, financial regulators should improve the transforming financial system to support the low-carbon transformation of China's economy.
Footnotes
Declaration of conflicting interests
The authors declared no potential conflicts of interest with respect to the research, authorship, and/or publication of this article.
Funding
The authors disclosed receipt of the following financial support for the research, authorship, and/or publicationof this article: This work was supported by the Project of Philosophy and Social Science Research in Colleges and Universities in Jiangsu Province, Humanities and Social Sciences Foundation of the Ministry of Education of China (grant numbers 2022SJYB1501, 21YJA790083).
Appendix
In this study, the improved stochastic front analysis model is established by using the improved C-D production function.
The error term comprises νit and μit. μit reflects the non-negative random factor of the loss of technical efficiency.