
Abstract
In this paper, we researched the implication of international migration and pollution on environmental development of the selected countries which we classified as middle- and upper-income countries. Maintaining good environmental performance while keeping pollution at minimum level amidst international migration has being the global focus towards climate goal. On this premises, this study examines the relationship between international migration and carbon dioxide emission (CO2). Scientific approaches (random-effects model and Driscoll-Kraay standard error estimator) with panel data for the period from 2010 to 2019 are adopted for indepth analysis of the selected countries. The findings according to random-effects model/Driscoll-Kraay standard error estimator suggest the incresae of CO2 due to increase in international migration for the case of middle-income countries. Also, a decrease in CO2 due to increase in international migration is found for high-income countries. Following our main findings, as a function of CO2 emission, we recommend to take identity of people who migrate into consideration for both economics and environment policy. On the other hand, policies should be based on mitigating the negative impact of international migration and economic growth for the middle-income countries. Moreover, environmentally friendly growth technologies are suggested.
Keywords
Introduction
Migration has been in a constant and persistent position throughout humanity history. Understanding the causes and mechanisms of the migration is one of the most important global issues currently, it is imperative for developing effective policies for migrant movements. 1 In other words, migration is important not only for groups of people who move to improve their well-being, but also for people in regions where migration has been completed. 2 Recently, with the process of globalization, international migration has significantly increased, particularly to developed countries. 1 Although COVID-19 limitations have decreased the mobility around the world, today, it is estimated that 281 million people are in international migrant position. This data consists 3.6% of the world population. 3
It can be claimed that in the 21st century, scientists have become aware of the increasing serious threat of air pollution to human health and well-being. Therefore, the issue of the source of environmental pollution is the most serious concern in the energy and environment literature today. 4 Thus, the problem of global warming/climate change has become a global concern and one of the important agendas of policy makers. The main cause of the global warming is the increase in human-induced greenhouse gas emissions. Many indicators such as economic growth, technology, industry, trade, increase in energy consumption, urbanization, transportation, and capital movements have been used as the driving force of greenhouse gas emissions. However, seen in the literature that studies for the effect of migration movements, which have become a global problem, on greenhouse gas emissions have not reached a sufficient level.. 5 Therefore, effective policy formulation to descrase the growth of carbon emissions is urgently required. 6 Although there are studies in the literature on how internal and external migration affect the welfare of the country, studies that specifically address the relationship between external migration and environmental problems are quite limited.
This study seeks to investigate the environmental influences of international migration movements on high- and middle-income countries. This effect symbolizes the environmental pollution in countries receiving migrants. Nevertheless, studies that examine the relationship between migration and environment with various indicators consider the migration movements as domestic and international, generally, they examined environmental pollution indicators within the framework of a model. The objective of our study is anchored on the implication of international migration on environmnetal development of countries across the globe. Following the climatic caution by several entities (both individuals and organization and nations), this study concieved a new idea of testing the environmental performance of the selected countries by grouping them into two blocks, high- and middle-income countries. The idea behind this technique is the popular perception that there is a difference in the categories of people that visit those two blocks, hence, the professionals (skilled and enlightened personel) and economic migrants tend to migrate to high-income countries. The environmental literacy and exposure of the professionals and illitrates are not always the same, and this influences their environmental consciousness and contribution towards keeping the pollution to the minimum level. Hence, part of the objective of this study is to see the impact of international migration in both blocks, high- and middle-income countries. Also, to see if the two income groups are experiencing the same or uniform impact of migration to their environmental performance. For clarity on this purpose, the study has adopted economic growth and international migration to test the carbon emission which represents environmental performance of the selected countries. The purpose of this study is summarized as follows: Do migrants increase environmental pollution in the reference countries and period? Do economic growth increase the environmental dilapidation of the selected countries, if yes, which country has the greater impact of economic growth on its environment? Do our findings support the approaches to the theoretical relationship between international migration and environmental pollution? What is the difference between our findings from the studies in the literature and how do our results support the previous works?
In view of these, we build a model including the number of migrated people as the explanatory, CO2 emission as depended variable. All diagnostic test, we use Driscoll-Kraay standard error estimator regression analysis to investigate the impact of migration on the CO2 emissions. In the model, high- and middle-income level countries are examined for the period 2010–2019. We chose this period aim to omit the effect of Covid-19 outbreak which began in 2020. During 2020 and after this year, it is supposed that CO2 has decreased dramatically due to economic activities slowed down. Also as we mentioned before, mobility limitations reduced the migration movements as extrinsic shocks in the omitted term.
Our findings show that CO2 emission is a function of the migration movements in both types of countries. Put more simply, our results suggest that effects of migration movements bring about different (but significant only for the high-income countries) consequences among country groups. In detail, while migration movements insignificantly increase CO2 emission in middle-income countries, it significantly reduces the level of CO2 emission in high-income states. As a common evidence, the economic growth increases the level of CO2 emission in all countries.
As a novelty and contribution of our study to the related literature, we construct empirical models which examine the effects of international migration on CO2 for high- and middle-income countries. To our knowledge, these constructs have never been established before in this context. In the empirical literature, studies mostly focus on a country or region. In this study, we research 40 countries and divide them into two income groups. Additionally, we compare the results for each group, explain our recommentations to policy-makers, and discuss how people who migrated can increase or reduce environmental pollution in reference countries.
Review (literature and theoretical background)
Literature review
In this section, we firstly review the relevant studies in the literature before providing empirical evidence for the effects of migration (in review, for both movement and population) on environmental pollution indicators. Some studies on the migration-environment relationship indicate that the effect is limited, while the general literature states that migration has a significant effect on environmental pollution. In addition to these, there are different results regarding the direction of the effect. In this context, it is seen that there is no consensus in the literature about the topic.
Cramer 7 and Squalli 8 indicate that the environmental pollution is related to native population rather than foreign population. Cramer 7 applied data for 56 counties to analyze the impact of population growth on the atmospheric emissions of five regulated pollutants from 1980 to 1990. The study applied per capita income as a control and regulatory variable. The findings expose the negative impact of population on atmospheric emissions. On the other hand, Squalli 8 applied STIRPAT method to investigate the immigration–environment association using US county-level data. The analysis compares the US-born and foreign-born populations towards the unveiling of their impact on emissions of CO2, NO2, PM10, and SO2. The study finds counties with a relatively larger US-born population have higher NO2 and SO2 emissions, while counties with a relatively higher number or share of foreign-born population have lower SO2 emissions. Ma 9 sharply specifies that foreign-born population reduces pollution. As the reasons, using less energy, driving less and generating less waste are shown. Additionally, the research mentions the importance of cultural diversity for environmental sustainability.
Besides those findings, some studies have investigated the relationship migration-environmental pollution and show that little or no effect is found.5,8,10
Dedeoğlu et al. 5 applied STIRPAT approach with other methods such as structural breaks co-integration tests, parameter estimates and causality analysis to study the implication of international migration for the case of USA. The results stipulate that while migration, financial development and energy consumption have an increasing effect on environmental pollution, economic growth has a decreasing impact on pollution. Also, Price and Feldmeyer 10 used data on 183 Metropolitan Statistical Areas drawn from the Environmental Protection Agency, the U.S. Census Bureau, and the National Oceanic and Atmospheric Administration to empirically investigate the link between immigration and seven measures of air pollution. Findings from the study reveal that immigration does not add to rural air pollution levels across any of the seven pollution measures studied.
As for the final group, many studies suggest that there is the positive relationship among migration and environmental pollution.11–20
Zhan et al. 11 in their study aimed to investigate whether human migration can act as a significant factor in the post-pandemic age to help PM2.5 concentration forecasting. Findings indicate that the human migration indirectly impact the urban PM2.5 concentration. Also, Guoxia et al. 15 in their study investigate the determinants of carbon transfers by incoporating the impact of population migration through the STIRPAT mechanism for 64 countries over the period 2005–2015. They applied stepwise regression approach. The result revealed that higher levels of migration flow induce higher carbon flow.
In furtherance of research into the determinants of carbon emission across nations, other researchers like Wang et al. 21 have worked on transfer of emissions across countries with trade openness, economic growth and resource rent. They employed generalized method of moment and fully modified ordinary least square to the kuznets curve of 208 countries. They found the validation of EKC for the countries selected. They also found renewable energy sources mitigating the carbon emissions. Also, Wang et al. 22 found in their study for 124 countries that trade opennees inhibits carbon emissions and contributes to global carbon neutrality. However, Wang et al 23 found in their study for 134 countries that urbanization strengthens the positive relationship between the economy and carbon emissions, and ecological footprint.
Theoretical background
The theoretical background of this study is anchored on two different approaches to the impact of demographic growth on environmental quality. The tradition of Malthus24,25 argues that environmental degradation occurs as a result of the pressure exerted on resources by population growth. According to the Boserup26,27 approach, population growth accelerates the emergence of technological innovations that reduce the negative effects on the environment. 18
Migration movements affect carbon dioxide emissions as they affect the population size and structure of both the source country and the destination country. Population growth caused by migration not only affects energy consumption, but also causes a change in lifestyle that affects consumption patterns and CO2 emissions. This situation can sometimes be used as an argument by immigration and anti-immigrant policy makers. However, the restriction of international migration movements is not a desirable situation for economic development. Thus, countries receiving heavy migration need to take quick steps to reduce their CO2 emissions. 28 It is possible to reduce carbon dioxide emissions by making changes in lifestyle and consumption habits. For example, promoting public transportation and taxing carbon dioxide emissions lead people to make appropriate decisions about their lifestyles. 12
Although the population–environment relationship has been narrowly handled in both approaches, it is valuable in that it forms the basis for subsequent studies. In summary, these two views offer us two testable hypotheses. 19 The Malthusian approach argued that the effect of population on greenhouse gases will increase more than the proportional change in population growth. 18 The Boserupian approach argues that the greater the population pressure, the stronger the science and technological innovations develop and the better the humanity's ability to provide technological solutions to environmental problems. 19
Population movements which is classified as international migration are facilitated by globalization, economic integration and technological innovations. The movement of people create ecological footprints and increase energy use per capita. International migrations and especially mass migration movements mean rapid population growth for the target country. In this sense, it will be useful to examine the pressure on the environment caused by rapid population growth. Population growth affects greenhouse gas emissions through two different mechanisms. First, the increasing population directly affects the increase in fossil fuel emissions by increasing energy demand and use. Second, population growth causes changes in land uses and deforestation, indirectly increasing CO2 emissions. 20 Rapid population growth increases the pressure on the environment. In its simplest form, more forest land is sacrificed for farming, more animals are killed. In addition, more forest products are consumed in order to meet the increasing demand for durable consumer goods. All these deteriorate the ecosystem. 29
International migration, with the effect of globalization, affects more and more countries every day and forces changes in many areas. The globalization process, technological innovations and the facilitation of transportation opportunities have especially encouraged and accelerated international migration. Regardless of the reason, type and form of their occurrence, all population movements have positive and negative consequences on the place, region or country of migration. 30
While international migration movements offer some opportunities to the countries affected by migration, they also cause some difficulties. Thus, countries exposed to migration focus on using the opportunities arising from migration, while trying to minimize the negative effects caused by migration. 31
It is possible to deal with the relationship between migration and the environment in different ways. It is seen that the literature on the relationship between the environment and migration mostly focuses on the effects of environmental conditions on migration. Although environmental degradation affects migration, it is not counted among the driving forces like natural disasters. Some studies on the relationship between migration and the environment examine the environmental consequences of the originating countries. These studies generally deal with individuals in rural areas who make a living through migrant remittances and perhaps give up production. The relationship between migration and the environment can also be addressed by analyzing the environmental changes experienced by the target regions receiving migration. 32
The carbon emissions emitted by a country do not only affect that country. Due to its negative externalities, it also affects the environmental quality of the countries with which it has commercial interaction. For this reason, carbon summits are held and countries are trying to reach the carbon neutral level. More than 190 countries that signed the Paris Agreement are working towards the goal of reducing carbon emissions and achieving carbon neutrality. However, joint efforts of all countries of the world are needed to achieve this goal. 33
In this study, the changes in the carbon dioxide emissions of middle- and high-income countries, which receive heavy migration, are analyzed. In the analysis, it is empirically tested whether the Malthusian approach or the Boserupian approach is valid for the 2010–2019 period and the selected country groups. This is due to the unavailability of data. Additionally, the answer to the question of whether the effects of international migration on environmental pollution differ for countries with different income levels is sought.
Empirical analysis
Method
In this study, static panel data analysis was used. Movements, between reference countries (cross-section data) and periods including many years (time-series data), have the usage of panel data analysis mandatory. Besides, panel data analysis has many advantages apart from using time-series and cross-section data gathered. These advantages are listed as follows
34
:
Panel data control for individual heterogeneity. Time-series and cross-section data that do not control for this heterogeneity run the risk of producing biased results. Panel data further examine the tuning dynamics. Panel data can better describe effects that are not easily detectable in pure time-series or cross-sectional data. Panel data models allow the creation and testing of highly complex behavioral models. Micro-panel data collected about individuals, companies and households give more accurate results than similar variables measured at the macrolevel.
Additionally, panel data generally increases the degree of freedom by giving researchers a large number of data points and increases the efficiency of econometric estimations by decreasing the accuracy among explanatory variables.
35
As stated below, in the panel data analysis equation, Y is the dependent variable, X's are the independent variables; α is constant and β's show the coefficients of the explanatory variables. The i and t show that the equation includes both the cross-section and time-series properties
34
:

The studies investigating the relationship between international migration and carbon emission generally focus on a country or region. As addition to empirical literature, this study improves in the following two aspects: (1) This study seeks the situation of 40 countries and also divides them into two income groups. Therefore, using of panel data analysis is compulsory. (2) We show and apply all required test which mean diagnostic test to obtain the most appriorate model. According to diagnostic tests, we operate the regression analysis solving all the problems in the reference model.
Model
In the models used for the analysis, environmental pollution is the dependent variable and international migration is the explanatory variable. Environmental pollution is proxied by carbon emission (CO2). Carbon emission is identified as the most qualified indicator of environmental pollution by many scholars (Adebayo et al. 36 ; Gyamfi et al. 37 ; Udemba and Tosun 38 , etc) becuase of its contribution towards greenhouse gas emissions (ghg). The impacts of carbon emission on environment have been proven to contribute towards the development and quality of environment. This is more reason why this present study adopt the carbon emission as the variable to measrue the environmental development within the concept of international migration. As for the international migration as a determinant of environmental pollution, it has been utilised in some scholarly works12,32,39 and the findings have demonstrated that international migration is a very crusial and sensitive variable in determining the state of environment development in the host countries. This support the decision to include this variable in our study. The gross domestic product (GDP) was added to the model as a regulatory factor. The models were separated as Model A for high-income countries and Model B for middle-income countries.
Model A and Model B equations, which are formed by the dependent and explanatory variables represent for both income groups, are defined as:


Data
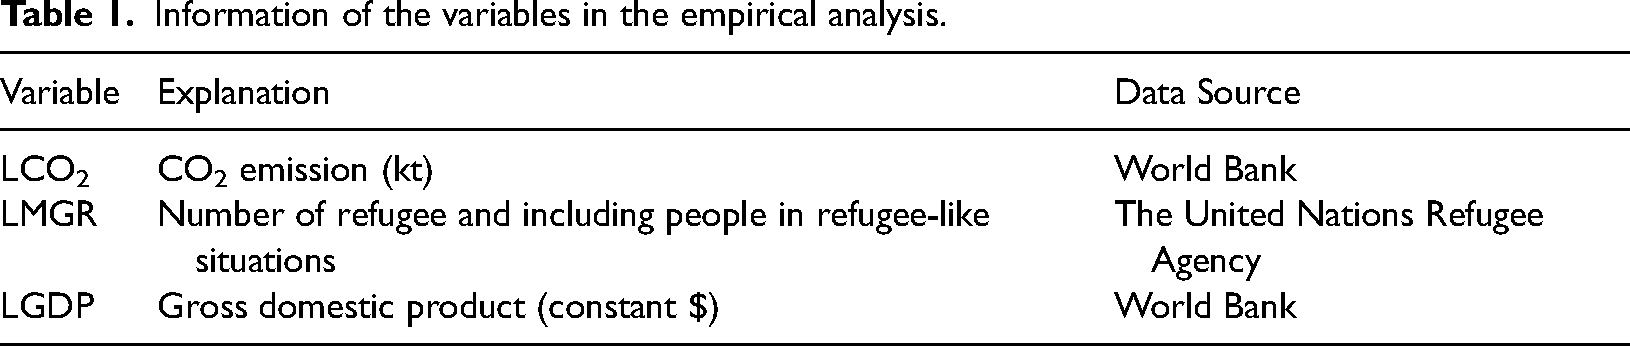
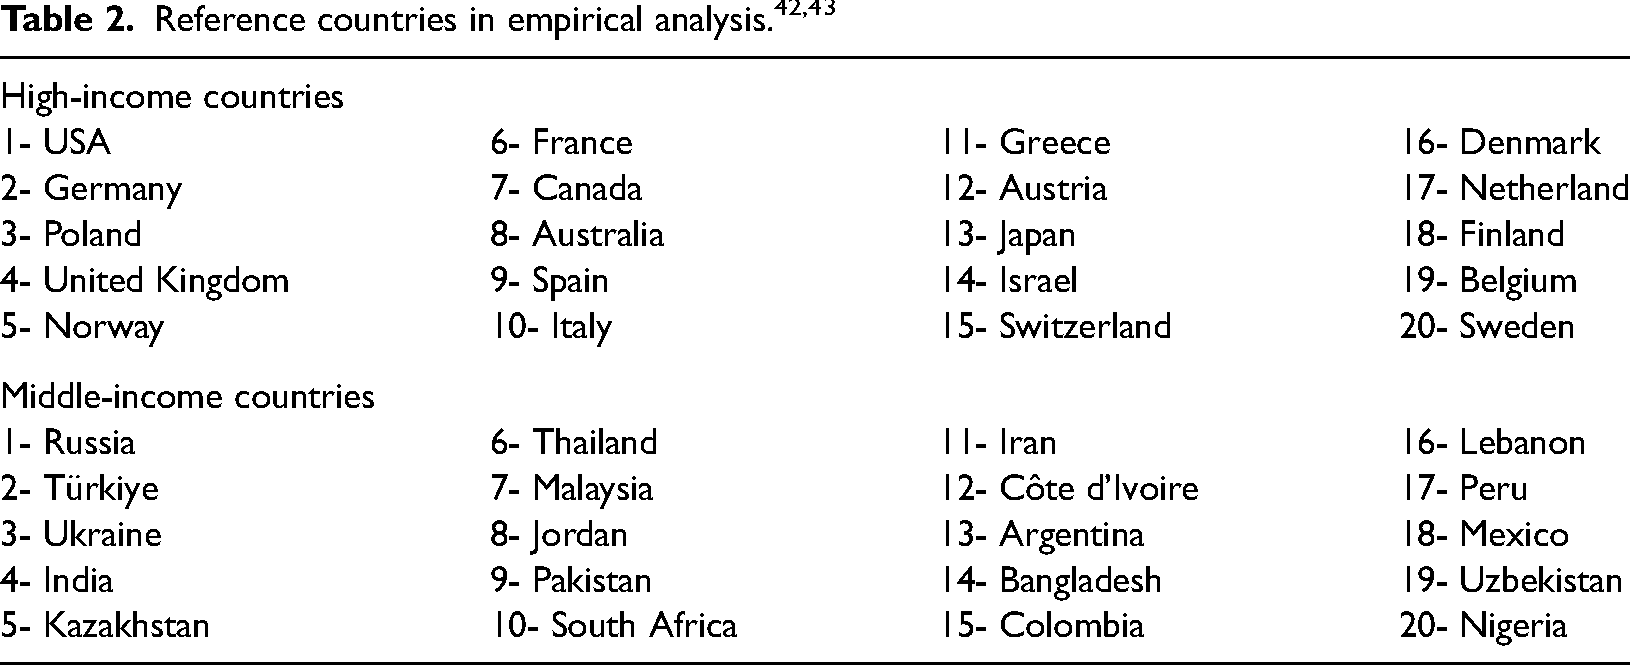
In the empirical study, the balanced data of 40 countries that receive the foreign people mostly in the world and have high- and middle-income levels wasused. These countries were chosen as the intersection points of migration and income.40,41 The reference period was chosen as 2010–2019 in the analysis. The reason for choosing this reference period is that all data is desired to be selected from the same data source/the data set common for all variables is 2010–2019 and excludes deviations in the global epidemic period. Also, the unavailability of the data has placed the limitation to the time period chosen in our data for this study. Table 1 contains information about the variables in the empirical model. L represents the natural logarithmic values of all series. GDP is added into the models to consider other unobserved factors and to avoid possible biases caused by omitted variable bias. 16
Information of the variables in the empirical analysis.
Countries with high- and middle-income levels, as well as receiving the most migrating population, are shown in Table 2, respectively.
Methodology
A method, examining empirically the effect of explanatory variables on the dependent variable is the pooled ordinary least squares (POLS). However, this method can be used if the model excludes unit and/or time effects. In his context, LR or F test findings are used to determine the unit and time effect. The appropriate models determined as a result of this analysis are estimated (fixed- and random-effects model), and the effective one is selected among the consistent model. After determining the appropriate, consistent and effective model, the deviations of the model from the assumptions expressing the prerequisites in econometric analysis are discussed. After the basic assumptions are tested by diagnostic tests, regression analysis is used, which is deviations-resistant.
Pooled ordinary least squares method
The Pooled Regression Model (also known as Classical) refers to the situation where the constant and slope parameters have constant coefficients. In the absence of time or unit effects, pooled least squares regression analysis can be used.
44
The pooled least squares equation is expressed as below:
Xit is the weak exogenous variable, that is, it is uncorrelated with uit. Xis can be correlated with uit (for t≠s).
This assumption is homoscedasticity and in it,
E(
also contains the assumption and summarizes it as the following:
The conditional variance is independent of Xit. Unconditional variance is the same for all periods.
The conditional covariance between the error terms of different periods is equal to zero, in other words, there is no autocorrelation. It is summarized as follows:
E(uituis) = 0 (t≠s) : the unconditional covariance of the error term is equal to zero. E(uituis | Xit, Xis) = 0 (t≠s) : the conditional covariance of the error term is equal to zero. Within the error term, unit and time effects are not allowed.
Testing the validity of the classical model (LR test)
In panel data analysis, to determine the appropriate model, it should be checked whether the reference model contains unit and/or time effects. In the absence of effects, the classical model is valid; otherwise, fixed- or random-effects model is used. Multiple tests are used to determine the validity of the classical model. In this study, we used the LR (Likelihood Ratio) test.
The LR test consists of two models, constrained and unconstrained. The constrained model is the classical model. The unconstrained model is in which there is only a unit effect, only a time effect, and both unit and time effects. Those are expressed as follows
45
:


Fixed-effects model
The fixed-effects model is a method used when the unobservable effect is correlated with the explanatory variables. The general econometric form of the model is described as below
46
:
Random-effects model
Panel models in which unobservable unit and/or time effects are evaluated with the assumption of random effects are called random-effect panel data models. In these models, the assumed unobservable effects are seen as a random variable like the error term.
35
The error term equation to be written depending on the model is expressed below
45
:

The effect seen in the random-effects model can be only unit or time effect models as seen in the fixed-effects model; it can also be defined as the model in which unit and time effect coexist. In the random-effects model, units are chosen randomly and the differences between units may be random. However, the lack of correlation between unit effects and explanatory variables eliminates the effectiveness of the fixed-effects model due to the variation in cross-sectional dimensions. Therefore, if there is no correlation between unit effects and explanatory variables, the random-effects model should be used. 48
The choice between fixed- and random-effects model (Hausman test)
The Hausman specification test is a comparison between random- and fixed-effects estimators.
46
According to the correlation of unit and time effects and independent variables, in other words, the suitability of fixed- or random-effects models can be tested with the Hausman test. The basic hypothesis of the Hausman test is,
Assumptions in the panel data models (diagnostic tests)
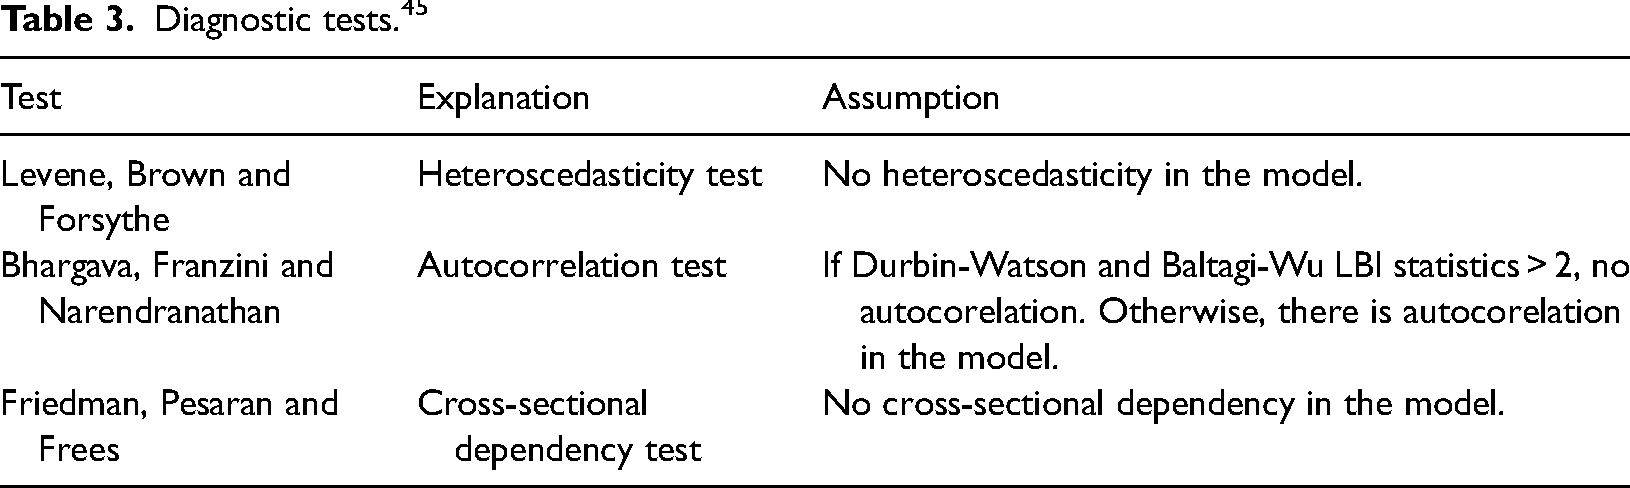
Performing econometric analysis with models containing the most appropriate and trouble-free data is critical in terms of the reliability of the findings. For this reason, diagnostic (detection) tests that test the condition of providing the necessary assumptions of a problem-free and reliable model established to be tested are indispensable in studies. Table 3 shows the diagnostic tests used for the random-effects model in panel data analysis and testing the validity of the basic assumptions.
Diagnostic tests. 45
D'Agostino, Belanger, and D'Agostino normality test
Another assumption behind the least squares estimation method is the normality distribution. The normal distribution of error terms is not essential for obtaining point estimates, but it is necessary to provide an assumption that the error terms are normally distributed to perform interval estimates and hypothesis testing.
45
In the normality test developed by D'Agostino, Belanger, and D'Agostino, the following test processes are suggested for testing skewness and kurtosis separately and together, with the following basic hypotheses
49
:


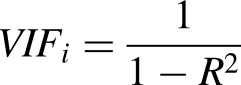
Variance inflation factor
In regression models, the absence of a linear relationship between the explanatory variables in the model is important in terms of making unbiased model estimations. There are many methods for detecting multicollinearity. The most widely used of these is the variance amplification factor. The variance inflation factor is calculated with the help of the R2 value, which consists of auxiliary regression models in which the explanatory variables in the model are one by one dependent variable and the remaining explanatory variables are independent variables. If the variance inflation factor (VIF) criterion is less than 5, there is no multicollinearity problem in the model; if it exceeds the 5 and is less than 10, it is moderate and if it is greater than 10, it is said that there is a high-intensity multicollinearity problem.
45
Driscoll-Kraay standard error estimator
Driscoll-Kraay makes a Newey-West type correction for the series of cross-sectional means. Standard error estimations realized in this manner ensure the consistency of the covariance matrix estimators even if N goes to infinity, regardless of the cross-sectional dimension N. The estimator developed by Driscoll-Kraay produces consistent standard errors in the general forms of spatial and periodic correlation, consistent in the presence of heteroscedasticity even in the case of large T and N. 45
If the estimated data model has at least one heteroscedasticity, autocorrelation, or inter-unit correlation, standard errors should be corrected without affecting parameter estimates, or appropriate methods should be used if they exist. The Driscoll-Kraay estimator is produced as an alternative to the Parks-Kmenta approach, which produces matrix estimators that are weak when the cross-section size is large, but consistent only in the case of large T. 50 Thus, the Driscoll-Kraay estimator can make efficient and consistent estimations with resistant standard errors even in cases of heteroscedasticity, autocorrelation, and cross-section dependence.
Findings and discussions
In this section, we present the descriptive statistics and findings (all diagnostic tests and regression analysis separately) from panel data analysis for Models A and B.
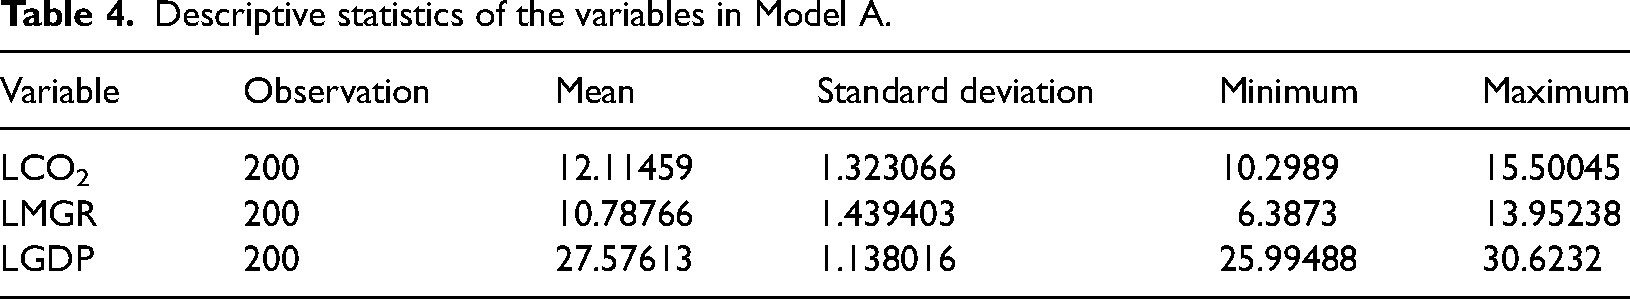
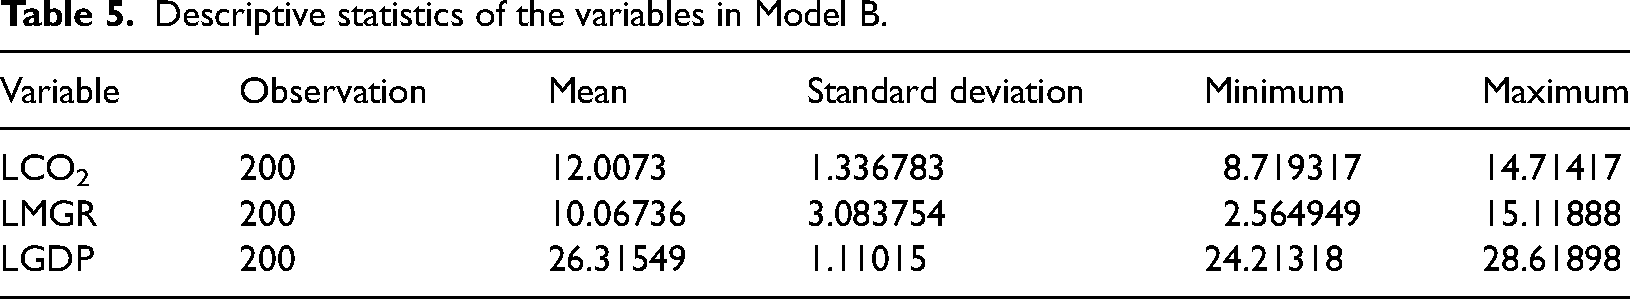
The descriptive statistics of the dataset used in the analysis were shown in Tables 4 and 5. The mean, standard distribution, minimum and maximum values were defined for both models A and B.
Descriptive statistics of the variables in Model A.
Descriptive statistics of the variables in Model B.
The hypothesis that the defined models show the characteristics of classical model is strongly rejected in Table 6. The assumption that the models contain only unit effects and no time effects were tested separately with the same method and it was determined that they only included unit effects. In this case, it is understood that both Model A and Model B do not show the characteristics of classical model and the use of fixed- or random-effects models are appropriate (Table 6).
LR test results (Models A and B).
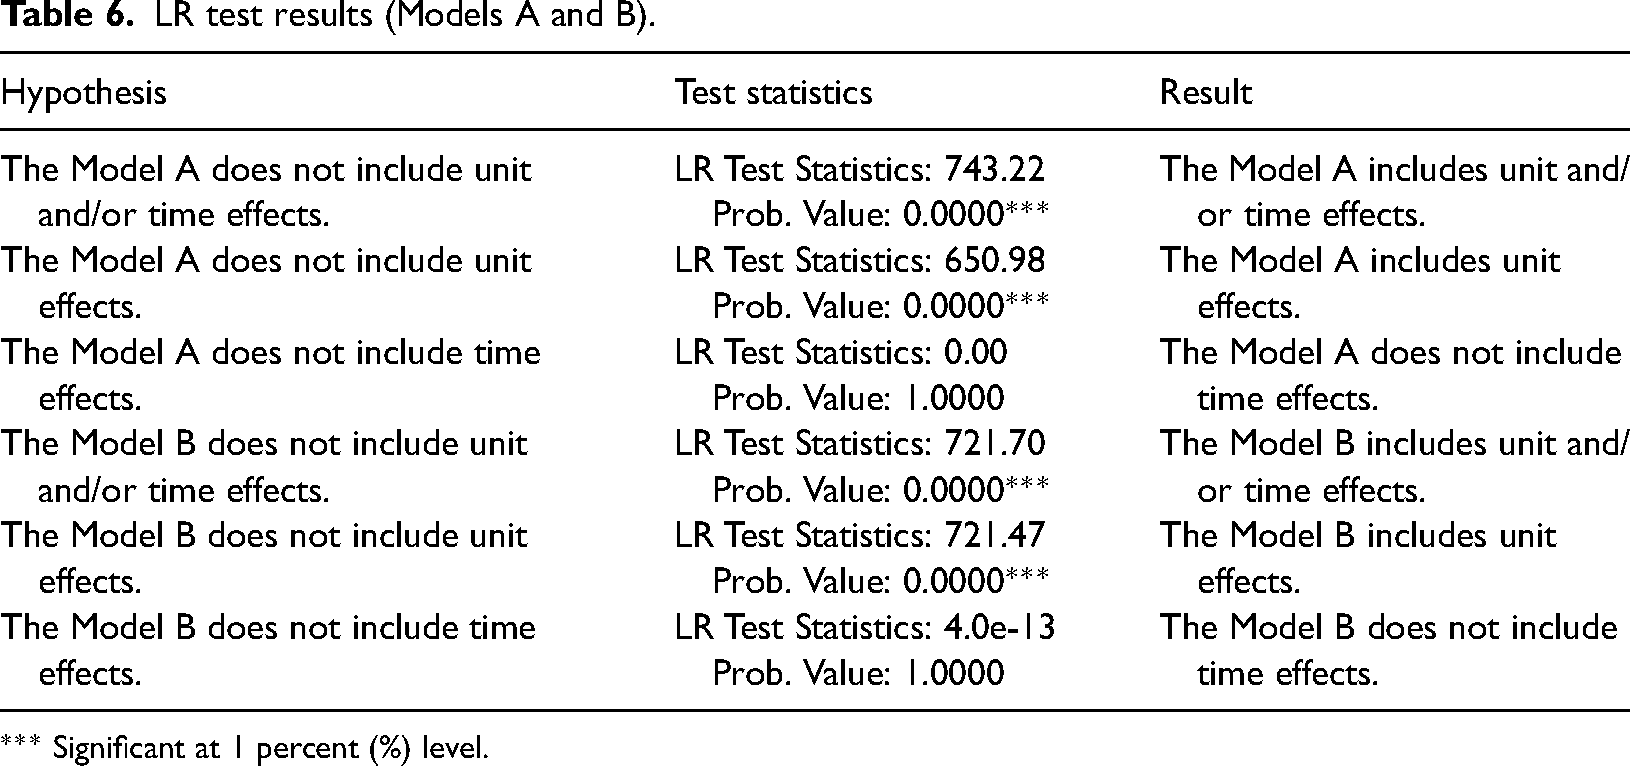
*** Significant at 1 percent (%) level.
In the examinations made under the assumption of fixed- and random-effects model, similar results were found for Model 1 and Model 2. Under the assumptions of both models, the reference models contain unit effects, but not time effects. Both fixed- and random-effects models appear to be consistent in this case. The result of the fixed- and random-effects models are reflated in Table 7.
Fixed- and random-effects model results (Models A and B).
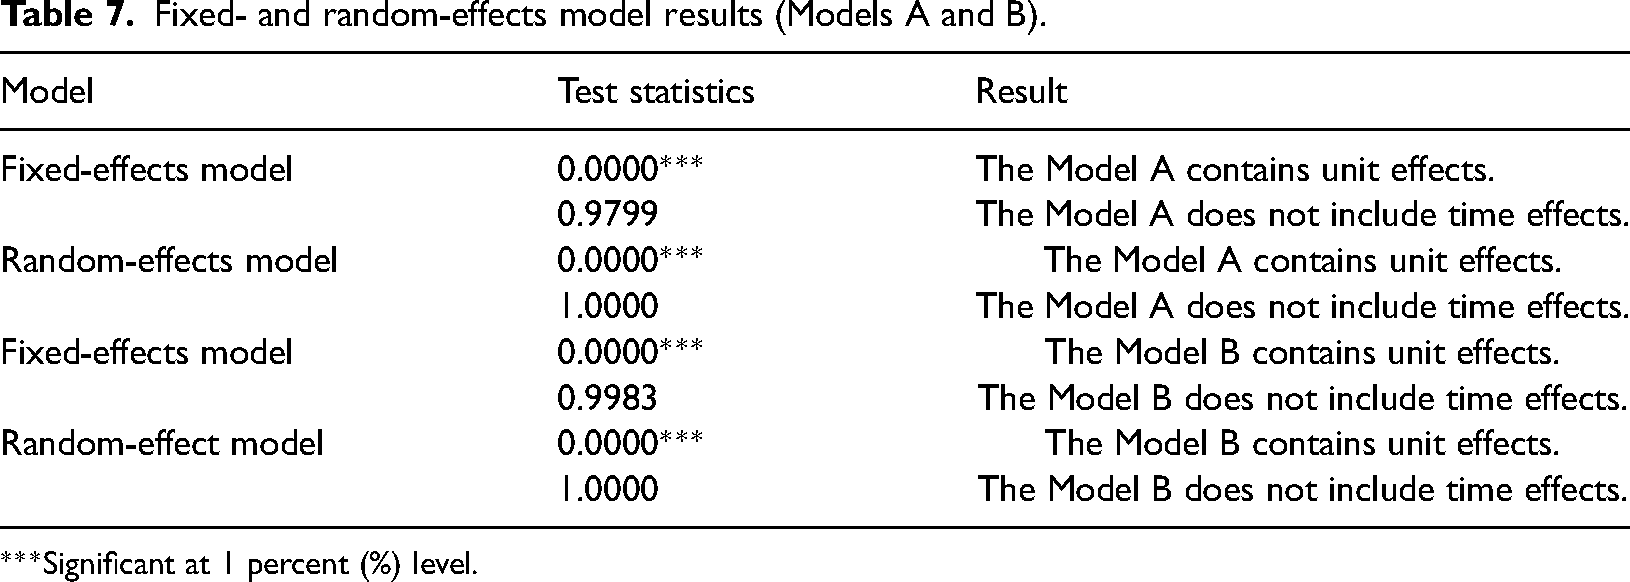
***Significant at 1 percent (%) level.
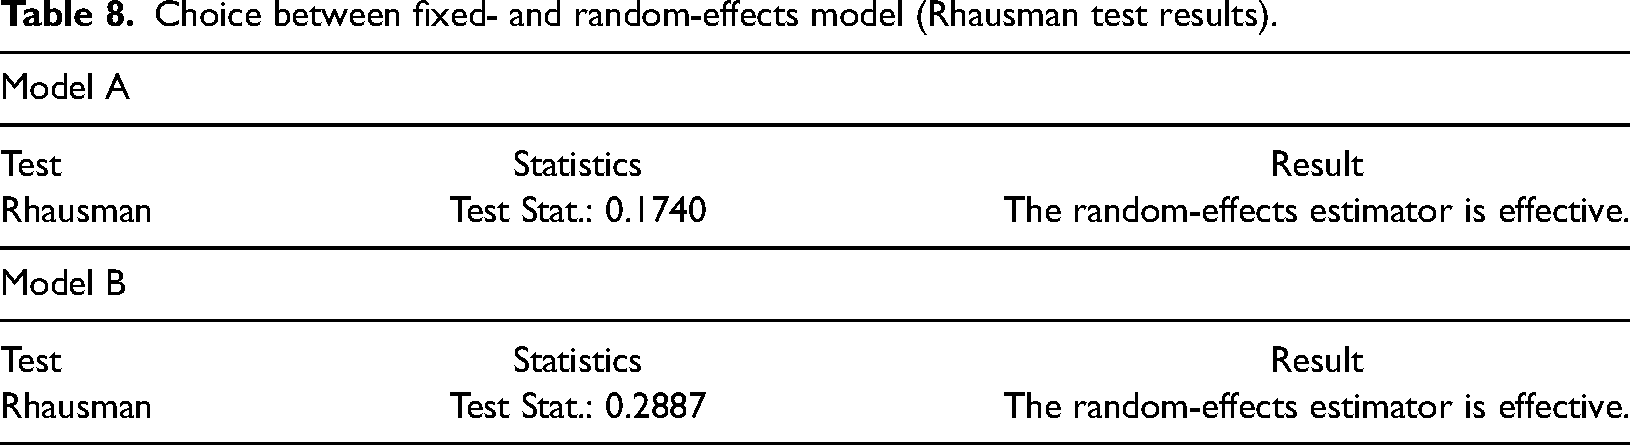
It is seen that Model B has similar results with Model A in choosing between fixed- and random-effects model (Table 8). According to the Rhausman test, the analysis is continued under the assumption that the random-effects model is effective.
Choice between fixed- and random-effects model (Rhausman test results).
Diagnostic tests were estimated to confirm that this study is free from econometic issues. From the diagnostic tests, it confirmed that our study is free from fundamental econometric issues such as serial correlation, autocorerelation, and heteroscedasticity problems. The outputs for the diagnostic tests are presented in Table 9.
Diagnostic test results (Models A and B).
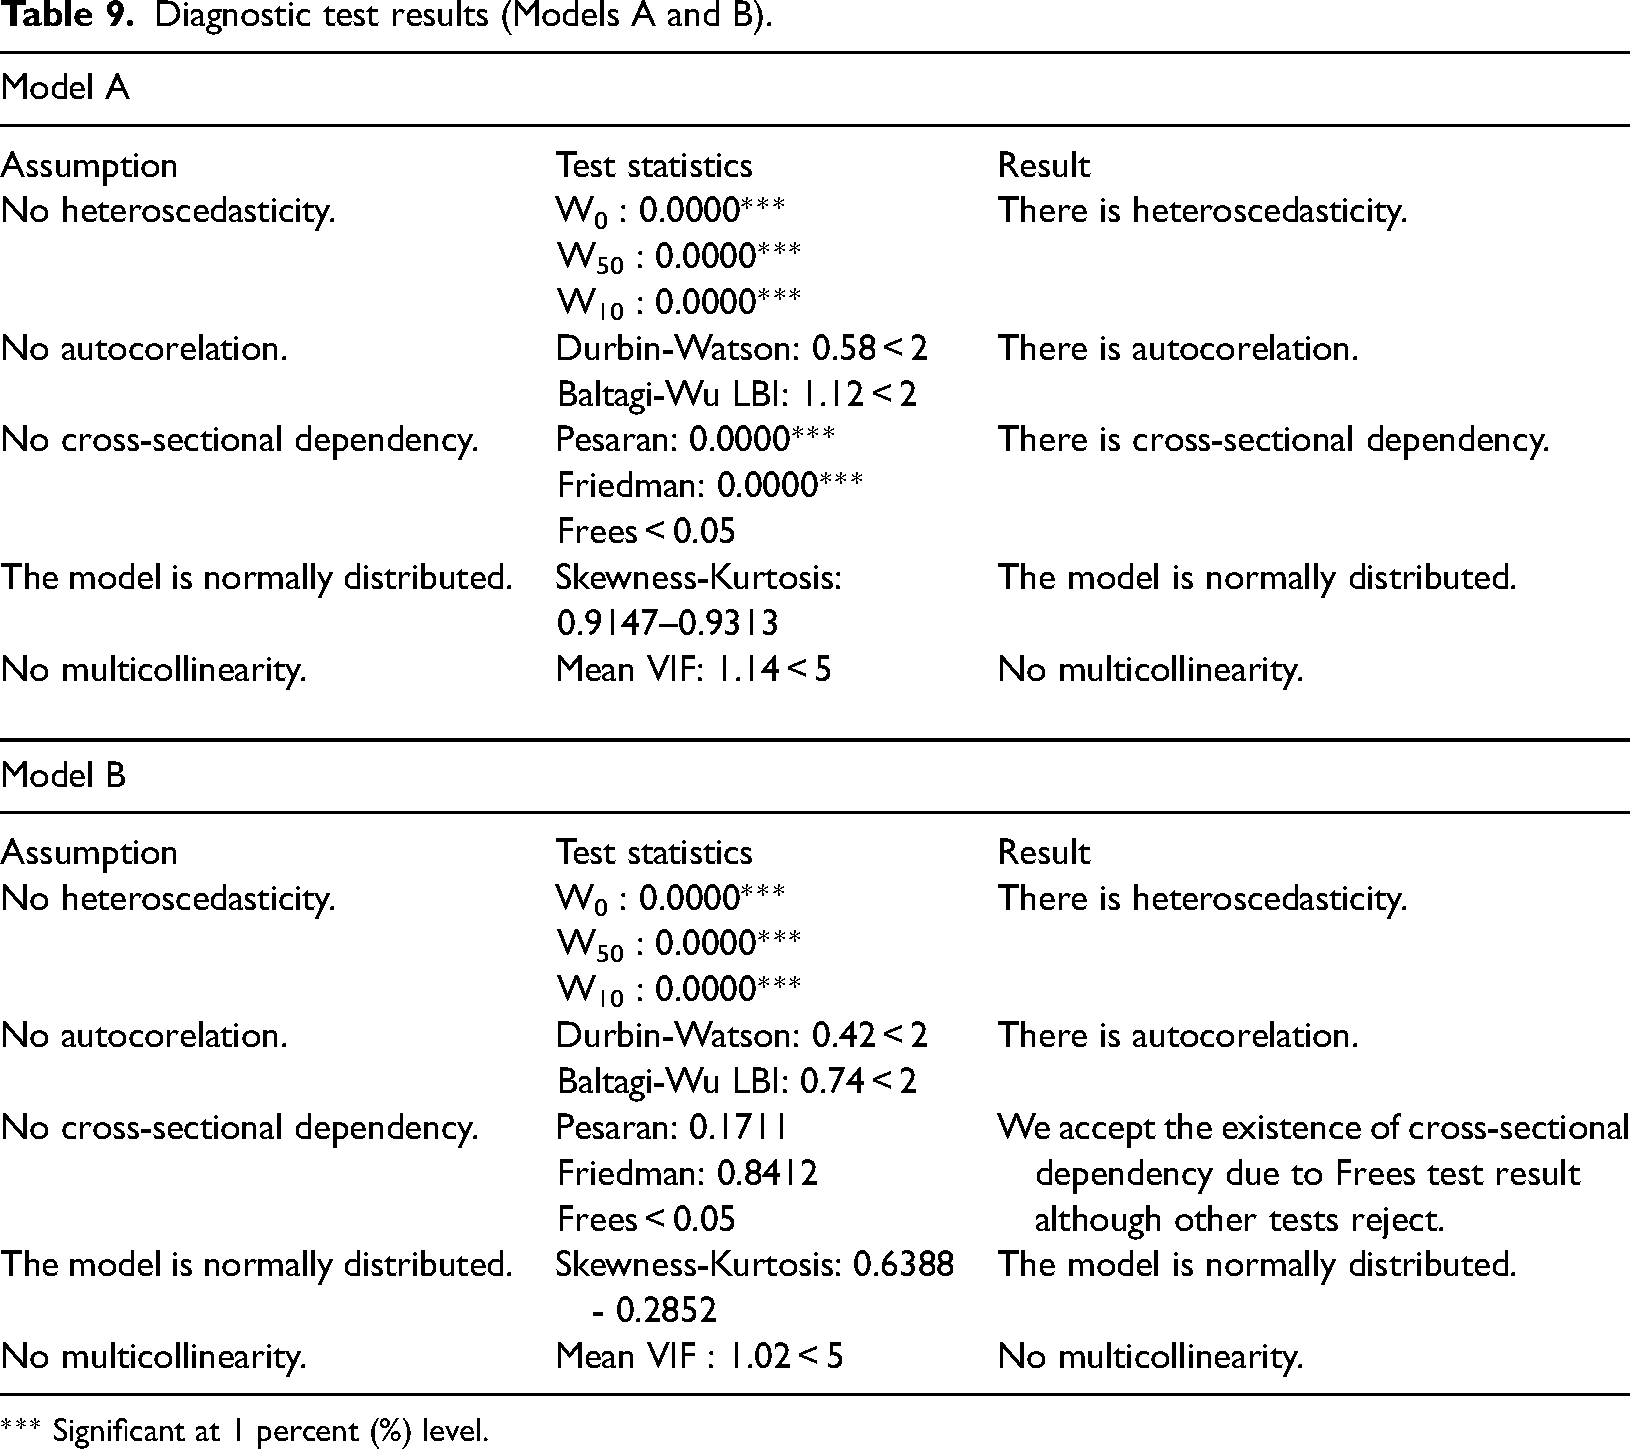
*** Significant at 1 percent (%) level.
After the diagnostic tests, we found that random-effect model and Driscoll-Kraay standard error estimator is suitable to perform the least squares regression analysis for the Models A and B. As mentioned before, Driscoll-Kraay estimator consists of estimations with resistant standard errors even in cases of heteroscedasticity, autocorrelation, and cross-section dependence. In Tables 10 and 11, we give the results from Driscoll-Kraay standard error estimator.
Driscoll-Kraay standard error estimator results (regression analysis - Model A).
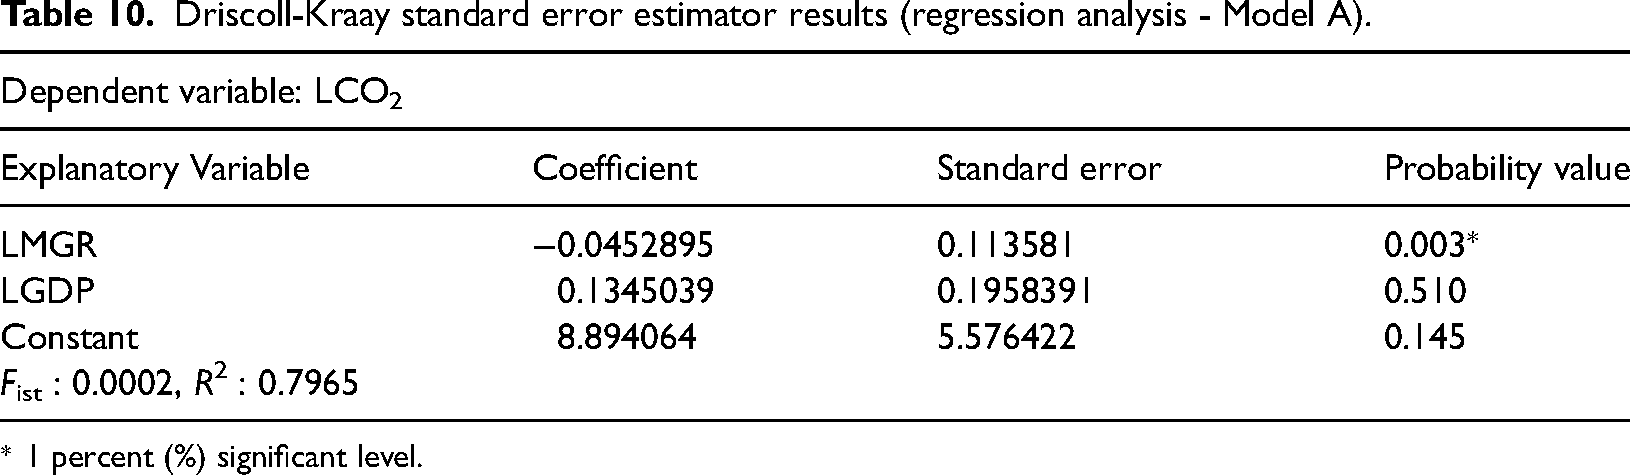
* 1 percent (%) significant level.
Driscoll-Kraay standard error estimator results (regression analysis - Model B).
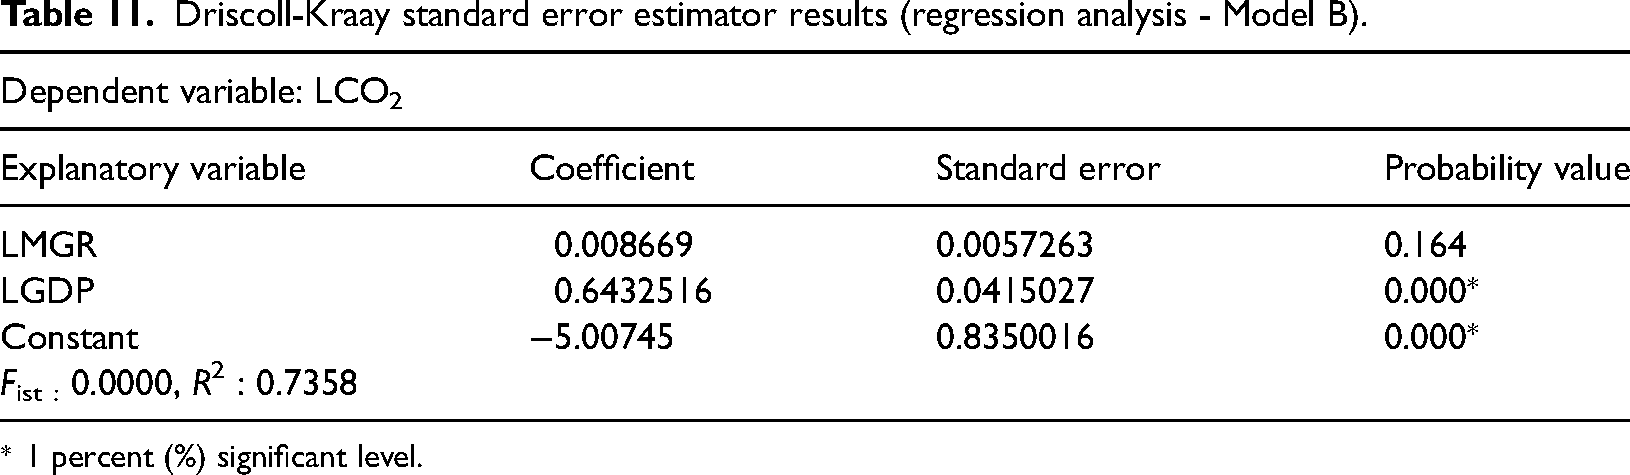
* 1 percent (%) significant level.
It is seen in the regression analysis findings that both models are statistically significant. In other words, we present strong evidence that both models are built correctly (Fist). In terms of coefficients, migration has a negative effect on CO2 in Model A and a positive influence in Model B (but insignificant). Moreover, economic growth increases the CO2 for both types of countries (insignificant in high-income countries). This finding shows that international migration reduces carbon emission in the high-income countries while it promotes carbon emissions in middle-income countries. This is not far from the category of people that migrate to both regions. The literate and socially inclined persons are likely to be more responsible and environmental quality conscious, and these are the kind of people that migrate to high-income countries, while in the case of middle-income countries, the international migration may likely contribute to the carbon emissions increase considering the development level of the countries and the categories of people moving into those countries. Our findings match the two groups in the literature. In our study for high-income countries, results overlap with the findings of Ma. 9 On the other hand, for middle-income countries, we found similar coefficient consequences with Gao et al., 33 Long et al., 12 Gao et al., 13 Morris, 14 Guoxia et al., 15 Aloa, 16 Qin and Liao, 17 Fan et al., 18 Shi, 19 and Birdsall. 20 However, the general opinion is that migration movements will increase environmental pollution. Our results for developed (high income) countries are contrary to this situation. This may be attributed to the level of development and human capital accumulation obtained in these countries, where the high-income countries are more developed with greater percentage of human capital than the middle-income countries. Human capital accumulation undoubtedly contributes significantly to technological development, innovation, and R&D efforts. Cleaner and more efficient technologies are expected to be developed as a result of these efforts. Therefore, the findings of this paper are not in line with expectations. 5 Furthermore, we support both the Malthusian approach (for middle-income countries) and the Boserupian approach (for high-income countries) to environmental pollution with our empirical findings. On the other hand, this situation shows us that CO2 emissions of immigrants can be reduced by taking some precautions and making relevant regulations. Consumption behaviors can be directed by adopting a sustainable consumption approach, using public transportation, taxes, or incentives. In addition, the high level of welfare and awareness, and the increase in the share allocated to the use of renewable energy significantly reduce the CO2 emissions.
Further, many middle-income countries are developing countries and do not have the scientific and technical expertise to make effective ecological assessments and develop environmental protection policies. Since accountability and sanction systems are not developed and inter-institutional coordination is insufficient, migration and development policies and environmental policies are often in conflict. Structural and bureaucratic constraints hinder the development of ecologically sustainable systems and the situation is further complicated by the migration. 32 Thus, it is possible for migration movements to increase environmental pollution in these countries, and supported by the results of our study.
Conclusion and policy recommendation
In this study, we examined the environmental pollution in high- and middle-income countries that receive high levels of immigrant. Before that, we looked at the literature on the subject and laid out the theoretical framework on the subject. In the empirical model, we selected migration movements as the explanatory variable and CO2 emission as the dependent variable, and investigated the period from 2010 to 2019. In addition, we used the ordinary least squares (OLS) method with Driscoll-Kraay standard errors after the diagnostic tests to ensure an appropriate model.
Studies have shown that there is no consensus in the literature for the relationship between migration/population growth and environmental pollution. While some researchers derive migration as a factor that increases environmental pollution, some researchers have concluded that migration reduces environmental pollution. In the other group, there was no significant relationship between migration and environmental pollution.
In our study, our findings within the scope of the research questions show that migration movements have positive and negative relationship with carbon emissions for both groups (respectively, middle- and high-income group). However, while the output of the high-income group is statistically significant, the output of middle-income group is insignificant. For the reference period, while migration movement reduces environmental pollution in high-income countries, it increases environmenral pollution in middle-income countries but at insignificance level. Our findings are compatible with the theoretical structure in the context of the impact of migration movements on the environment.
In the light of our findings, migration policies emerge as an issue that should be considered more in international negotiations on climate change. In addition to the advantages arising from migration movements, the negative effects of migration should not be ignored. The issue of what can be done to eliminate these negative effects or at least to reduce these effects is important. Consumption behaviors can be directed by adopting a sustainable consumption approach, using public transportation, taxes, or incentives. In addition, the high level of welfare and awareness, and the increase in the share allocated to the use of renewable energy significantly reduce the CO2 emissions. When more data is available, it will be possible to perform more detailed analyses in both macro- and micro-terms. In this way, it will be possible to be more directive for decision makers and policy makers to produce and implement policies for energy transition and carbon reduction. 51 Moreover, environmentally friendly growth technologies can help to reduce pollution in reference countries having both high growth rate and migrant/refugee population. Adoption of renewable energy sources and green innovation which are compactible with environmentally friendly growth will mitigate pollution and increase environmental quality awareness.
Finally, we would like to point out that this study is not without limitations. For example, this study includes the people who migrated as refugees and similar groups (which can be considered immigrants) together. However, when people migrate due to factors such as death, oppression, and violence, they become refugees/asylum seekers; when they migrate with the aim of increasing income and social welfare, they become migrants. 52 The consumption habits, environmental sensitivities, contributions, and harms of these two groups differ from each other. It is possible that migrants have higher education level and consciousness; while refugees have lower education and environmental awareness. Therefore, separating these two groups (reason of migration, age range, education level, etc.) will contribute to reaching more specific findings.
Footnotes
Declaration of conflicting interests
The author(s) declared no potential conflicts of interest with respect to the research, authorship, and/or publication of this article.
Funding
The author(s) received no financial support for the research, authorship, and/or publication of this article: This work was supported by the General Research Fund (12600718) of the Research Grants Council of Hong Kong.