
Abstract
The prior empirical studies indicate torusim sector as an engine of economic growth worldwide. However, the activities linked with the tourism industries create several environmental problems as they require massive energy consumption. This study empirically explores the influence of tourism sub-sectors, i.e., accommodation (ACC), travel (TSP), food and drinks services (FDS), and shopping and entertainment (SAE) on the environmental quality in China measured by different greenhouse gasses emission and air pollutants. The bound testing ARDL approach has been employed to analyze the relationships for the data from 2001 to 2019. We also account for globalization (GLBN), economic growth (RGDP), and energy consumption (ENG), to normalize the tourism-linked sub-sectors’ environmental effects. The findings revealed that greenhouse gas emissions, especially N2O and CH4, are highly caused by FDS activities related to tourism, whereas CO2 emission is mostly caused by the TSP sector in long-term. Likewise, FDS is the highest causing factor of air pollutants except for PM2.5, and the SAE sector is highly responsible for N2O and CH4 in long-term. Furthermore, all the tourism-related sub-sectors are positively affecting economic growth and energy consumption in long-term, while TSP and SAE sectors contribute higher to the energy consumption and economic growth, respectively. Surprisingly, globalization has been seen to be a significant cause of decreasing greenhouse gases and air pollutants. Finally, the causality analysis outcomes revealed that most of the tourism sub-sectors are significantly causing air pollutants and greenhouse gases. As evidenced by the empirical results, numerous policy measures are proposed for policy initiatives for China to promote its environmental quality.
Keywords
Introduction
The tourism industry (TRI) is a major contributor to a country's economy, constantly generating economic gains, and is one of the best job-creating factors in an economy. 1 According to World Tourism Organization report 2021, a total of about 12% of the world's GDP comes from the TRI and its related activities. Moreover, its importance for regional and national economic growth, products, culture, and services is revealed in the Sustainable Development Goals (SDG's), which include tourism-specific targets in SDGs 8, 12, and 14. 2 In recent decades, it has grown and diversified into one of the world's most influential and rapidly growing sectors. However, tourism activities mostly rely on energy from fossil fuels, such as gas, coal, and oil. Thus, some researchers argue that tourism may increase economic growth; however, it negatively influences the environment through greenhouse gas (GHG) emissions and other air pollutants. 3 This industry contributes to environmental deterioration and carbon dioxide (CO2) emissions in different ways, including goods and services such as lodging, food, rail and road transportation, shopping habits, and air travel. 4 Environmental degradation is a major global issue since the prospect of global warming threatens to pose a serious hazard to future generations.5,6 Several economies have reached a consensus to work together to reduce GHG emissions in an attempt to make the environment more sustainable.7,8 Some of these efforts have been directed toward achieving legislative approval for the Kyoto Protocol and the Paris Agreement. 9 However, TRI has several economic benefits, but its negative consequences outweigh its positives owing to environmental, cultural, and social challenges, 10 since it surges the level of energy consumption (ENG) that has long been acknowledged to have long-term consequences on the environment and economic growth in the economy.11,12
In this wise, China, the world's second-largest country, is one of the leading tourist destinations worldwide; due to the high quality of its tourism services, it has a strong local and international TRI business. 13 The great geographical diversity of China has been a notable tourist hotspot in the last few years. China placed twelfth out of 117 nations analyzed in the Travel and Tourism Competitiveness Report 2021, which evaluates the most competitive countries for travel and tourism. China welcomed 65.63 million international visitors in 2020, and the industry generated 6.65 trillion Yuan in revenue. In 2020, China's tourism sector generated 10.83 trillion Yuan in GDP, approximately 11.02% of GDP, and directly or indirectly employed 78.96 million people. However, according to Sharif et al. 14 and Irfan et al., 13 the environment quality in China is deteriorating as a direct result of a rise in the number of tourists, an increase in the ENG, and a higher per capita income. China is the largest emitting country of GHG emissions and has some of the highest emissions per person in the world. According to British Petroleum statistics, CO2 emission per capita of China stands at 7.37 tonnes in 2021, much higher than the many other emerging countries. China committed to reducing its GHG emissions by 65% below what they were in 2005 by the year 2030, and to achieve the carbon neutrality in the year 2060. Thus, it is essential to consider how one of the most swiftly growing Chinese industries affects the long-term health of the environment. Because TRI is one of the primary contributors to the expansion of China's economy, it would be beneficial to determine whether or not it has an impact on environmental quality. If it does, policies could be developed to halt the growth of GHG emissions and air pollutants, which can assist China in meeting its carbon-neutrality goals and promote its environmental quality.
The majority of the studies that have been conducted on the topic of how TRI impact the environment has concentrated on TRI as a whole rather than on tourism-linked activities, i.e., TRI sub-sectors. Whereas the TRI comprises different sub-sectors, each of which utilizes a different kind and quantity of energy, performs differently, and has diverse impacts on the economy and environmental quality. 4 For instance, traveling and hospitality services depend on energy for transport and regular services that harm the environment. Similarly, accommodation, drinking venues, cuisine, sports, recreation, and transportation, among others, lead to GHG emissions and air pollution through the usage of heaters, air conditioners, venting, lighting, grilling, serving and cooking, disposing, and trash management. 13 However, numerous empirical studies have already demonstrated that increasing tourism development will result in severe externalities threatening environmental quality,14–16 but the study regarding the environmental impacts of TRI sub-sectors is not present in the empirical literature, specifically for China. Against this context, we looked at the connections between four TRI sub-sectors and the emissions of three GHG and four air pollutants to fill in the gaps in research and find out how TRI affects the environmental quality at the sub-sector level in China.
Consequently, our research contributes to the prior literature on tourism, energy, and environment in several significant dimensions. Firstly, we investigated the impact of TRI on environmental quality of China at the sub-sector level by incorporating the different tourism-related activities. Secondly, the previous literature mostly considers CO2 emissions as a proxy to evaluate the environmental effects, overlooking the other prevalent GHG and air pollutants, such as NH3, SO2, PM 2.5, CO, and N2O. Though, CO2 emission alone does not represent the country's environmental condition. As a result, rather than taking CO2 as a measure of environmental quality, it is vital to include other GHG and air pollutants to analyze TRI's environmental implications more broadly. Thirdly, we also considered globalization (GLBN), energy consumption (ENG), and economic growth because assessing environmental impacts might be insufficient by excluding these elements. 14 It is significant from the policy perspective because increased GLBN makes governments more exposed to global transformation, makes traveling easier for tourists, and stimulates economic activities, which may be beneficial or detrimental to the Environment.17,18
The authors of this study believe that empirical findings will help the government and policymakers in China to consider the sustainable environment and economic growth for the current and upcoming generations, particularly regarding tourism and how it interacts with environmental and other economic variables. The remaining sections of this study are organized as follows; Section 2 reviews the empirical literature, data, and methods used in the study are presented in Section 3, Section 4 discusses the empirical findings, and Section 5 concludes the study with relevant policy suggestions.
Literature review
A review of the existing research shows that not many studies have been done on how tourism industry (TRI) affects economic growth and pollution, especially in a country like China. In this part, we will focus on previous research that used time series, panels, and different econometrics methods to find links between TRI, energy consumption (ENG), economic growth (ECG), and environmental quality. Previous studies15,19 have shed considerable light on the significant contribution that TRI activities make to creating employment opportunities and overall economic expansion. However, excessive ENG and resources extraction in the TRI has directed several researchers to explore tourism's related environmental aspects.1,20 In particular, the contribution of TRI to GHG emission and air pollutants, which are closely linked to people's day-to-day lives, has been of particular interest to these researchers.4,14,21
Tourism and energy consumption
TRI commonly consumes a significant amount of energy to provide travelers with the goods, services, and experiences they seek. Nevertheless, the ENG contributes to environmental pollution; it is required in the explored locations to provide amenities, support services, and transportation to tourists. 21 Many tourists coming to a place will help the economy grow, which will cause more people to use more energy, increasing carbon emissions.14,15,19 Because of this, it has been found that tourism-related energy use creates a lot of pollution, which hurts the environment in countries that depend on tourism. 20 By employing the quantile ARDL method, Sharif et al. 14 discovered ENG as a primary driver in China's TRI. Godil et al. 21 examined international tourism, ENG, and CO2 emissions using a time-series framework for Turkey. The author discovered that a rise in the amount of visitors has a significant bearing on the ENG, which in turn results in the emission of CO2. Godil et al. 22 empirically proved that shocks in TRI have a substantial influence on the ENG and environmental quality in China, after applying the quantile ARDL method. Isaeva et al. 23 also claimed that TRI triggers fossil fuels usage and damages the environmental quality. The author explained that tourism places a significant ecological burden on several countries. Analogously, Rahman et al. 24 conducted a multivariate study and discovered only a unidirectional relationship between the number of tourists visiting Malaysia and ENG.
Tourism and economic growth
In developing economies, TRI is used to create jobs, help small and medium-sized businesses grow, and boost economic output. 9 Several developing countries have tried to boost their economies by exporting goods, but this hasn't always worked out well because they aren't competitive enough. 1 Developing economies use TRI as an export to stay competitive and make money in other countries to pay off their trade deficit. 10 Literature trends show that there is either a one-way, two-way, or no cause-and-effect link between TRI and economic growth. 4 Scholars back the tourism-led growth (TLG) hypothesis in different countries worldwide. For example, Gounder 25 has shown evidence for TLG in a trivariate context for African countries. Onifade et al. 26 found unidirectional causality between TRI and economic growth in emerging seven economies. Kumail et al. 27 suggest that TRI causes economic growth in Pakistan. Bürgisser & Carlo 28 validated the TLG hypothesis in the case of Southern European economies. Adedoyin et al. 3 used data from tourism-dependent countries data and empirically proved TRI as a significant source of economic growth in the sample countries. Irfan et al. 13 also found that TRI is significantly promoting economic growth in China, and both are caused by each other. These empirical studies suggest the significant role of tourism in the economic development of an economy.
Tourism and environmental quality
The United Nations World Tourism Organization (UNWTO) reported that the number of tourists would continue to rise in the future across the globe. Even though TRI benefits many nations’ economies, it is harmful to the environment since it releases a significant volume of carbon dioxide into the atmosphere.10,24,27 A report published by UNWTO in 2021 found that TRI is responsible for 5% of all CO2 that humans create and that the industry causes 50–60% of CO2 emissions. Most researchers believe that the growth of the tourism sector significantly enhances the environmental deterioration worldwide because the industry consumes significant energy during its operations.4,13,20,21,23 The vast majority of energy consumption during tourism activities originates from fossil resources that contribute to the pollution of the air and the depletion of the ozone layer, both of which contribute to global warming. This argument about the adverse influence of TRI on environment quality is empirically proved by several researchers using different sample economies, i.e., Irfan et al. 13 for China, Kumail et al. 27 for Pakistan, Xiong et al. 4 for the United States, and Godil et al. 21 for Turkey. In addition, the latest study by Razzaq et al. 16 concluded that the expansion of TRI has a significant and harmful influence on the Environment quality in top-10 GDP countries. Because of the greater contribution TRI makes to GDP, TRI plays a vital part in expanding the global economy. 25 Destroying the environment harms us and future generations living on the earth after we are gone; therefore, we concur with Hussain et al. 29 that this generates a trade-off among the rise of tourism and the pressure on the environment. This is because things that make tourism and, by extension, GDP better tend to harm the ecosystem. Ahmad et al. 2 found that the number of tourists and energy used damaged the environmental quality across regions. A review of the research indicates that the results of previous studies of the relationships between the variables under consideration have been inconsistent and conducted on the aggregate influence of tourism sector on environmental quality in different countries or regions. In addition, most of the prior studies focused on carbon dioxide emission as an environmental dimension associated with tourism. However, there is a complete lack of information regarding the emissions of additional greenhouse gases, like N2O and CH4, and other air pollutants. Thus, our study is conducted to fill these gaps and to suggest sustainable development strategies for China and other emerging countries.
Data and research methodology
Data and model
China's Ministry of Culture and Tourism has identified five sub-sectors of the tourism industry (TRI): accommodation, food and drink, entertainment, travel services, and recreation. But there is nothing in the empirical literature about how these sub-sectors affect the environmental quality, especially in China. Razzaq et al. 16 investigated how the expansion of TRI affects the state of the environment in the top ten GDP economies. Despite this, it does not consider how other sub-sectors of the TRI affect the environmental condition. This does not indicate how much pollution is caused by the various sub-sectors of TRI. Moreover, many studies conducted panel datasets; however, according to Pesaran, 30 a panel data analysis does not reveal all the information about a single nation. As stated by the China Ministry of Culture and Tourism, we have segmented the TRI into four sub-sectors that are all closely tied to one another; (I) accommodations (ACC), (II) food and drinks (FDS), (III) transport (TSP), and (IV) shopping and entertainment (SAE).
Guesthouses, hotels, entertainment campuses, boarding houses, and other establishments run by the ACC sector are available for tourists. Small food stalls, restaurants, places to drink and dine, food stores, and other businesses associated with the food and drinks service industry make up the FDS sector. During their time in the host nation, tourists utilized many modes of transportation, including the road, rail, air, and waterways in the TSP sector. The service and entertainment (SAE) sector is comprised of businesses that assist tourists in activities such as shopping for services, products, and having fun. These also include sports, gaming, clubs, casinos, parks, and other similar establishments. The money that tourists spend in various sub-sectors of the TRI and on tourism-related activities significantly impacts energy consumption, economic growth, and environmental quality.
We used three greenhouse gases (GHG) emissions, nitrous oxide (N2O), methane (CH4), including carbon dioxide (CO2), and four air pollutants, including NO2, CO, SO2, and PM2.5 to account for environmental quality in China. Similarly, the gross domestic product (RGDP) real value is used to measure economic growth, and KOF globalization index is used as a measure of globalization (GLBN) extent. Energy usage (ENG) is the primary contributor to both GHG emissions and air pollution; thus, we included total primary energy consumption to examine its environmental consequences. Tale A1 in Appendix depicts the sources and explanation of all the variables employed in this study. The time series ranges from 2001 to 2019 for the analysis, subject to the most current data availability of the considered variables.
Following the findings presented by Xiong et al.,
4
we applied the general regression model, represented by Equation 1. Furthermore, in Equation 1, different variables could be substituted to investigate the relationships among dependent and explanatory variables.


Methodology
When conducting empirical research, it is essential to determine the integration level to which the variables are stationary. 13 To determine whether or not the variables are stationary, we employed the unit root tests advanced by Dickey & Fuller 31 and Phillips & Perron. 32 The study proceeds to the next step after determining the integration order of the variables, for example, stationary at the level or first difference. Next, Pesaran et al. 33 cointegration technique was applied to examine the long-term relationship among variables. If the calculated value of F statistics > the tabulated value of F statistics, there is a long-term relationship between the considered variables, and vice versa; however, we will only proceed further if there exists a cointegration among variables.
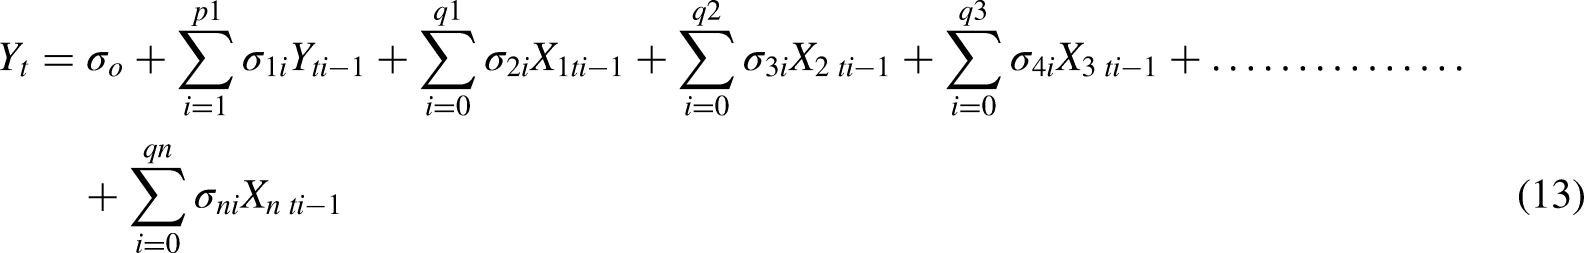
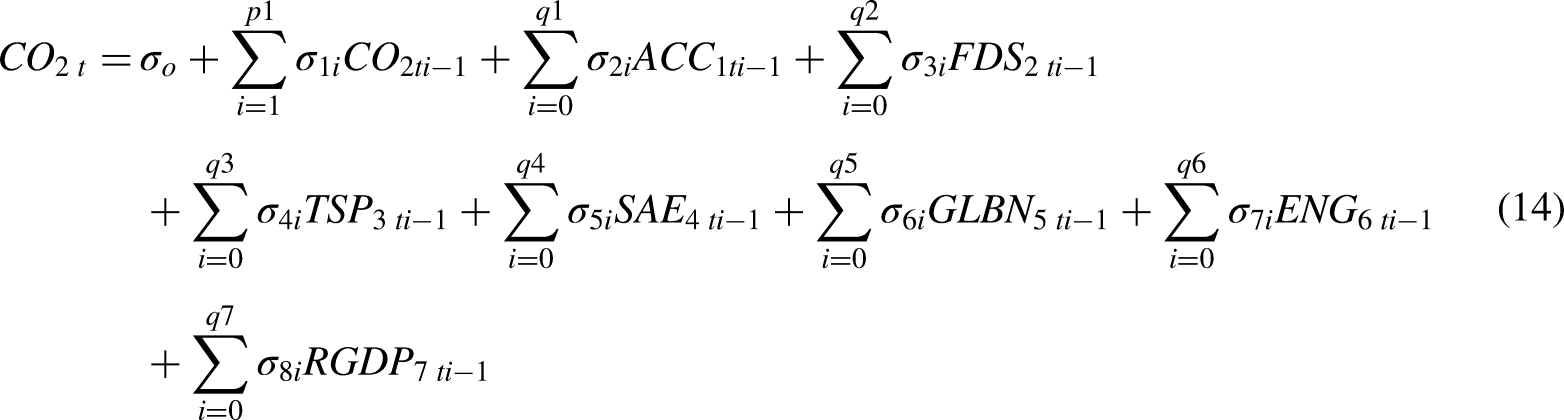
The Autoregressive Distributed Lag (ARDL) bound testing approach was utilized to investigate the long-term and short-term estimates between tourism-related sub-sectors, GLBN, ENG, GDP, emissions of GHG, and air pollutants. The direction of causation between these variables can be determined when the Vector Autoregressive (VAR) Granger causality method is applied.
13
The ARDL bound testing technique has several benefits over other methods, such as adjusting the serial correlation problem and choosing the right lags order.
4
Also, ARDL bound testing can be used for I(0) variables, I(1) variables, or a mix of both.
33
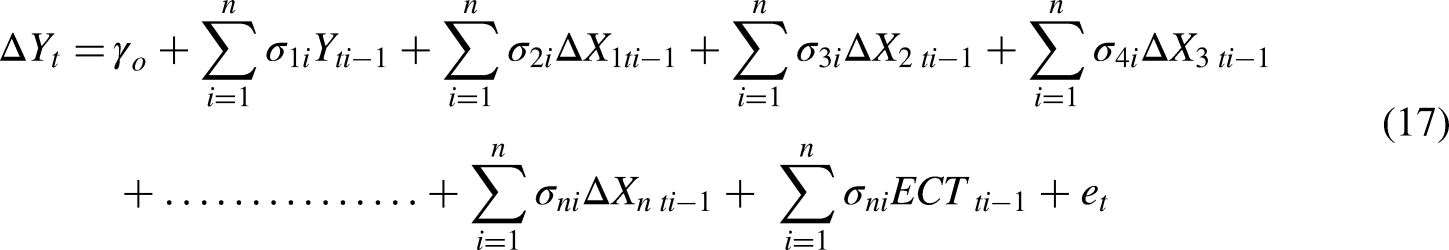
The bound test method is based on the idea that the variables of interest stay linked over time. Also, a linear transformation could be used to make an ECM, which can include both short-term and long-term dynamics in the model without losing the data.
4
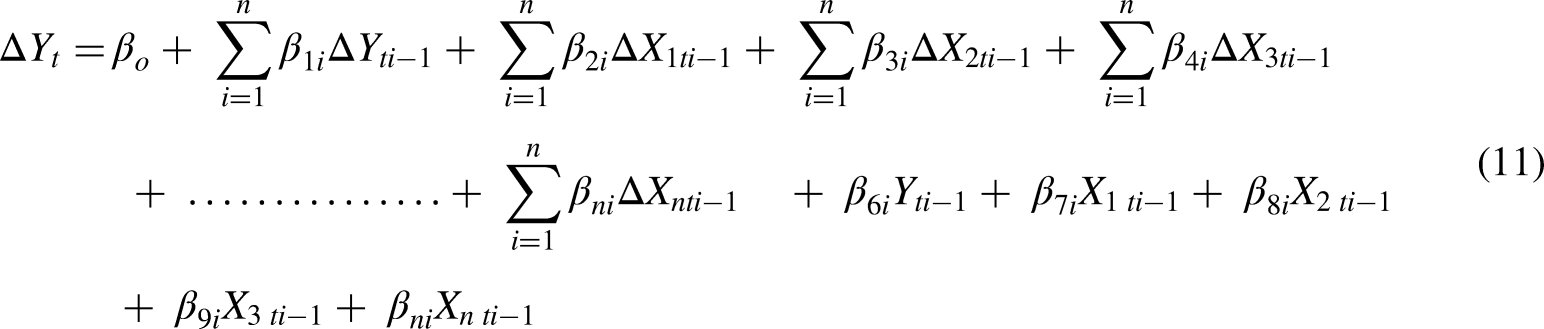
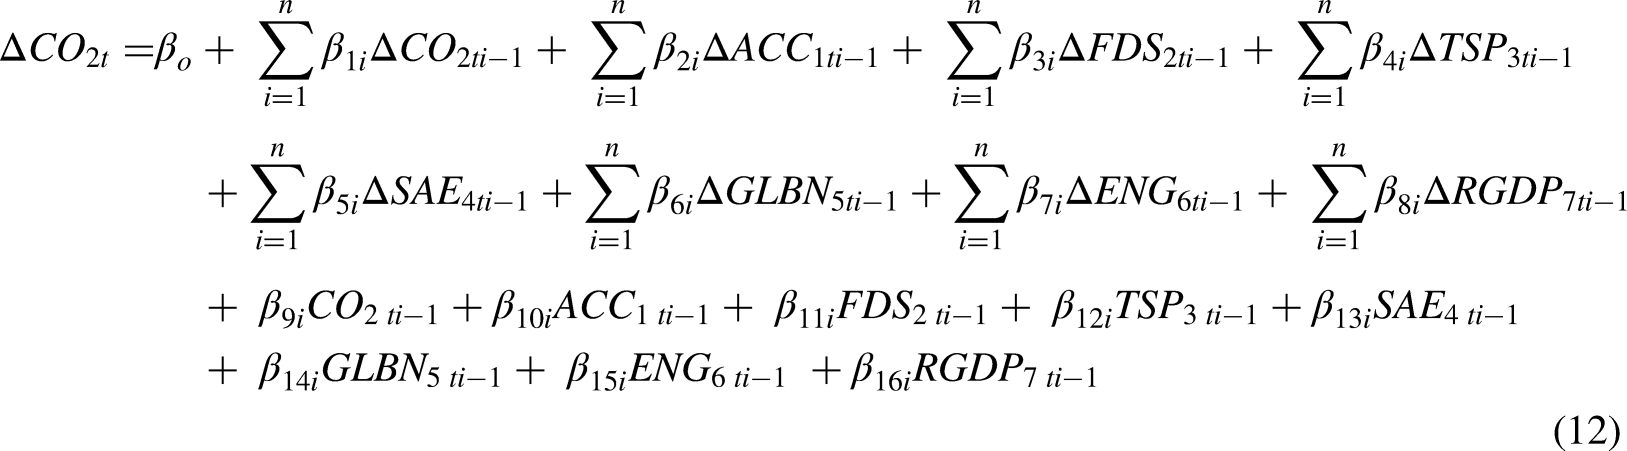
The way bound test technique is shown by using the Wald
34
technique on the ECM model in Equation 11 is as follows:


Empirical results
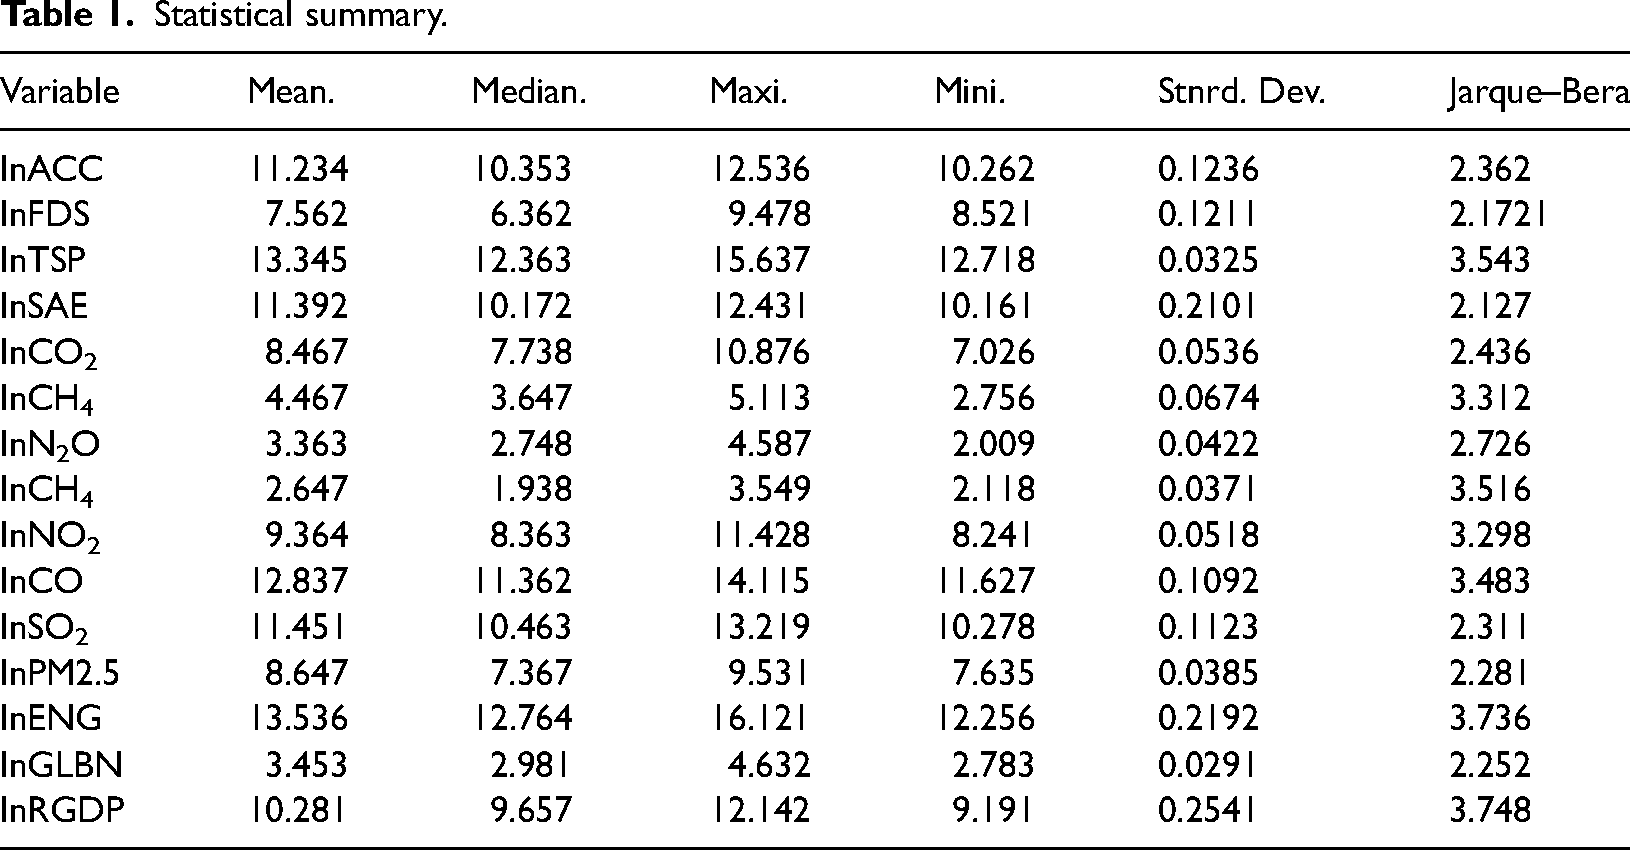
Before moving on to the estimate phase, each variable has been transformed into its logarithm form to endorse the normal distribution. The summary statistics of the variables are shown in Table 1. In time-series analysis, it is essential to be aware of the degree to which the variables are stationary. Thus, we began by doing the Phillips-Perron (PP) and Augmented Dickey–Fuller (ADF) tests in order to determine the degree to which the variables were stationary. According to the findings presented in Table 2, all of the variables were seen as stationary at level or at first difference. In the same vein, selecting the most appropriate lag length to use is essential for the ARDL framework. Because it performs better when the sample size is smaller, we decided to choose the proper lags using the Schwarz Information Criteria (SIC). 33
Statistical summary.
Unit root tests outcomes.
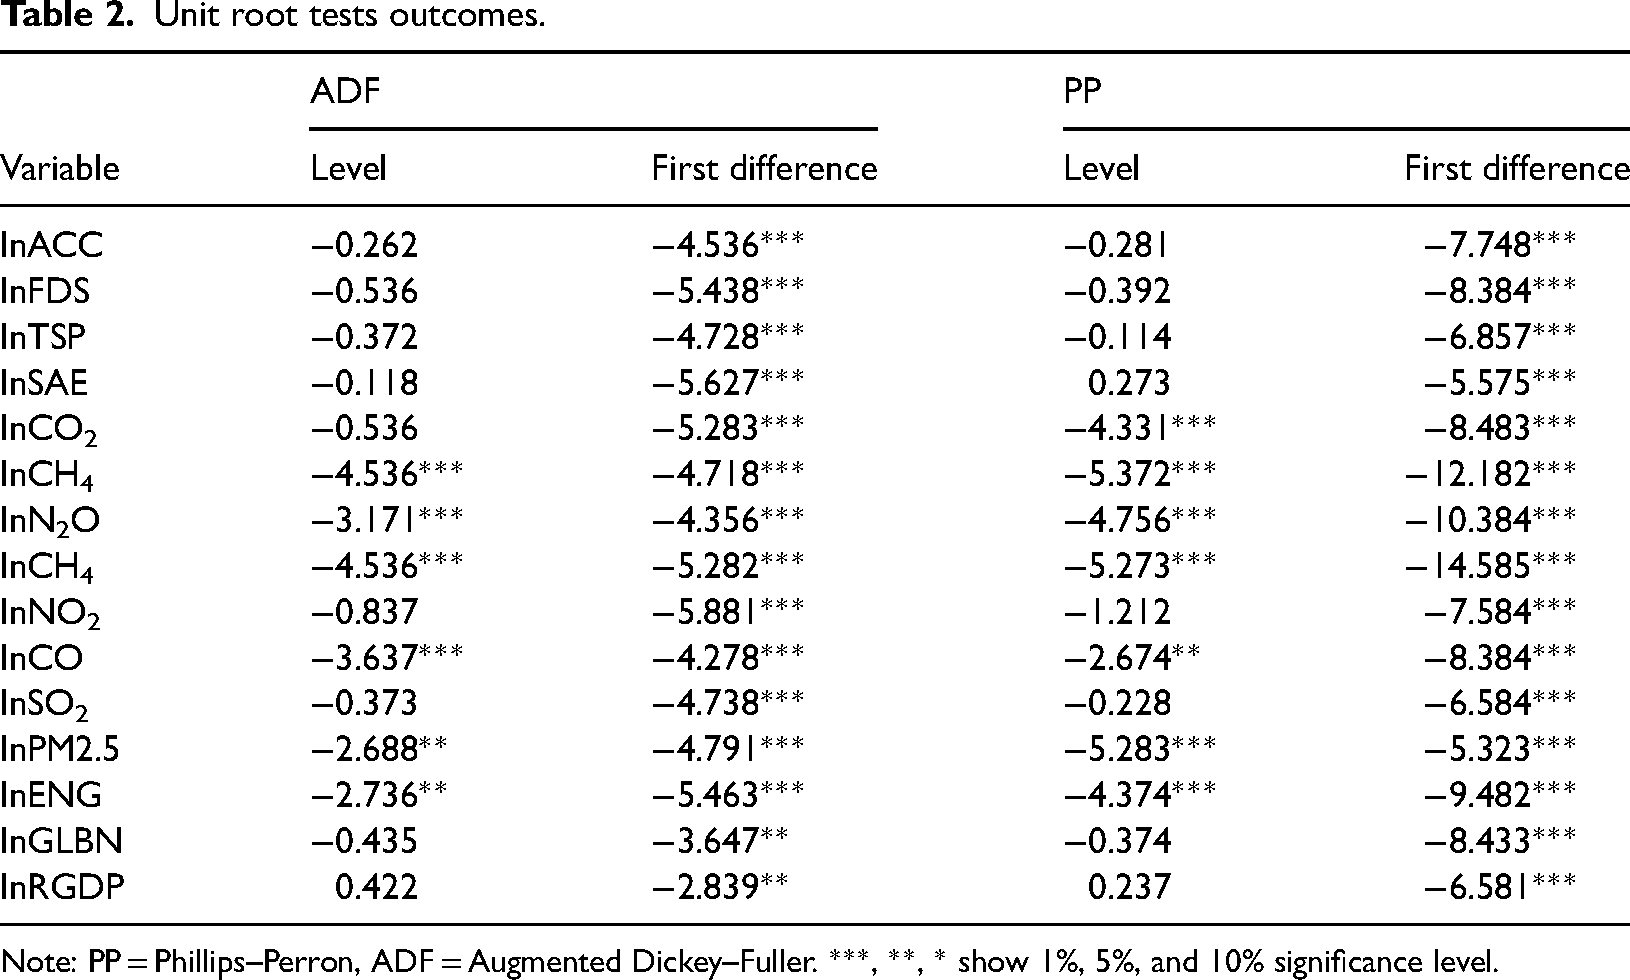
Note: PP = Phillips–Perron, ADF = Augmented Dickey–Fuller. ***, **, * show 1%, 5%, and 10% significance level.
The findings of the cointegration technique to bound testing between explanatory variables, GHG, air pollutants, RGDP, and ENG, are presented in Table 3. Since the computed values of F are higher than the upper bound critical values at both 1% and the 5% significance levels in all models, we can conclude that each of the nine estimated models has cointegration.
Cointegration outcomes.
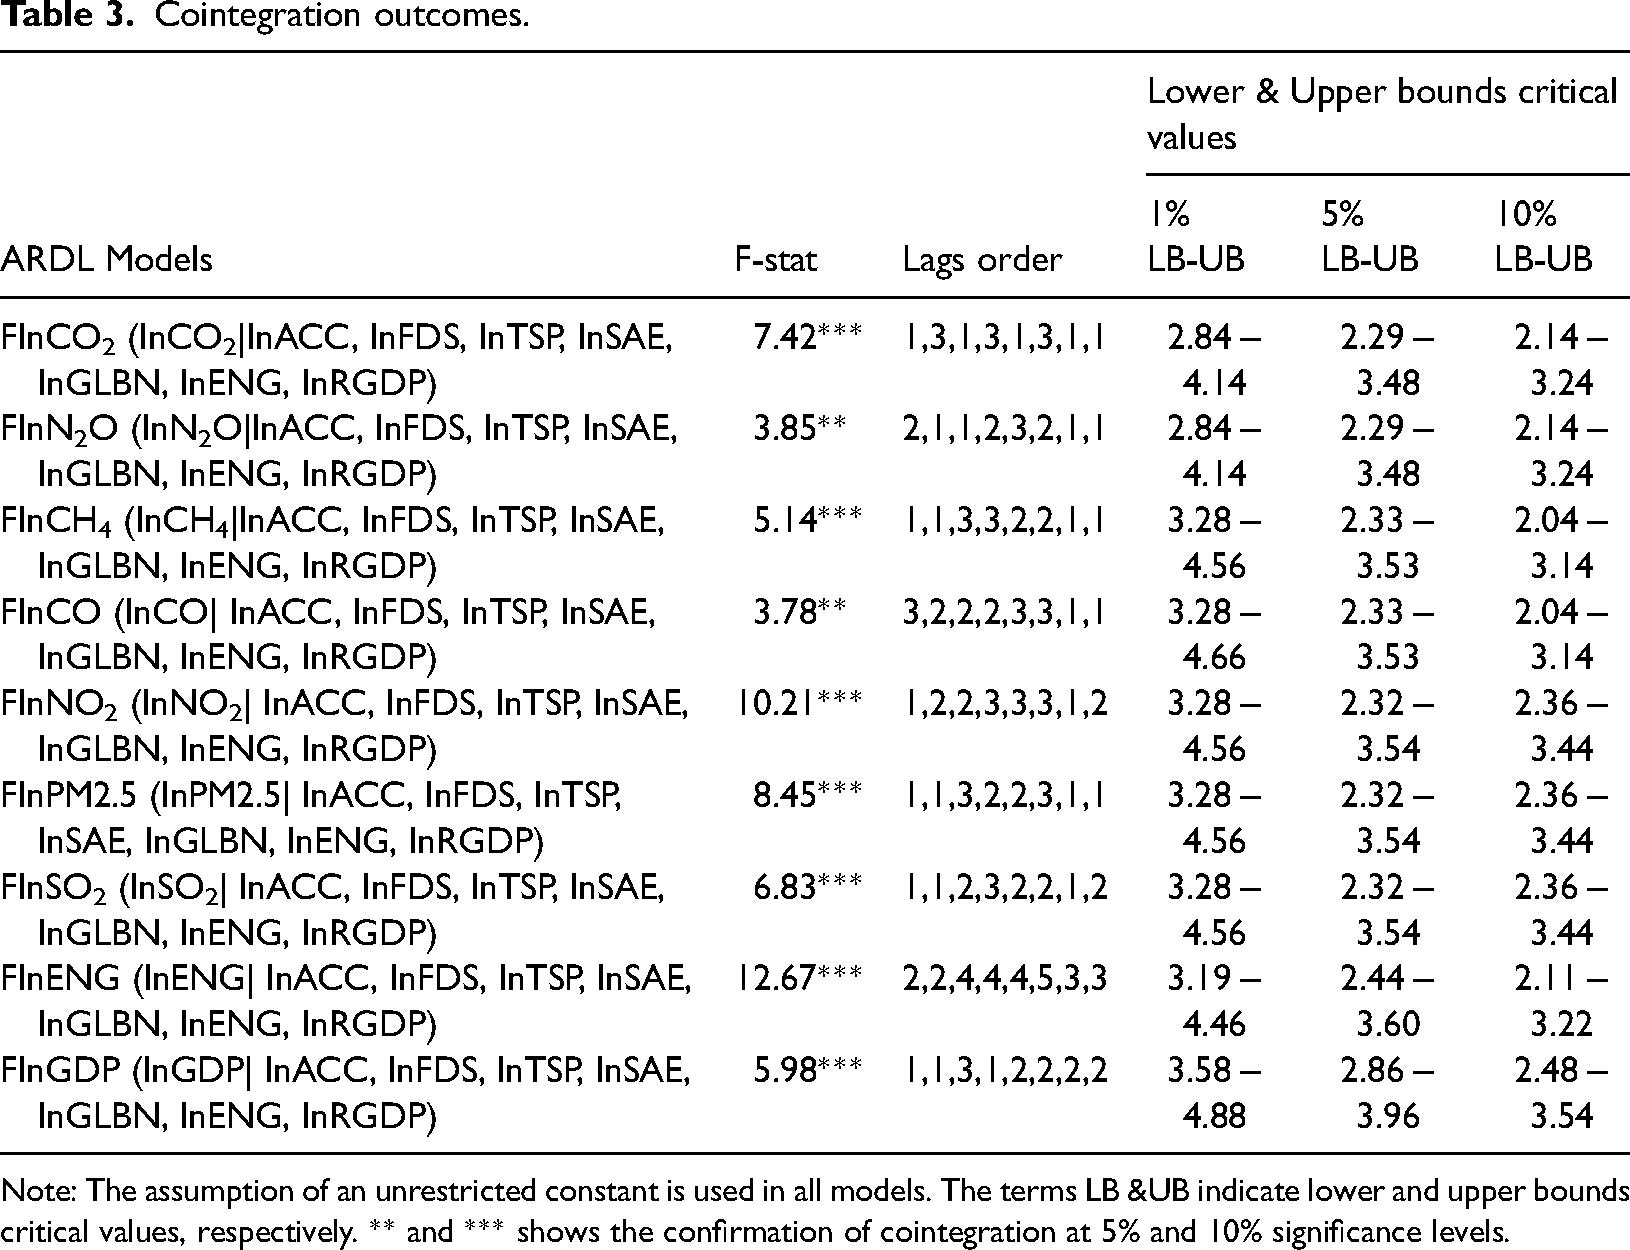
Note: The assumption of an unrestricted constant is used in all models. The terms LB &UB indicate lower and upper bounds critical values, respectively. ** and *** shows the confirmation of cointegration at 5% and 10% significance levels.
Estimates for the long-term and the short-term
The long-term and short-term outcomes of the Equations 2–10 are presented in Table 4. These equations demonstrate how various tourism-related sub-sectors and other factors influence the dependent variables. The diagnostic test data and ECM terms for each model are also presented in the panel at the bottom of Table 4. First, the findings indicate that a 1% rise in ACC affects a 0.22% surge in CO2 in long-term and a 0.12% increase in short-term. Similarly, a 1% rise in ACC leads to a long-term increase in N2O and CH4 emissions by 0.41% and 0.31%, respectively. However, a rise of 1% in ACC has no effect on N2O in the short-term, but it does affect CH4 in the short-term, increasing it by 0.09%. A rise of 1% in FDS will result in an increase of 0.17%, 0.59%, and 1.41% in CO2, N2O, and CH4 emissions, respectively, in the long-term, and 0.19%, 0.38%, and 0.63% in the short-term. On the other side, a 1% increase in TSP upsurges the CO2, N2O, and CH4 emissions by 0.29%, 0.16%, and 0.32% in long-term, respectively. However, in the short-term, TSP only affects CO2 by 0.24%. It is estimated that a 0.15% decrease in CO2 levels will result from a 1% increase in globalization (GLBN). While GLBN had no impact on CO2 or any other GHG, either in the short- or the long-term. In long-term, a 1% increase in ENG causes CO2, N2O, and CH4 emissions to rise by 0.61%, 0.23%, and 1.57%, and by 0.42%, 0.27%, and 0.83% in short-term, respectively. A 1% increase in RGDP has a long-term effect of decreasing CO2 emissions by 0.81%. While an increase in RGDP also increases the N2O by 0.48% and CH4 by 1.49% in long-term. In contrast, an increase in RGDP increases the CO2 by 0.32% and CH4 by 0.98% in short-term.
Long- and short-term outcomes.
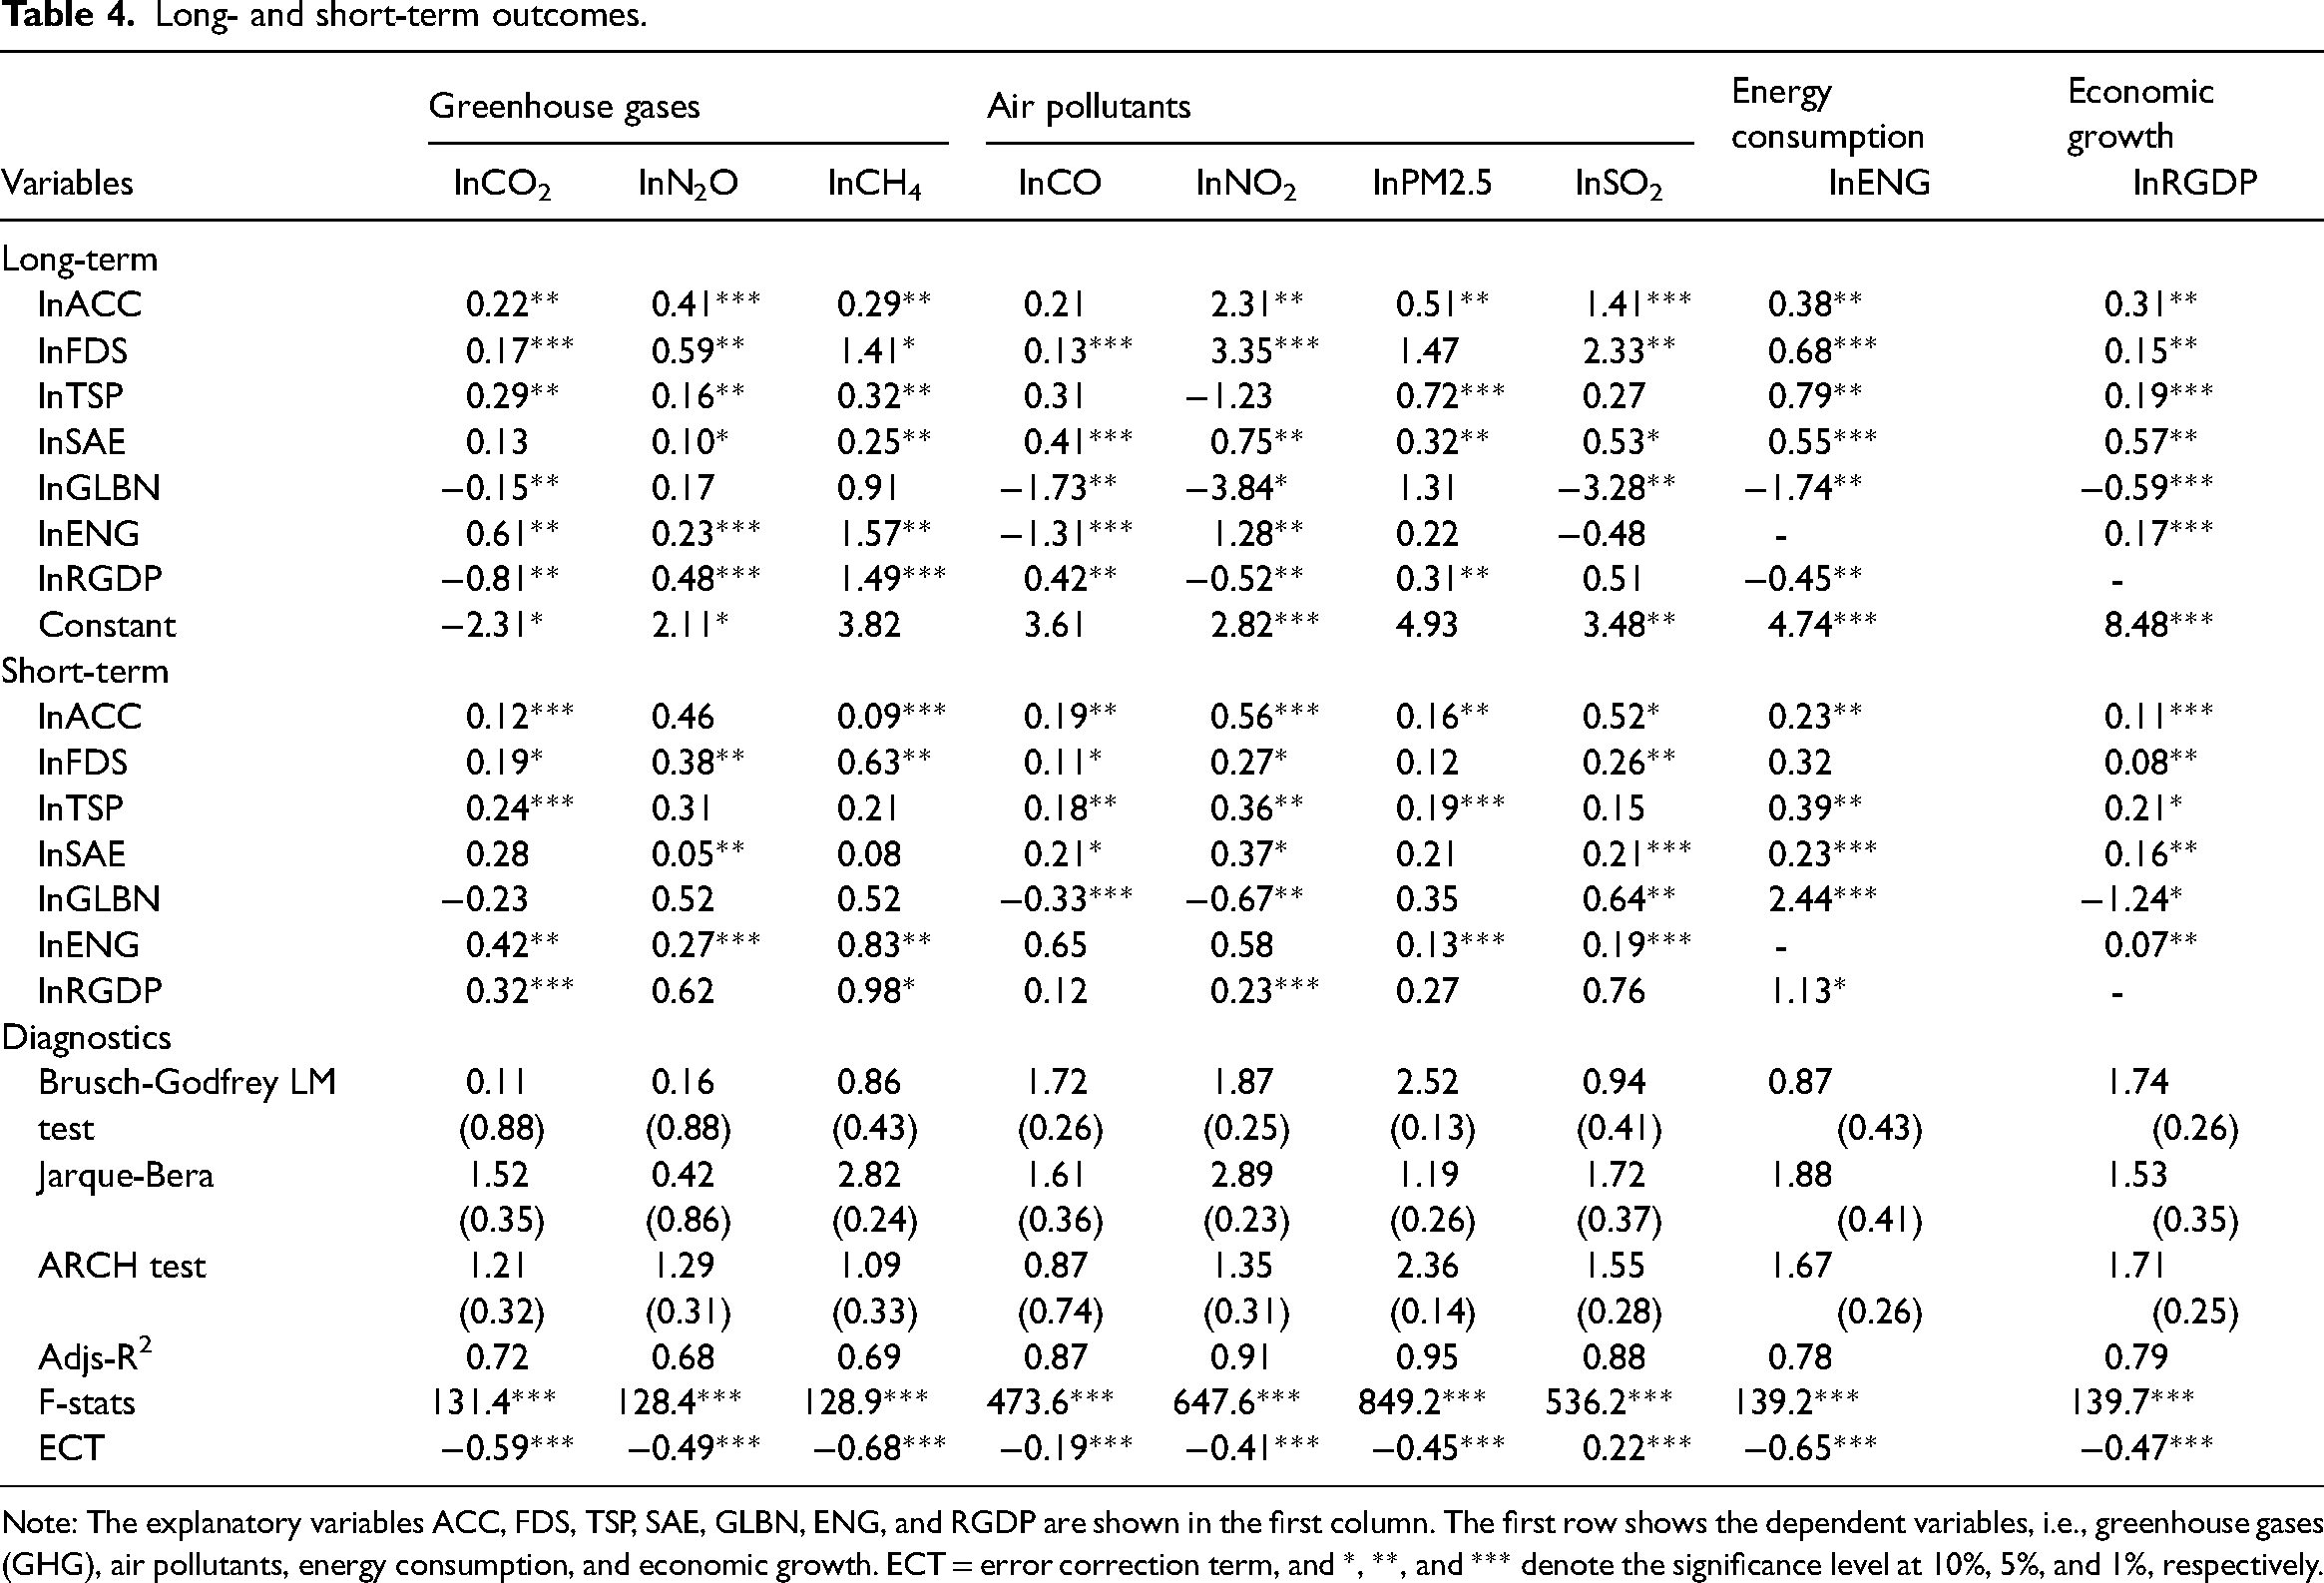
Note: The explanatory variables ACC, FDS, TSP, SAE, GLBN, ENG, and RGDP are shown in the first column. The first row shows the dependent variables, i.e., greenhouse gases (GHG), air pollutants, energy consumption, and economic growth. ECT = error correction term, and *, **, and *** denote the significance level at 10%, 5%, and 1%, respectively.
For the air pollutants models, outcomes in Table 4 demonstrate that an increase of 1% in ACC makes 2.31%, 0.51%, and 1.14% increase in NO2, PM2.5, and SO2 increase in the long-term, respectively, whereas do not affect the CO in the long-term. In the short-term, a 1% rise in ACC has resulted in a surge in the levels of all air pollutants. Similarly, a 1% increase in FDS positively affects the CO by 0.13% in the long-term, and 0.11% in the short-term. Likewise, a 1% increase in FDS significantly increases the NO2 and SO2 by 3.35% and 2.33% in long-term, and by 0.27% and 0.26% in short-term, respectively. However, neither the short- nor long-term effect of FDS on PM2.5 has been detected. An increase of 1% in TSP has a long-term impact of 0.72% on PM2.5, but an increase in TSP has no long-term effect on CO, NO2, and SO2 levels. In the short-term, increases of 0.18%, 0.36%, and 0.19% are seen in CO, NO2, and PM2.5 emissions, respectively, with a 1% increase in TSP. It was discovered that SAE had a large and positive effect on all air pollutants in long-term. A 1% increase in SAE increases the CO by 0.41%, NO2 by 0.75%, PM2.5 by 0.32%, and SO2 by 0.53% in the long-term. On the other hand, SAE is significantly and positively causing all air pollutants, except PM2.5, in short-term. In the long-term, a rise of 1% in GLBN makes CO, NO2, and SO2 levels decreased by 1.71%, 3.84%, and 3.28%, respectively. In the short-term, GLBN positively linked with SO2 while negatively affecting CO and NO2. The only air pollutant that the GLBN does not affect, either in the short-term or the long-term, is PM2.5. In the long-term, a 1% increase in ENG results in a 1.31% decrease in CO and a 1.28% decrease in NO2, while insignificant to affect these pollutants in short-term. In contrast, ENG is significantly affects PM2.5 and SO2 in short-term, but it does not have any influence on these pollutants in long-term. Looking at the long-term effects of RGDP, a 1% increase in RGDP increases the CO and PM2.5 by 0.42% and 0.32%, whereas NO2 decreases by 0.52%. The only air pollutant affected by RGDP in short-term is NO2, which increased by 0.23% with a 1% rise in RGDP.
Next, regarding the ENG model, it was revealed that every tourism-related variable is important and positively affects the ENG, both long- and short-term. The variable with the strongest influence on the ENG is the TSP variable, followed by FDS, SAE, and ACC. On the other hand, GLBN and RGDP have a negative effect on ENG in the long-term, but both have a positive effect in the short-term. Finally, the economic growth model demonstrates that ACC, FDS, TSP, SAE, and ENG all significantly and positively contribute to RGDP. However, GLBN harms RGDP both in the short- and long-term, with the short-term effect substantially more significant. To obtain reliable findings, several diagnostic tests are carried out. According to the statistics provided by the Jarque-Bera test, all nine models have normally distributed residuals. Furthermore, the F-statistics demonstrate the fitness of all models, and the adjusted R2 values demonstrate that the explanatory factors are the primary drivers of the change in the dependent variables. Both the Breusch–Godfrey and Breusch–Pagan–Godfrey tests indicate that none of the models exhibit serial correlation or heteroskedasticity. Additionally, the ECT terms in all of the models are negative and significant at 1%, which is in accordance with the assumption made by the ARDL technique. Following an impact, the ECM value indicates the rate at which the system must adapt to reach its long-term equilibrium state. 4
Granger causality
Table 5 presents the findings, which illustrate the pairwise Granger causality between variables to investigate the flow of causality between the variables. According to the findings, a significant unidirectional causality is running from ACC to N2O, CO2, SO2, CO, and ENG; whereas, there ACC is bidirectionally associated with NO2 and RGDP. Similarly, FDS is unidirectionally causing NO2, CO, and SO2, while bidirectionally to CO2 and ENG. There is unidirectional causality from TSP to CO2, NO2, CH4, PM2.5, ENG, and RGDP. A unidirectional causality is confirmed from SAE to CH4, N2O, PM2.5, SO2, and RGDP. Please refer to Table 5 for additional information on RGDP, ENG, and GLBN's causal effects on GHG emissions and air pollutants.
Granger causality results.
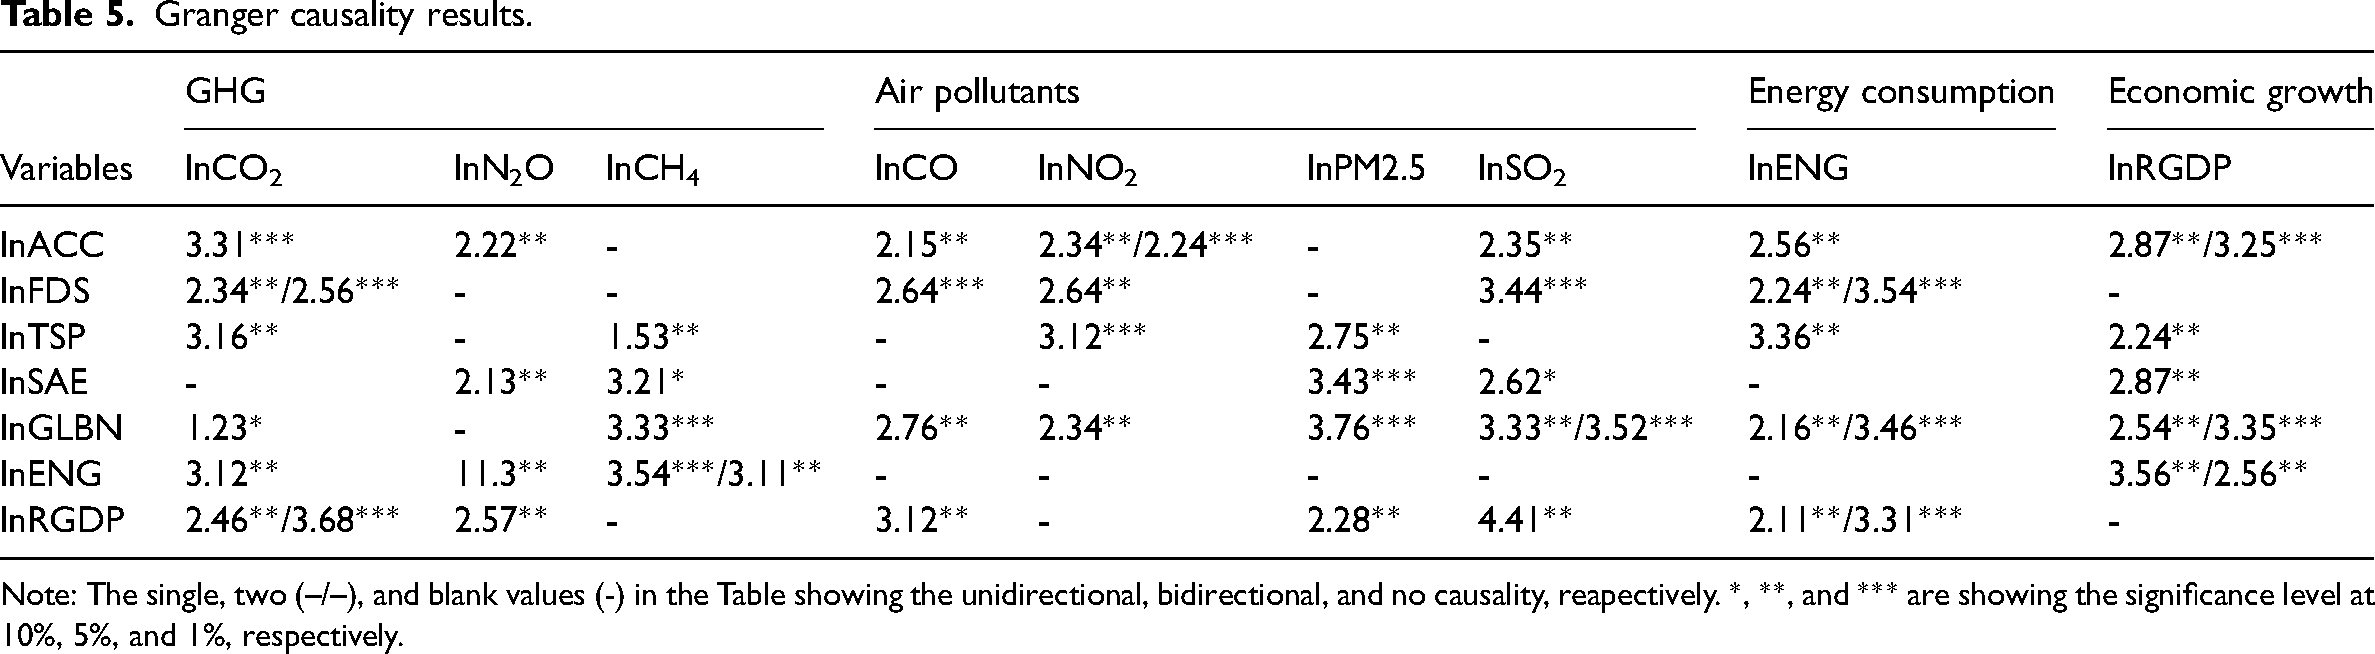
Note: The single, two (–/–), and blank values (-) in the Table showing the unidirectional, bidirectional, and no causality, reapectively. *, **, and *** are showing the significance level at 10%, 5%, and 1%, respectively.
Discussion
One of the most significant challenges people is confronted with nowadays is the deterioration of the environment. Researchers are looking at environmental degradation in every aspect of life to seek solutions. This is a result of many factors, including shifts in the global climate, snow that is melting, warming oceans, rising sea levels, and increased emissions of greenhouse gases. Over the course of the past several years, it has been gradually apparent that the tourism industry (TRI) has the potential to become a vital source of jobs and growth. As people's spending is going up, as a result contributes to a swift economic expansion. Nevertheless, an increase in tourism frequently has negative consequences on the surrounding ecosystem, particularly in terms of pollution. Even if the association among TRI and ecological quality is an important one, the researchers only looked at the effects of TRI on the environment via the lens of CO2 emission. This is unfortunate because the association among these two factors is vital for the upcoming generation. However, TRI is a substantial contributor to emissions of greenhouse gases (GHG) such as N2O and CH4, as well as other air pollutants like CO, NH3, PM2.5, NO2, and SO2. When considering solely CO2, the true scope of the damage to the environment is obscured.
Because long-term trends are the kind of factors that can be used for progressive policies, our study concentrates most of its attention on these trends. Similarly, previous research on the topic of the relationship between tourism and the environment has primarily focused on the effects that tourism has on the environment as a whole while largely ignoring the impacts of tourism-related sub-sectors like travel, accommodation, shopping, food, entertainment, and sports, that all have distinct effects on the emissions of GHG and other air pollutants. These aspects of the tourism sector are responsible for a significant amount of pollution and environmental damage since they use substantial energy. According to the “Energy Information Administration” (EIA) of the United States, businesses related to food and drink, sports, travel, and entertainment activities of tourists require a significant amount of energy to operate daily, which results in the emission of GHG, 35 as confirmed by our study. As per the International Energy Agency (IEA), the transportation sector accounts for the highest share of the total energy consumed in the tourism industry. Our findings support the concept of energy consumption theory that TSP sector is likely responsible for a significant portion of the overall GHG emissions produced by the tourism sub-sectors. We found that the TSP sector is accountable for more significant CO2 emissions than the other sectors operating within the same industry. Additionally, the Granger causality test discloses that there is only a unidirectional connection among TSP and CO2 emissions. This positive effect of TSP on CO2 aligns with the outcomes of Xiong et al. 4
The most energy is consumed by businesses that deal in food and drink since freezing and cooking require a significant amount of power. 36 According to our estimations, not only does the food and drinks business consume more energy, but it also contributes to the emissions of GHG and pollution in the air. The fact that FDS and CO2 can both cause each other has evidenced by the existence of two-way causation between these variables. The bidirectional causality between FDS and CO2 is since CO2 is required in the production of drinks. In order to heat buildings, cook food, provide light, and boil water, all tourism-related sub-sectors require distinct sorts of energy (natural gas, electrical, and fuel). Similar impact of FDS on CO2 emissions is reported by the study of Irfan et al. 13 Waste from wastewater, kitchens, the production of food, and gardens are the primary sources of CH4 produced by the tourism industry. Because of this, the FDS industry has a significantly greater impact on CH4 than it does on other greenhouse emissions, according to our findings. CH4 is also produced whenever garbage is burned to generate electricity and when coal, oil, or gas coal is manufactured. 37 We discovered a bidirectional connection between CH4 and ENG, which leads us to believe they are causing one another. In addition, it is estimated that the shopping and entertainment (SAE) sector, including sports, gatherings, festivals, banquets, shows, and large conferences, is insignificant to impact CO2 but has a significant impact on N2O and CH4 emissions. This is due to the fact that a limited quantity of CO2 released into the atmosphere by the SAE is the result of the low number of activities by the people for the creation of new venues, dining services, and the discharge of solid waste. The study of Irfan et al. 13 also revealed the same findings regarding the impact of tourism-related shopping and entertainment activities on environmental quality.
It is generally agreed upon that the consumption and production of energy are the two primary contributors to air pollution. The ACC, TSP, and SAE all significantly impact air pollutants, RGDP, and ENG, in both short- and long-term. However, we discovered that, except for PM2.5, only the FDS sector significantly and positively contributes to all air pollutants in both short- and long-term. Heating systems, thermostats, burners, compressors, textile drying, die pumps, swimming pools, insulation, microwaves, and charcoal grills are the primary contributors to CO in tourism. When these sources burn with low efficiency, CO is produced as a byproduct. In addition, CO can be generated in the SAE activities through the production of water rafts and skate game apparatus. According to our findings, it seems that the ACC, FDS, and SAE activities related to tourism are the significant causes of the emissions of NO2 since NO2 is a crucial ingredient in the production of beer. Still, you may also find it at most pubs, casinos, and restaurants.
SO2 is primarily produced in the hospitality industry by a variety of sources, including cook burners, gas, boiling, and heating processes. The consumption of fossil fuels, fertilizers, steam boilers, toxic cleaning products, and the distribution and production of food are the major causes of SO2. For example, to keep vegetables, dried fruits, drinks, alcohol, and snacks useable and prevent germs, SO2 is added to these products as a preservative and antioxidant. Granger causalities originating from the tourism industry and the ACC, FDS, and SAE sectors contribute significantly to the total amount of SO2 emissions. Similarly, SO2 in tourism-related activities is also caused by the combustion of oil and energy utilization. According to the findings of our study, all of the other tourism sub-sectors (except SAE), such as ACC, FDS, and TSP Granger cause ENG, which demonstrates that they depend on the ENG. Similarly, there is evidence of a causal effect from tourism sub-sectors to RGDP, which lends further credence to tourism-led economic growth. The bidirectional causality among ENG and RGDP demonstrates that although ENG is vital for economic growth, economic growth is equally significant for the energy production, as explained by Zhen et al. 12 for European economies. Similarly, in long-term, GLBN negatively impacts ENG and the levels of NO2, CO, SO2, and CO2. This exhibits how GLBN makes it feasible for China to import knowledgeable people and up-to-date technology to replace outdated methods, mainly in the energy sector. Similar findings regarding the impact of GLBN are revealed by Ullah et al. 17 for OECD economies. Although various initiatives have been taken to cut emissions of GHG and other pollutants, there are still 97 million people living in unsafe pollution levels. 38 These pollutants led to the production of ozone as well as smog, both of which made it difficult to see outside. Because of this, our findings are consistent with those of the EPA and the IEA, demonstrating that the tourism industry in China is also to blame for the damage done to the environment.
Conclusion and suggestions for future policy
Endorsing environmental quality is becoming a significant concern for almost all global economies. A massive rise in both air pollutants and GHG emissions has become a substantial problem for China, as the nation stands at the top of the list worldwide. On the other side, China's tourism industry (TRI) has experienced significant expansion over the past several years. Due to recent reforms and openings, it is now playing a major role in the country's economic growth. Thus, to keep its enterprises operating, the TRI consumes a substantial amount of energy, which is detrimental to the environment's health. Therefore, conducting an inclusive study of how the tourism industry impacts the environmental quality in China is essential, as it is vital for the related institutions. At the same time, formulate regulations for more sustainable and environmentally friendly economic growth.
This research aimed to determine the influence of various sub-sectors of the tourism industry on the environmental quality in China using the ARDL method for 2001–2019. The study's findings indicate that the TSP and ACC sectors are responsible for higher emissions of CO2 than the FDS sector, while the SAE sector does not have any effect on CO2 in long-term. Similarly, tourism-related FDS activities are a highly causing factor for the emission of N2O, NO2, SO2, and CH4 than any other TRI sub-sector. The majority of these emissions are brought on by food processing, which includes freezing, disposing, and cooking. In addition, other gases such as CO2 and SO2 are consumed in producing different kinds of food. The TSP sector also showed a significant to increase in the emissions of CO2, N2O, CH4, and PM2.5 in long-term, although the increase in PM2.5 is the most significant and higher. The SAE sector significantly contributes to the emissions of CH4, N2O, and all other air pollutants in the long-term, except for CO2.
Notably, our research revealed that each of the four sub-sectors of the tourism industry positively contributes to ENG. Additionally, research results indicate that tourism activities allow the economy to expand, which causes more energy to be utilized, both of which are detrimental to the environment. However, energy consumption cannot be held solely responsible for all of the emissions of GHG and air pollution created by the tourism industry. It includes activities such as dumping, the direct use of cleaning chemicals, the elimination of wastes, and the direct use of natural gas. We also exposed that globalization has an adverse impact on CO2 and the majority of air pollutants, including SO2, CO, and NO2. This proves that China, as a consequence of globalization, is engaging in technological innovations with international allies. This contributes to the development of modern methods for reducing pollution in the environment through the latest technology.
The statistical findings of this study provide a better grasp of how to cut down the environmental pollutants at the sub-sector level. The stakeholders in the tourism industry have a significant opportunity to make an optimistic influence on the state of the environment by providing appropriate training and incentives for their staff to reduce their energy consumption and maintain the quality of their equipment. The emissions created by tourism can be reduced by making more efficient use of energy and investing in initiatives that generate clean energy. Sensors for air pollution and greenhouse gases are two examples of recent technological advancements that can reduce emissions in the ACC, FDS, TSP, and SAE sectors. By utilizing non-hazardous cleaners and air fresheners, the ACC industry may be able to reduce the amount of emissions they produce. Additionally, the SAE sectors might contribute to environmental improvement by promoting the acquisition and development of products and services that are friendly to the environment. Responsible shopping can be a beneficial strategy for decreasing environmental damage if it is done in a way that prioritizes the selection of products that have been independently validated as being kind to the natural world.
The present government of China has established a target date of 2030 to achieve the highest level of CO2 emissions. After that, there will be a gradual decrease in CO2 emissions, and the country will reach carbon neutrality in 2060. China must establish environmental regulations and programs founded on market principles to accomplish these objectives. Putting a price on carbon and establishing a system for trading emissions are examples of market-based initiatives. The existing government policies (centralized control measures) that China utilizes to regulate pollution caused by greenhouse gases are insufficient to accomplish the targets for lowering pollution to the desired levels. Greenhouse gas emissions are directly charged under a pricing system that accounts for carbon, and enterprises are subject to fines for each tonne of emissions they generate. Under the cap-and-trade structure, a selected group of companies will receive an allotted number of emission exemptions each year. This set of companies will have been picked in advance. There is evidence that both of these tactics, in addition to bringing in money for the government and supporting firms in locating innovative technology, are effective and function better than others. 39 Putting a price on carbon would be an effective means of reducing emissions of greenhouse gases and would allow China to meet its emission reduction targets. However, the carbon price needs to be determined by considering the emitters’ attributes. In addition, it would assist China in getting back on track with the rest of the globe regarding the issue of climate change. Previous studies have not inspected the consequences of tourism on the environment from a subsectoral perspective, which provides a better basis for developing sustainable policies. However, no research can ever be 100% accurate; the material we used came from various sources. While we were focusing on the many sub-sectors of the tourist industry, we overlooked the significance of tourism services like recreation, sightseeing, and catering. These are all vital components of the tourism sector. Forthcoming researchers may choose to include these sectors and apply a different method, such as Quantile ARDL, to examine the same data in order to acquire a more in-depth understanding of the situation.
Footnotes
Acknowledgments
This work was supported by the Chinese Society for Technical and Vocational Education. “Research on the Industrial Logic of World Vocational Education Development and the Regional Coordination Strategy of High-quality Development of Vocational Education in the New Era” (SZ22C08). Shandong Provincial Key R&D Plan (Soft Science Project) “Shandong Province Regional Digital Economy Development Level Evaluation System Innovation Research” (2022RZB02013).
Declaration of conflicting interests
The author(s) declared no potential conflicts of interest with respect to the research, authorship, and/or publication of this article.
Funding
The author(s) received no financial support for the research, authorship, and/or publication of this article
Appendix A1. Description of variables
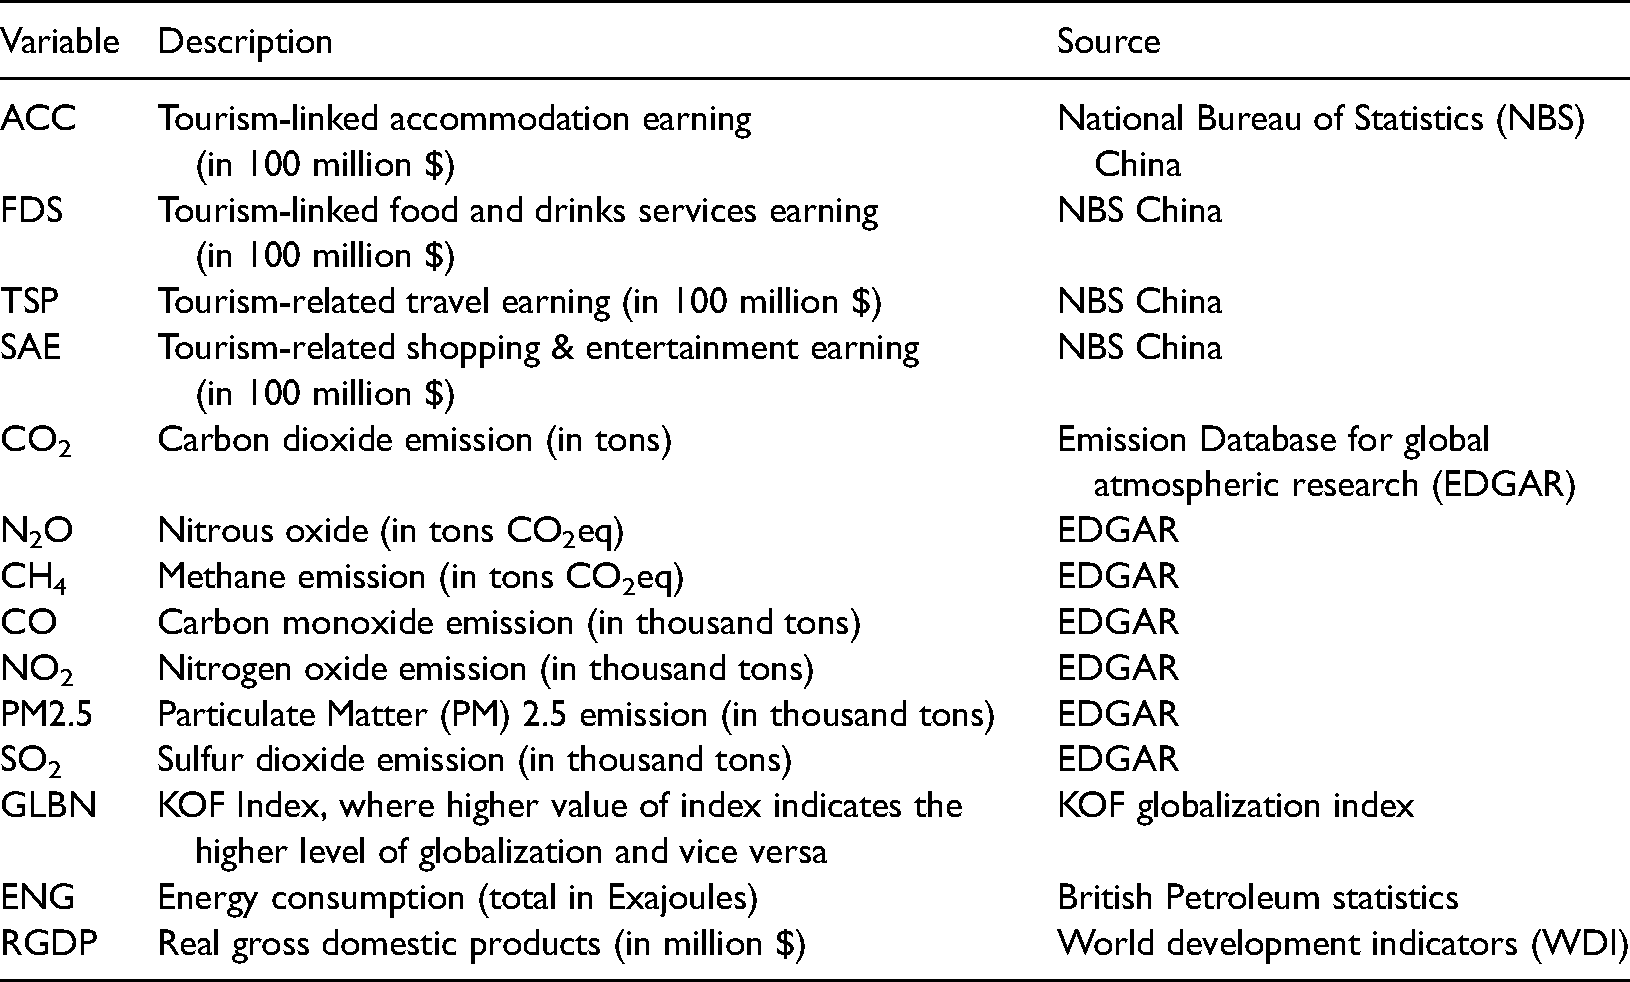
| Variable | Description | Source |
|---|---|---|
| ACC | Tourism-linked accommodation earning (in 100 million $) | National Bureau of Statistics (NBS) China |
| FDS | Tourism-linked food and drinks services earning (in 100 million $) | NBS China |
| TSP | Tourism-related travel earning (in 100 million $) | NBS China |
| SAE | Tourism-related shopping & entertainment earning (in 100 million $) | NBS China |
| CO2 | Carbon dioxide emission (in tons) | Emission Database for global atmospheric research (EDGAR) |
| N2O | Nitrous oxide (in tons CO2eq) | EDGAR |
| CH4 | Methane emission (in tons CO2eq) | EDGAR |
| CO | Carbon monoxide emission (in thousand tons) | EDGAR |
| NO2 | Nitrogen oxide emission (in thousand tons) | EDGAR |
| PM2.5 | Particulate Matter (PM) 2.5 emission (in thousand tons) | EDGAR |
| SO2 | Sulfur dioxide emission (in thousand tons) | EDGAR |
| GLBN | KOF Index, where higher value of index indicates the higher level of globalization and vice versa | KOF globalization index |
| ENG | Energy consumption (total in Exajoules) | British Petroleum statistics |
| RGDP | Real gross domestic products (in million $) | World development indicators (WDI) |