In this research, an experimental and computational analysis of a novel hybrid vertical axis wind turbine (VAWT) arrangement has been performed. We suggest an innovative VAWT design that has a high power coefficient and self-starting capability. The inner side of the proposed hybrid system has been integrated with the H-rotor turbine with cambered blades, which demonstrates strong self-starting capabilities at various azimuths. Three NACA0018 airfoil blades are mounted on the outside of the proposed hybrid wind turbine, while three DU 06-W-200 airfoil blades are installed on the inside. Based on a similarity analysis, a scaled-down model was developed, and performance characteristics such as the output power, power coefficient (), dynamic torque coefficient (), and static torque coefficient () were determined. An existing hybrid VAWT and a typical H-rotor Darrieus design were also examined for comparison. The highest for the proposed hybrid design was found to be 0.486 at a tip speed ratio (TSR) of 3, while the H-rotor Darrieus’ maximum value was 0.42 at a TSR of 2.62 and the existing hybrid VAWT’s value was 0.41 at a TSR of 2.5. Positive values at all azimuths demonstrate that the proposed hybrid wind turbine can start entirely on its own. In comparison to the existing H-rotor and hybrid VAWT, this novel hybrid system has shown enhanced performance parameters (, , , output power) by around 11%–13% over a wide range of wind speeds.
Due to global warming and the rapid depletion of fossil fuels, sustainable power sources including wind energy have acquired significance. The development of wind energy technology has grown significantly owing to its safe and long-lasting solution.1,2 The total installed capacity of wind energy technology at the end of 2016 reached 487 GW (4% of worldwide electric power) and is expected to meet approximately 18% by 2050.3,4 The wind’s kinetic energy may be changed into electricity using a wind turbine through its generator.5 Horizontal axis wind turbines (HAWTs) and vertical axis wind turbines (VAWTs) are the two major categories of wind turbines. Although HAWT is well developed and used in large-scale energy projects; however, VAWT has substantial advantages such as low noise pollution, independence of the yawing mechanism, design simplicity, low manufacturing cost, and ability to withstand higher winds.6 In terms of aerodynamic forces, VAWT can be further divided into Savonius and Darrieus wind turbines.7 Darrieus turbines have better performance, low cost, and can extract more wind energy per unit area than Savonius turbines.3
Several in-depth studies of Darrieus VAWTs have been conducted over the last few years. Howell et al.6 performed experimental testing and computational fluid dynamics (CFD) simulation of a small-scale Darrieus turbine for the wind speed of 4.31 and 5.07 m/s. A reasonable agreement was observed between the results with the highest power coefficient () of 0.42 for 5.07 m/s at a tip speed ratio (TSR) of 2.41. Singh et al.8 studies the self-starting properties of an H-rotor Darrieus VAWT designed with three asymmetric airfoil (S1210) blades. The analysis was done with different solidities (0.8–1.2) and a maximum of 0.32 was achieved at an optimum solidity of 1. Batista et al.9 analyzed a small-scale Darrieus VAWT using a double multiple streamtube (DMS) model with an asymmetric airfoil named EN0005. The experimental testing showed better self-start capability with the highest of 0.37 at a TSR of 7.2.
Several investigations of Savonius VAWTs have also been conducted over the last few years. Nasef et al.10 investigated the influence of the overlap ratio on a Savonius turbine. The analysis was performed for dissimilar overlap ratios between 0 and 0.5 and an overlap ratio of 0.15, resulting in a maximum of 0.21 at a TSR of 0.9. Kacprzak et al.11 performed numerical simulations for three configurations of a Savonius turbine: elliptical, bach-type, and conventional. The bach-type rotor produced an overall improved performance with the highest of 0.18 at a TSR of 0.8. Kavade and Ghanegaonkar12 performed wind tunnel testing of the Savonius rotor to determine the influence of a number of blades. The analysis revealed that the three-bladed turbine showed better results with a cut-in speed of 2 m/s and maximum of 0.19 at a wind speed of 3 m/s.
To overcome the shortcomings of Darrieus and Savonius turbines, a combined rotor was designed by various researchers, named hybrid VAWT. The Savonius turbine was connected inside to provide starting characteristics, whereas the Darrieus turbine was installed outside to maximize wind energy extraction. Mohamed13 performed experimental and computational analyses by modifying the H-rotor Darrieus VAWT to develop a hybrid wind turbine. The results showed that self-starting ability was improved (approximately 6%); however, the maximum was reduced by a factor of 8. Bhuyan and Biswas14 conducted experimental testing by incorporating an asymmetric airfoil (S818) in a Darrieus–Savonius hybrid wind turbine. The rotor was designed with overlapping ratios of 0–0.2. The analysis revealed the highest of 0.34 for the hybrid wind turbine at a TSR of 2.29 and an overlap ratio of 0.15. Hosseini and Goudarzi15 performed a comparative study of a hybrid wind turbine with the H-rotor Darrieus using CFD techniques. The outcomes demonstrated an increase in self-starting ability with a highest of 0.41 (7% less than that of the Darrieus turbine) at a TSR of 2.5. The findings of the literature review are given in Table 1.
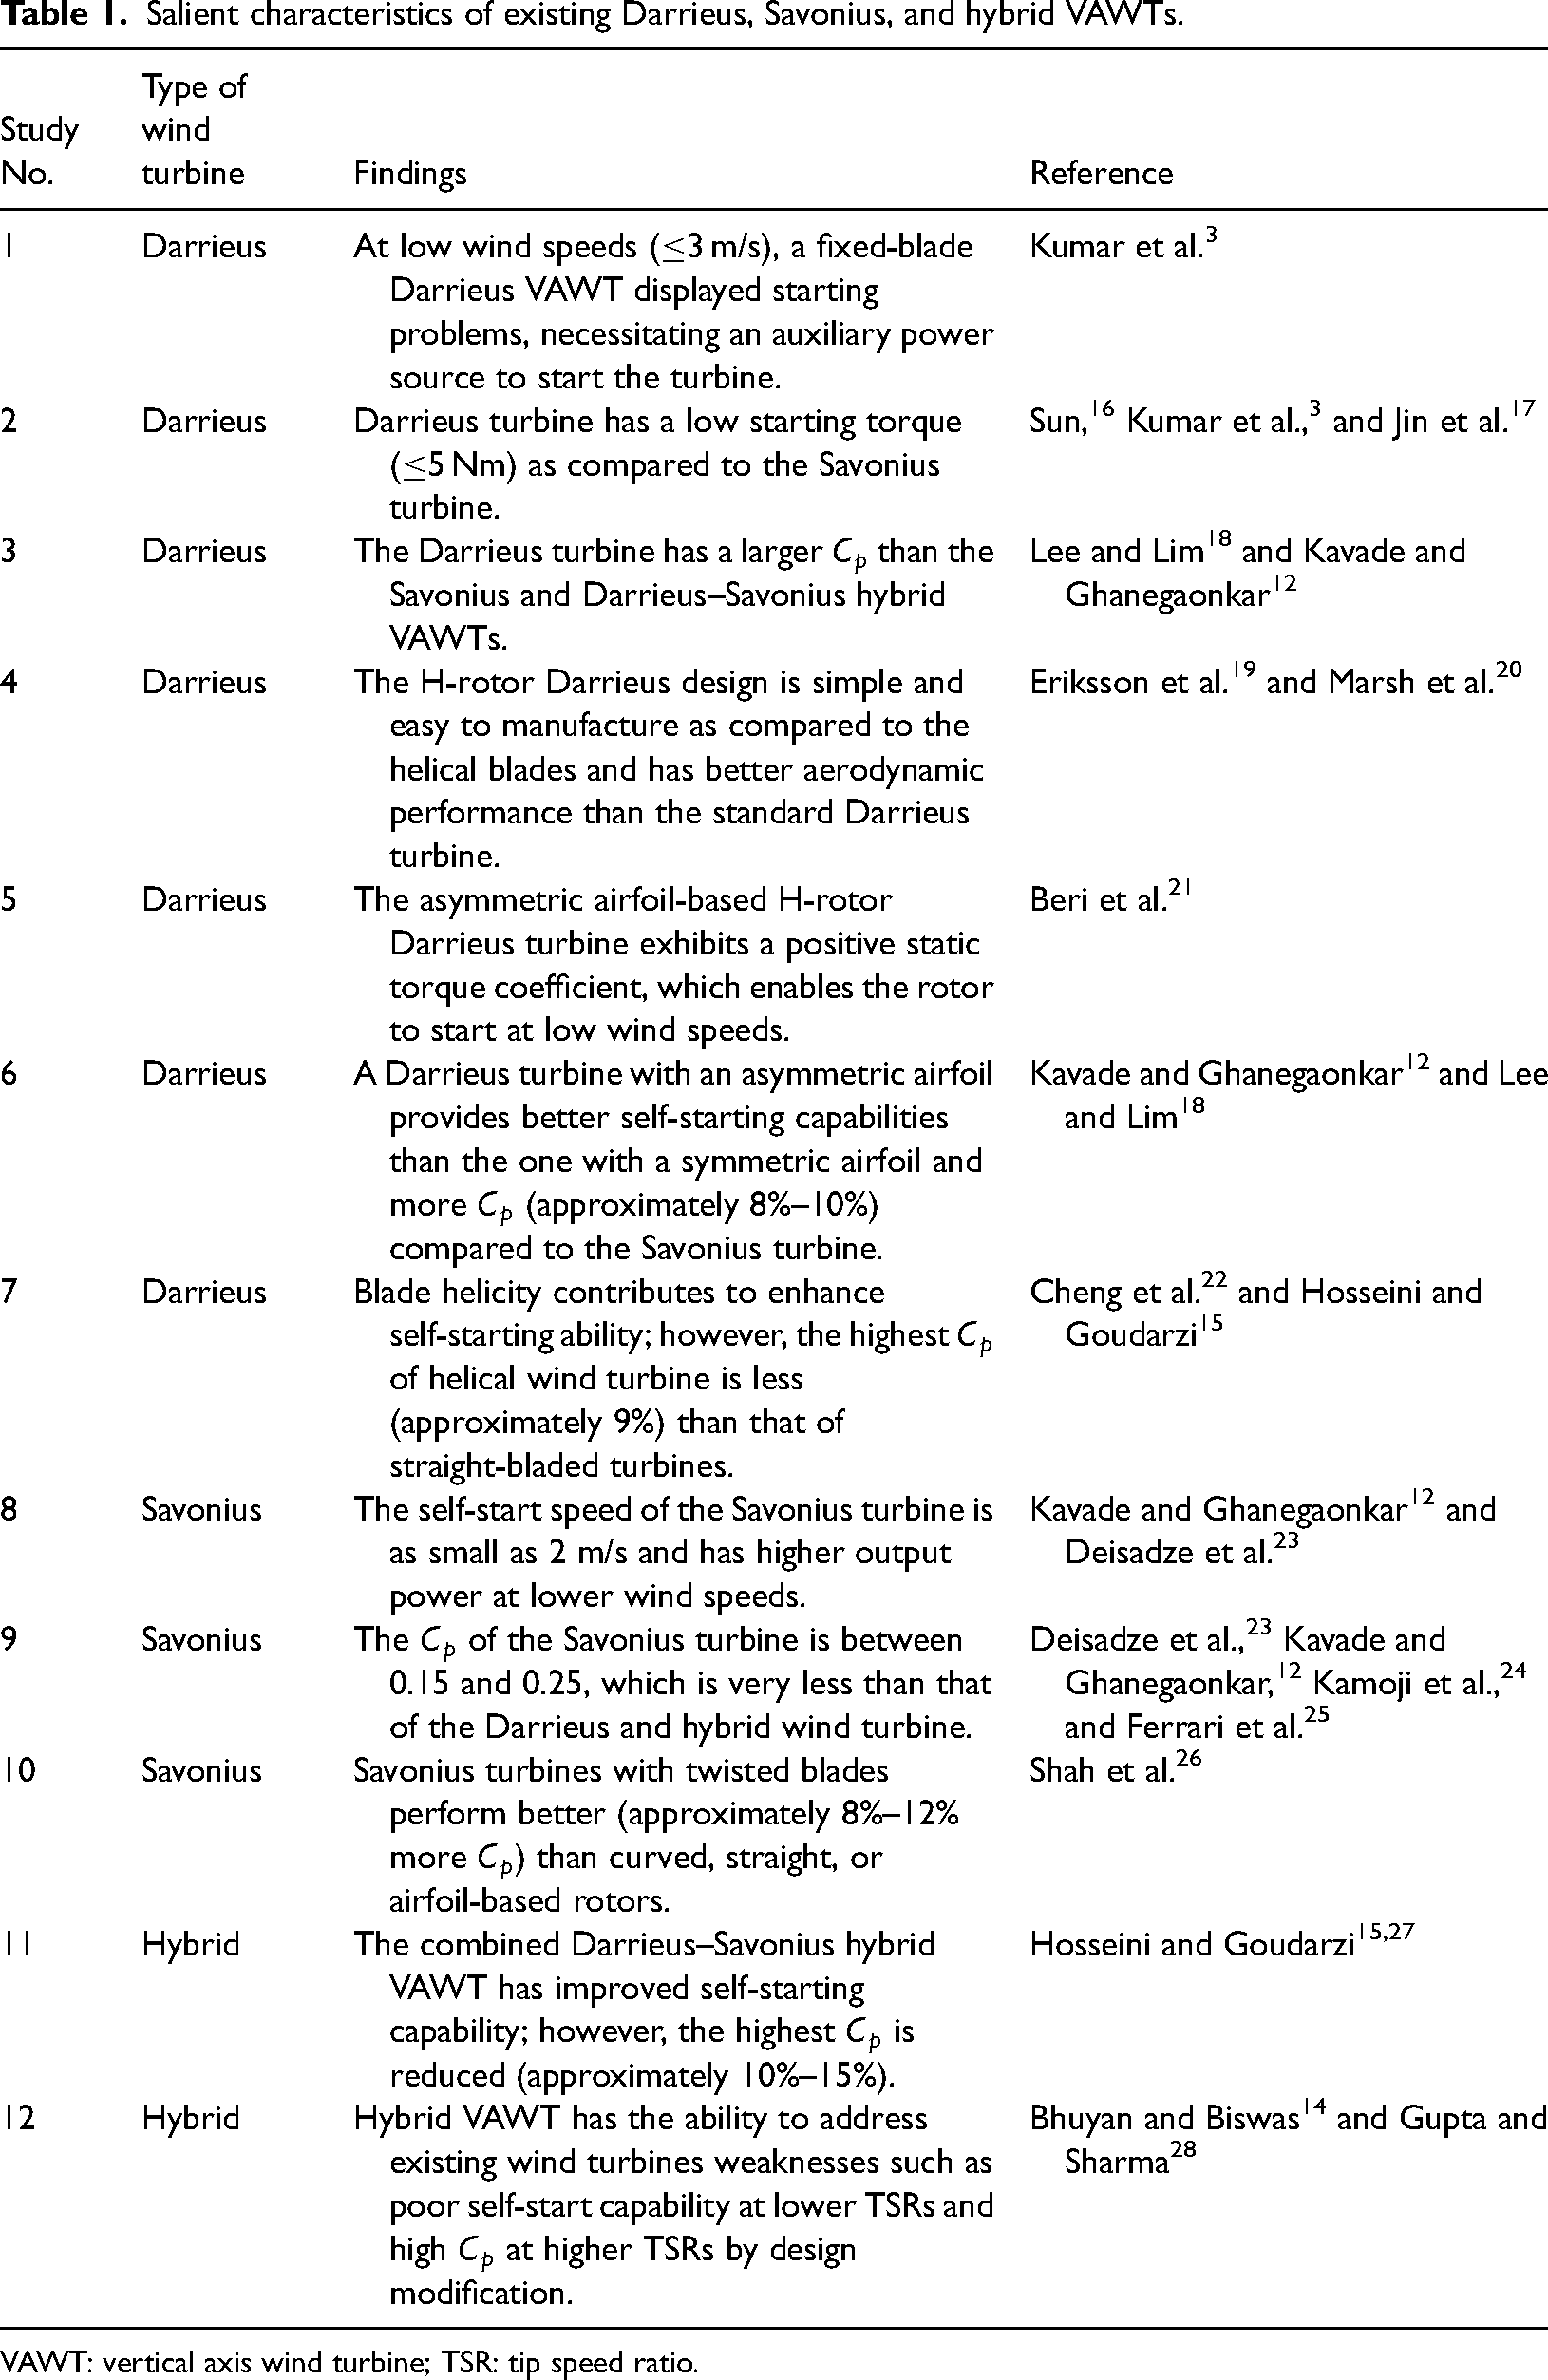
Salient characteristics of existing Darrieus, Savonius, and hybrid VAWTs.
Study No.
Type of wind turbine
Findings
Reference
1
Darrieus
At low wind speeds (3 m/s), a fixed-blade Darrieus VAWT displayed starting problems, necessitating an auxiliary power source to start the turbine.
The H-rotor Darrieus design is simple and easy to manufacture as compared to the helical blades and has better aerodynamic performance than the standard Darrieus turbine.
The asymmetric airfoil-based H-rotor Darrieus turbine exhibits a positive static torque coefficient, which enables the rotor to start at low wind speeds.
A Darrieus turbine with an asymmetric airfoil provides better self-starting capabilities than the one with a symmetric airfoil and more (approximately 8%–10%) compared to the Savonius turbine.
Blade helicity contributes to enhance self-starting ability; however, the highest of helical wind turbine is less (approximately 9%) than that of straight-bladed turbines.
Hybrid VAWT has the ability to address existing wind turbines weaknesses such as poor self-start capability at lower TSRs and high at higher TSRs by design modification.
VAWT: vertical axis wind turbine; TSR: tip speed ratio.
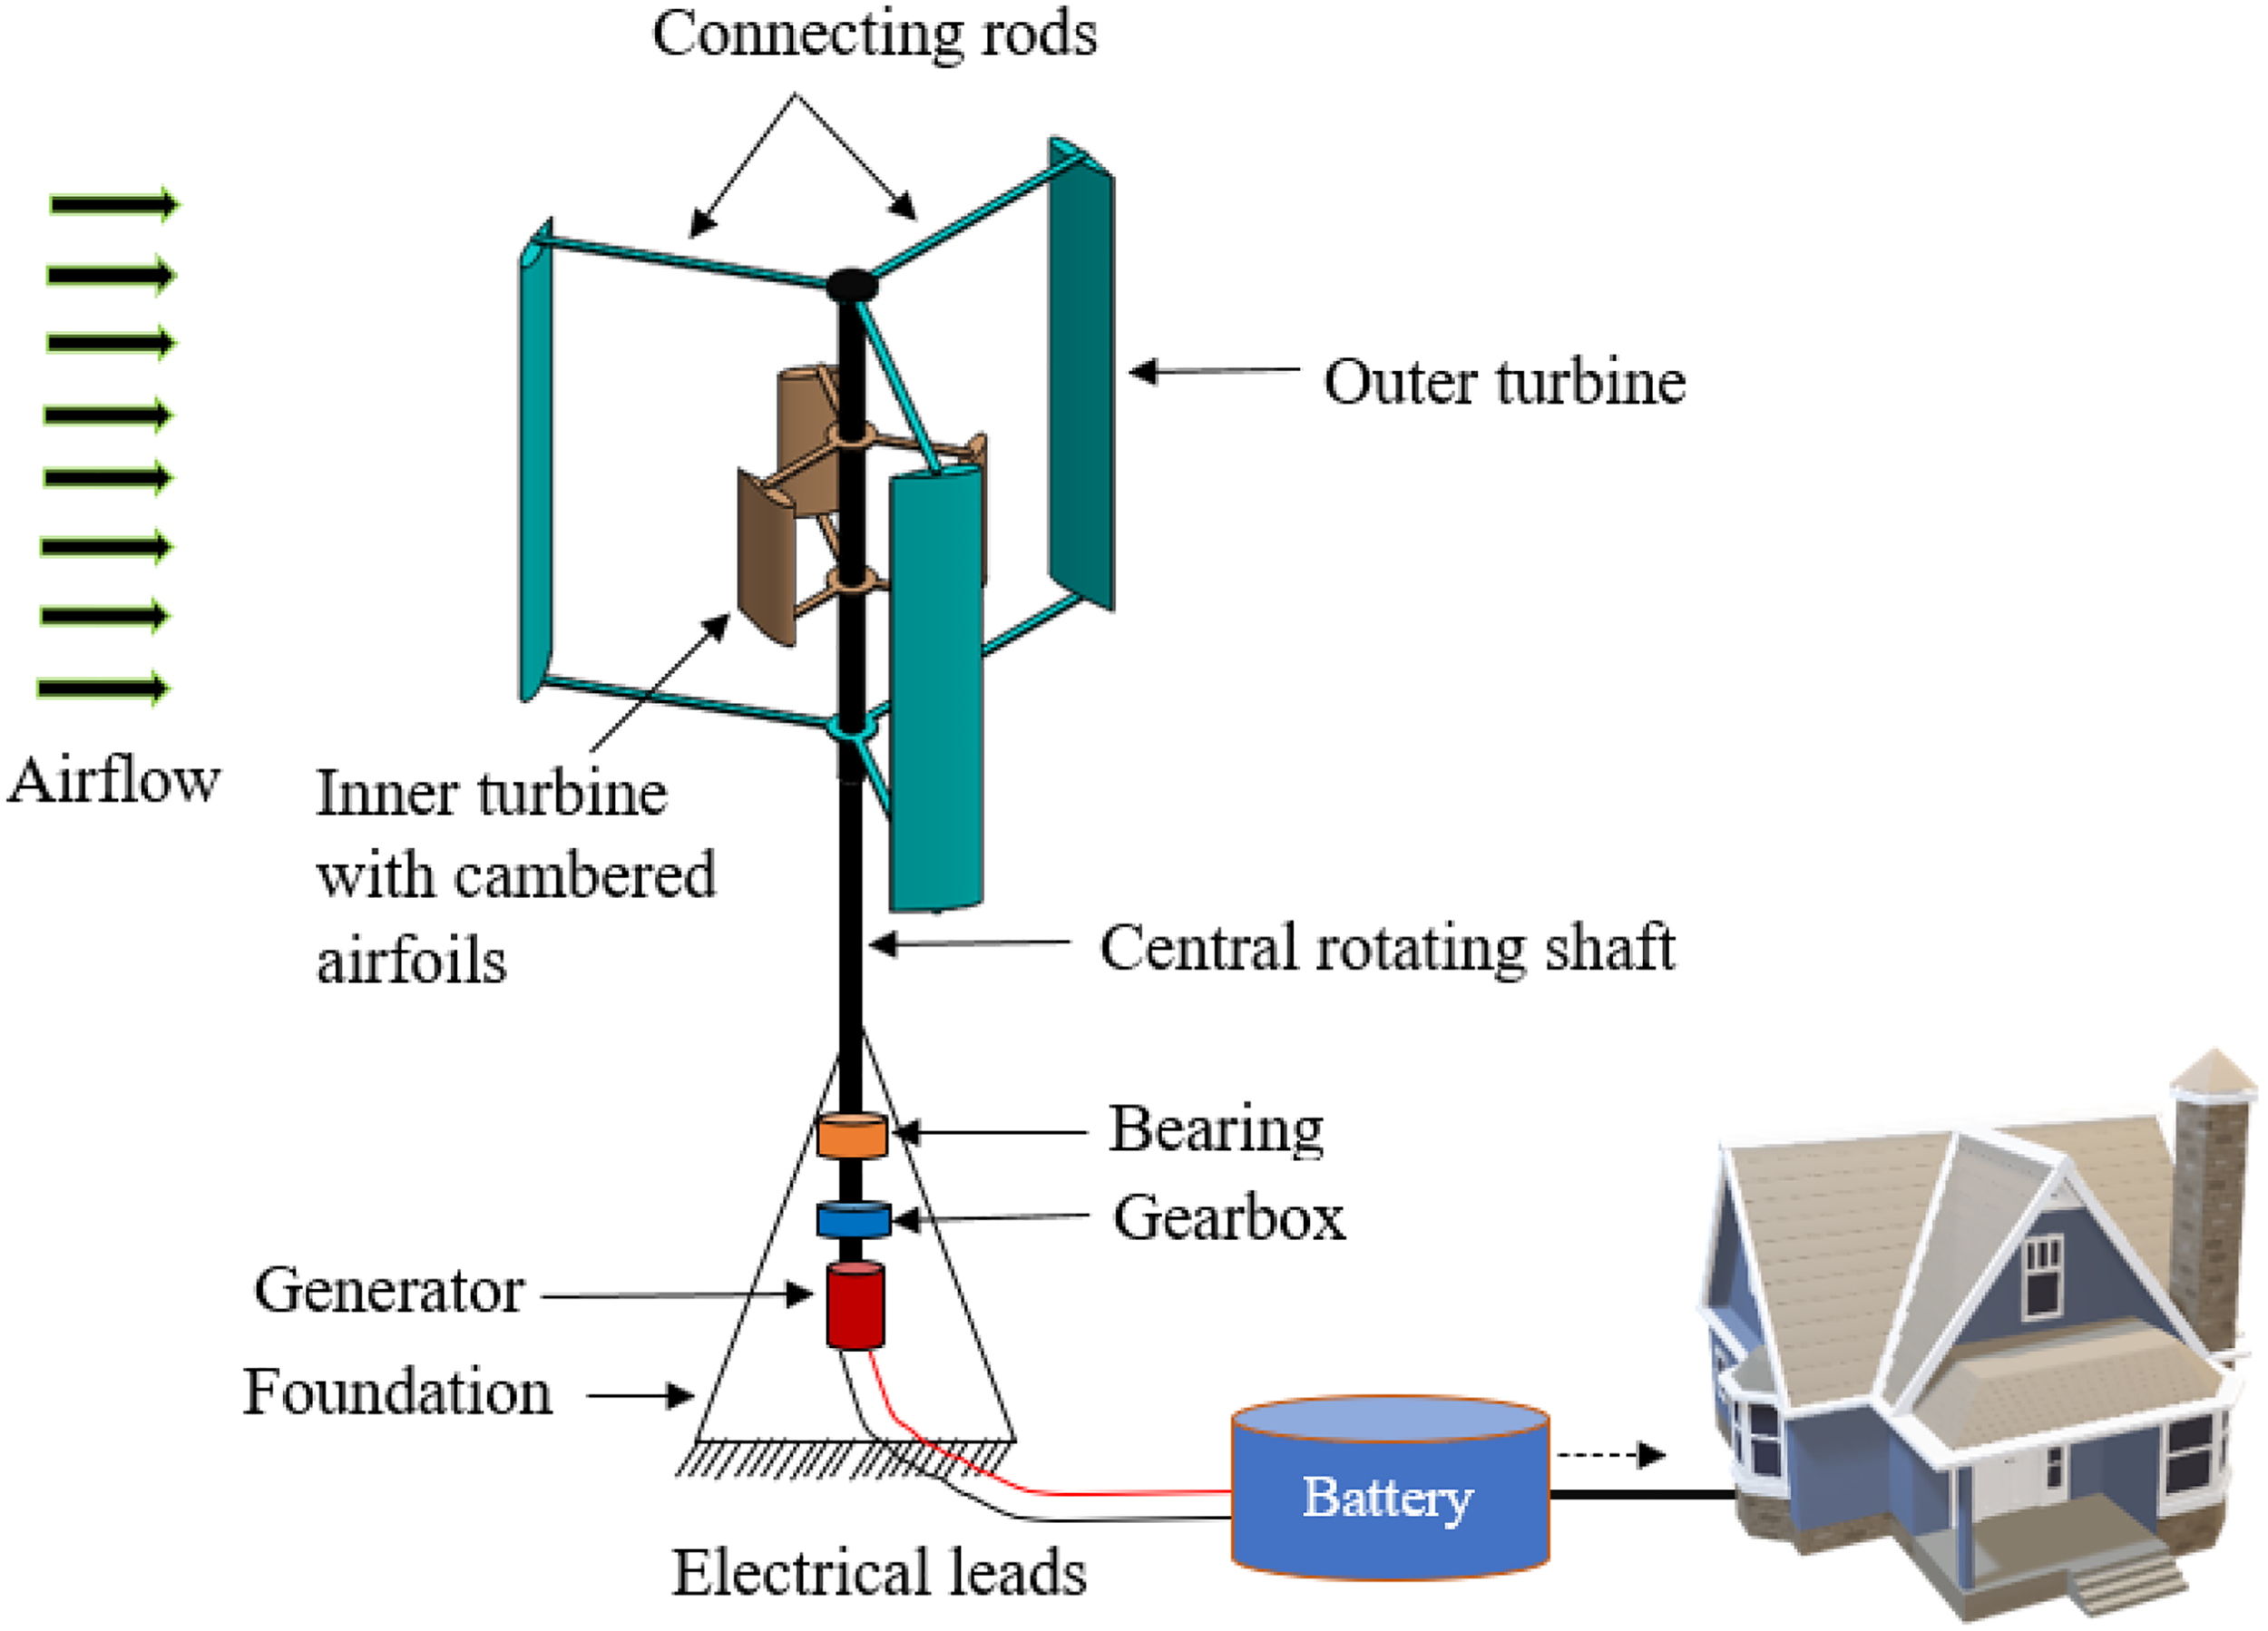
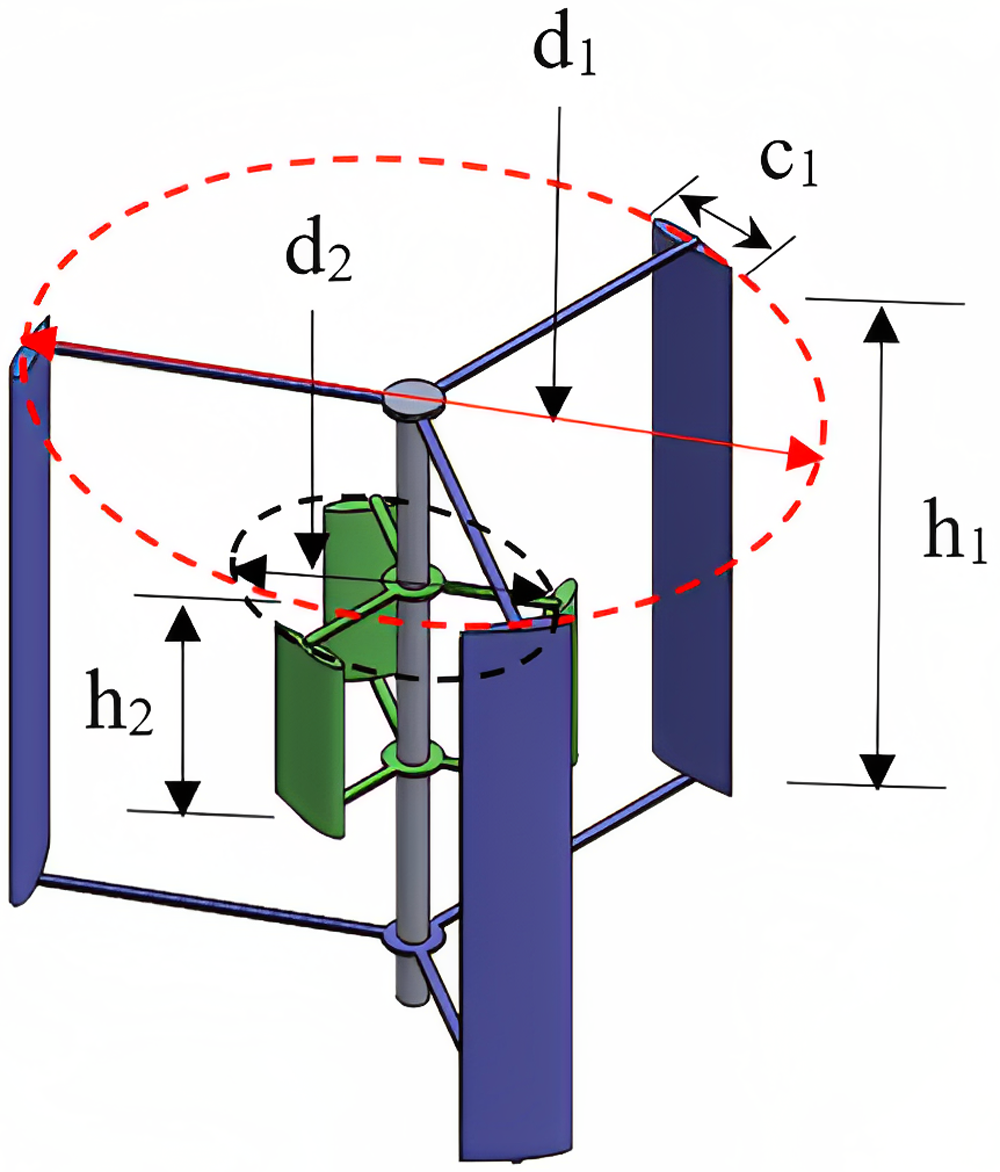
As mentioned above, substantial improvements have been made in the design of VAWTs through experimental testing and CFD simulations. Hybrid VAWT is an emerging technology that combines the advantages of the Darrieus and Savonius turbines. This research proposes an innovative hybrid wind turbine based on design optimization with a better self-starting capability and a higher . Based on the literature, it has been found that asymmetric airfoils have more tangential thrust which helps to improve the starting ability and have a higher than the Savonius VAWT. As a result, in the subsisting hybrid wind turbine, the asymmetric airfoil-based H-rotor Darrieus has been included as a replacement for the Savonius turbine. A conceptual design showing the operating principle of a proposed hybrid wind turbine is presented in Figure 1. Design of experiments (DOE) was used to optimize the geometrical parameters of the novel hybrid VAWT. On the basis of similarity analysis, a scaled-down model was developed. The aerodynamic analysis was performed using experimental and computational techniques. To compare the results of the proposed hybrid system, a standard H-rotor Darrieus was also analyzed using CFD techniques, and the results of the subsisting Darrieus–Savonius hybrid configuration were taken from the established literature under identical conditions. The proposed hybrid wind turbine resulted in an enhancement in performance parameters (, , , output power) compared to an H-rotor Darrieus and existing hybrid wind turbine.
Conceptual model and operating principle of the hybrid wind turbine under consideration. Wind’s kinetic energy is transformed into electricity using a hybrid vertical axis wind turbine (VAWT) with asymmetric (inner side) and symmetric (outer side) airfoil blades that can be employed via an energy storage device.
Novelty of the research
An innovative design configuration of hybrid VAWT has been studied in this research. The existing Darrieus–Savonius hybrid wind turbine was modified with an asymmetric airfoil-based H-rotor Darrieus VAWT at the inner side of the hybrid VAWT. A scaled-down model of a hybrid wind turbine was prepared by applying the theory of similarity. An experimental and computational analysis of the scaled-down model of the modified hybrid wind turbine was carried out. In comparison to an H-rotor Darrieus and existing hybrid wind turbine, the use of asymmetric airfoils on the inner side improved performance by 11%–13% throughout a vast range of wind speeds.
The following is a breakdown of the paper. Section “Characteristics of wind turbines” presents the characteristics of a wind turbine including an overview of the geometric configuration and scaling of the wind turbine. Section “Experimental setup and procedure” presents the experimental setup, wind tunnel testing, and results obtained for various wind speeds and TSRs. Section “CFD analysis” presents the computational analysis of the scaled-down model. Section “Comparison of experimental and computational results” presents the comparison of experimental and computational results. Finally, the conclusions are presented in section “Conclusion”.
Characteristics of wind turbines
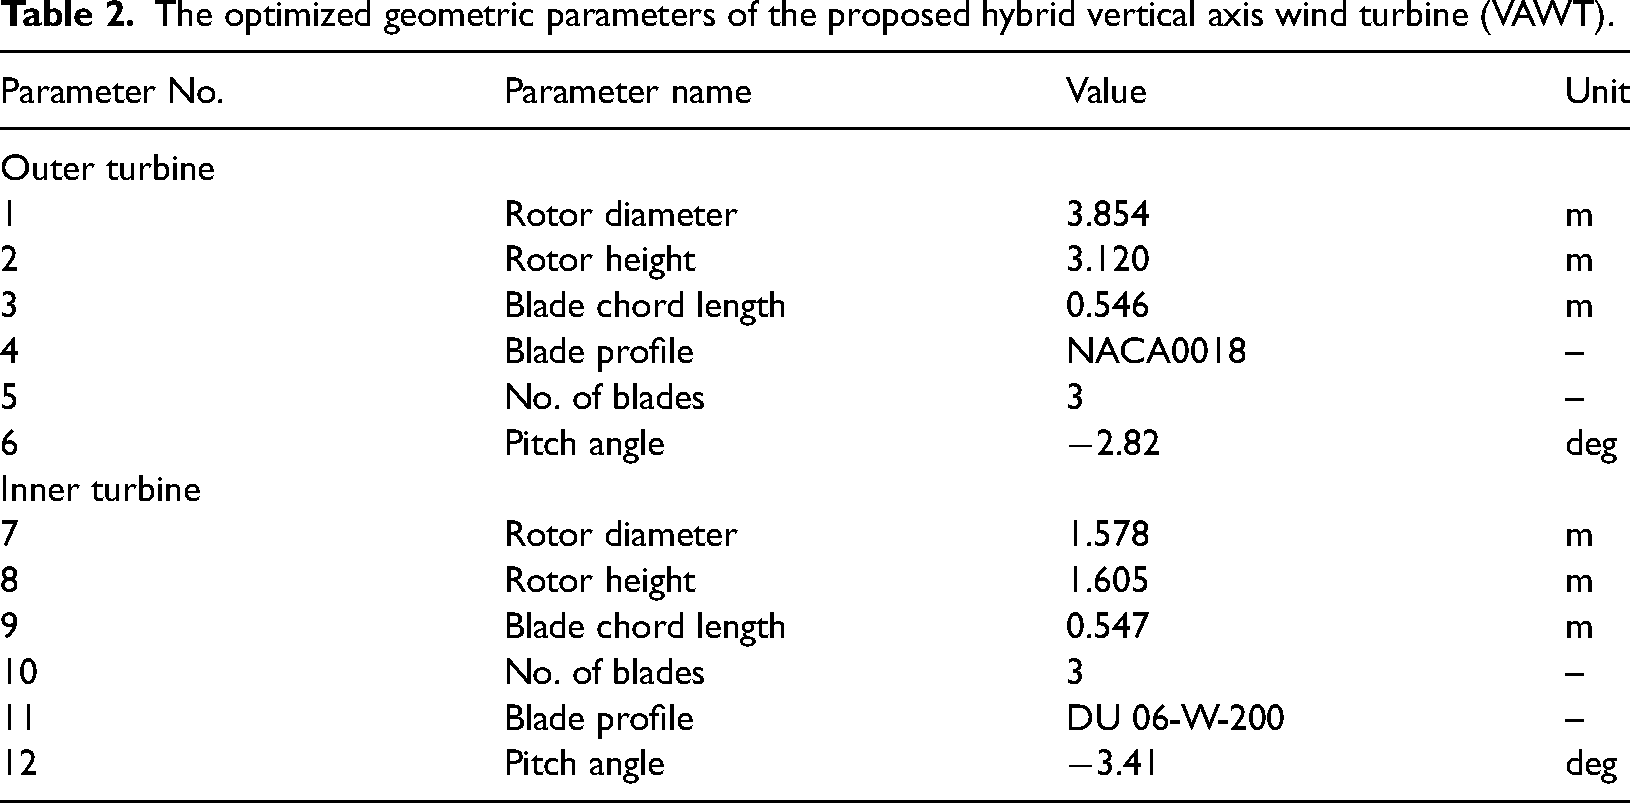
Multiple parameters influence the aerodynamic performance of the hybrid VAWT which include geometrical and design variables. Based on literature studies, the parameters of the geometry of the hybrid wind turbine were identified, and the appropriate regime for each parameter was selected using the one factor at a time approach. Brusca et al.,29 Mohamed,30 and Roh and Kang31 recommended the NACA0018 airfoil using computational and experimental investigations. Furthermore, Beri et al.,21 Sabaeifard et al.32 and Clarke et al.33 studied the influence of an asymmetric blade profile on the performance characteristics. The investigation showed a positive dynamic torque for TSR1.4, an improvement in the overall performance of approximately 8%, and a highest of 0.32. To select the airfoil for the proposed hybrid system, various airfoils were analyzed using DMS in the Q-Blade open-source software.34,35 Based on the recommendations of various authors and DMS analysis, the NACA0018 was selected for the outer H-rotor Darrieus turbine and DU 06-W-200 asymmetric airfoil for the inner turbine. Once the airfoil was selected, the remaining parameters were optimized by applying Box–Behnken (DOE) technique. To identify the best configurations, CFD analysis was conducted for various TSRs and wind speeds, and databases were utilized through DOE methodology. Response surface approaches were applied to assess the model’s correctness utilizing the goodness of fit, analysis of variance, residual investigation, and values, which were all based on a regression model.36 The optimized parameters of geometry of the proposed hybrid wind turbine (full-scale model) are presented in Table 2. The hybrid wind turbine being proposed consists of three NACA0018 symmetric airfoil blades connected to the outer side at 120° to each other. Three asymmetric airfoil (DU 06-W-200) blades were attached to the inner side at 60° from the outer turbine. Both turbines are coupled to the central shaft through connecting rods, which are further connected to the power generator through joints and bearings. A battery system stores the electricity generated by the wind turbine for various applications. The wind turbine was scaled by applying the theory of similarity to perform an experimental analysis using a closed-circuit subsonic wind tunnel.
The optimized geometric parameters of the proposed hybrid vertical axis wind turbine (VAWT).
Parameter No.
Parameter name
Value
Unit
Outer turbine
1
Rotor diameter
3.854
m
2
Rotor height
3.120
m
3
Blade chord length
0.546
m
4
Blade profile
NACA0018
–
5
No. of blades
3
–
6
Pitch angle
2.82
deg
Inner turbine
7
Rotor diameter
1.578
m
8
Rotor height
1.605
m
9
Blade chord length
0.547
m
10
No. of blades
3
–
11
Blade profile
DU 06-W-200
–
12
Pitch angle
3.41
deg
Design of experiments techniques and procedure
Techniques for optimizing processes and products are essential for achieving continual improvement in process and product quality. These methods fall into two categories namely experimental and iterative search methods; which are used in modeling to identify the ideal circumstances. Experimental techniques such as DOE are designed to systematically vary multiple input and output variables to study their relationship. Algorithms for linear, dynamic, and nonlinear programming are examples of iterative approaches. Design space exploration is the process of finding the optimal design solution from a range of design points.37 DOE is a statistical approach that simultaneously varies different factors to screen the reaction space for optimal values. Box–Behnken, Latin Hypercube, Full Factorial, and Central Composite are four examples of classical DOE designs. In comparison to Full Factorial, Box–Behnken is a strong and effective method that yields precise results with fewer executions. When compared to Full Factorial, Box–Behnken simply calculates the output at the cube’s four corners, three major points, and extreme points. Box–Behnken helps in obtaining the ideal design configuration while restricting variables. Another effective approach for determining the link between input factors and a process’s response in order to accomplish the goal of response characteristics is called response surface methodology (RSM).38 It uses statistical methods, optimization, and intrinsic regression modeling. RSM may, however, be constrained by issues with multi-modal or extremely nonlinear objective functions.39
The pertinent variables and the total number of levels are identified to start the DOE process. During the present research, the Box–Behnken method was employed to optimize the wind turbine’s geometrical characteristics, including chord length, number of blades, distance from the central rotating shaft, pitch angle, and rotor height. Meanwhile, RSM was used to examine how the turbine’s operating factors affected and cut-in speed. Based on the impacts of various parameters, a response surface model was created using the statistical program Minitab, and a design matrix was developed to create a regression model.40 According to the Box–Behnken method, each independent variable is set at one of three equally spaced values, which correspond to the maximum, average, and lowest levels of each variable. The design matrix specifies that a total of 46 runs are necessary for the investigation of five variables.41 For each set of design parameters, the impacts of the variables on and cut-in speed were examined. A comprehensive design was created using real values once the independent variables’ range and levels were established.
Performance parameters of wind turbines
During the research, the hybrid VAWT’s performance was assessed utilizing the following parameters.
Output power:
The fundamental relationship to evaluate the output power generated by a conventional wind turbine is represented by equation (1).42:
where P is the output power, V is the wind speed, A is the wind turbine’s swept area, is the fluid density, and is the power coefficient. Equations (2) to (4) present the dimensionless performance characteristics of a wind turbine.43
Tip speed ratio:
The proportion between the blade’s speed at the tip and the wind’s speed as it enters.
where represents TSR, is the angular velocity, and R is the rotor’s radius.44,45
Power coefficient:
Torque coefficient:
where represents the dynamic torque coefficient, H is the rotor height, and T is the dynamic torque generated by the turbine.
Wind turbine scaling and similarity rules
The scaling of a wind turbine is achieved through a dimensional parametric study. Generally, scaling starts with length-dependent parameters, and the scaling factor is derived. All dimensional parameters are then scaled according to the scaling factor.46 The theory of similarity is helpful in determining the scaling effects on various characteristics of the wind turbine. According to this theory, the flow parameters in scaled-down and full-scale models can be kept the same if the following conditions are met.47
The number of blades remains constant.
The blade profiles in both models are kept the same.
In both cases, the TSR is maintained.
The material of the scaled-down model and full-scale is kept the same.
Dimensional adjustments are done for the corresponding parameters such as chord length, rotor diameter, and height.
In order to meet the flow conditions, the absolute and relative velocity triangles must be kept the same at each cross-section. From this perspective, the dynamic characteristics, performance parameters of the rotor, and aerodynamic forces can be estimated. The scaling parameters affect the aerodynamic forces, stresses, weight, torque, and output power. Generally, the scaling laws estimate the mass as cube scales with an increase in size; however, advanced manufacturing techniques predict the modified mass–size relationship below the cube scale.48 A blade’s weight is thought to have a significant factor in scaling because of the existence of proportionality between the weight and stresses. The geometric similarity is related to the shape of the turbine rotor; to obtain this similarity, the ratio of all the corresponding linear dimensions in the scaled-down and full-scale models must be equal. In the present case, the geometric similarity was established between the rotor diameter (D), rotor height (H), and chord length (C) of the blade as given in equation (5)49:
where is the scaling ratio of the dimensions, and the subscripts p and m, indicate the dimensions of the scaled-down model and full-scale, respectively. The kinematic similarity corresponds to the motion of the wind turbine. To obtain this similarity, the proportion of linear to angular speeds at the corresponding points in the scaled-down and full-scale models must be equal. The mathematical expressions of kinematic similarity for linear and angular velocity are given in equations (6) and (7), respectively50:
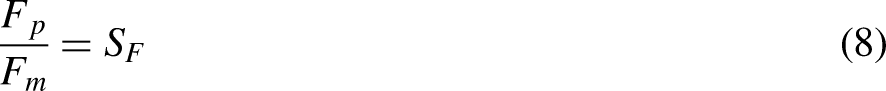
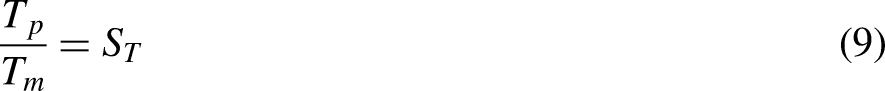
where V represents the speed of the incoming airflow, is the angular velocity of the wind turbine, is the scaling ratio of the wind speed, and is the scaling ratio of angular velocity. Dynamic similarity deals with the forces and moments of a wind turbine. It exists between the scaled-down and full-scale models if the ratio of forces and moments at the corresponding points are equal. The mathematical expressions of dynamic similarity are given in equations (8) and (9)51:
where the symbols , indicate the scaling ratio of dynamic similarity and F, T represents the aerodynamic force and moment (torque) generated by the wind turbine.
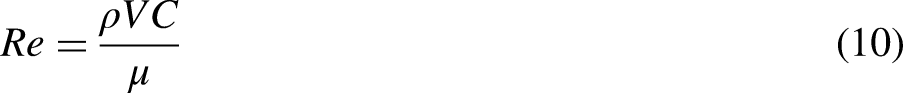
Wind turbine dynamics is significantly affected by wind–blade interactions. The preservation of the qualitative nature of the wind–blade interaction between the large wind turbine and the scaled-down test setup ensures aerodynamic similarity. The aerodynamic similarity is of foremost importance to test the forces acting on a given wind turbine design, as the turbine model is to test in a wind tunnel setting, much like airplane models are tested before building a full-scale version. It also assumes that the two geometrically similar aerodynamic surfaces are in a separate or same flow field environment and that the ratio between the moments and forces over their respective surfaces is constant. In the present study, the geometric similarity between the two aerodynamic surfaces was achieved by ensuring a constant geometric scaling factor between the surfaces. Aerodynamic similarity involves the similarity of the Reynolds number (Re), Mach number, and Froude number. When the gravity effects are prominent, the Froude number similarity must be considered. For the present case, the weight of the wind turbine passes through its center of gravity; therefore, the Froude number similarity was neglected. Moreover, the flow encountered by the full-scale and scaled-down model is in the incompressible region, and the Mach number similarity was not considered. The mathematical equation of Re is given in equation (10)49:
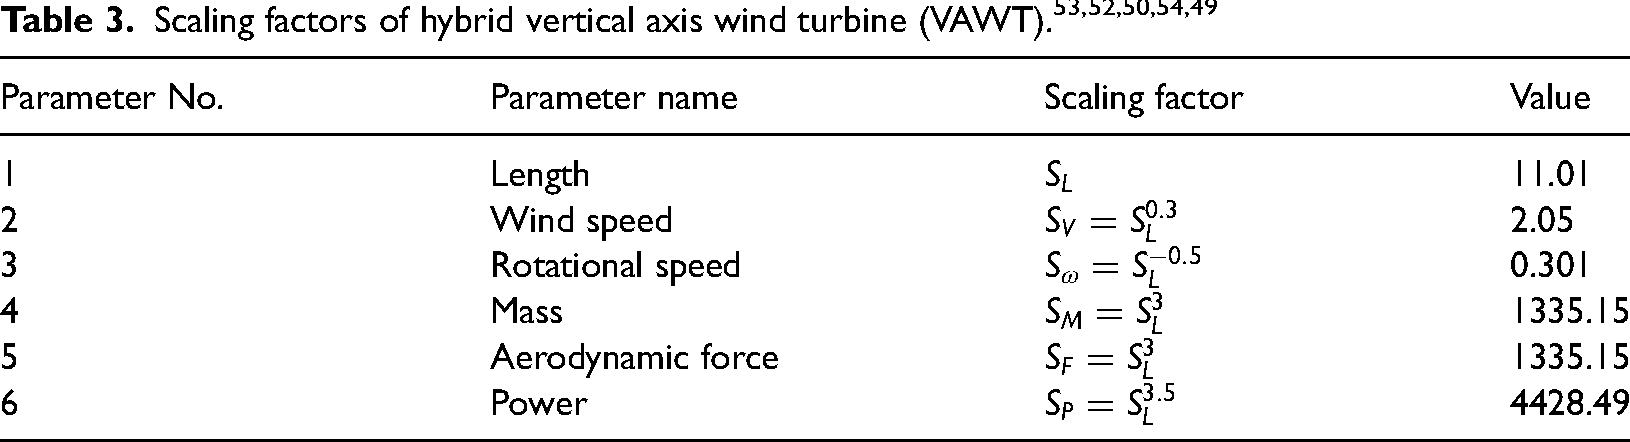
where is the air density, V is fluid speed (rated speed: 3.652 m/s), C is chord length (49.6 mm), and is the air’s dynamic viscosity. The scaling factors for the hybrid wind turbine were calculated as given in Table 3.52
Scaling factors of hybrid vertical axis wind turbine (VAWT).53,52,50,54,49
Parameter No.
Parameter name
Scaling factor
Value
1
Length
11.01
2
Wind speed
2.05
3
Rotational speed
0.301
4
Mass
1335.15
5
Aerodynamic force
1335.15
6
Power
4428.49
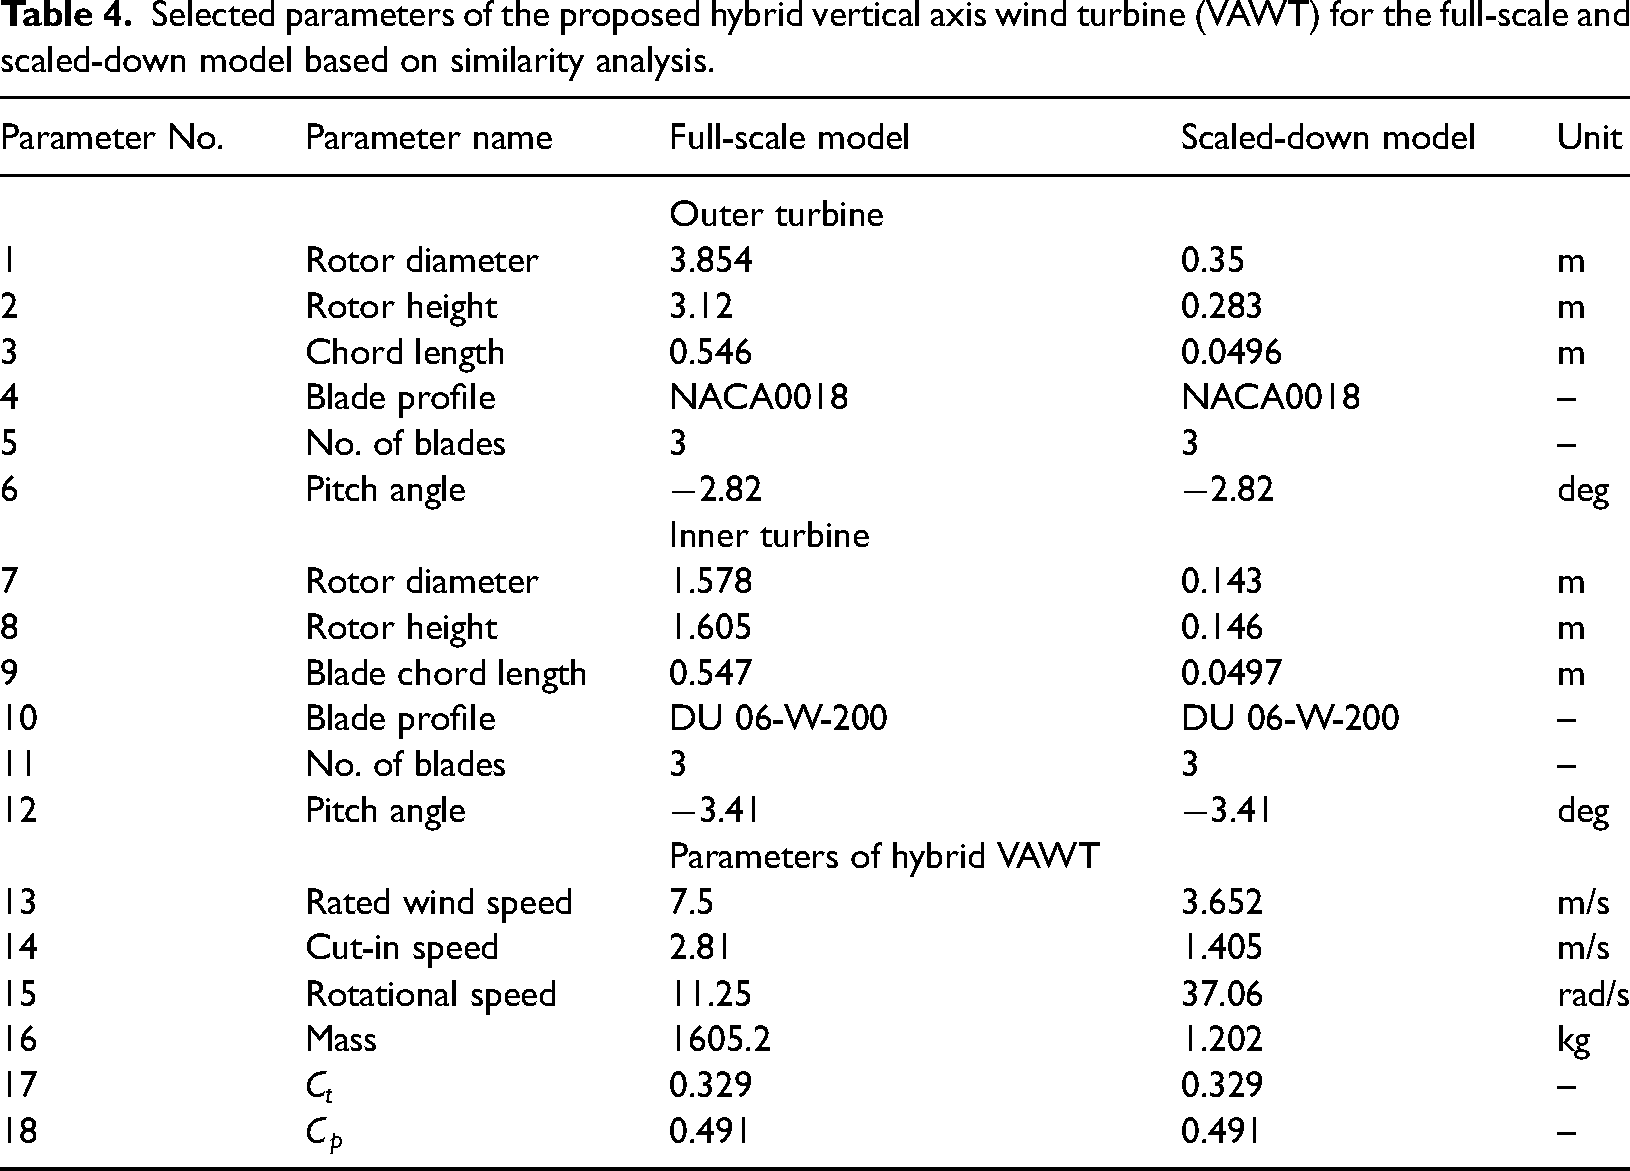
Based on the available subsonic closed-circuit wind tunnel testing facility, the scaling factor of length was obtained as 11.01. The scaling factor was used to evaluate the remaining geometric and kinematic properties. The aerodynamic similarity between two aerodynamic systems consisting of fluid–surface interaction is ensured if the surfaces of both the aerodynamic systems are geometrically similar as shown in Figure 2. Based on scaling factors, the parameters of the hybrid wind turbine for the full-scale and scaled-down model are presented in Table 4.
Computer-aided design (CAD) of a scaled-down model of the proposed design. The dimensions with small letters represent the scaled-down model.
Selected parameters of the proposed hybrid vertical axis wind turbine (VAWT) for the full-scale and scaled-down model based on similarity analysis.
Parameter No.
Parameter name
Full-scale model
Scaled-down model
Unit
Outer turbine
1
Rotor diameter
3.854
0.35
m
2
Rotor height
3.12
0.283
m
3
Chord length
0.546
0.0496
m
4
Blade profile
NACA0018
NACA0018
–
5
No. of blades
3
3
–
6
Pitch angle
2.82
2.82
deg
Inner turbine
7
Rotor diameter
1.578
0.143
m
8
Rotor height
1.605
0.146
m
9
Blade chord length
0.547
0.0497
m
10
Blade profile
DU 06-W-200
DU 06-W-200
–
11
No. of blades
3
3
–
12
Pitch angle
3.41
3.41
deg
Parameters of hybrid VAWT
13
Rated wind speed
7.5
3.652
m/s
14
Cut-in speed
2.81
1.405
m/s
15
Rotational speed
11.25
37.06
rad/s
16
Mass
1605.2
1.202
kg
17
0.329
0.329
–
18
0.491
0.491
–
Experimental setup and procedure
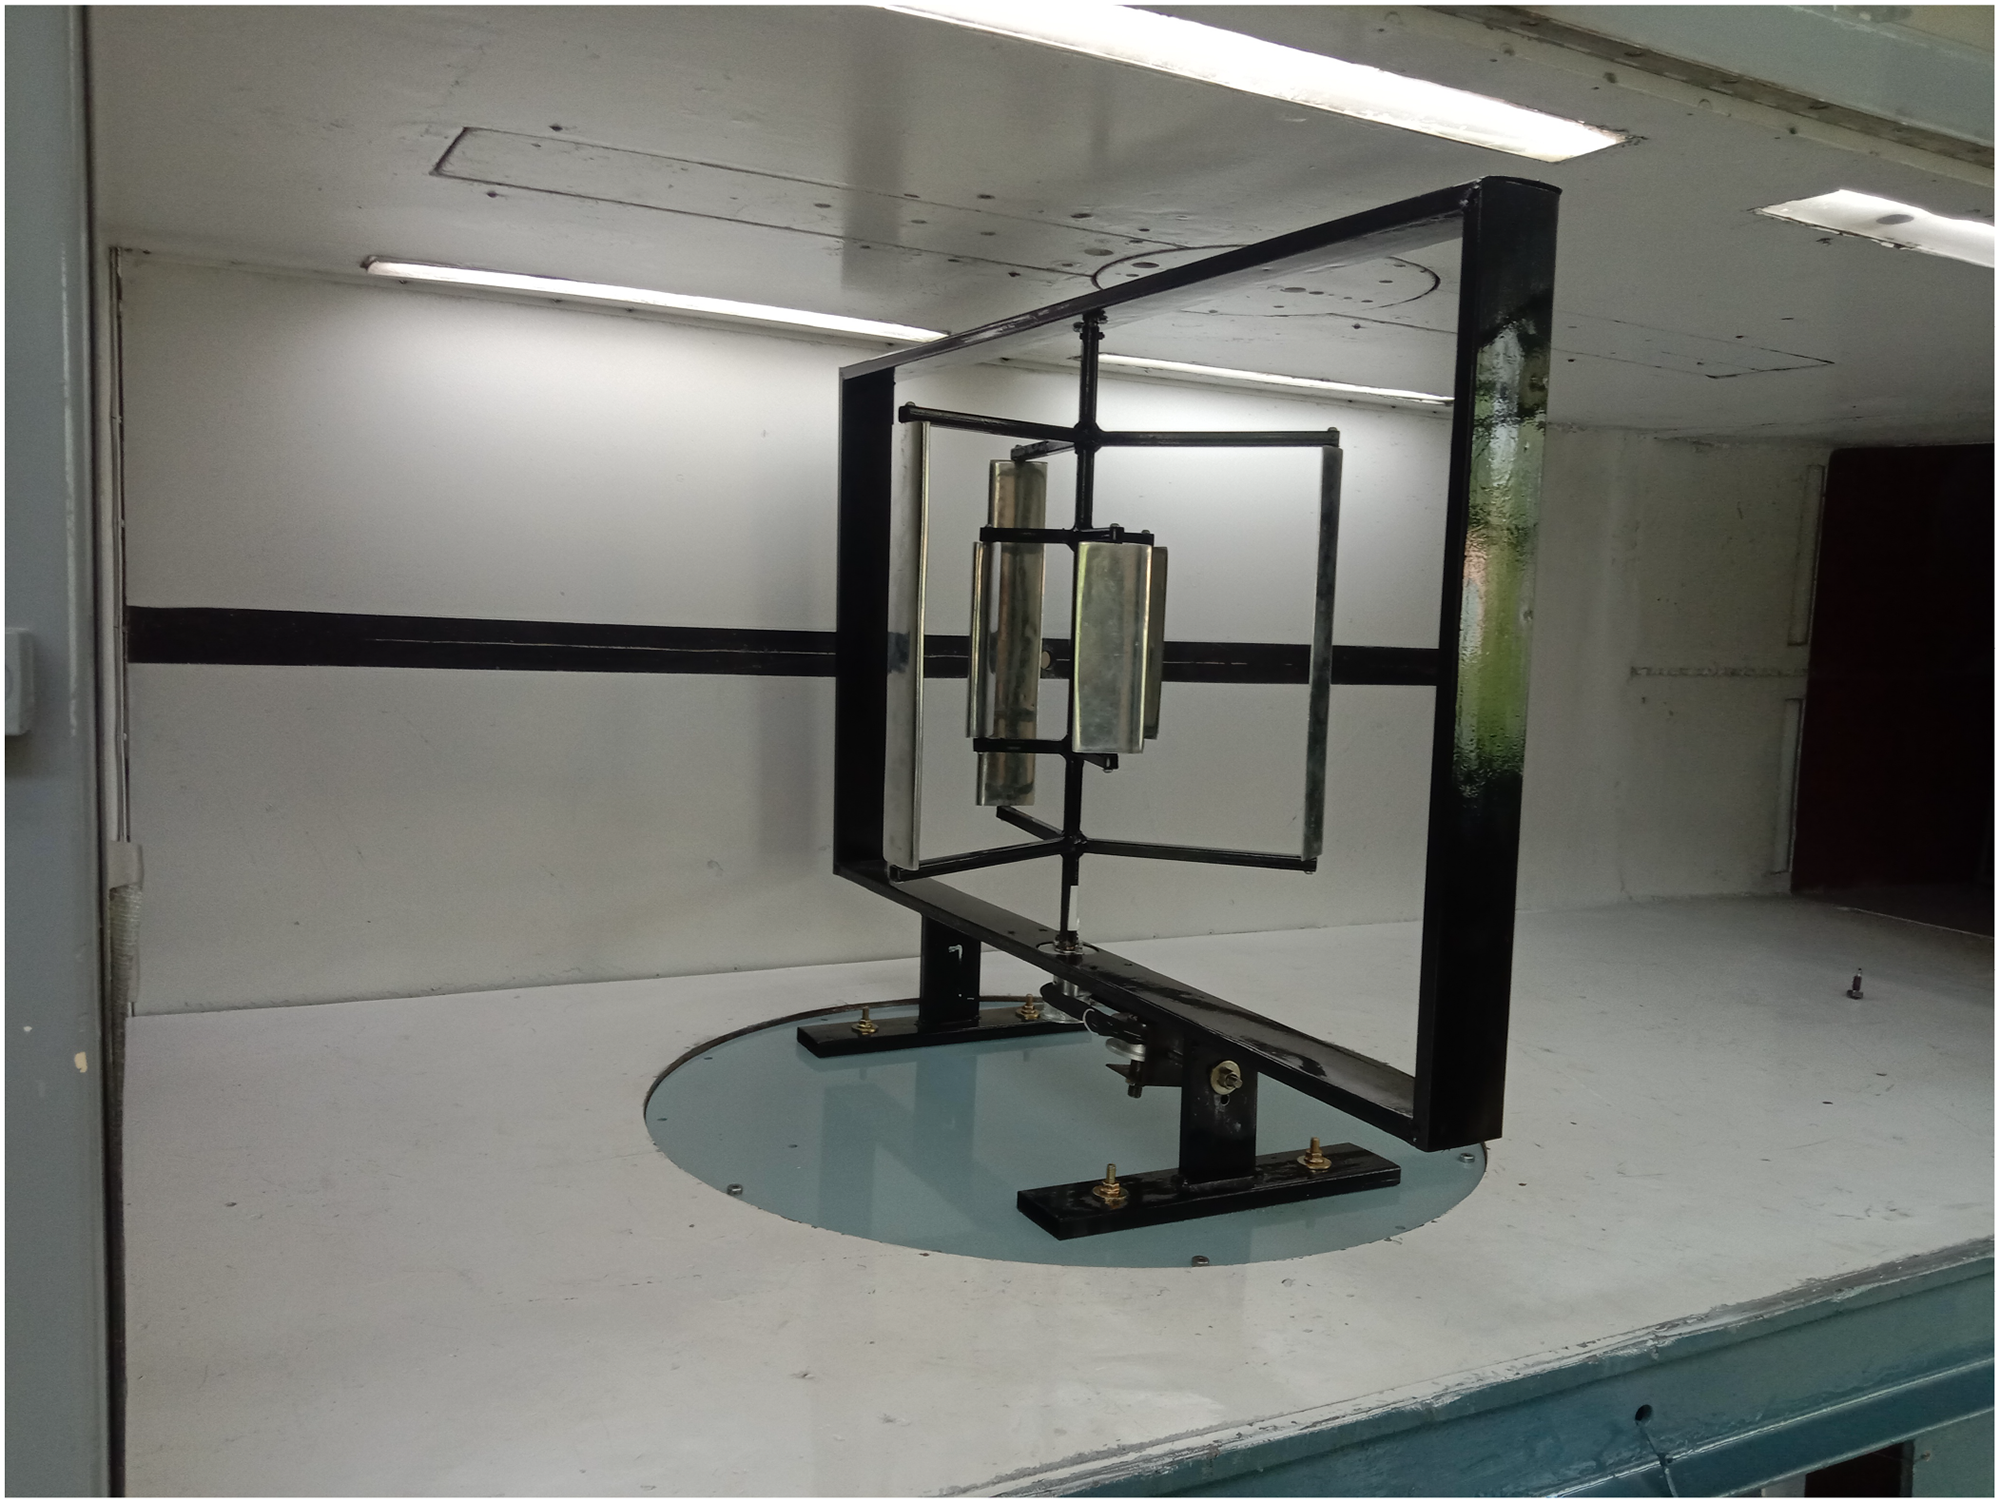
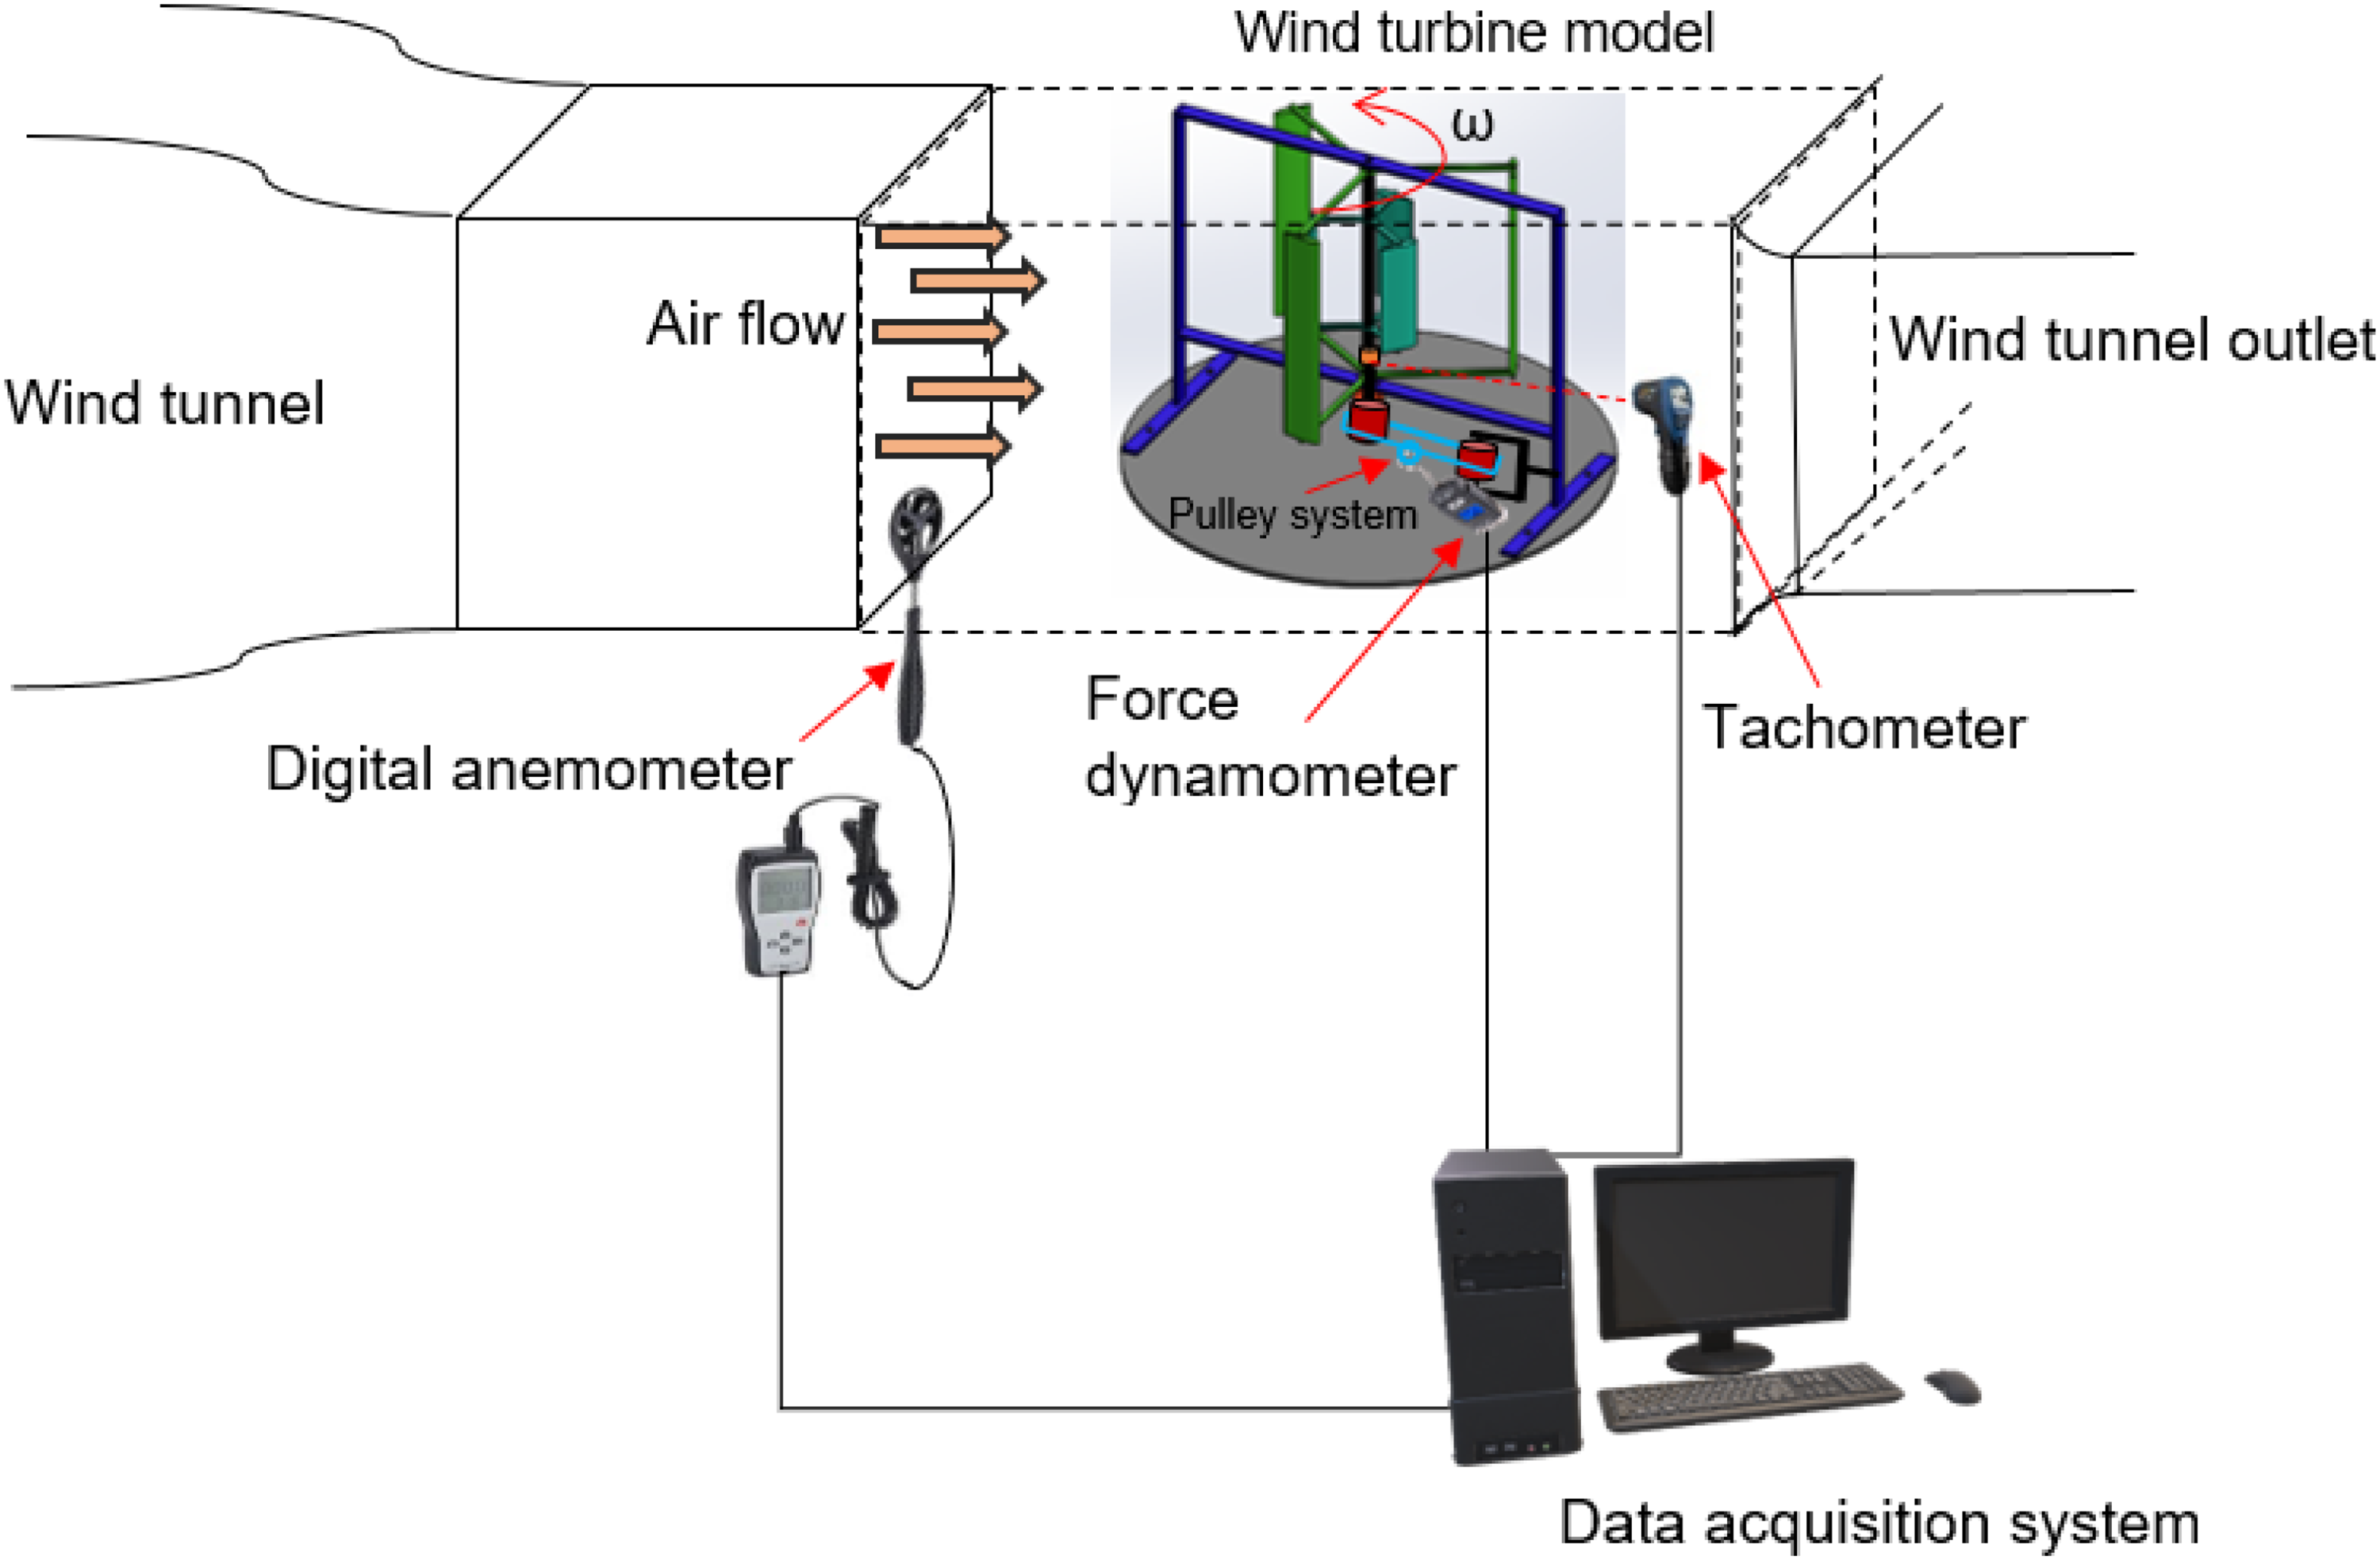
A closed-circuit wind tunnel with a cross-section size of ft2 was used for the experimental examination. The circulation of airflow is achieved by a fan coupled with a synchronous electric motor and the rotational speed of the fan is controlled by an inverter.55 The uniform velocity of the flow was ensured by an automatic controlling mechanism. The nozzle accelerated the airflow entering the test section, and the static pressure difference was used to determine the wind speed after passing through the test section. The angular velocity of the wind turbine is a function of the wind speed of the incoming airflow; therefore, the same was adjusted according to the testing requirements. The subsonic wind tunnel was powered by a 150 hp motor with a maximum operating speed of 240 mile/h. The wind tunnel operates in the 0.3–53 m/s range at a maximum temperature of 80°C, with acceptable reaction time, flow uniformity, and repeatability. The uniform flow in the wind tunnel was available within the % accuracy level of the turbulent intensity. To perform wind tunnel testing, a scaled-down model was designed and developed using a 3D fused deposition modeling printer followed by aluminum casting. The wind turbine model put in the wind tunnel’s test area is shown in Figure 3. A square bracket was designed and the turbine was connected exactly at the center of the bracket using the central rotating shaft. Two deep-groove ball race bearings supported the turbine rotor, allowing free rotation of the shaft and functioning as thrust bearings to sustain the weight of the turbine. The position and alignment of the central shaft were adjusted using nuts and bolts. The friction between the model shaft and upper holding assembly was minimized using grease and lubricating oil. Flow conditioning was performed by utilizing a honeycomb structure, turning vanes, and wire screens. To achieve a uniform flow across the turbine blades, the model was placed in the testing section precisely at the center of the wind tunnel. The central rotating shaft of the wind turbine model was exactly in the middle of the wind tunnel. The speed of airflow was remotely controlled by adjusting the propeller blades’ pitch angle. The wind turbine model was positioned in the testing area near the center of the wind tunnel to reduce blockage effects and account for the impacts of tunnel obstruction on the data. Additionally, it was made sure that the wind tunnel was airtight and free of leaks. To calculate the equivalent free air performance of the turbine, the wind speed was measured using a digital anemometer (BENETECH, model: GM8902) with a calibrated accuracy of % positioned at the center of the wind turbine. By adjusting the wind speed within the required range, accurate measurements were obtained. Additionally, parameters such as temperature and humidity were measured to ensure that the wind tunnel conditions were consistent across all tests. The data was carefully analyzed to ensure that the results accurately reflected the equivalent free air performance of the hybrid wind turbine. The performance of the hybrid wind turbine was evaluated using a pulley mechanism attached directly to the rotor and bracket frames. The dynamic force was measured using a force dynamometer, which was subsequently converted into dynamic torque. A laser light-based digital tachometer having an accuracy of % was utilized to estimate the rotating velocity of the wind turbine. The aerodynamic moments thus generated were measured, and based on the observations, various aerodynamic performance parameters were determined. Experiments were conducted at various TSRs (1–6), wind speeds (1–6 m/s), and performance parameters in terms of power coefficients, torque coefficients, and output power were obtained. The block diagram of the wind tunnel experimentation system consists of several components, as shown in Figure 4.
The subsonic wind tunnel test section has a replica of a wind turbine mounted.
Layout of wind tunnel testing system showing wind turbine model, measuring instruments, incoming airflow, and data recording system.
Measurement uncertainty analysis
Although the experimental testing of the wind turbine model was performed with great care, inevitable uncertainties always exist. The uncertainty affecting measurements, such as instrumental error, must be calculated during the analysis.56,57 The instrumental error was evaluated and was found to be within %. The uncertainty method proposed by Kline and McClintock58 is helpful for determining the percentage difference in the computed results of and . Using the same approach, the error equation for is represented by equation (11):
where V represents the wind speed and T is the dynamic torque produced by the wind turbine. Similarly, the error equation for the torque coefficient () was also derived as given by equation (12):
The experimental errors for the power and torque coefficients were within 3%.
Experimental results
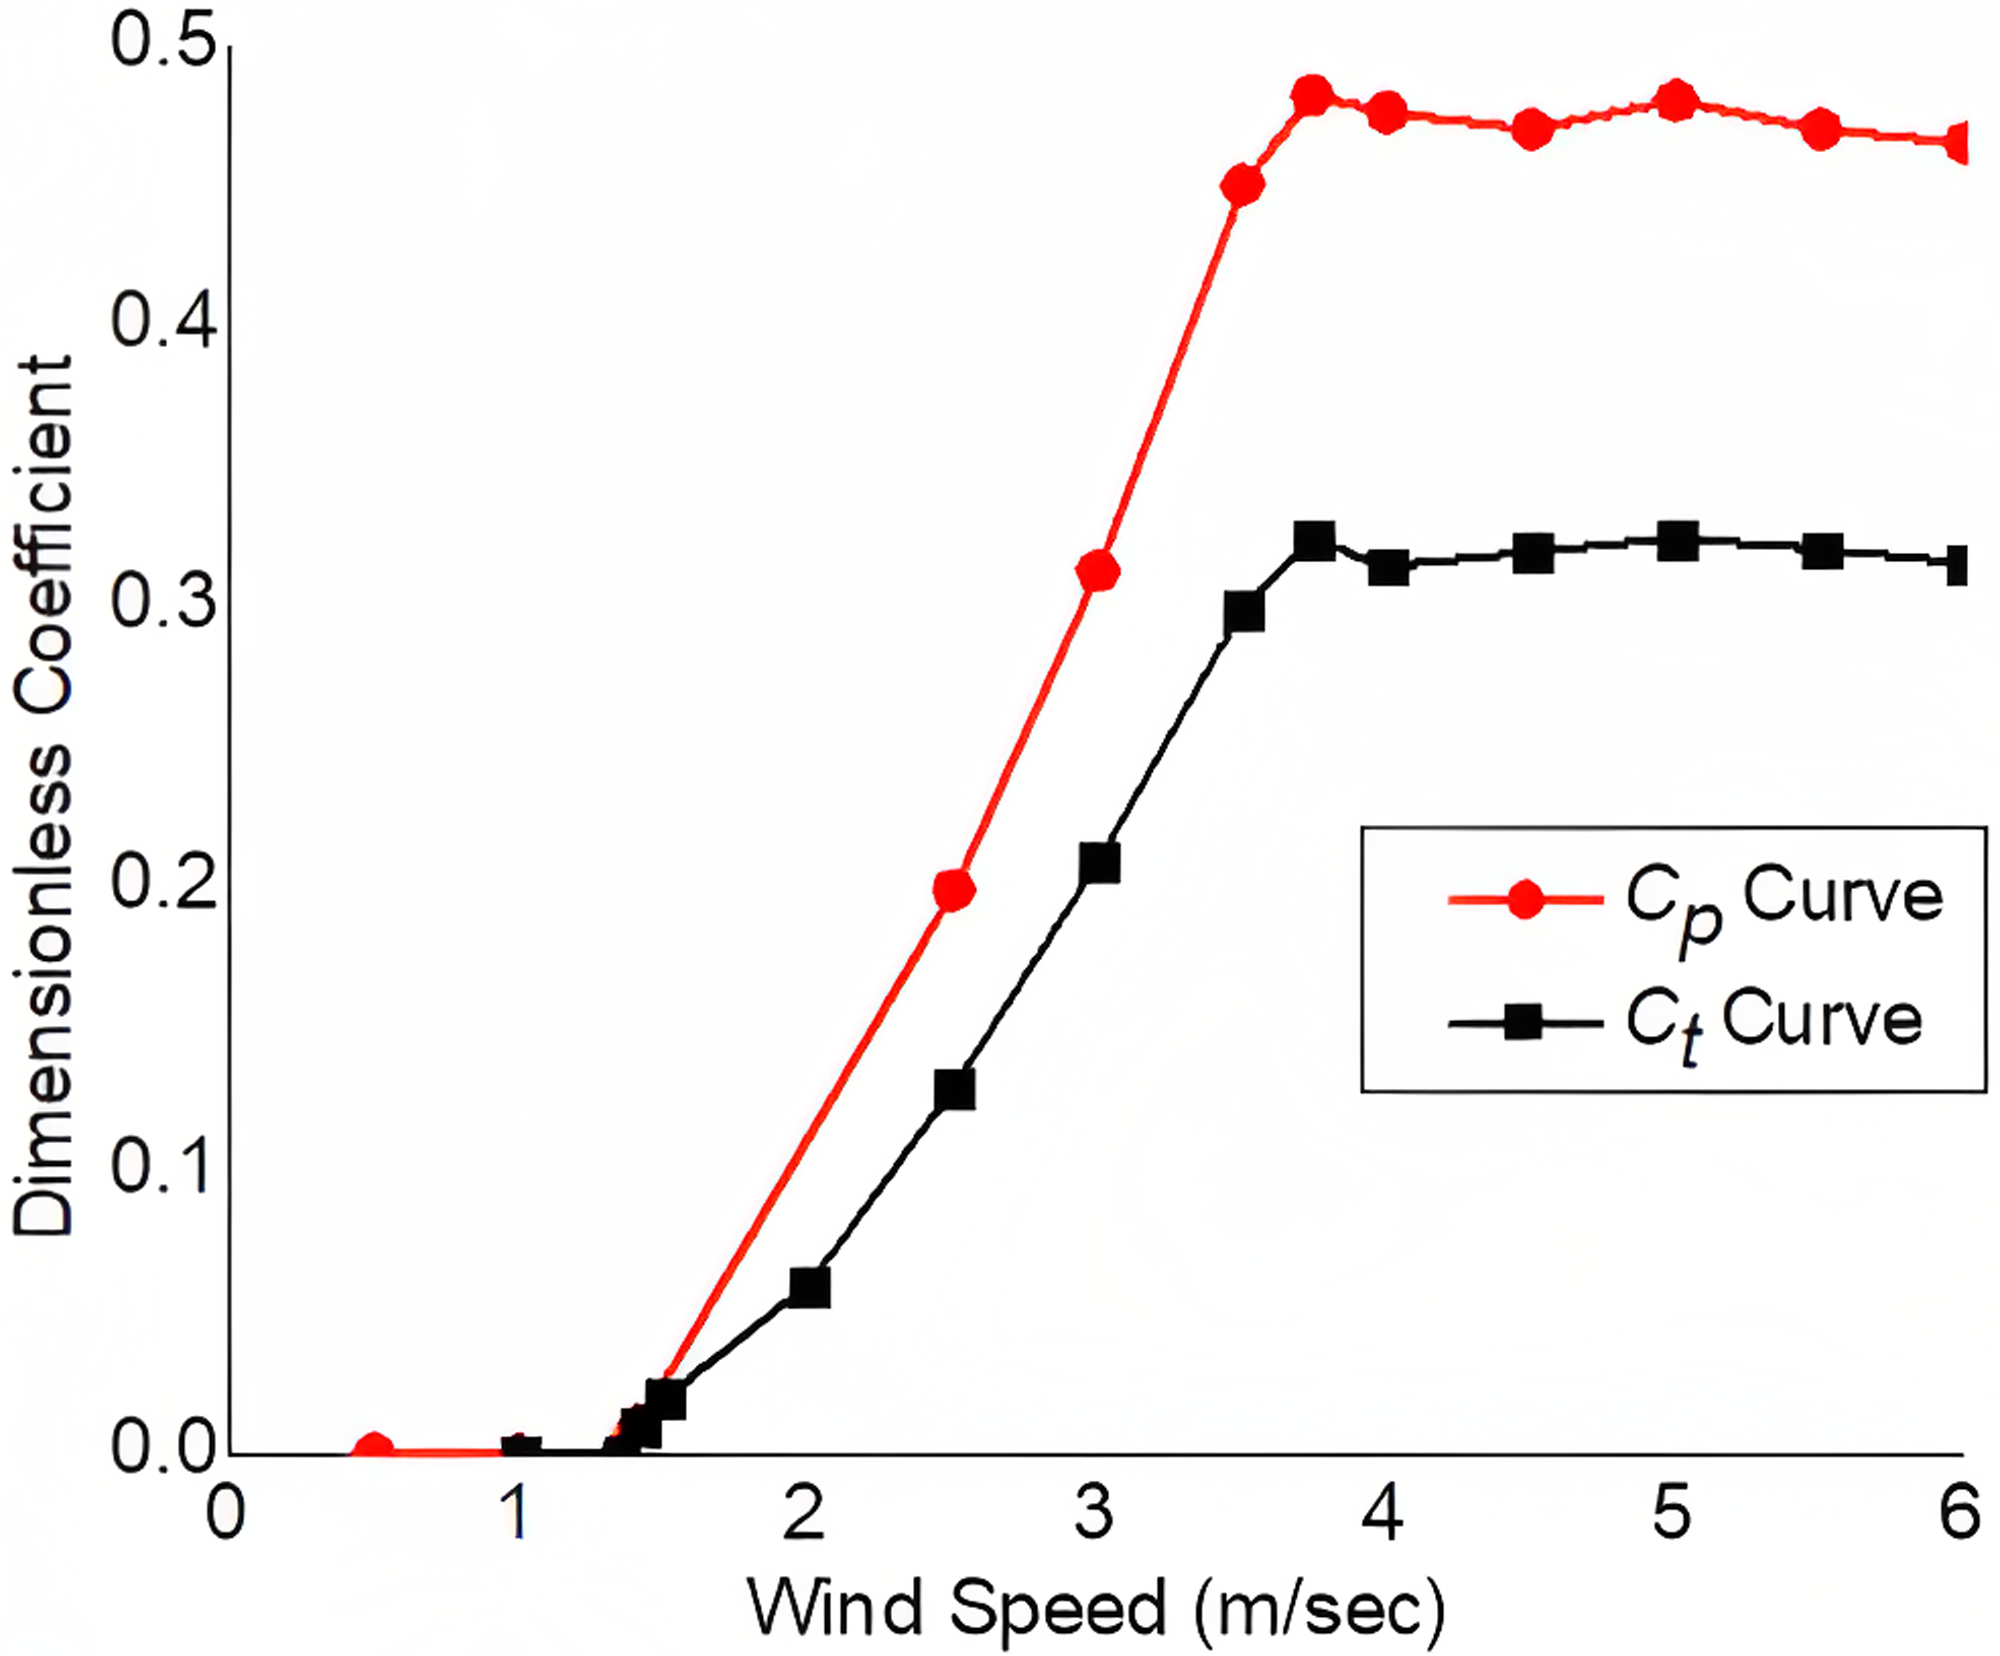
The experimental findings of the aerodynamic performance analysis discussed earlier are reported in this section. The experimental analysis was carried out in a subsonic wind tunnel for different wind speeds varying from 1 to 6 m/s and the corresponding Re was adjusted. The angular velocity and dynamic torque were recorded for the wind speeds considered. Figure 5 presents the variation in and at different wind speeds for the hybrid wind turbine. The lowest wind speed needed to start the wind turbine model was recorded as 1.72 m/s.
Dimensionless performance coefficients (, ) versus wind speed for the present wind turbine. The cut-in speed is as small as 1.72 m/s, as seen in the figure. This feature emphasizes the proposed hybrid wind’s ability to produce more power output and wind energy conversion in low wind areas.
The of a wind turbine indicates its efficiency in converting wind energy into electrical power, which is influenced by various factors, including the turbine’s design, wind speed, and TSR. Optimum power is the output level that maximizes the turbine’s efficiency, impacted by wind speed, turbine size as well as design, and electrical load. As wind speeds increase, the turbine’s power output (or ) also increases until it reaches the rated power limit, beyond which the turbine’s power output may decrease or remain constant (4 m/s as shown in Figure 5).43 In the present case, the hybrid VAWT operates in a peculiar way due to the attachment of inner cambered airfoil blades, which partially reattach the separated shear layer to reinforce lift force. At higher angles of attack, the outer turbine blades may experience decreased lift, which can be compensated for by the advanced position of the smaller inner blades.59
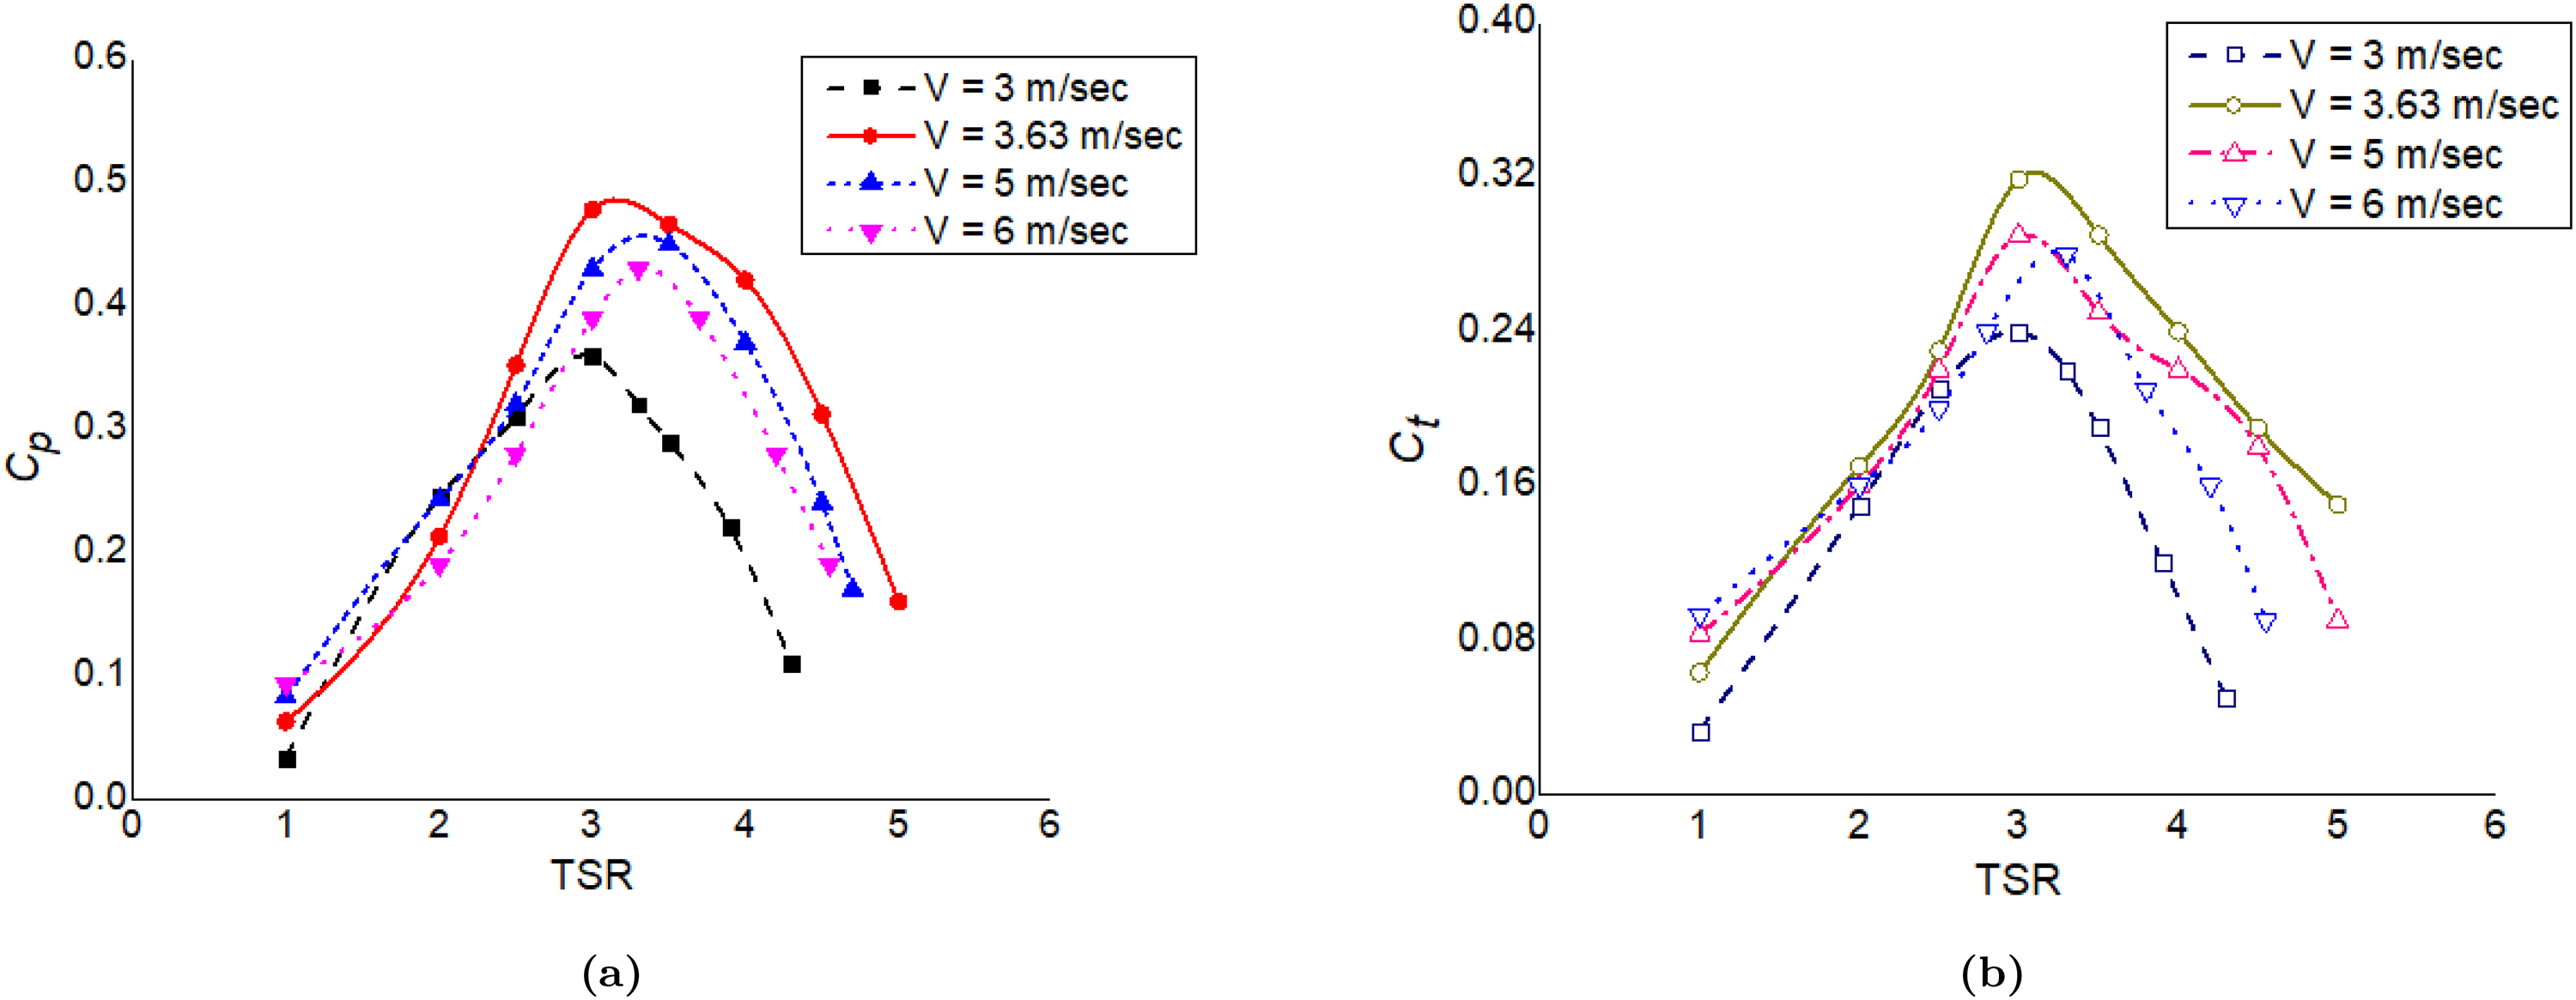
Figure 6 presents the and of the modified hybrid rotor for various TSRs at Re = , , , and , corresponding to wind speeds of 3, 3.63, 5, and 6 m/s. The performance coefficients rise with Re up to corresponding to a wind speed of 3.63 m/s. The maximum of 0.478 was recorded at a TSR of 3 and Re of , and a maximum of 0.319 was achieved for the hybrid VAWT at a TSR of 2.9 with the same Re.
Dimensionless performance coefficients (, ) versus TSR at a wind speed of 3, 3.63, 5, and 6 m/s for the hybrid VAWT. The plots indicate that with the rise in wind speed, increases, and its highest value is obtained as 0.478 at a wind speed of 3.63 m/s. A similar trend can also be visualized from the curves with the highest value of 0.319 at a TSR of 3 and a wind speed of 3.63 m/s. TSR: tip speed ratio; VAWT: vertical axis wind turbine.
Effect of surface roughness
At a low Reynolds number, the boundary layer can be tripped from laminar to turbulent by choosing an appropriate level of surface roughness. The turbulent boundary layer, on the other hand, is more resistant to flow separation. The presence of laminar flow in the separated area can be used to reduce the drag caused by the turbulent flow. Thus, although the skin friction drag increases, the overall drag is reduced. In the current case, the surface of the blade was initially rough after the manufacturing process. Although the exact size of the surface roughness of each blade could not be evaluated due to the lack of an appropriate surface profiler. However, the same was approximated using a feeler gauge. The maximum value of surface roughness was obtained as 0.4 mm, giving a ratio of roughness to chord length equal to 0.008. During the initial testing, rotor blades with surface roughness were tested, and the performance parameters were recorded. The blades were then smoothed using fine-grid glass paper, and the non-dimensional parameter (roughness to chord length) was then obtained as 0.0004. The changes in the dimensions and profile shape were negligible after surface smoothness. The qualitative difference in the blade’s surface after treatment was prominent as observed in Figure 7.
Comparison of rotor blade surface (a) rough surface and (b) smooth surface; the figure shows a significant difference for both the blades.
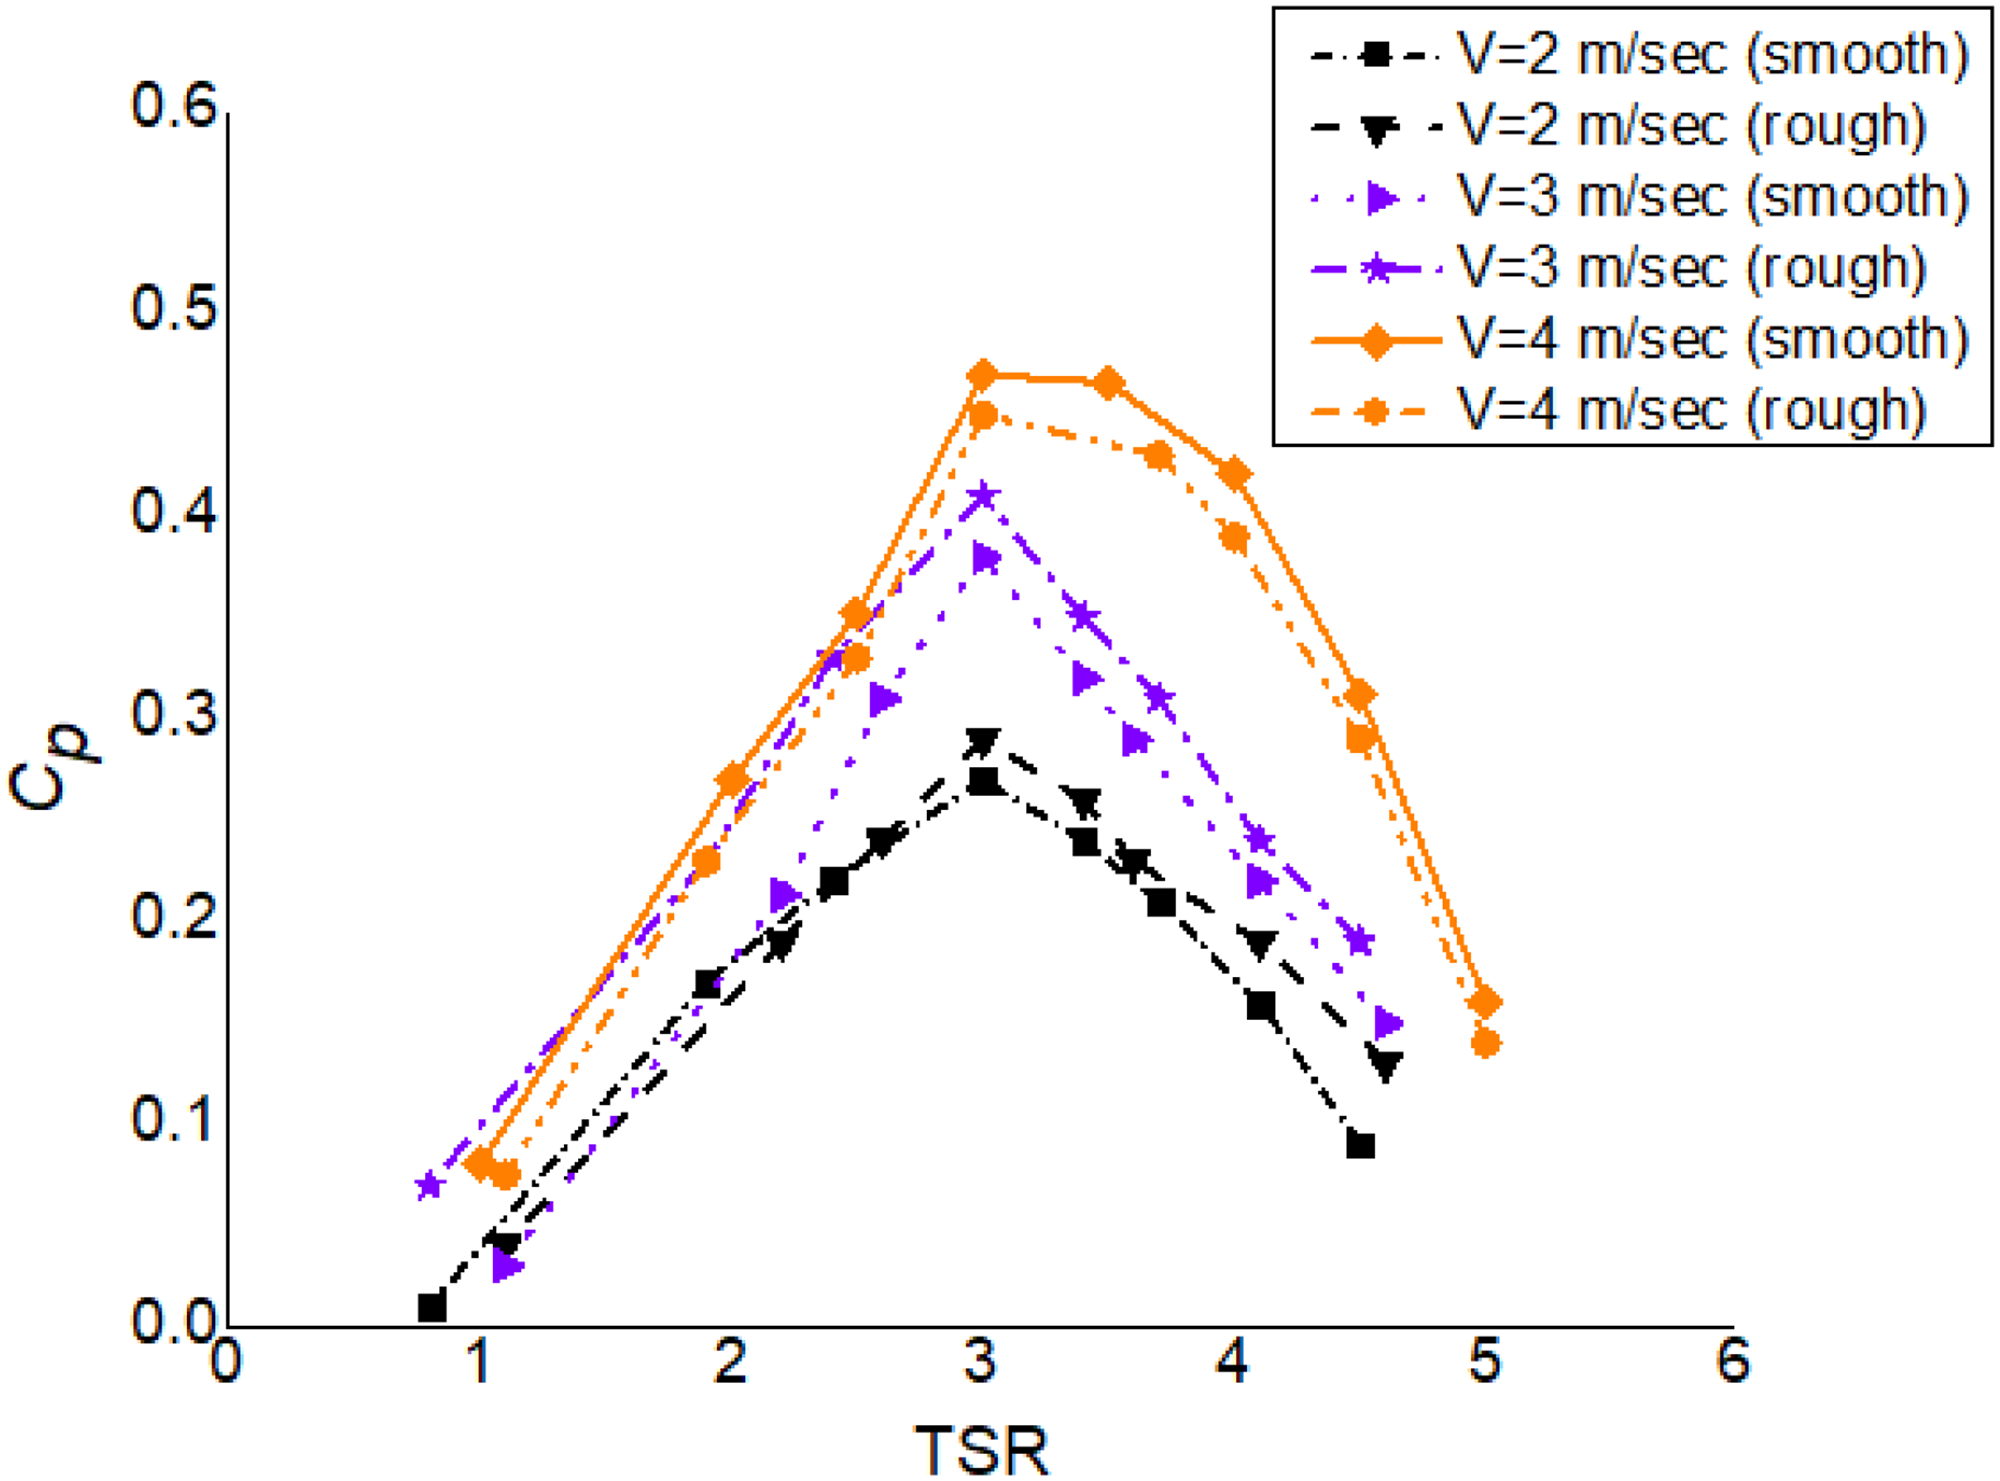
To investigate the influence of surface roughness, experimental analysis was carried out by varying wind speeds between 2 and 4 m/s, and the output in terms of power coefficients versus TSR was recorded, as shown in Figure 8. The hybrid wind turbine model shows that surface roughness has a considerable impact on performance. For wind speed of lower than 4 m/s (Re of 13,585), the smooth surface results in poor performance as compared to the rough surface. The most likely explanation is that the rough surface undergoes a much earlier transition between the turbulent and the laminar boundary layer. As a general comment, for the specific wind speed, Re remains constant; however, in the case of relative wind speed, the same is adjusted accordingly. In this case, during the rotation of the wind turbine, Re changes continuously both in the direction of the incoming wind and against it. As a result, the maximum angular velocity, as well as Re, increases with the rotational velocity of the turbine, leading to a variation in the performance curves. Above 3 m/s, the smooth surface results in more than a rough surface. Moreover, the change in the angle of attack (AoA) is less at low TSRs as compared to high TSRs; therefore, a rough leading-edge surface is very helpful to delay stall occurring at high AoA. The performance parameters can be improved at low Re by the addition of boundary layer trips without compromising the performance at high wind speeds because of an increase in skin friction drag.
Variation of versus tip speed ratio (TSR) for rough and smooth surfaces at various wind speeds; the figure represents that for the wind speeds of 2 and 3 m/s, the rough surface has improved efficiency than the smooth surface. Above a wind speed of 3 m/s, the smooth surface resulted in more at all TSR values.
The experiments were conducted using a scaled-down model of a VAWT due to its cost-effectiveness and practicality in a laboratory setting. To validate and supplement the experimental results, computational analysis was conducted using the same dimensions as the scaled-down model after the experimental results were acquired. This analysis provided a more comprehensive understanding of the behavior of the VAWT under different conditions. In addition, to gain a deeper understanding of the physics of flow in the vicinity of the VAWT, a flow visualization analysis was carried out. The simulations provided visual data on the flow behavior around the VAWT, further validating the experimental results and helping to understand the performance of the turbine. The details of CFD analysis are discussed in the subsequent sections.
CFD analysis
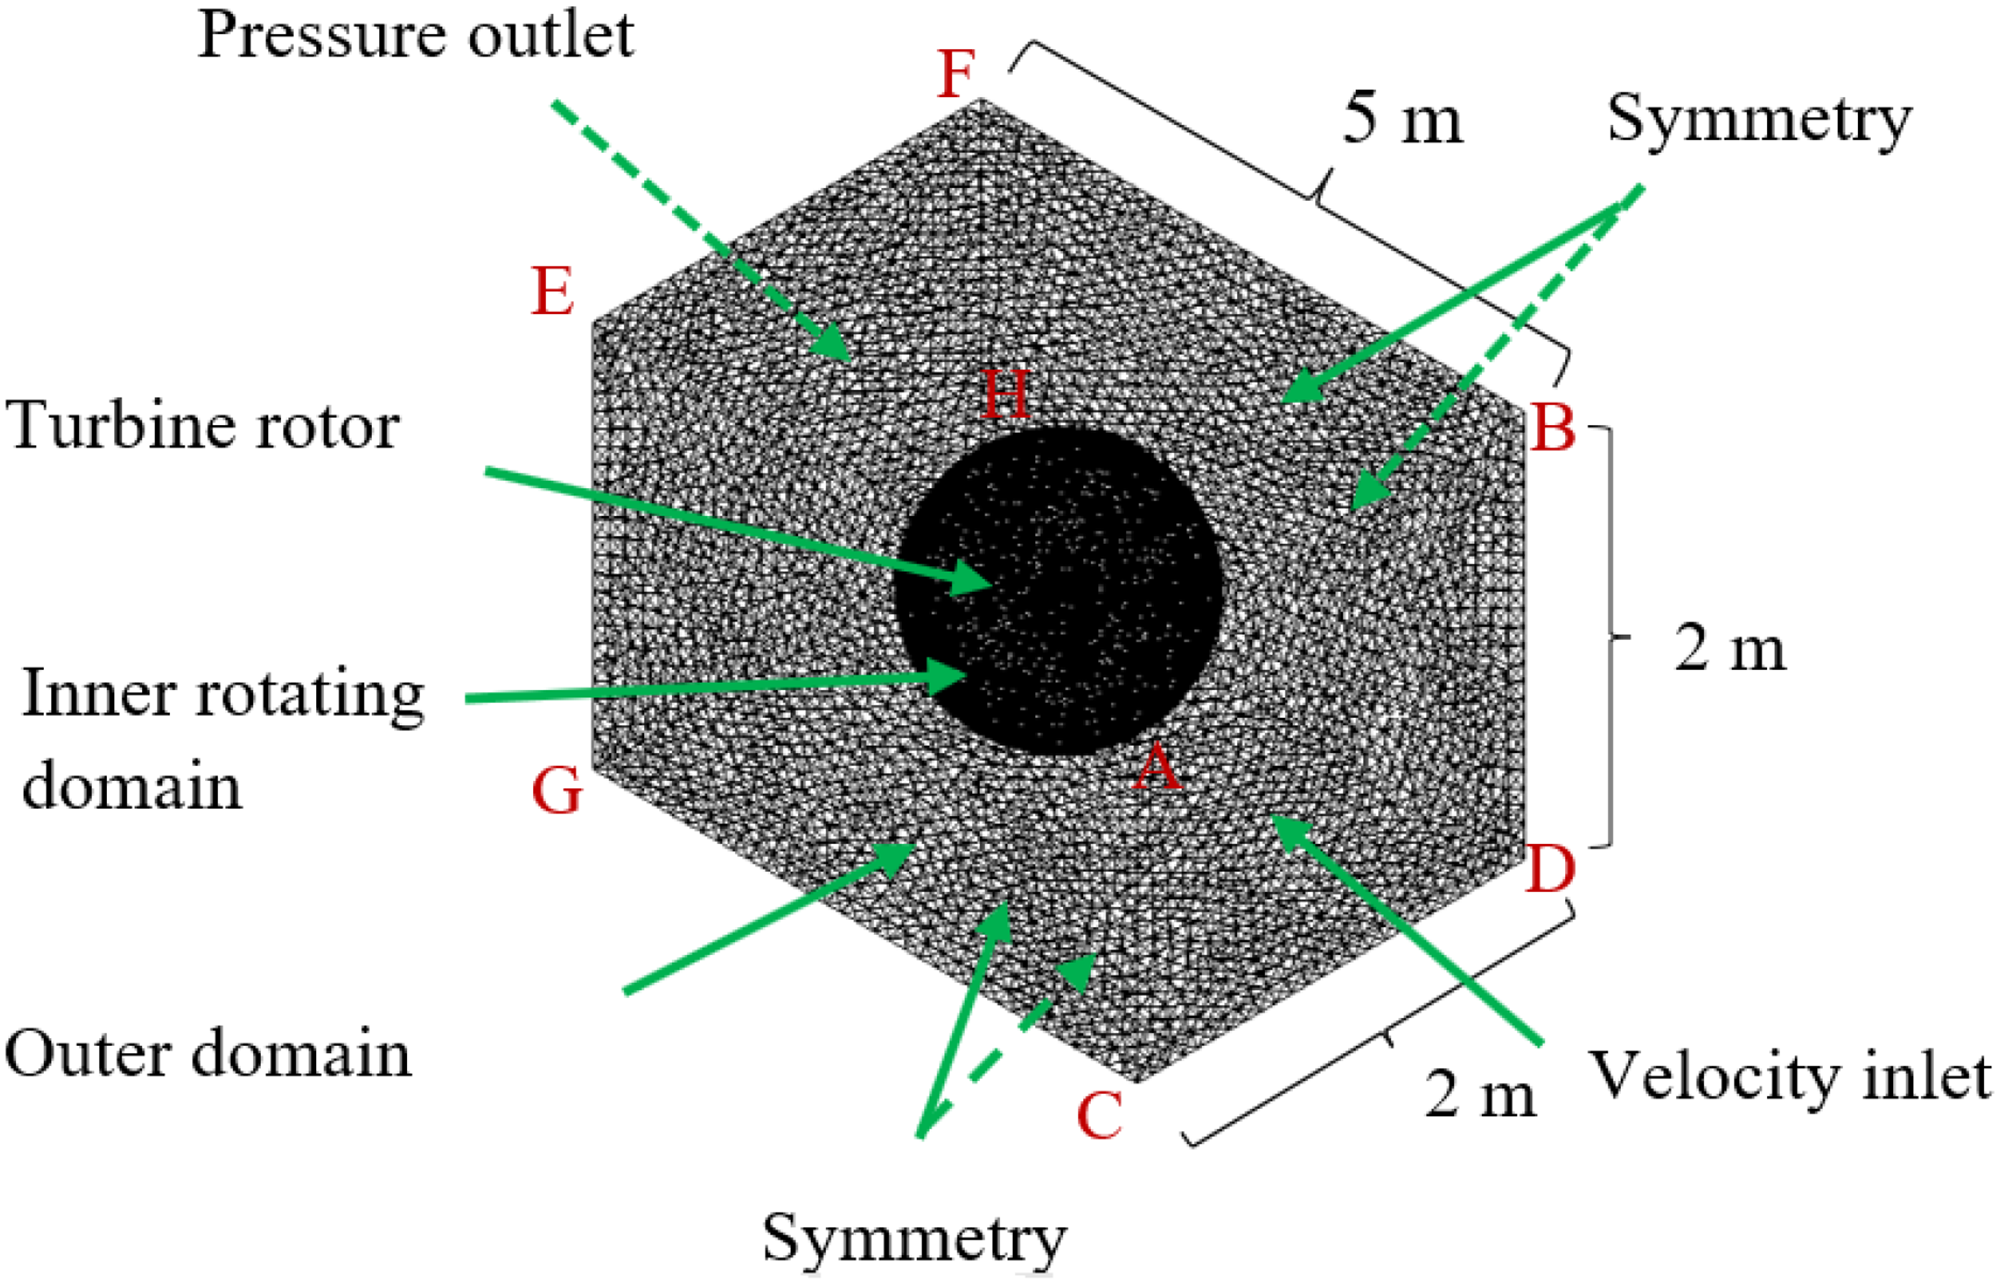
An examination of a hybrid wind turbine’s aerodynamics using computational techniques is presented in this section. A CAD model was prepared based on the scaled-down parameters obtained from similarity analysis. A computational field similar to that of the actual turbine was established around the turbine rotor. The computational domain’s dimensions were adjusted nearly 14.5 times the rotor’s dimensions in order to acquire the flow parameters. In the case of a wind farm arrangement with multiple turbines installed in tandem, the downstream flow from one turbine can have an impact on the subsequent rotor arrangement. In addition, a very small computational domain can affect the flow in the streamwise or vertical direction. However, it is expected that as the downstream distance from the wind turbine increases, the wake effect will eventually dissipate, and the correlation coefficients will return to those of the undisturbed incoming airflow.60,61 For a single turbine, a computational domain of approximately 14.5D (ranging from upstream to downstream) was found to be sufficient in the present study. The boundary conditions include the inlet velocity, symmetry at the sidewalls, and outlet pressure. The rotor blades and the central rotating shaft were subjected to the wall conditions.
Unsteady Reynolds-averaged Navier–Stokes (URANS) is an efficient method for simulating turbulent flows in engineering applications. It provides a time-averaged solution suitable for steady or quasi-steady flows, making it a well-established and widely used method that is relatively easy to use compared to other methods.62 URANS has proven to be reliable for practical applications, especially for moderate Reynolds numbers and less complex geometries, making it a practical and efficient choice when computational resources are limited. A hybrid mesh with embedded prismatic cells for boundary layers in wind turbine analysis in CFD can significantly enhance the accuracy and efficiency of simulations. The use of an unstructured mesh allows for greater flexibility in capturing complex geometries and irregular boundaries, which is particularly useful in wind turbine analysis where the shape and orientation of the blades can vary widely. This approach can provide more reliable and detailed insights into the behavior of wind turbines, helping to optimize their design and performance. In URANS simulations with the k- turbulence model, wake treatment is achieved using the shear stress transport model, which combines the k- model in the near-wall region, providing accurate predictions of turbulent boundary layers and allows for more accurate modeling of the wake of a body. The advanced size function, which considers closeness and curvature, was chosen for the current situation to provide suitable mesh sizes around curved surfaces, tiny sections, and near-wall regions. A total of 15 inflation layers with a 1:1 transition pattern and a growth rate of 1.4 were also chosen in order to fully represent boundary layer effects. Based on the value, the initial cell size close to the wall was calculated and should be smaller than 5 for the viscous sub-layer.63,64 The element size near the walls was set to 0.004 m, and the value was determined for the design wind speed and maximum rotational velocity. More than 2 million mesh components in total were used in the computational domain to provide a grid-independent solution while limiting the maximum skewness to 0.6. Triangular meshes with fine grid spacing at the interface were created to handle mesh deformation and prevent overlapping of the inner and outer fluid domains. The sliding meshing technique was applied at the interfaces, where the element length was set at 0.005 m. This allowed the inner rotating domain to move freely across the outer stationary domain by transferring the fluid flow’s momentum.65 Once the computational setup was established, the rotating and stationary zones were created. The mesh with triangular and tetrahedral grid patterns was generated for both zones. Because the blade profile and flow field surrounding the turbine blades are complex, a triangular mesh with a high density was created to produce a precise flow pattern. The outside faces of the computing domain were given a uniform grid distribution and to separate the rotating domain from the stationary zone, an interface was employed.28 The precise grid spacing of the interface allowed the inner spinning zone to move across the outer stationary zone. A mesh independence test (MIT) was used to evaluate the grid size. The MIT’s details are explained in the following section.
Mesh and time-step independence test
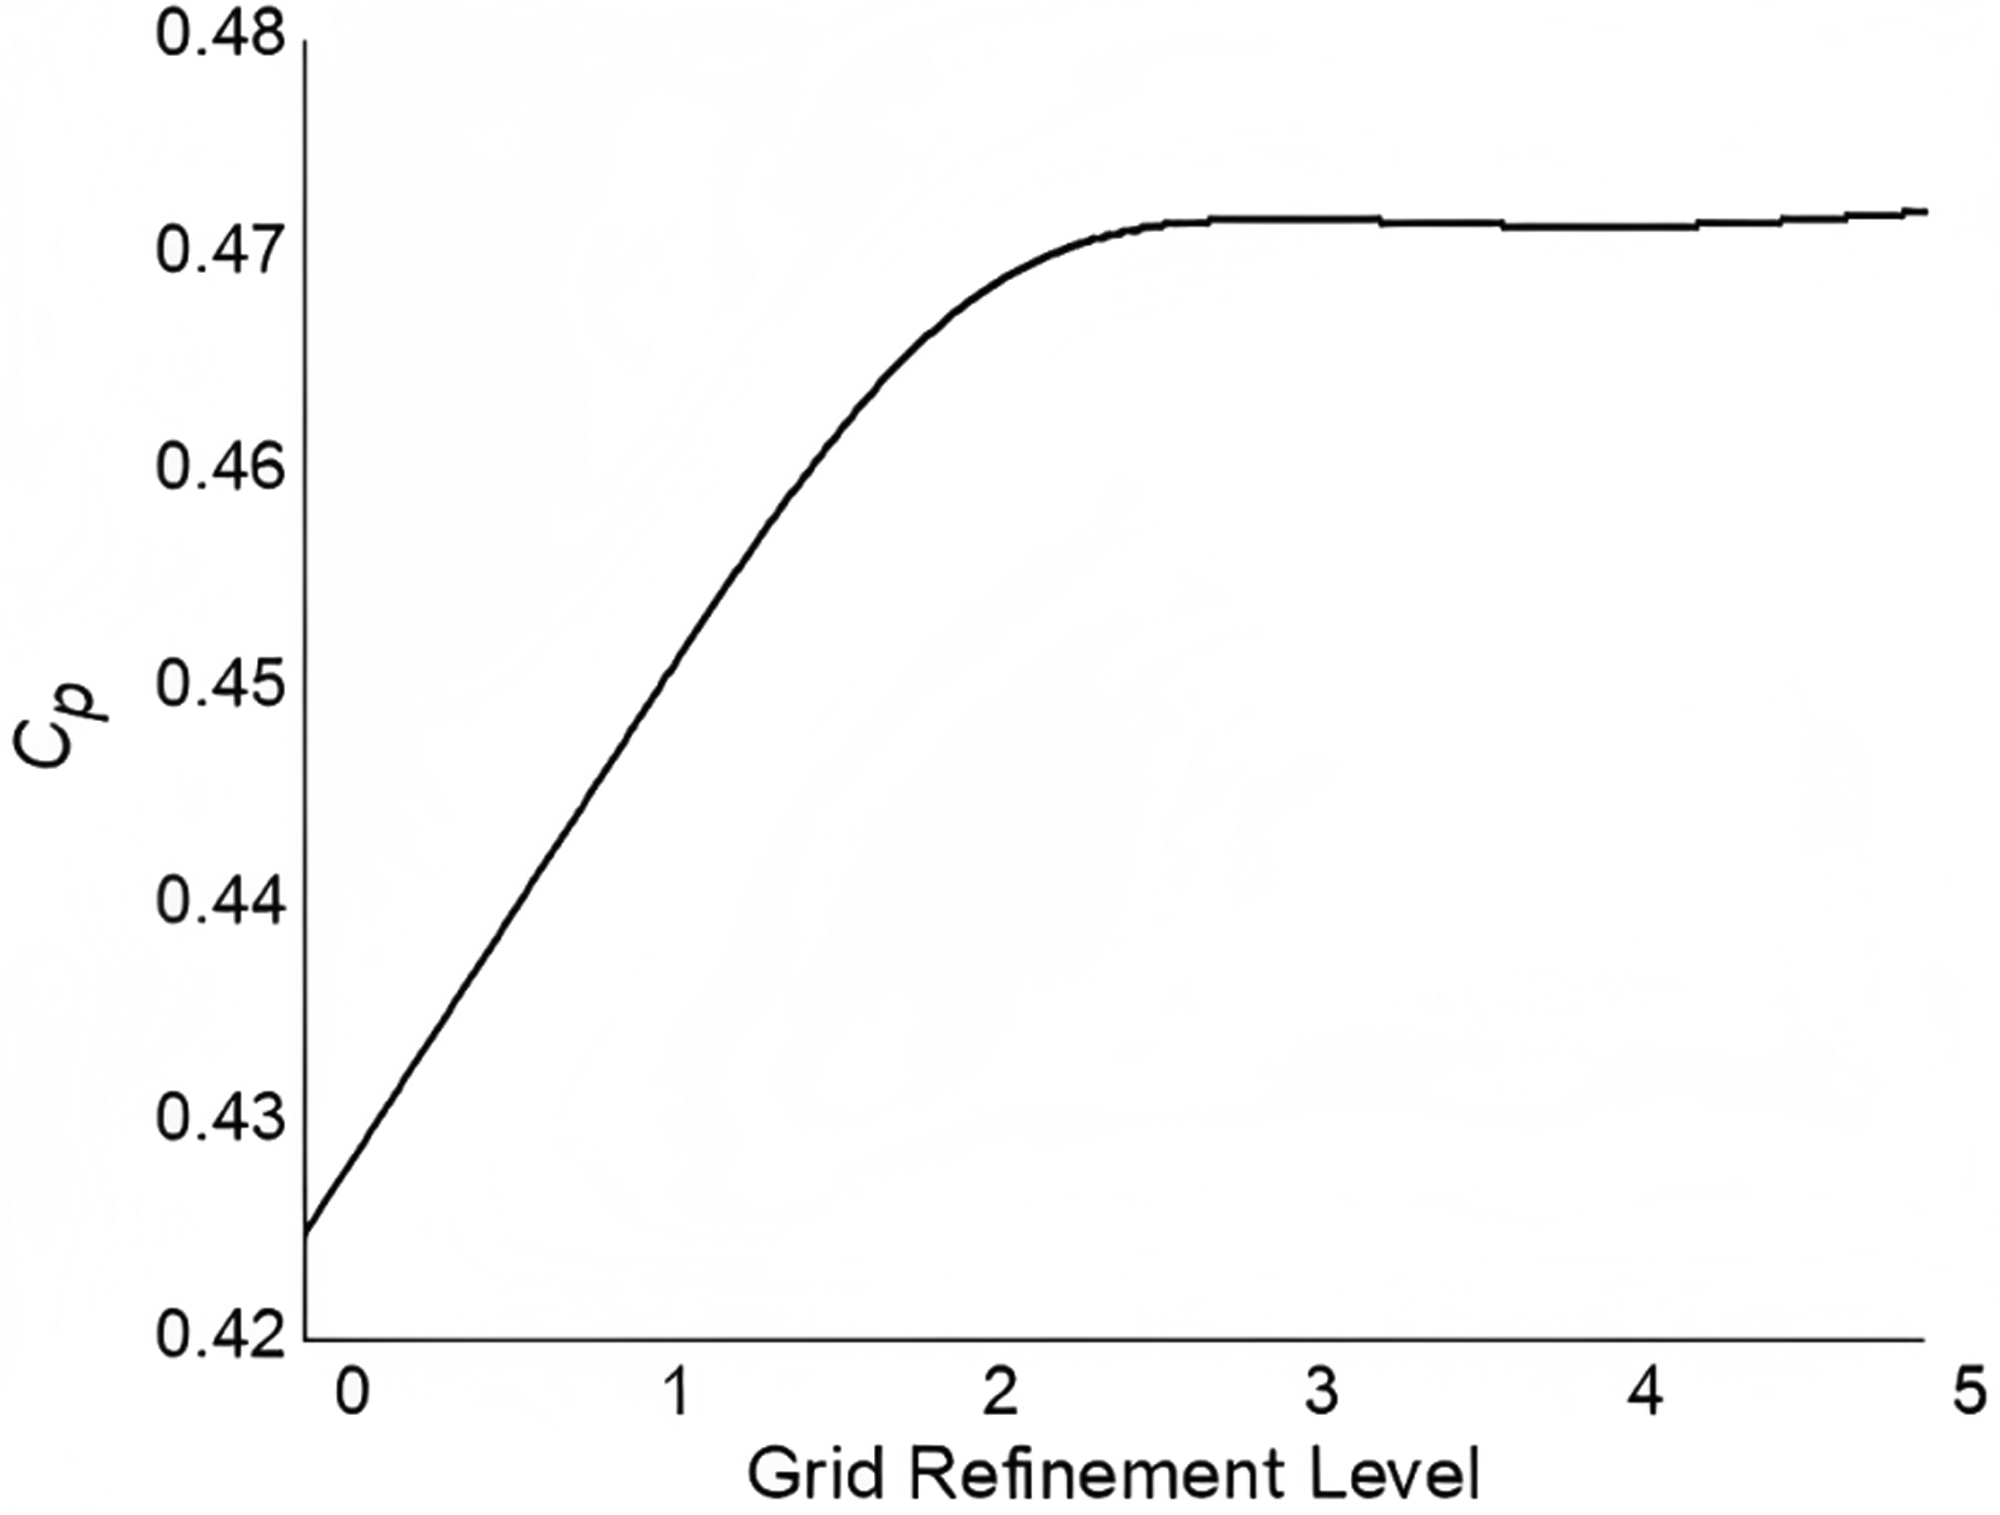
A suitable mesh size was chosen based on an MIT to compute the wind turbine’s performance parameters. The analysis of the impact of mesh size on the estimation of was conducted to ensure the reliability and accuracy of the results. The was estimated for various grid sizes ranging from coarse to fine (0–5). For each level of refinement, the number of nodes and elements was recorded, which provided valuable insights into the computational cost and performance of the simulations. By analyzing the data, the appropriate level of refinement required for achieving mesh independence and accurate results were determined. This rigorous approach to mesh refinement and analysis helped to ensure that the simulations were not only accurate but also computationally efficient, reducing the risk of errors and providing a solid foundation for subsequent analysis. The number of nodes and elements for various levels of refinement was recorded. The variation in of the scaled-down model with the refinement levels of the grid is shown in Figure 9. The investigation showed that there was no significant change in the estimation of after refinement level 2 (321,189 nodes), demonstrating that the results were independent of the mesh size. Through this phase, simulation efficiency and accuracy were improved, lowering the chance of mistakes and improving the caliber of the outcomes. Therefore, the same mesh size was selected for further analysis. Figure 10 shows both the given boundary conditions and the computational domain. The grid was built with a growth rate of 1.4 and a transition pattern of 1:1. After the mesh was successfully constructed, the domain was exported to Fluent for computational analysis.
Power coefficient () versus grid refinement levels of scaled-down model. The figure shows that no substantial quantitative change occurred after refinement level 2 (321,189 nodes), which indicates that mesh size does not affect performance beyond this level.
The mesh created in the rotating, stationary zones and around the rotor blades.
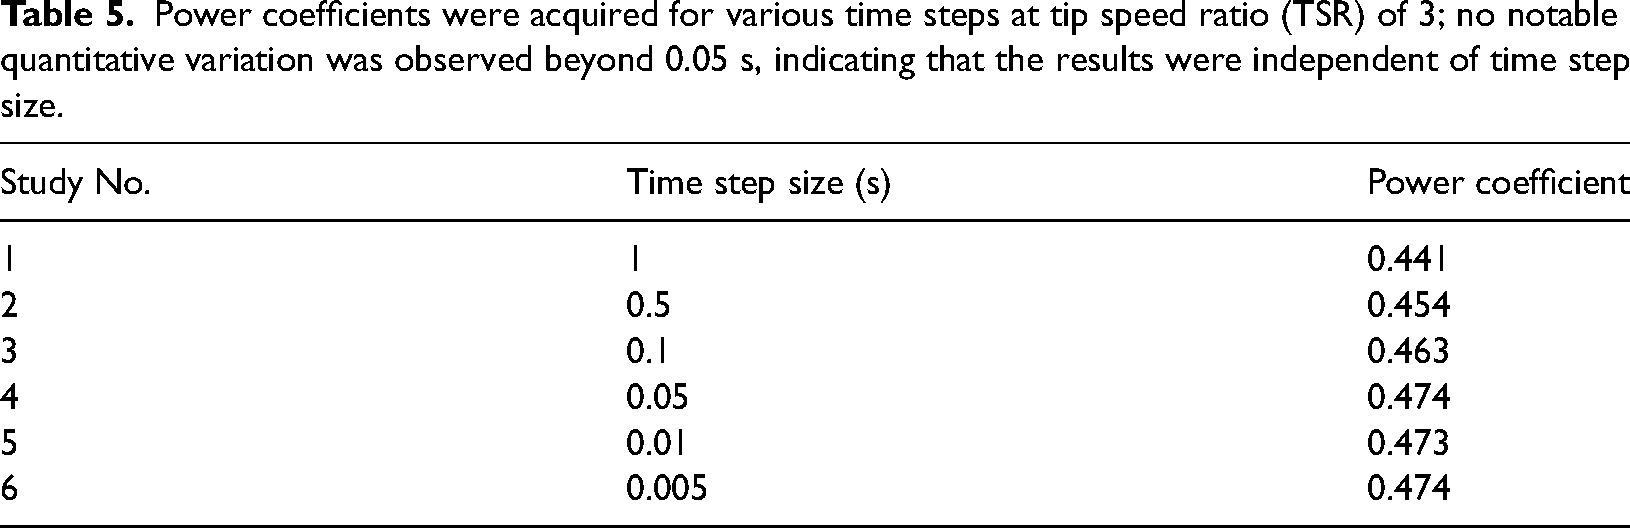
The computational transient analysis is also influenced by the size of the time step. Transient simulations were conducted using different time steps between 0.005 to 1 s to determine the appropriate time step for computational analysis. Table 5 shows the outcomes for various time steps at a TSR of 3. Results showed that a time step of 0.05 s was optimal for the analysis (below that no pertinent quantitative variation occurred), ensuring the efficiency and reliability of the simulations. Therefore, a time step of 0.05 s was chosen for subsequent analysis.
Power coefficients were acquired for various time steps at tip speed ratio (TSR) of 3; no notable quantitative variation was observed beyond 0.05 s, indicating that the results were independent of time step size.
Study No.
Time step size (s)
Power coefficient
1
1
0.441
2
0.5
0.454
3
0.1
0.463
4
0.05
0.474
5
0.01
0.473
6
0.005
0.474
CFD formulation
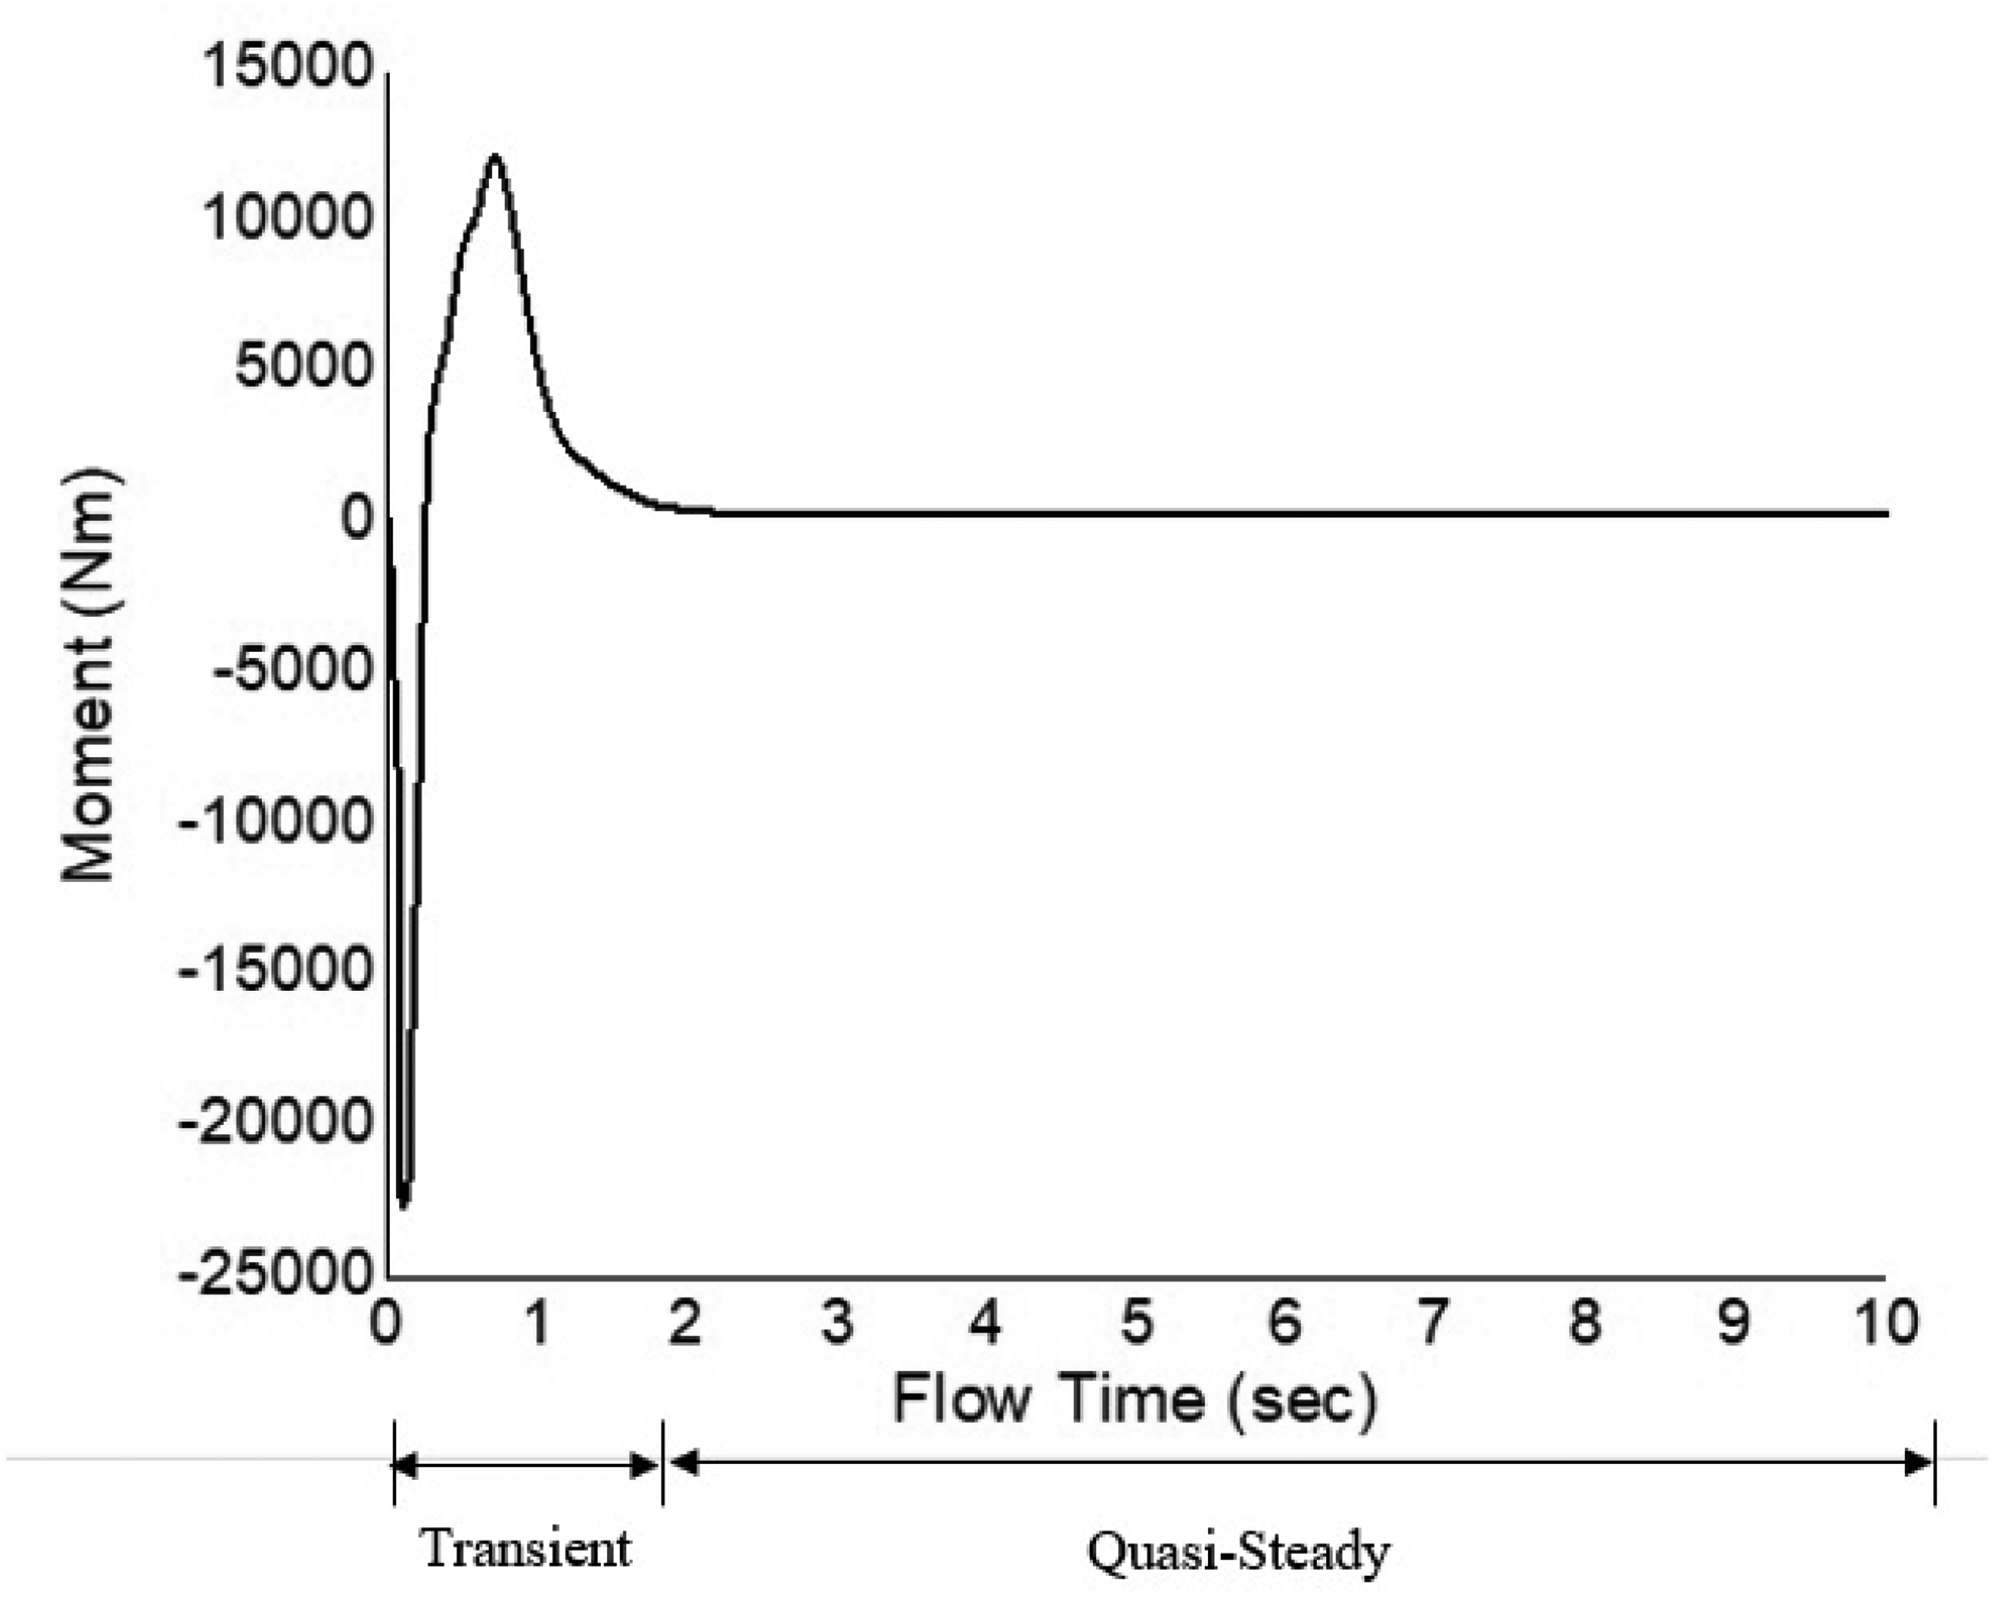
The sliding mesh method was used for the computational analysis, which requires the creation of several zones surrounding the geometry, as well as interfaces to aid mesh motion. To specify the physical properties of energy, momentum, and fluid movement, a set of differential equations was solved.18,65 The k- turbulent flow model suffers from minimal convergence problems and provides better results; therefore, the same was applied to the present study. The selection of the k- turbulence model for the computational analysis was based on several factors. Firstly, the model has been demonstrated to produce highly accurate results that closely match experimental data.66 Secondly, the model is capable of predicting separated flow patterns efficiently, which is a key requirement for this analysis. Therefore, considering these advantages and recommendations by various authors, the k- turbulence model was deemed the most appropriate choice for the present study.65,28,30 The convective parts of the momentum and turbulence equations were discretized using a second-order technique during the analysis. The analysis was performed for various TSRs and the moment values were recorded for each time step. Figure 11 shows the transient response up to 1.9 s after the quasi-steady-state was achieved. In reality, many fluid flow problems are not truly steady-state but can be considered quasi-steady-state over a short period of time. A common criterion for quasi-state in CFD is the time-averaged solution, where the solution remains constant over a certain number of time steps. The attainment of the quasi-steady-state depends not only on the temporal criterion but also on the flow type and geometry of the problem.67,68
The turbine showed a transient reaction up to 1.9 s, after that a quasi-steady-state was achieved with no moment fluctuations, as shown by the variation of the hybrid wind turbine’s moment with flow time.
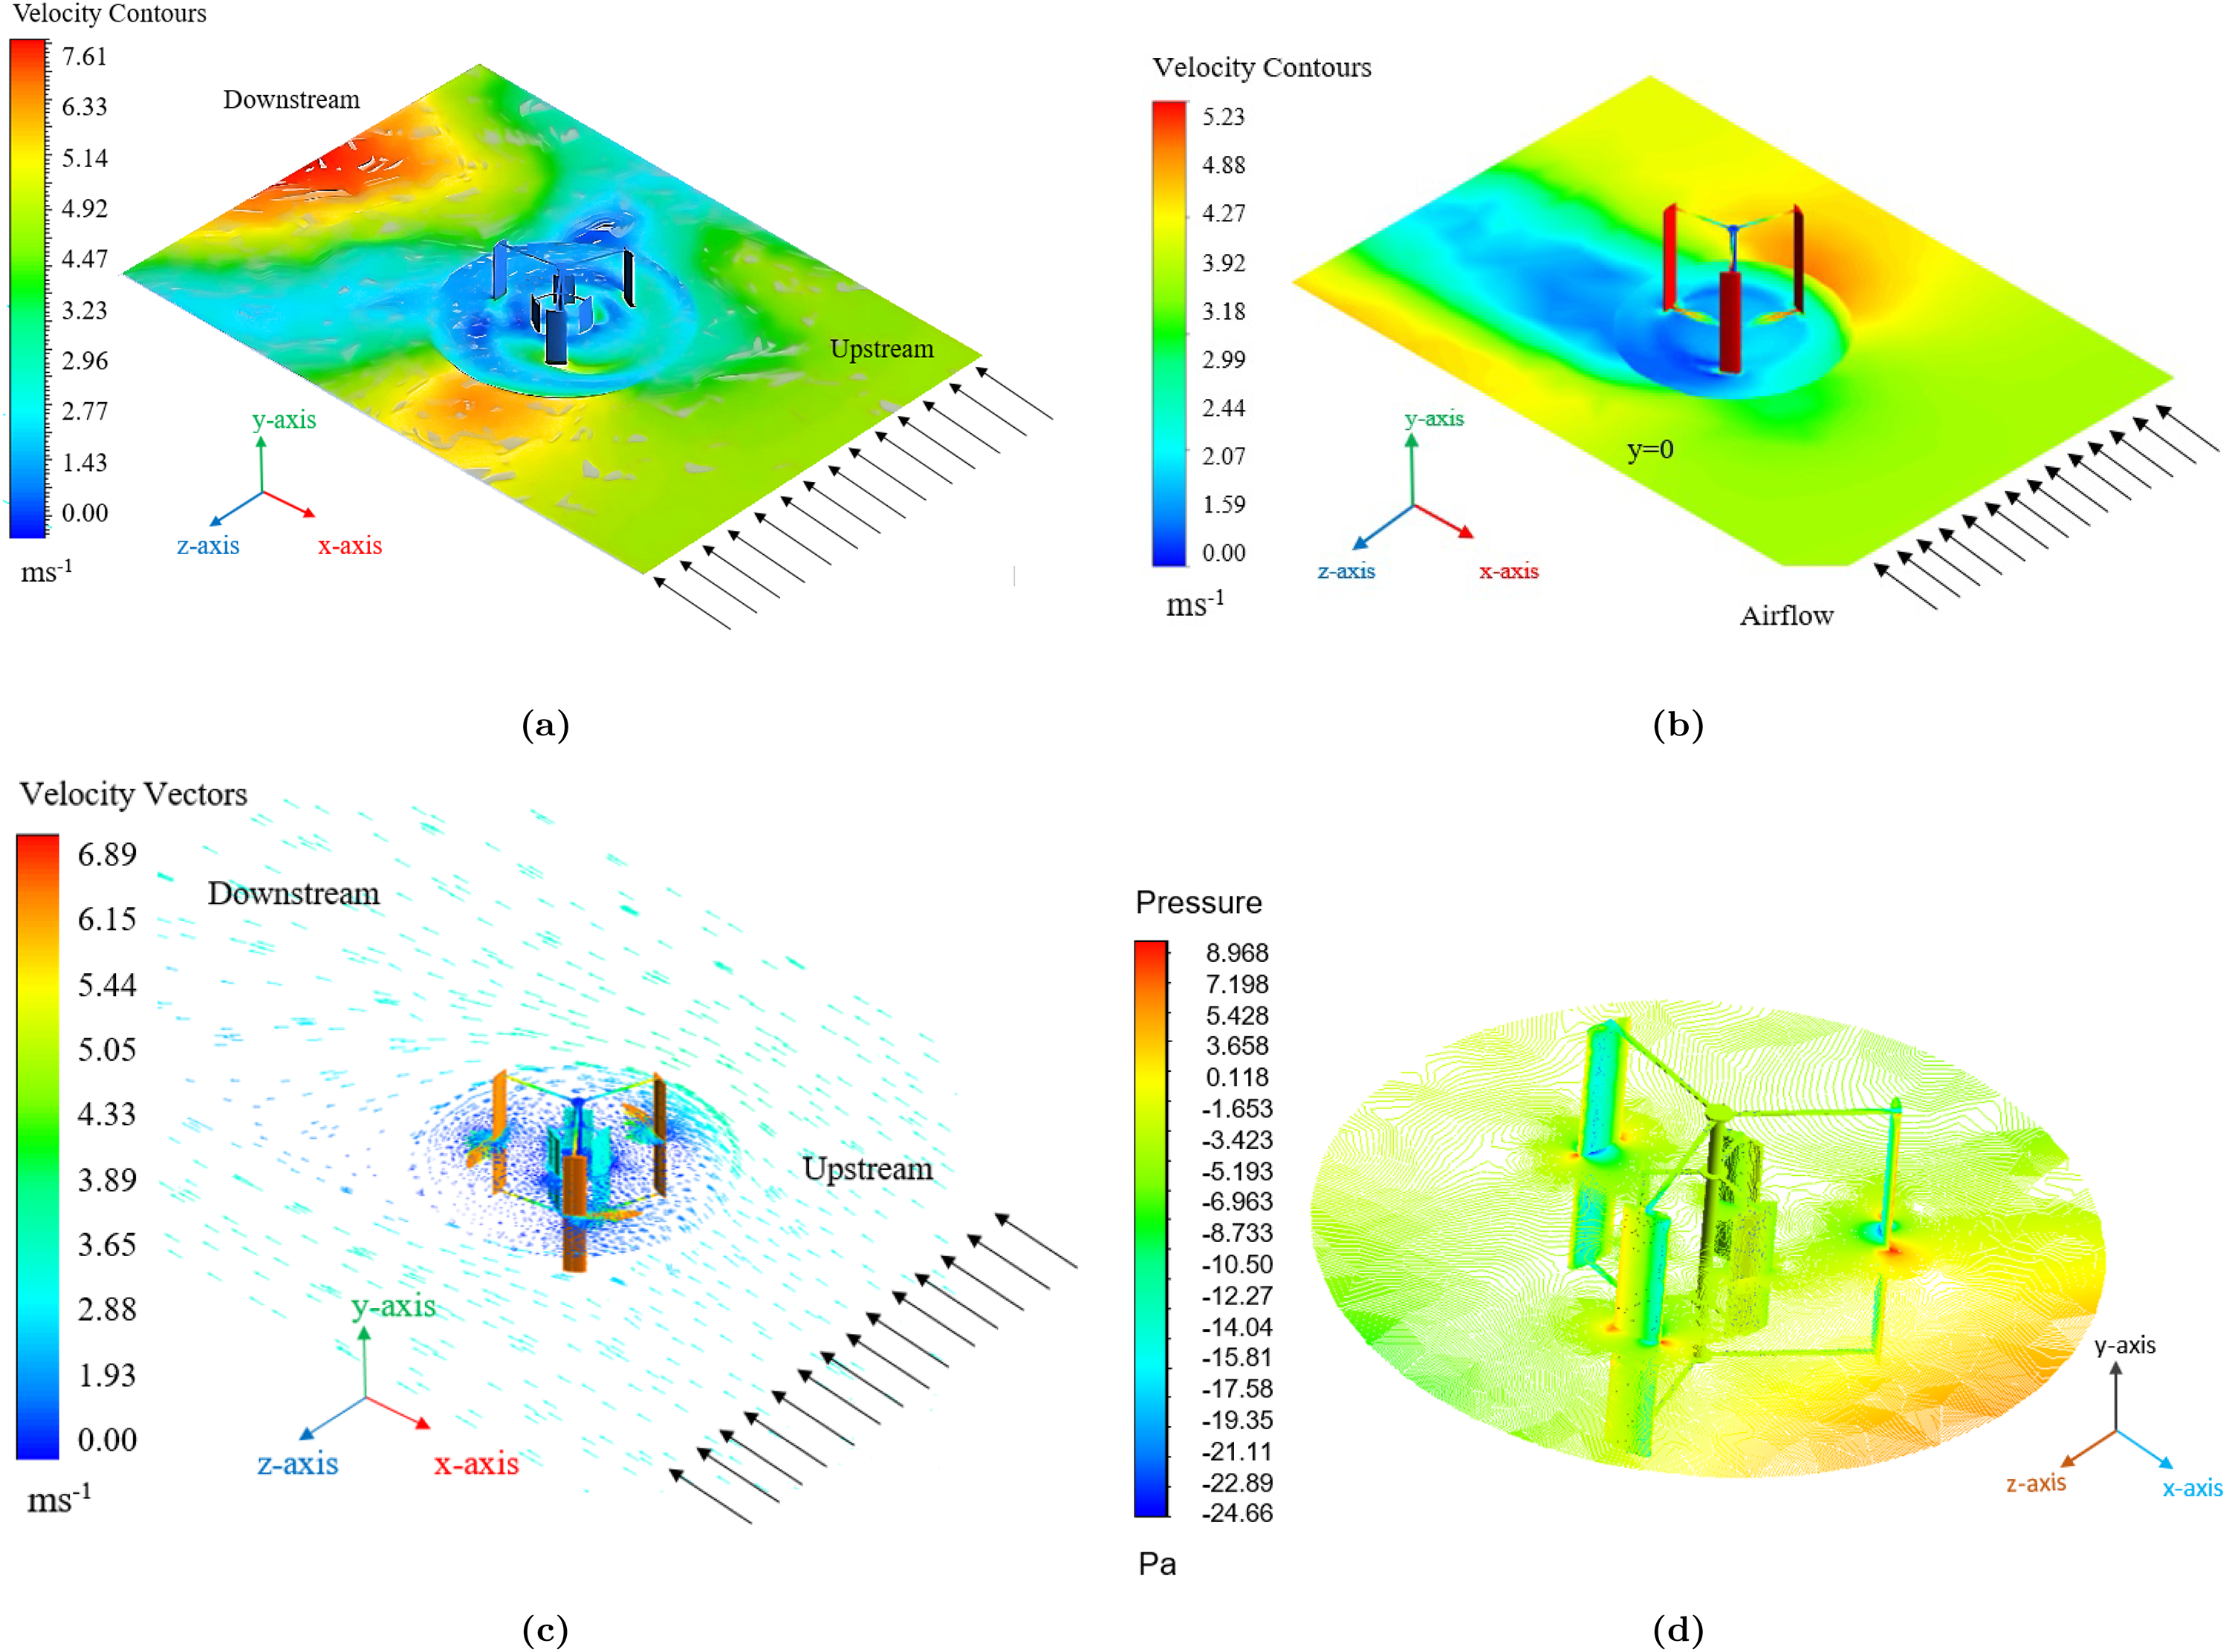
To study the flow physics, velocity contours by creating horizontal and vertical iso-planes, and static pressure around the turbine rotor were captured as shown in Figure 12. The velocity variation along the -plane can be seen in Figure 12(a). The rotor draws energy from the wind as it passes through each iso-plane, as seen by the reduction in relative velocity. Furthermore, in order to compare the velocity values with those of the proposed hybrid VAWT, Figure 12(b) displays the velocity contours for a single-rotor turbine with the same swept area. According to the results, the proposed hybrid VAWT has greater velocity values than the single-rotor turbine, which may lead to a more effective method of generating electricity. These findings demonstrate the potential of the hybrid VAWT design to provide better energy capture and output than conventional single-rotor turbines. Velocity contours and vectors display features of the wake structure and provide a great visualization of the flow around the model. The iso-planes show how the intensity of the tip vortex changes when the turbine blades encounter different phase angles. The tip vortex is strong immediately after the rotor blade achieves the highest lift, as is the case with the rotor blades. The change in strength is due to the turbine rotor blade’s changing lift as it spins at different azimuths. The production of the maximum lift and maximum intensity of the tip vortex is likely to be separated by a short period. The probable reason for this is the time it takes for the flow to react to variations in the lift around the turbine blades. Furthermore, the pressure contours reveal that the blade surface facing the entering flow is under more pressure than the opposite side. The contour lines converge closer to the blade surface, showing an increase in the pressure magnitude.
The variation of parameters alongside of iso-planes: (a) velocity contours in -plane for hybrid vertical axis wind turbine (VAWT); (b) velocity contours in -plane for single-rotor VAWT; and (c) velocity vectors for hybrid VAWT. The figure represents the reduction in velocity downstream resulting in the rotor extracting energy from the wind. (d) Static pressure contours for hybrid VAWT indicate that the blade surface facing the incoming flow has high pressure than the other side, as a result, the rotor receives a useful lift.
Computational results
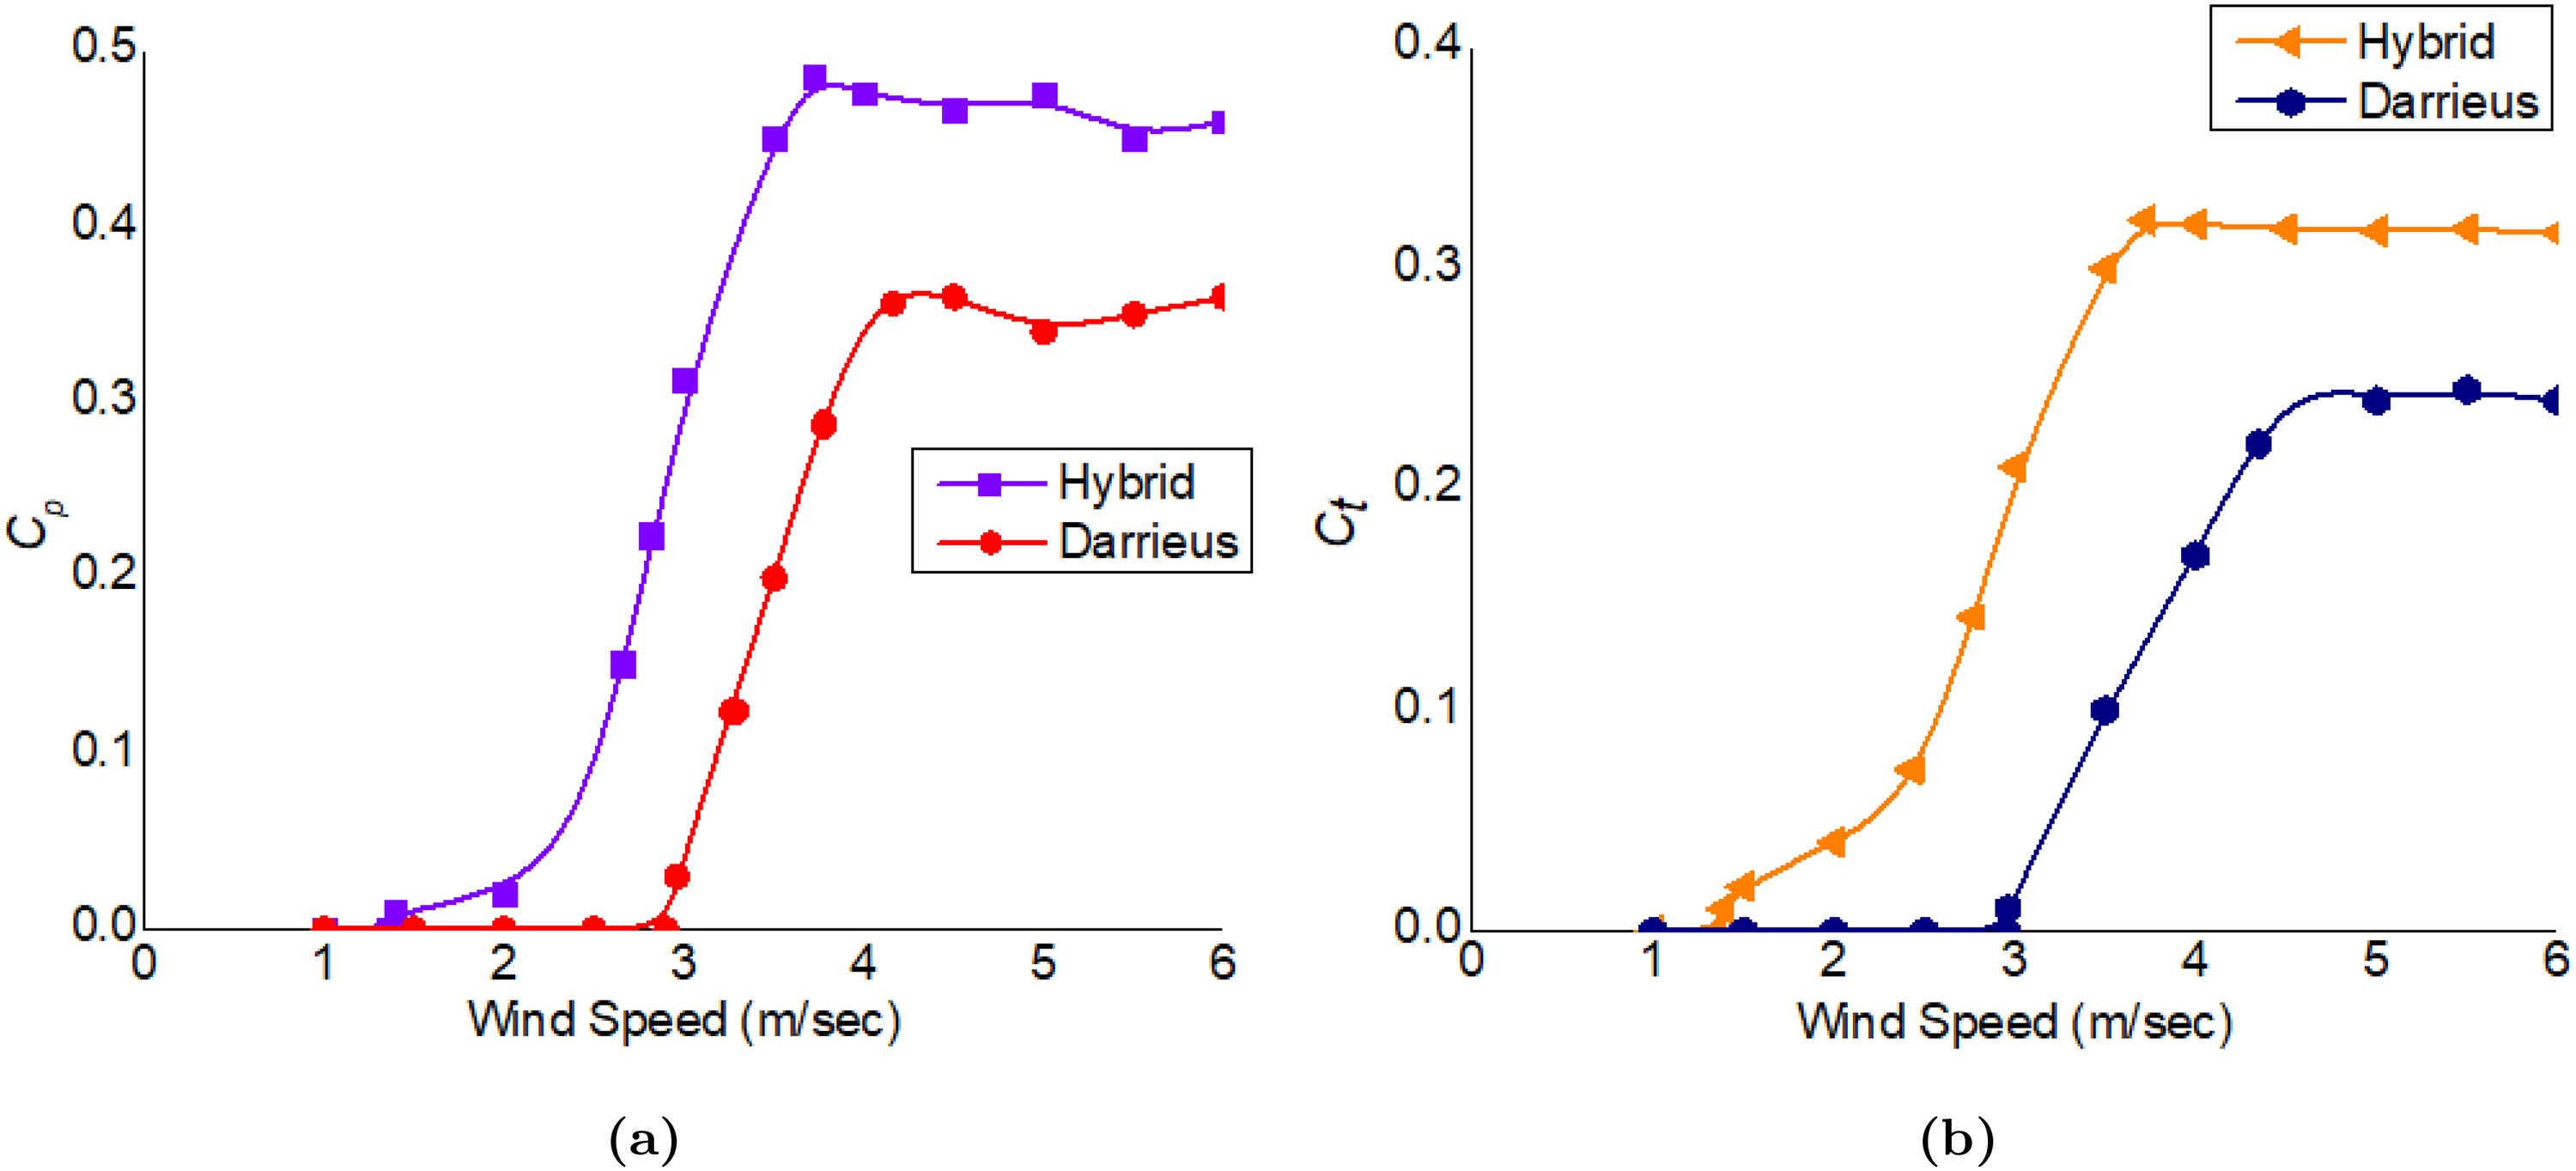
For different wind speeds and TSRs, the computational analysis was carried out and output in terms of dimensionless coefficients was obtained as presented in Figures 13 to 15. Figure 13 shows the and for different wind speeds (1–6 m/s) for the present hybrid wind turbine and the H-rotor turbine. The figure shows that the H-rotor Darrieus configuration provides almost no power for the wind speed is lesser than 2.96 m/s. In other words, under the required conditions, the H-rotor Darrieus turbine could not convert the wind’s kinetic energy into electricity. Furthermore, the figure indicates that the hybrid VAWT has more than the H-rotor turbine for all the considered wind speeds.
Power coefficient () and torque coefficient () versus wind speed of the present hybrid and H-rotor Darrieus turbine. The H-rotor Darrieus produces no power below 2.96 m/s, however, the innovative hybrid wind turbine’s cut-in speed is 1.54 m/s. A larger and low cut-in speed show that the hybrid wind turbines can convert wind energy even at low wind speeds, resulting in higher power output.
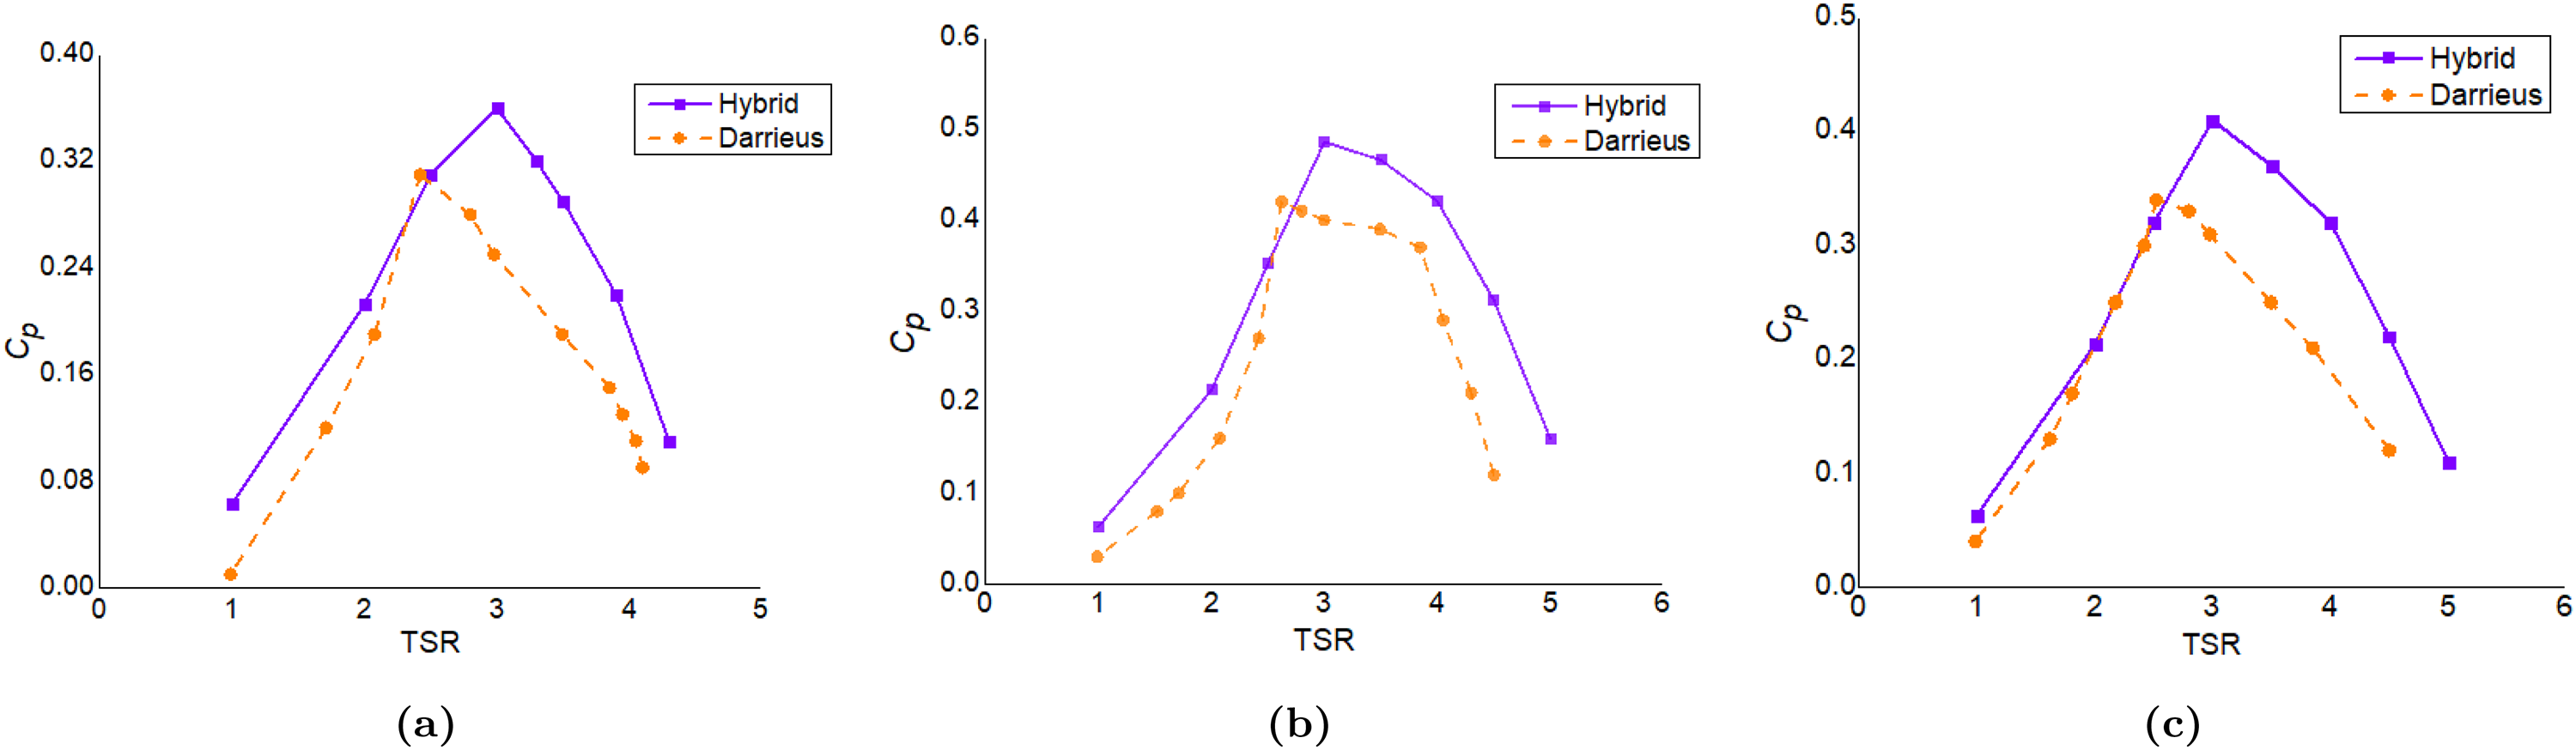
The present hybrid wind turbine and H-rotor Darrieus turbine’s power coefficient () versus TSR at wind speeds of (a) 3 m/s, (b) 3.64 m/s, and (c) 5 m/s. The innovative VAWT has a greater than the H-rotor Darrieus turbine for various wind speeds, as presented in the figure. For the proposed hybrid arrangement, the highest was found as 0.486 at 3.64 m/s at TSR of 3. TSR: tip speed ratio; VAWT: vertical axis wind turbine.
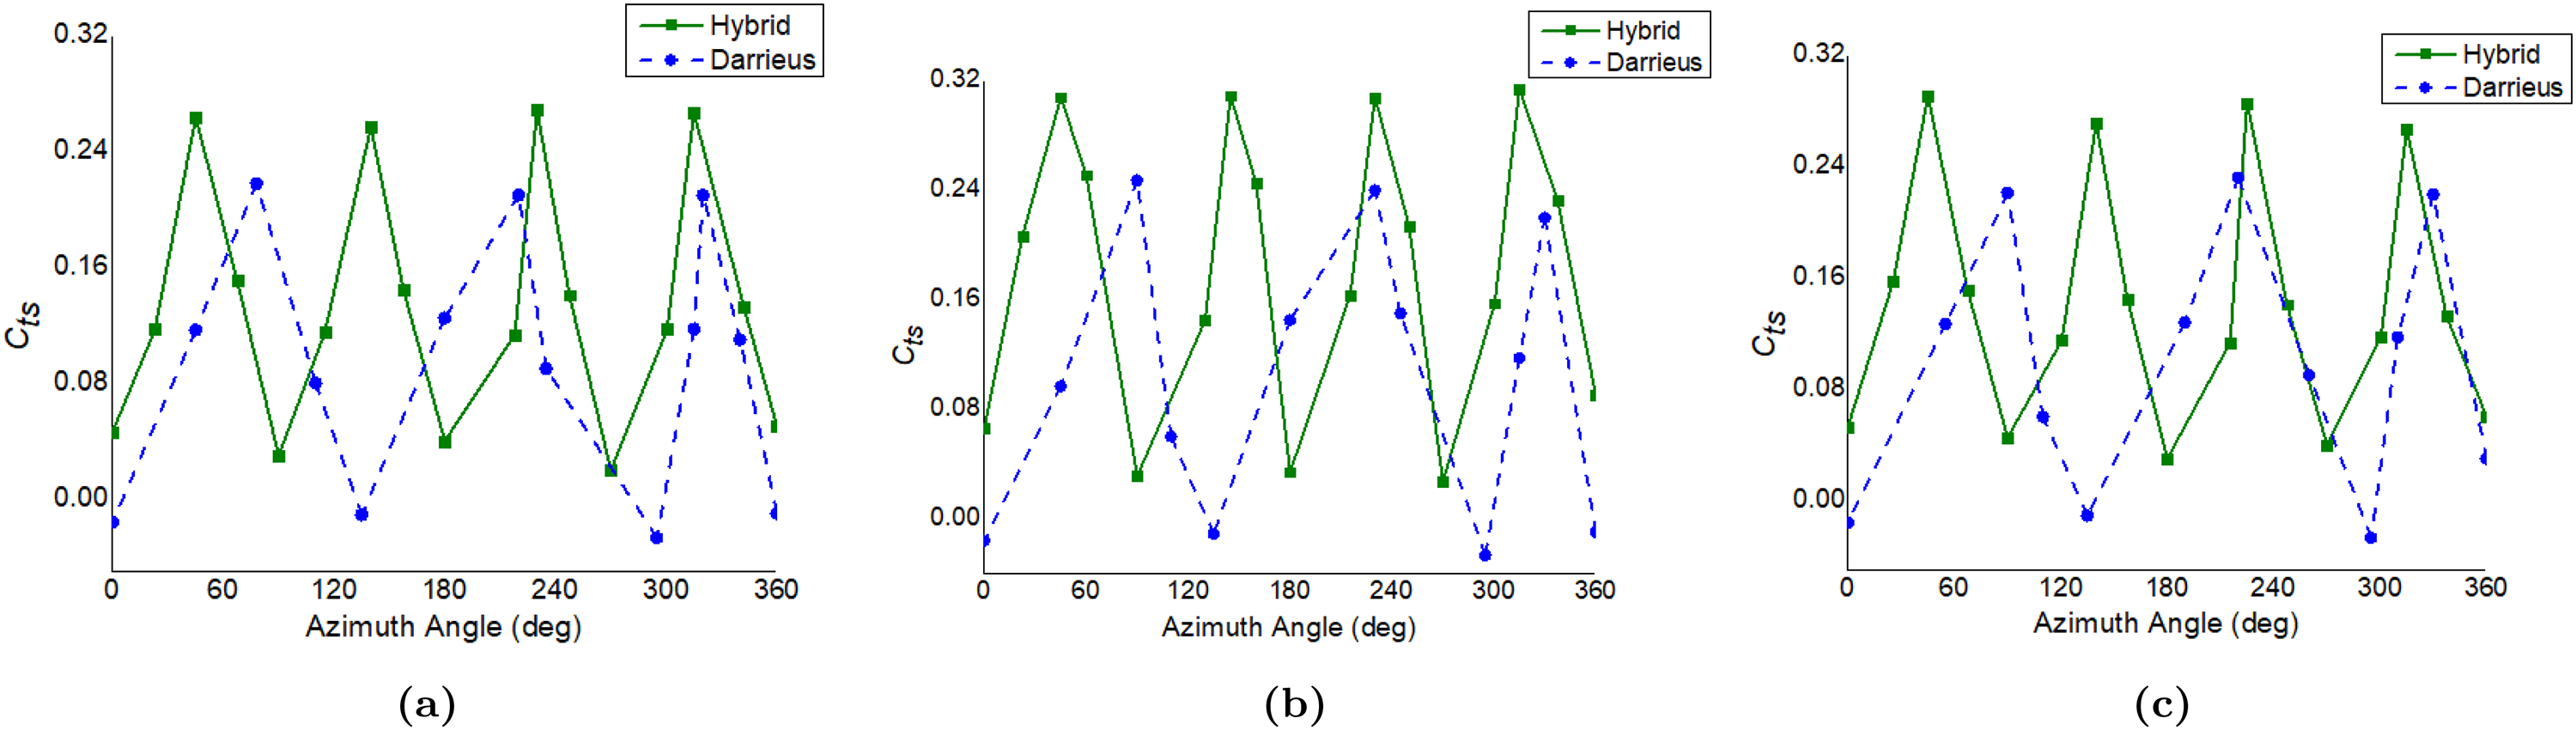
Static torque coefficient () versus azimuth of hybrid wind turbine and H-rotor Darrieus at a wind speed of (a) 3 m/s, (b) 3.64 m/s, and (c) 5 m/s. The proposed hybrid wind turbine generates positive at all angles, indicating that it is totally self-starting. However, for the wind speeds discussed, the H-rotor turbine exhibits negative in the ranges of = 129°–140°, 278°–300°, and 348°–10°.
Figure 14 presents the with the variation of TSR for different wind speeds (3–5 m/s). The comparisons for wind speeds <2 m/s are not presented here because, as previously indicated, no measurable data for these wind speed values have been collected from the H-rotor Darrieus turbine.
For the present hybrid design, the maximum was obtained as 0.486 at 3.64 m/s, at a TSR of 3. In contrast, the highest for the H-rotor Darrieus turbine was 0.42, corresponding to a TSR of 2.62. It is also worth mentioning that the Darrieus turbine operates within the TSR ranging from 1.05 to 4.5 for wind speeds higher than 3 m/s, whereas the hybrid configuration operates with TSR values within the range of 1 to 5.12. This feature emphasizes the capacity of the proposed hybrid wind turbine to convert wind energy with a greater than an H-rotor Darrieus turbine, even at lower wind speed. The maximum corresponding to TSR of the hybrid wind turbine was larger (approximately 7%–10%) than an H-rotor Darrieus turbine.
The computed for the H-rotor Darrieus and the hybrid wind turbine as an objective of azimuth () for different wind speeds (3, 3.64, and 5 m/s) are shown in Figure 15.
At all azimuths, the values are positive, demonstrating the self-start ability of the present hybrid wind turbine. As a general remark, the figure shows that the hybrid wind turbine configuration has greater maximum values of than the H-rotor Darrieus configuration. For wind speeds of 3, 3.64, and 5 m/s, maximum values of for the hybrid wind turbine were 0.269, 0.309, and 0.291, respectively, likewise the highest values of for the H-rotor Darrieus turbine were approximately 0.218, 0.247, and 0.232, respectively. The increases with wind speed for both the hybrid wind turbine arrangement and the H-rotor Darrieus. The H-rotor Darrieus turbine layout also showed negative value, according to the investigation, within the domain of = 129°–140°, 278°–300°, and 348°–10° for all the considered wind speeds, implying that for these angles, the rotor could not self-start because of negative static torque induced due to negative pressure on the returning blade. At 3 m/s, the for the H-rotor Darrieus turbine was zero for = 130°, 300°, and 360°, and assumed low values at other azimuths as compared to other wind speeds considered. From Figure 15, it can be seen that the flow arranged between the blades explains the significant discrepancy in performance. Due to the exposed frontal area, the study shows enhanced lift force on the inner side, and low-pressure drag leads to better static performance than the Darrieus turbine. With a proper rotor design, that is, optimal aspect ratio, airfoil thickness, and pitch angle, the H-rotor Darrieus turbine can self-start at locations corresponding to negative values of .8,69
Comparative analysis of experimental and computational results
This section compares the proposed hybrid wind turbine’s findings with the H-rotor Darrieus and the existing hybrid wind turbines. A comparison of the experimental results with numerical simulations helps to better comprehend the flow structures in the surrounding of the turbine. ANSYS Fluent was used for mesh generation and CFD analysis. The turbulence models affect the resultant flow field, as well as the computational resources and time required to resolve the problems. The k– turbulence model was applied for the current analysis because it is well known for determining the flow fields with large flow separations more precisely.70–72 In addition, the scaled-down model was examined in the wind tunnel at various TSRs and wind speeds. The results of versus azimuth (), versus TSR, and versus TSR for the subsisting hybrid VAWTs were acquired from the published literature.15,14
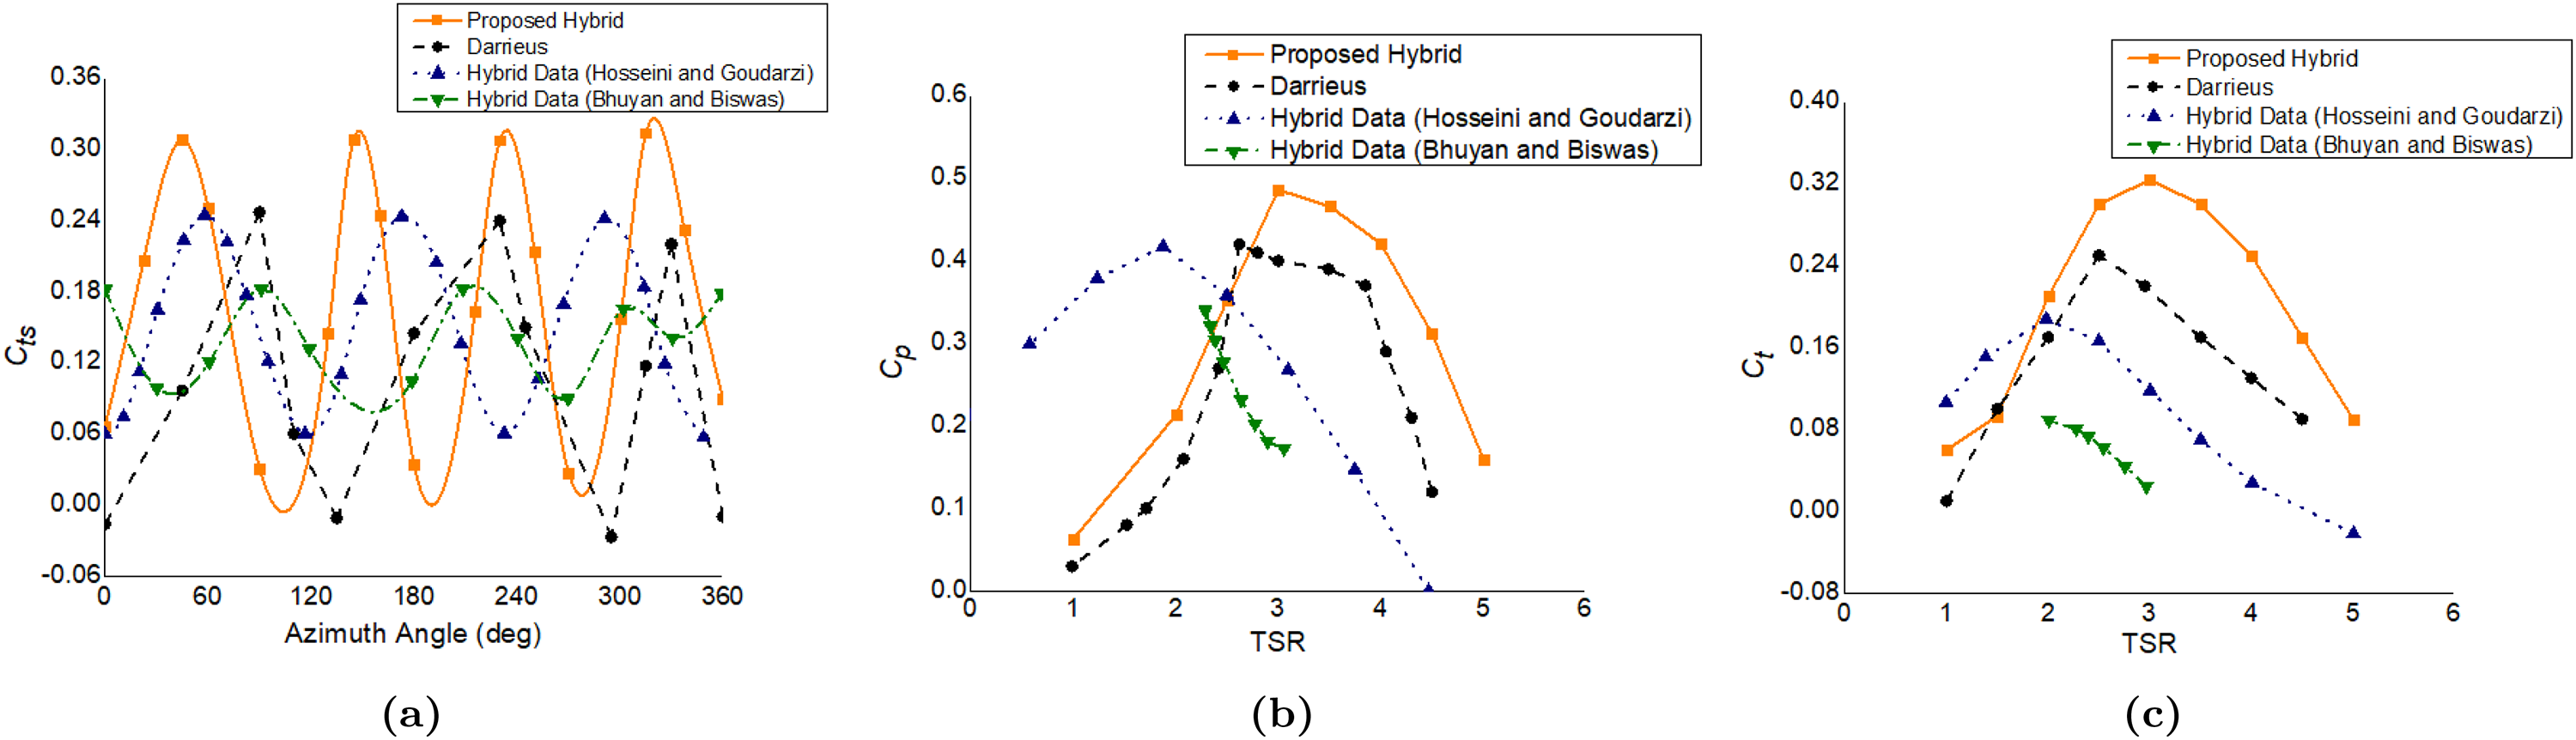
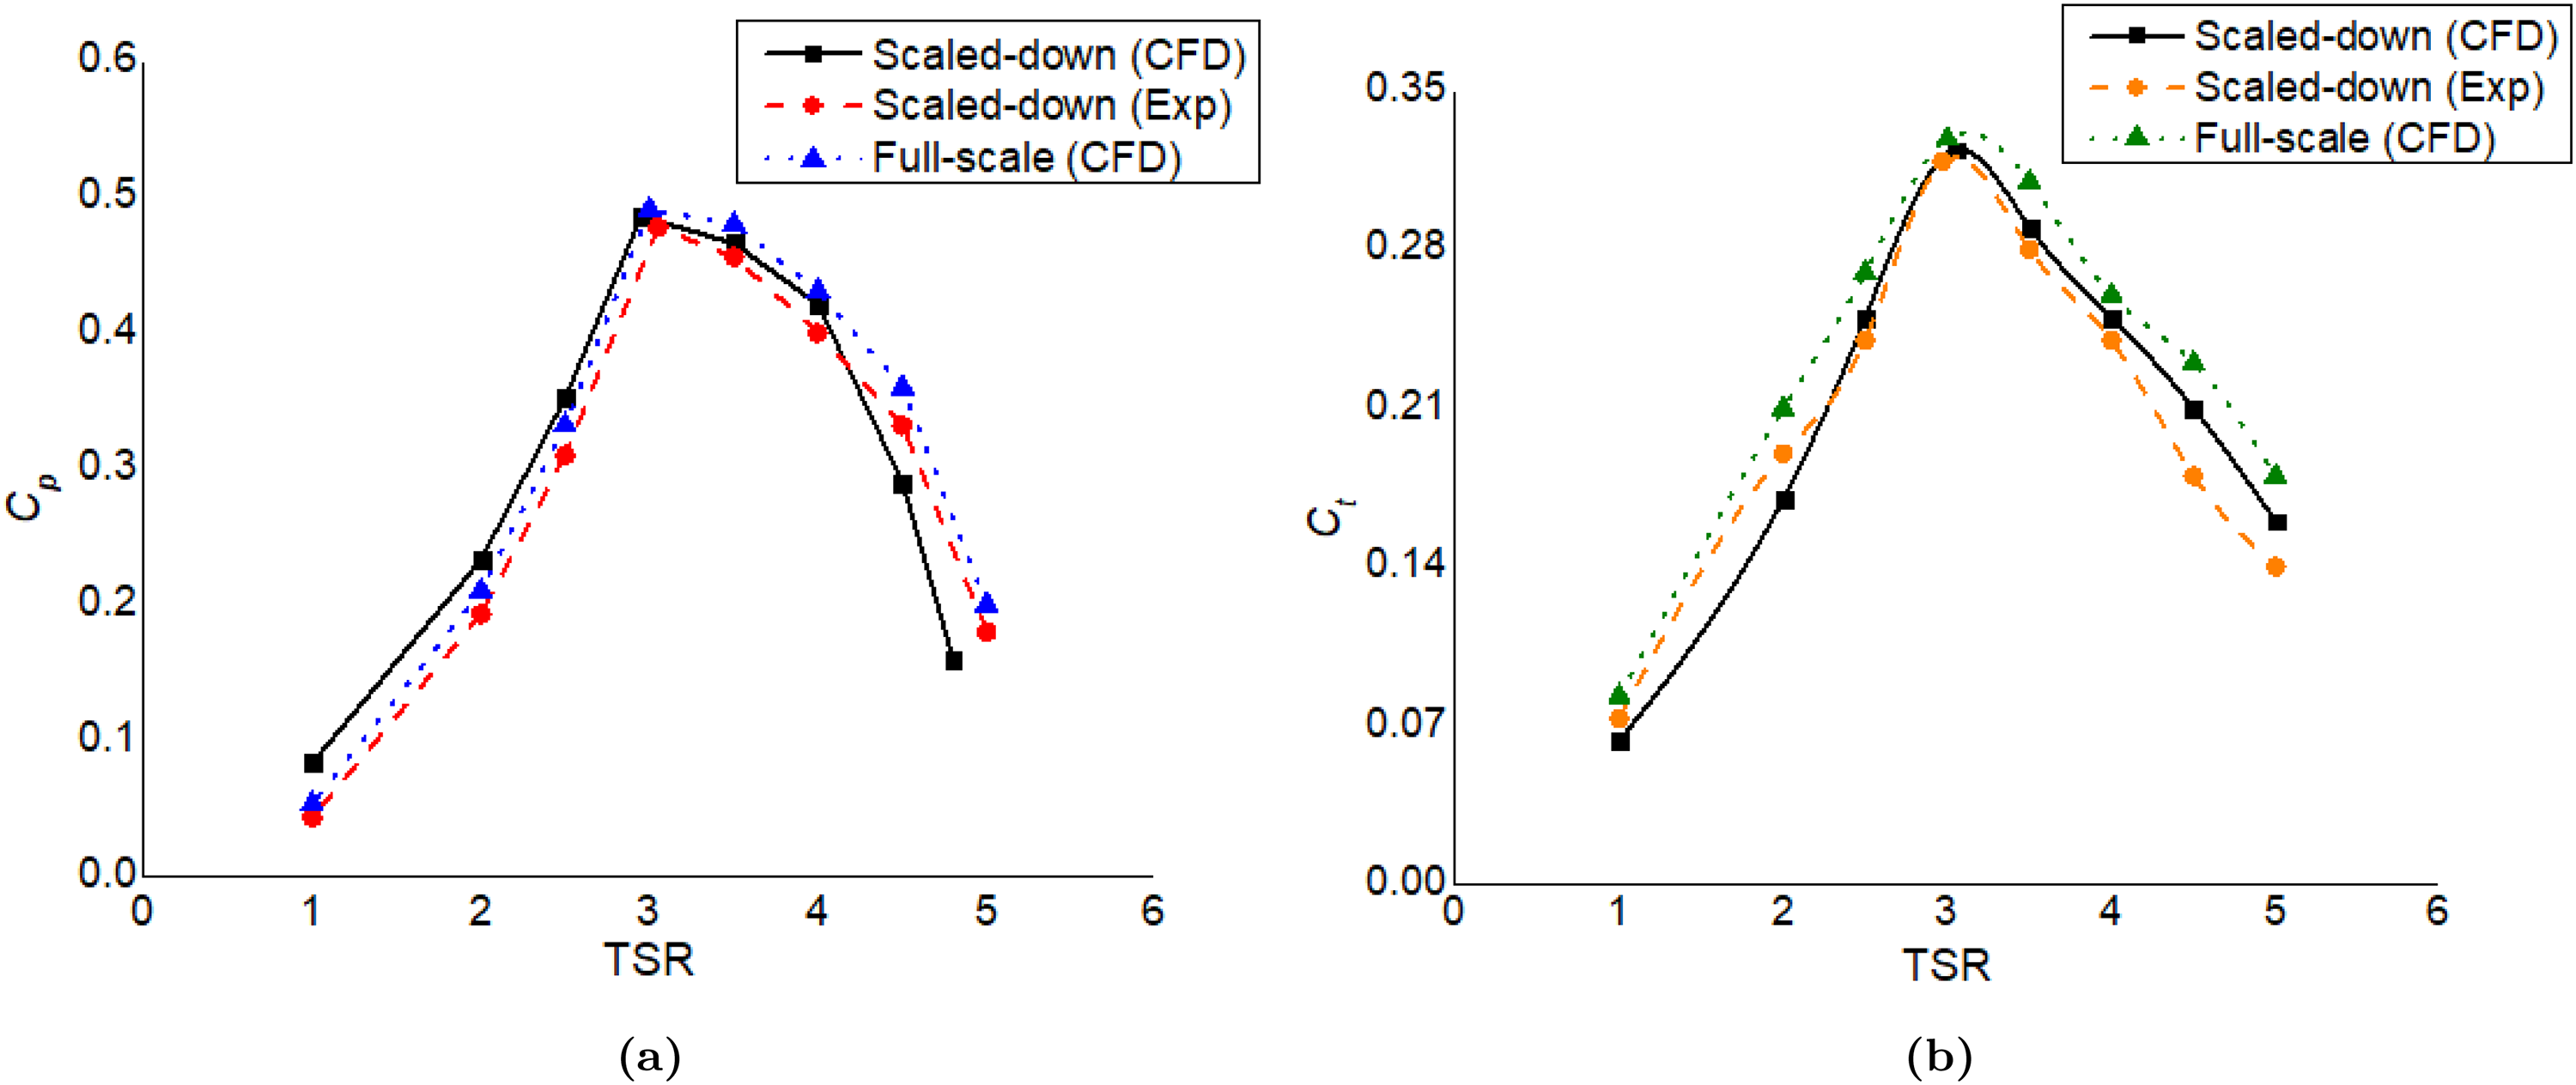
A comparison of versus azimuth () for the present hybrid, Darrieus, and existing hybrid VAWTs is shown in Figure 16(a). All three hybrid VAWTs exhibit positive for the complete range of azimuths, as shown in the figure. However, the H-rotor Darrieus turbine has negative values for the angle of = 129°–1400, 2780–3000, and 3480–100. The positive of the hybrid configurations showed their self-starting capability. The highest (0.309) of the innovative VAWT was more than that of the existing hybrid wind turbines. Figure 16(b) illustrates the versus TSR comparison for the four combinations. The existing hybrid wind turbines had the highest of 0.34 at a TSR of 2.29, and 0.41 at a TSR of 2.5 and the proposed configuration had the highest of 0.486 at a TSR of 3, and the H-rotor Darrieus had the highest of 0.42 at a TSR of 2.62. Figure 16(c) depicts versus TSR comparisons for the hybrid and H-rotor Darrieus VAWTs. The maximum values of the H-rotor Darrieus (0.25 at TSR 2.5) and other hybrid VAWTs (0.19, and 0.09 at TSRs of 1.98 and 2, respectively) are lower than those of the current hybrid VAWT, which are 0.324 at TSR of 3, 0.19. Figure 17 presents the comparison of and at different TSRs for the full-scale model and scaled-down model of the proposed hybrid wind turbine. The figure represents that the results achieved from the experimental and computational campaigns are close to the full-scale model with a maximum difference of 3%. Additionally, the suggested hybrid wind turbine’s usage of asymmetric airfoils has demonstrated increased power and torque coefficients (approximately 11%–13%) across a broad range of wind speeds as compared to the H-rotor Darrieus and existing hybrid wind turbine.
(a) Static torque coefficient () versus azimuth of the proposed hybrid VAWT, H-rotor Darrieus, and existing hybrid wind turbines. According to the illustration, hybrid VAWTs provide positive values at all azimuths. The H-rotor Darrieus turbine, on the other hand, exhibits negative values in the regimes of = 1290–1400, 2780–3000, and 3480–100. The proposed hybrid wind turbine has a higher maximum value (0.309) than the subsisting hybrid wind turbine (0.218 and 0.245). (b) The variation of versus TSR shows that for the proposed hybrid design, the maximum was recorded as 0.486 at a TSR of 3, followed by 0.42 at a TSR of 2.62 for the H-rotor Darrieus, 0.34 and 0.41 at TSR of 2.29 and 2.5, respectively, for existing hybrid wind turbines. (c) The comparison of versus TSR indicates that the proposed hybrid wind turbine has of 0.324 at a TSR of 3, which is larger than that of an H-rotor Darrieus (0.25 at a TSR of 2.5) and existing hybrid wind turbines. VAWT: vertical axis wind turbine; TSR: tip speed ratio.
Comparative and versus tip speed ratio (TSR) curves between the full-scale model and scaled-down model of the present hybrid wind turbine. The dimensionless coefficients obtained from the experimental and computational analysis over a wide range of TSR (1–6) are close to the full-scale model, thereby verifying the similarity analysis within 2%–3%.
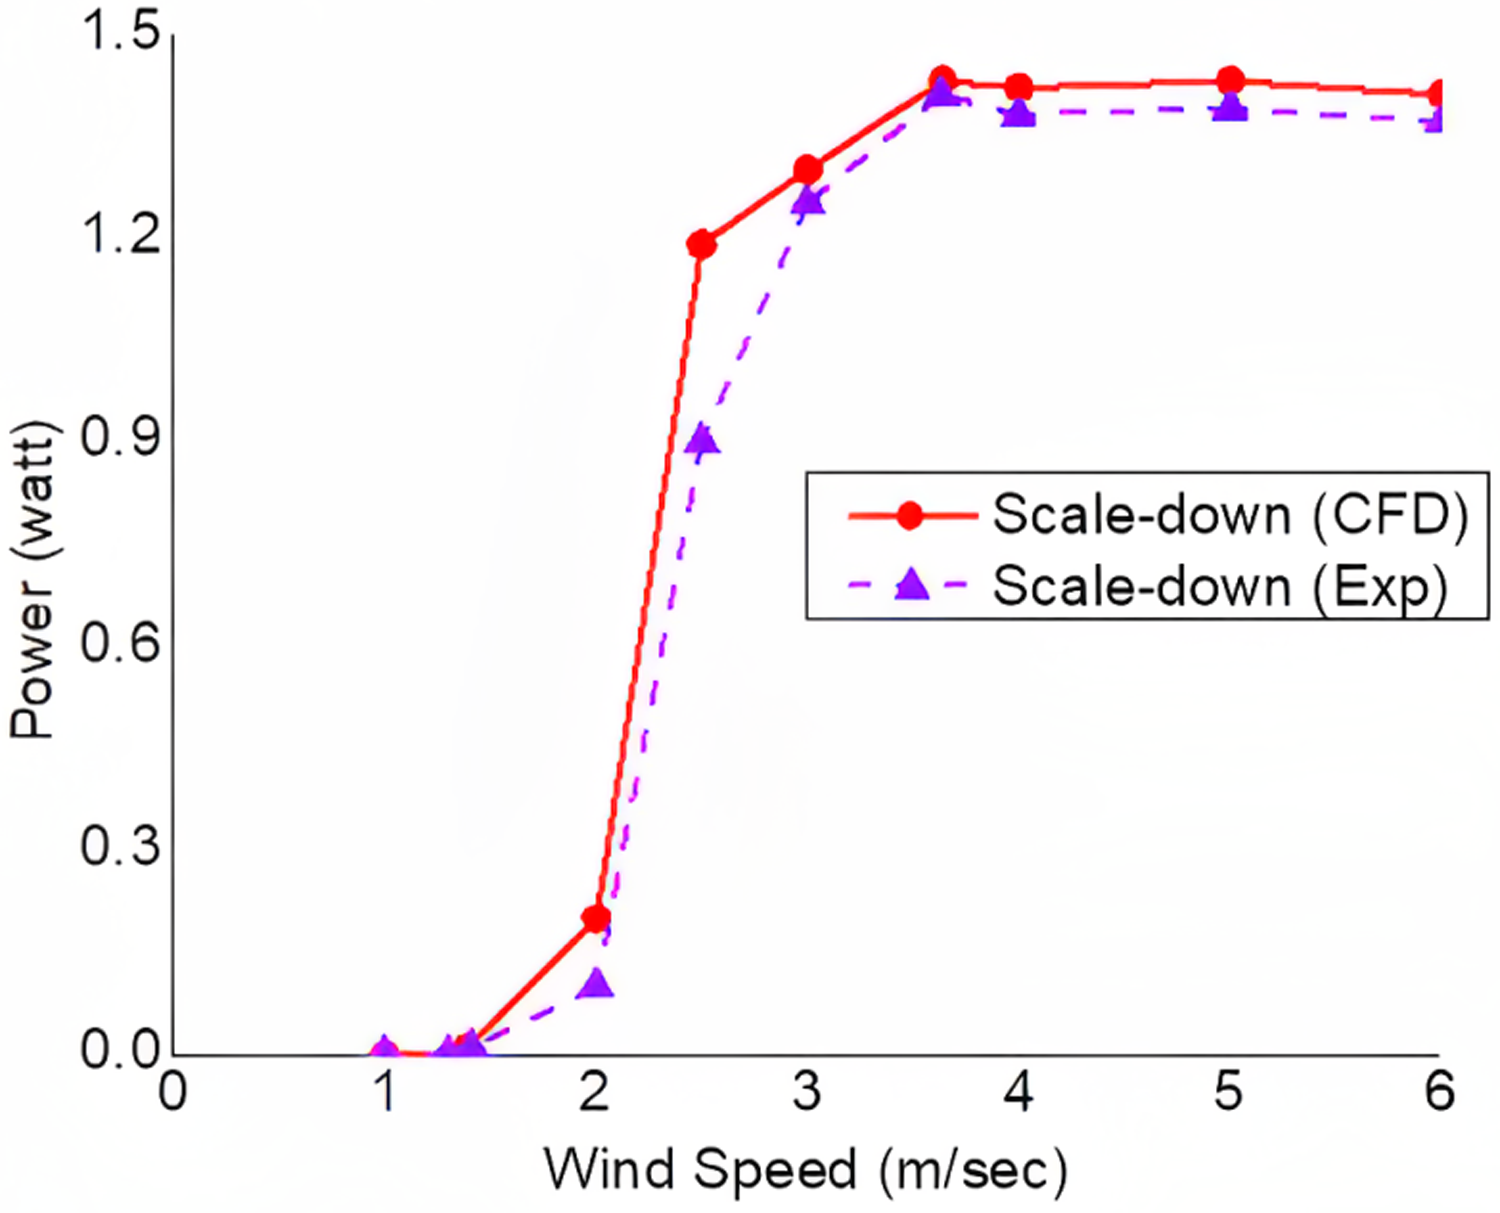
Figure 18 depicts a comparison of the produced power variation for the present hybrid wind turbine throughout a wind speed of 1–6 m/s. Under wind speeds of 3–3.5 m/s, the power output of the H-rotor Darrieus design is nearly zero. The cut-in speed of the proposed hybrid model, on the other hand, is just 1.54 m/s. This property shows that the present hybrid wind turbine design has a greater than the H-rotor Darrieus turbine and can convert wind energy at low wind speeds.
Comparative output power versus wind speed of the present hybrid wind turbine obtained from computational fluid dynamics (CFD) and experimental testing. The figure represents that the innovative hybrid wind turbine starts producing power at 1.54 m/s and results in a rated power of 1.41 watts at 3.64 m/s, which is approximately 11%–13% more than subsisting scaled-down designs.
The flow field that exists between symmetric and asymmetric airfoil blades has an impact that could be attributed to the proposed hybrid wind turbine’s higher and lower cut-in speed. The inner asymmetric airfoil blades are linked at a certain pitch angle, which causes a partial re-attachment of the flow particles and an overall reinforcement of the lift force. Moreover, the combination of high-speed flow and low-pressure results in a reduction in the lift on the outer blades of the turbine at higher AoA. This reduction in lift can be compensated for by the advanced positioning of the smaller inner blades, which help in maintaining lift despite the decrease in lift caused by the outer symmetric blades.
Conclusion
Hybrid VAWTs are potential alternatives for preventing further depletion of natural resources and environmental deterioration. Due to low starting torque at low wind speeds, Darrieus VAWT does not start on its own. A comparison of conventional VAWTs shows that the Savonius VAWT has a very low . The goal of this study was to design a self-starting VAWT with a high power coefficient. A combined experimental and computational analysis of an innovative straight-bladed hybrid VAWT configuration was performed. For comparison, an H-rotor turbine with symmetric airfoil blades and a subsisting Darrieus–Savonius hybrid VAWT were also investigated. The study’s main conclusions are listed below.
The innovative hybrid wind turbine’s positive readings at every azimuth show that it is entirely self-starting. The suggested hybrid configuration’s maximum values at wind speeds of 3, 3.64, and 5 m/s were 0.269, 0.309, and 0.291, respectively, whereas the H-rotor Darrieus turbine’s highest values were around 0.218, 0.247, and 0.232, respectively. The increases with wind speed for both configurations.
The analysis indicated that the H-rotor Darrieus turbine has negative , within the ranges of = 129°–140°, 278°–300°, and 348°–10° for all wind speeds considered, implying that for these angles, the rotor could not self-start because of negative static torque induced as a result of negative pressure on the returning blade. At 3 m/s, the for the H-rotor turbine was zero for = 129°, 300°, and 360°, and assumed low values at other azimuths as compared to other wind speeds.
The variation between and TSR reveals that for the present hybrid design, the highest was 0.486 at a TSR of 3, followed by the H-rotor (0.42) at a TSR of 2.62, and existing hybrid wind turbines (0.34 and 0.41) at TSRs of 2.29 and 2.5, respectively.
The innovative hybrid design had the highest of 0.324 at a TSR of 3, which was greater than the H-rotor (0.25 at TSR of 2.5) and subsisting hybrid wind turbines (0.19 and 0.09 at TSR of 1.98 and 2, respectively).
Over vast regimes of wind speeds, the present hybrid wind turbine outperformed an H-rotor Darrieus and subsisting hybrid wind turbine by about 11%–13%.
The findings of the reported testing campaign showed that the present hybrid wind turbine configuration is very encouraging for household usage and standalone electricity generation, particularly at low wind speeds. The higher of the hybrid wind turbine allows it to achieve the best operating regime for each measured wind speed in less time than a conventional Darrieus turbine, resulting in the recommended structure being more prone to variation in wind speed.
The study found that the hybrid VAWT can address the problems with wind turbines that are already in use. It is therefore recommended to analyze wind farms using CFD and to use a variety of rotor layouts to predict the hybrid wind turbine’s future growth. Further research may also be done on the analysis of the suggested hybrid VAWT with variable pitch angle.
Footnotes
Declaration of conflicting interests
The author(s) declared no potential conflicts of interest with respect to the research, authorship, and/or publication of this article.
Funding
The author(s) received no financial support for the research, authorship, and/or publication of this article.
ORCID iD
Muhammad Ahmad
Muhammad Ahmad holds a Master’s degree in aerospace engineering and specializes in computational fluid dynamics, aerodynamics, design optimization, and wind energy harvesting. With an academic background and expertise in these areas, he has contributed significantly to research and development efforts in the aerospace and renewable energy sectors. His passion for advancing aerospace engineering and wind energy technologies drives him to address complex challenges and strive for sustainable and efficient solutions.
Aamer Shahzad holds a doctoral degree in mechanical engineering. He has been involved in the research of bio-inspired and bio-mimicking flapping wings, with an emphasis on improving aerodynamic performance in hovering flight. His research interests include flapping wing propulsion, vertical axis wind turbines, bladeless technologies, and VTOL Unmanned Aerial Vehicles (UAVs).
Syed Irtiza Ali Shah is a renowned researcher and academic in aerospace and mechanical engineering, specializing in aerial robotics. With a PhD from Georgia Tech, USA, Prof. Shah’s research interests revolve around robotics, fluid dynamics/CFD, UAV disaster rescue and relief systems, as well as computer vision and medical imaging. His expertise and contributions in developing advanced UAV systems for critical operations, coupled with his application of computer vision and medical imaging techniques, have established him as a leading figure in the field. Through his relentless pursuit of innovation, Prof. Syed Irtiza Ali Shah continues to make significant contributions to advancing scientific knowledge and addressing real-world challenges.
Appendix 1
References
1.
AkwaJVVielmoHAPetryAP. A review on the performance of Savonius wind turbines. Renew Sust Energy Rev2012; 16: 3054–3064.
2.
BottassoCLCampagnoloFPetrovićV. Wind tunnel testing of scaled wind turbine models: Beyond aerodynamics. J Wind Eng Ind Aerod2014; 127: 11–28.
3.
KumarRRaahemifarKFungAS. A critical review of vertical axis wind turbines for urban applications. Renew Sust Energy Rev2018; 89: 281–291.
4.
AhmadMShahzadAQadriMNM. An overview of aerodynamic performance analysis of vertical axis wind turbines. Energy Environ2022: 1–43.
5.
TummalaAVelamatiRKSinhaDK, et al. A review on small scale wind turbines. Renew Sust Energy Rev2016; 56: 1351–1371.
6.
HowellRQinNEdwardsJ, et al. Wind tunnel and numerical study of a small vertical axis wind turbine. Renew Energy2010; 35: 412–422.
7.
AlaimoAEspositoAMessineoA, et al. 3D CFD analysis of a vertical axis wind turbine. Energies2015; 8: 3013–3033.
8.
SinghMBiswasAMisraR. Investigation of self-starting and high rotor solidity on the performance of a three S1210 blade H-type Darrieus rotor. Renew Energy2015; 76: 381–387.
9.
BatistaNMelícioRMendesV, et al. On a self-start Darrieus wind turbine: Blade design and field tests. Renew Sust Energy Rev2015; 52: 508–522.
10.
NasefMEl-AskaryWAbdel-HamidA, et al. Evaluation of Savonius rotor performance: Static and dynamic studies. J Wind Eng Ind Aerod2013; 123: 1–11.
11.
KacprzakKLiskiewiczGSobczakK. Numerical investigation of conventional and modified Savonius wind turbines. Renew Energy2013; 60: 578–585.
12.
KavadeRKGhanegaonkarPM. Design and analysis of vertical axis wind turbine for household application. J Clean Energy Technol2017; 5: 353–358.
13.
MohamedM. Impacts of solidity and hybrid system in small wind turbines performance. Energy2013; 57: 495–504.
14.
BhuyanSBiswasA. Investigations on self-starting and performance characteristics of simple h and hybrid H-Savonius vertical axis wind rotors. Energy Convers Manage2014; 87: 859–867.
15.
HosseiniAGoudarziN. Design and CFD study of a hybrid vertical-axis wind turbine by employing a combined bach-type and H-Darrieus rotor systems. Energy Convers Manage2019; 189: 49–59.
16.
SunXChenYCaoY, et al. Research on the aerodynamic characteristics of a lift drag hybrid vertical axis wind turbine. Adv Mech Eng2016; 8: 1687814016629349.
17.
JinXZhaoGGaoK, et al. Darrieus vertical axis wind turbine: Basic research methods. Renew Sust Energy Rev2015; 42: 212–225.
18.
LeeY-TLimH-C. Numerical study of the aerodynamic performance of a 500 W Darrieus-type vertical-axis wind turbine. Renew Energy2015; 83: 407–415.
19.
ErikssonSBernhoffHLeijonM. Evaluation of different turbine concepts for wind power. Renew Sust Energy Rev2008; 12: 1419–1434.
20.
MarshPRanmuthugalaDPenesisI, et al. Numerical investigation of the influence of blade helicity on the performance characteristics of vertical axis tidal turbines. Renew Energy2015; 81: 926–935.
21.
BeriHYaoY, et al. Effect of camber airfoil on self starting of vertical axis wind turbine. J Environ Sci Technol2011; 4: 302–312.
22.
ChengQLiuXJiHS, et al. Aerodynamic analysis of a helical vertical axis wind turbine. Energies2017; 10: 575.
23.
DeisadzeLDigeserDDunnC, et al. Vertical axis wind turbine evaluation and design. Worcester Polytechnic Institute, USA, 2013.
24.
KamojiMKedareSPrabhuS. Experimental investigations on the effect of overlap ratio and blade edge conditions on the performance of conventional Savonius rotor. Wind Eng2008; 32: 163–178.
25.
FerrariGFedericiDSchitoP, et al. CFD study of Savonius wind turbine: 3D model validation and parametric analysis. Renew Energy2017; 105: 722–734.
26.
ShahSRKumarRRaahemifarK, et al. Design, modeling and economic performance of a vertical axis wind turbine. Energy Reports2018; 4: 619–623.
27.
HosseiniAGoudarziN. CFD and control analysis of a smart hybrid vertical axis wind turbine. In: ASME power conference, 24-28 June 2018. Lake Buena Vista, FL: American Society of Mechanical Engineers, 2018, Vol. 51395, p. V001T06A027.
28.
GuptaRSharmaK. Flow physics of a combined Darrieus–Savonius rotor using computational fluid dynamics (CFD). Int Res J Eng Sci, Technol Innov2012; 1: 1–13.
29.
BruscaSLanzafameRMessinaM. Design of a vertical-axis wind turbine: how the aspect ratio affects the turbine’s performance. Int J Energy Environ Eng2014; 5: 333–340.
30.
MohamedM. Performance investigation of H-rotor Darrieus turbine with new airfoil shapes. Energy2012; 47: 522–530.
31.
RohS-CKangS-H. Effects of a blade profile, the Reynolds number, and the solidity on the performance of a straight bladed vertical axis wind turbine. J Mech Sci Technol2013; 27: 3299–3307.
32.
SabaeifardPRazzaghiHForouzandehA. Determination of vertical axis wind turbines optimal configuration through CFD simulations. In: International conference on future environment and energy, IPCBEE, 26-28 February 2012, Vol. 28, pp. 109–113. Singapore: IACSIT Press.
33.
ClarkeJHancoxLMackenzieD, et al. Design of vertical axis wind turbine. Group M11. Report (4).
34.
MartenDWendlerJPechlivanoglouG, et al. Qblade: An open source tool for design and simulation of horizontal and vertical axis wind turbines. Int J Emerging Technol Adv Eng2013; 3: 264–269.
35.
MuratoğluADemirMS. Numerical analyses of a straight bladed vertical axis Darrieus wind turbine: Verification of DMS algorithm and qblade code. Eur J Tech2019; 9: 195–208.
36.
AhmadMShahzadAAkramF, et al. Determination of efficient configurations of vertical axis wind turbine using design of experiments. Proc IMechE, Part A: J Power Energy2022; 236: 1558–1581.
37.
CardosoJMPde Figueired CoutinhoJGDinizPC. Embedded computing for high performance: Efficient mapping of computations using customization, code transformations and compilation. Morgan Kaufmann, USA, 2017.
38.
FerreiraSCBrunsRFerreiraHS, et al. Box–Behnken design: An alternative for the optimization of analytical methods. Anal Chim Acta2007; 597: 179–186.
39.
CarlyleWMMontgomeryDCRungerGC. Optimization problems and methods in quality control and improvement. J Qual Technol2000; 32: 1–17.
40.
MatthewsP. Design of experiments with minitab.. Milwaukee, WI: ASQ’s Quality Press, 2005; vol. 22, p. 14.
41.
KhorCRamakrishnanS, et al. Optimization of conductive thin film epoxy composites properties using desirability optimization methodology. J Optim,2016: 1–8.
42.
KeerthanaMSriramkrishnanMVelayuthamT, et al. Aerodynamic analysis of a small horizontal axis wind turbine using CFD. J Wind Eng2012; 9: 14–28.
43.
ScungioMArpinoFFocantiV, et al. Wind tunnel testing of scaled models of a newly developed Darrieus-style vertical axis wind turbine with auxiliary straight blades. Energy Convers Manage2016; 130: 60–70.
44.
BedonGCastelliMRBeniniE. Evaluation of the effect of rotor solidity on the performance of a H-Darrieus turbine adopting a blade element-momentum algorithm. World Acad Sci Eng Technol2012; 6: 916–921.
45.
KailashGEldhoTPrabhuS. Performance study of modified Savonius water turbine with two deflector plates. Int J Rotating Machinery2012: 1–12.
46.
GriffithDTAshwillTD, et al. The Sandia 100-meter all-glass baseline wind turbine blade: SNl100-00. Sandia National Laboratories Technical Report, SAND2011-3779.
47.
GaschRTweleJ. Scaling wind turbines and rules of similarity. In: Wind power plants. Springer, 2012, pp. 257–271, Robert Gasch, Jochen Twele, Springer Berlin, Heidelberg.
48.
AshuriT. Beyond classical upscaling: integrated aeroservoelastic design and optimization of large offshore wind turbines, 2012, Delft University of Technology, Netherlands, pp. 1–225.
49.
BayatiIBelloliMBerniniL, et al. On the aero-elastic design of the DTU 10 MW wind turbine blade for the lifes 50+ wind tunnel scale model. J Phys Conf Ser2016; 753: 022028.
50.
ViselliAMGoupeeAJDagherHJ. Model test of a 1: 8-scale floating wind turbine offshore in the Gulf of Maine. J Offshore Mech Arctic Eng2015; 137, 041901 (1-9).
51.
BayatiIBelloliMBerniniL, et al. Wind tunnel validation of aerodyn within lifes 50+ project: Imposed surge and pitch tests. J Phys Conf Ser2016; 753: 092001.
52.
GoupeeAJKooBJKimballRW, et al. Experimental comparison of three floating wind turbine concepts. J Offshore Mech Arctic Eng2014; 136, 020906 (1-9).
53.
GiahiMHDehkordiAJ. Investigating the influence of dimensional scaling on aerodynamic characteristics of wind turbine using CFD simulation. Renew Energy2016; 97: 162–168.
54.
BayatiIBelloliMBerniniL, et al. On the functional design of the dtu10 mw wind turbine scale model of lifes 50+ project. J Phys Conf Ser2016; 753: 052018.
55.
CarlsonRLajoie-MazencMFagundesJ. Analysis of torque ripple due to phase commutation in brushless dc machines. IEEE Trans Ind Appl1992; 28: 632–638.
56.
HolmanJP. Experimental methods for engineers. 1966, McGraw-Hill, USA, pp. 1–739.
57.
CascettaFVigoP. Introduzione alla metrologia, cap. 4, 75-91, Liguori Editore, Napoli.
58.
KlineSJ. Describing uncertainty in single sample experiments. Mech Eng1953; 75: 3–8.
59.
AhmadMShahzadAAkramF, et al. Design optimization of double-Darrieus hybrid vertical axis wind turbine. Ocean Eng2022; 254: 111171.
60.
TangHLamK-MShumK-M, et al. Wake effect of a horizontal axis wind turbine on the performance of a downstream turbine. Energies2019; 12: 2395.
61.
Porté-AgelFBastankhahMShamsoddinS. Wind-turbine and wind-farm flows: A review. Bound Layer Meteorol2020; 174: 1–59.
DidaneDHRoslyNZulkafliMF, et al. Numerical investigation of a novel contra-rotating vertical axis wind turbine. Sust Energy Technol Assess2019; 31: 43–53.
64.
LanzafameRMauroSMessinaM. 2D CFD modeling of H-Darrieus wind turbines using a transition turbulence model. Energy Procedia2014; 45: 131–140.
65.
GhoshABiswasASharmaK, et al. Computational analysis of flow physics of a combined three bladed Darrieus Savonius wind rotor. J Energy Inst2015; 88: 425–437.
66.
AlaimoAEspositoAMilazzoA, et al. Slotted blades Savonius wind turbine analysis by CFD. Energies2013; 6: 6335–6351.
67.
VersteegHKMalalasekeraW. An introduction to computational fluid dynamics: The finite volume method. Pearson Education, India, 2007.
68.
JohnDAndersonJ. Computational fluid dynamics: The basics with applications. Mechanical engineering series, 1995, McGraw-Hill, USA.
69.
WorasinchaiSIngramGLDominyRG. The physics of H-Darrieus turbine starting behavior. J Eng Gas Turbine Power2016; 138: 062605 (1–11).
70.
NobileRVahdatiMBarlowJF, et al. Unsteady flow simulation of a vertical axis augmented wind turbine: A two-dimensional study. J Wind Eng Ind Aerod2014; 125: 168–179.
71.
Simão FerreiraC. The near wake of the VAWT: 2D and 3D views of the VAWT aerodynamics, 2009, Delft University of Technology, Netherlands.
72.
MacPheeDBeyeneA. Recent advances in rotor design of vertical axis wind turbines. Wind Eng2012; 36: 647–665.