
Abstract
Climate change is increasing owing to the frequency and intensity of extreme weather events caused by greenhouse gas (GHG) emissions mainly due to anthropogenic activities. In recent years, many countries have set goals to decrease GHG emissions and achieve carbon neutrality while maintaining their economic situation. The purpose of this study is to determine the optimal policy for fossil fuels and renewable energy allocation, which could decrease GHG emissions and maintain the economic situation in Taiwan until 2030. The results show that renewable energy rapidly increased to 5.8 billion kWh, and natural gas increased to 54 million m3 when energy consumption was maintained for the values in 2020. Greenhouse gas emissions in 2030 are expected to decrease to 20% of the value in 2005. Finally, the Taiwanese government should consider the allocation of fossil fuels and renewable energy with linear growth in energy consumption and achieve the goals of carbon emission reduction.
Introduction
Impact of greenhouse gas emissions on global climate
Global warming refers to the phenomenon of Earth's surface temperature rising as a result of the accumulation of heat in the atmosphere, primarily due to the emission of greenhouse gases (GHGs). A fraction of the solar radiation that reaches the Earth undergoes reflection back into space. The remaining portion is absorbed by the land and ocean, leading to its warming. Part of the absorbed heat is radiated back into the atmosphere, which traps it due to the presence of GHGs. The primary driver of climate change since the onset of the Industrial Revolution around 1750 has been escalating anthropogenic activities.1–3 Climate change is intensifying the occurrence and severity of extreme weather events, including droughts, hurricanes, floods, and rising sea levels, particularly in developing small island states and countries.4–6
Greenhouse gases include hydro-CFC (HCFC-22), carbon dioxide (CO2), chlorofluorocarbons (CFC-12), methane (CH4), ozone (O3), and nitrous oxide (N2O). Additionally, GHGs include numerous variations of abovementioned gases. According to Intergovernmental Panel on Climate Change, 7 CO2 is not the main contributor to global warming per unit term, 8 and CO2, CH4, and N2O are assigned global warming potentials (GWPs) of 1, 31, and 310, respectively. 9
Greenhouse gas emission reduction strategies
Recognizing global warming as one of the most pressing challenges of our era, policymakers worldwide have acknowledged the need for significant reductions in GHGs emissions to mitigate its environmental impact.10,11 As a result, international agreements such as the Kyoto Protocol and Paris Agreement have been established, alongside the implementation of national and subnational climate policies, aiming to address this issue.
Based on such agreements, the European Union has made a commitment to reduce domestic GHGs emissions by at least 40% compared to 1990 levels, with the objective of limiting global temperature rise to 2°C and mitigating the most severe impacts of climate change. 12 Likewise, it is essential for developing nations and major industrial corporations to adopt decarbonization strategies. The current count of 49 countries committed to achieving carbon neutrality by 2050 is expected to exceed 100 by that time frame.13,14
These policies typically establish targets to reduce GHGs emissions compared to business-as-usual scenarios within a specified time frame. Fossil fuel burning, including coal, oil, and natural gas, accounts for a substantial share of global GHGs emissions. Consequently, climate change policies often prioritize reducing emissions in the energy-intensive industries and generation sector.2,15,16 Due to the traceability of GHGs emissions from these sectors, market-based policies that directly target them, such as cap-and-trade systems, are economically advantageous and have been carried out in numerous jurisdictions.17,18
Renewable and sustainable energy policies from developed and developing countries
To reduce the environmental impact of climate change, the global energy system requires an accelerated low-carbon transition significantly reducing GHG-related energy supply and demand driven by population and economic growth.19,20 However, CO2 is still the biggest contributor to global warming because of its extremely high quantity in the atmosphere.
Renewable energy is a promising alternative to mitigate climate change and environmental pollution, which are critical concerns in countries with high economic and population growth. 21 Renewable energy sources are crucial in sustainable development strategies as they contribute to energy savings, efficiency improvements, and facilitate the transition to a more sustainable energy system.22,23 Therefore, some developed and developing countries have designed a renewable energy mandate to optimize energy mixes for reducing carbon emissions.24–27 Renewable energy is not only low-carbon/clean but also economically, socially, and environmentally viable28–30 in some developed and developing countries. Chen et al. 31 examined the impact of renewable energy prices on the economic growth of Norway, New Zealand, and two Canadian provinces. Their findings revealed a positive link between renewable energy prices and economic growth in Norway and New Zealand, while a negative relationship was observed in the two Canadian provinces analyzed. Lin and Moubarak 32 demonstrated that the development of the renewable energy industry contributes to economic growth. Rafindadi and Ozturk 33 conducted a study in Germany to investigate the reciprocal relationship between renewable energy consumption and economic growth using causality analysis. Chan et al. 34 discovered that two perceived social norms play a positive role in facilitating the transition to renewable energy. Moreover, they found that these positive associations were particularly robust in countries characterized by higher levels of individualism and cultural values, as well as lower levels of air pollution and climate change. However, the associations were statistically insignificant between the financial development and renewable energy system of developing countries.35,36
However, due to weather factors, renewable energy such as solar power and wind power cannot provide energy at full capacity. Denholm et al. 37 noted that the integration of solar energy into the power system results in a significant decrease in net load, which can impact the overgeneration of traditional power systems and subsequently reduce renewable energy generation.38,39 Although renewable energy is an energy source with great variability and may need to rely on a large number of traditional energy resources, the deployment of power storage equipment and smart deployment of supply and demand in cities can slow down the consumption of traditional power. 40
Based on the aforementioned observations, it appears that in developing countries, there is a stronger positive correlation between nonrenewable energy consumption and economic growth compared to renewable energy consumption. However, to meet the power demand and reduce carbon emissions, many energy supply and demand policies need to focus on effectively utilizing renewable energy to decrease the use of traditional energy, which poses a significant challenge.
Case study of developing country
Taiwan Island, spanning an area of 35,883 km2, is classified as one of the smaller developing island states worldwide. 41 Taiwan's terrain is characterized by rugged mountains that extend from north to south, accompanied by low-lying plains in the west. Taiwan experiences two distinct seasons: mild winters and hot rainy summers. The winter season typically spans from December to March, during which the mountains often receive snowfall, and there may be occasional snow in the northern low-lying areas as well. 42 Summer, on the other hand, lasts from April or May to September or October and is characterized by abundant precipitation, often brought by typhoons. The eastern regions and mountainous areas tend to receive heavier rainfall during this season.
Taiwan, despite being a small island with limited natural resources, has a population of 23 million and has achieved high levels of economic development. However, it faces a complex international political status. The ambiguous political status of Taiwan poses obstacles to its participation in the current international climate regime, thereby creating difficulties in meeting its commitments under international environmental conventions. 43 In light of the potential formation of international agreements during the Kyoto period that encompasses countries with significant environmental impacts, it becomes crucial to assess whether Taiwan should engage in negotiations or continue its current stance. Taiwan encounters both internal and external obstacles in its journey toward developing its international climate framework.
Greenhouse gas emission during power consumption in Taiwan
Over the past two decades, Taiwan has witnessed a significant increase in CO2 emissions, ranging from 116% to 137%, indicating an average annual growth rate of over 4.9%. In 2008, Taiwan's total CO2 emissions amounted to 2.52 million tons, accounting for approximately 1% of the world's emissions. Per capita emissions in the same year reached 11 tons, ranking 18th globally. By 2010, per capita CO2 emissions had risen to 11.53 tons, placing Taiwan 16th in the world. Notably, Taiwan ranks sixth globally in terms of CO2 emissions among countries with a population of at least five million. In recent years, the Taiwanese government's approval of industrial investment plans has spurred energy consumption, particularly in energy-intensive sectors such as steel and petrochemical industries. 44 Until 2020, significant industrial development projects in Taiwan have often been subject to disputes, primarily focusing on industries characterized by high energy consumption and substantial GHG emissions. Sectors such as petrochemical, oil refining, high technology, and steel industries have been particularly contentious in this regard.
Despite public protests against the ongoing rise in energy consumption, the Taiwanese government has consistently provided subsidies to industries in order to promote economic growth. The government's support for high energy consumption and high GHGs emission industries has posed a significant challenge in the context of climate change. Moreover, international green conventions are increasingly imposing sanctions on emerging industries. However, the occurrence of climate disasters both globally and in Taiwan, along with the scrutiny and demands of civil society, has led to increased public awareness regarding unsustainable industrial development and government control. This growing social consciousness directly contradicts the perspectives of political authorities and experts.
Current energy construction in Taiwan
The power generation landscape in Taiwan currently comprises several sources, including thermal power derived from oil, coal, natural gas, nuclear energy, renewable energy from biofuel, wind, solar, and hydropower. 45 In recent years, there has been a significant debate in Taiwan regarding the future of nuclear power, in alignment with the international non-nuclear power policy. The discussion revolves around determining the role and viability of nuclear energy in Taiwan's future energy mix. Some people believe that it should be phased out in favor of renewable energy sources, while others argue that it is an important part of the country's energy mix (reference source: https://www.thenewslens.com/article/101001). In 2015, the government announced that it would not build any new nuclear power plants, and that the existing plants would be decommissioned when they reach the end of their operating lives. However, the government has not set a specific timetable for decommissioning. Then discuss hydropower and biomass energy. According to Kung and McCarl, 46 hydroelectric power and biomass energy contribute only a small portion to Taiwan's total electricity generation, accounting for approximately 0.3% and 1.15%, respectively. The authors argue that factors such as geographical limitations and environmental considerations make the power supply and demand of hydropower and bioenergy relatively unstable in Taiwan. As a result, these sources are not considered to be the main contributors to Taiwan's renewable energy mix.
Taiwan's favorable climatic conditions, including the Asian monsoon, summer tropical cyclones, and winter northeast trade winds, provide it with abundant wind resources. These weather patterns induce high wind speeds in various areas of Taiwan. In particular, the Taiwan Strait experiences increased wind speeds attributed to the blockage effect, with a shallow water depth (less than 100 meters) and an average depth of 40–80 meters in the offshore region. As a result, the Taiwan Strait holds significant potential for the development of offshore wind energy. 47
Despite the great potential, the deployment of wind turbines in Taiwan has primarily focused on onshore areas over the past decade, as reported by Chang and Tu 48 and Tu et al. 49 However, in recent years, there has been public opposition to the expansion of wind energy projects. As of 2012, Taiwan had a total of 302 onshore wind turbines, contributing to an installed capacity of 596 MW.
To further advance wind energy development, the Taiwanese government has enacted the Energy Tax Law, GHGs Reduction Law, and Renewable Energy Development Bill. In addition, the government has launched the Thousand Wind Turbines Project, aimed at promoting energy efficiency and carbon reduction. This ambitious project plans to install 1050 wind turbines in both onshore and offshore areas over the next 20 years, with a target installed capacity of 4200 MW. 50
In addition to wind power, solar power is indeed a significant renewable energy source in Taiwan. Solar photovoltaics (PVs) rely on stable and sufficient sunlight to generate electricity, as highlighted by Kung and McCarl. 46 However, it is worth noting that solar power has certain limitations. While it is a renewable energy source, its energy density is relatively low, requiring a wide area for operation to harness sufficient sunlight. Additionally, the deployment of solar power entails substantial investment costs due to the need for a great number of solar panels and batteries.
These investment costs often make governments indecisive to establish solar power plants on a large scale. 51 In 2015, Taiwan's global solar power device capacity reached 227 GW, as reported by Energy B. 52 Ko et al. 53 conducted a study estimating the potential solar power generation from solar PV roofs. Their findings suggested that the maximum device capacity of solar PVs could reach 12.4 GW. Considering the current trajectory, the Energy Bureau expects the device capacity and power generation from solar power to grow significantly. By 2030, they anticipate the device capacity to reach 8700 MW, with an estimated power generation of 10,900 GWh. These projections indicate the government’s commitment to expanding solar power capacity in Taiwan over the next decade.
Under these circumstances, Taiwan's energy policies address the urgent problem of designing a strategy for balancing the supply and demand of energy and reducing GHG emissions. In recent years, the Taiwanese government has promoted policies regarding wind and solar power to decrease energy consumption from thermal power and enhanced natural gas usage to reduce GHG emissions. The Taiwanese government aims to reduce GHG emissions to 20% reduction from 2005 before 2030.
Objective
Therefore, the article purpose is to assess the supply of traditional energy and renewable energy in developing countries, using Taiwan as an example, from the present until 2050, with the aim of meeting their energy demand and minimizing carbon emissions.
Methodology
Data source
Energy data were collected from the Taiwan Power Company during 2005–2020. Figure 1 shows the energy consumption trend from 2005 to 2020, which shows an annual increase in power generation and energy consumption. Power generation by thermal, nuclear, renewable energy, and hydropower during 2005–2020 is presented in Figure 2. Figure 2(a) shows that thermal power generation increased by 50 billion kWh during this period, while nuclear power generation increased by ∼30 billion kWh (Figure 2(b)) in the last two years. Figure 2(c) shows that the power generation of renewable energy rapidly increased to 14 billion kWh during 2017–2020, while that of hydropower was ∼3 billion kWh. Based on the power generation data, we designed a linear programming model to assess energy consumption using fossil fuel and renewable energy.
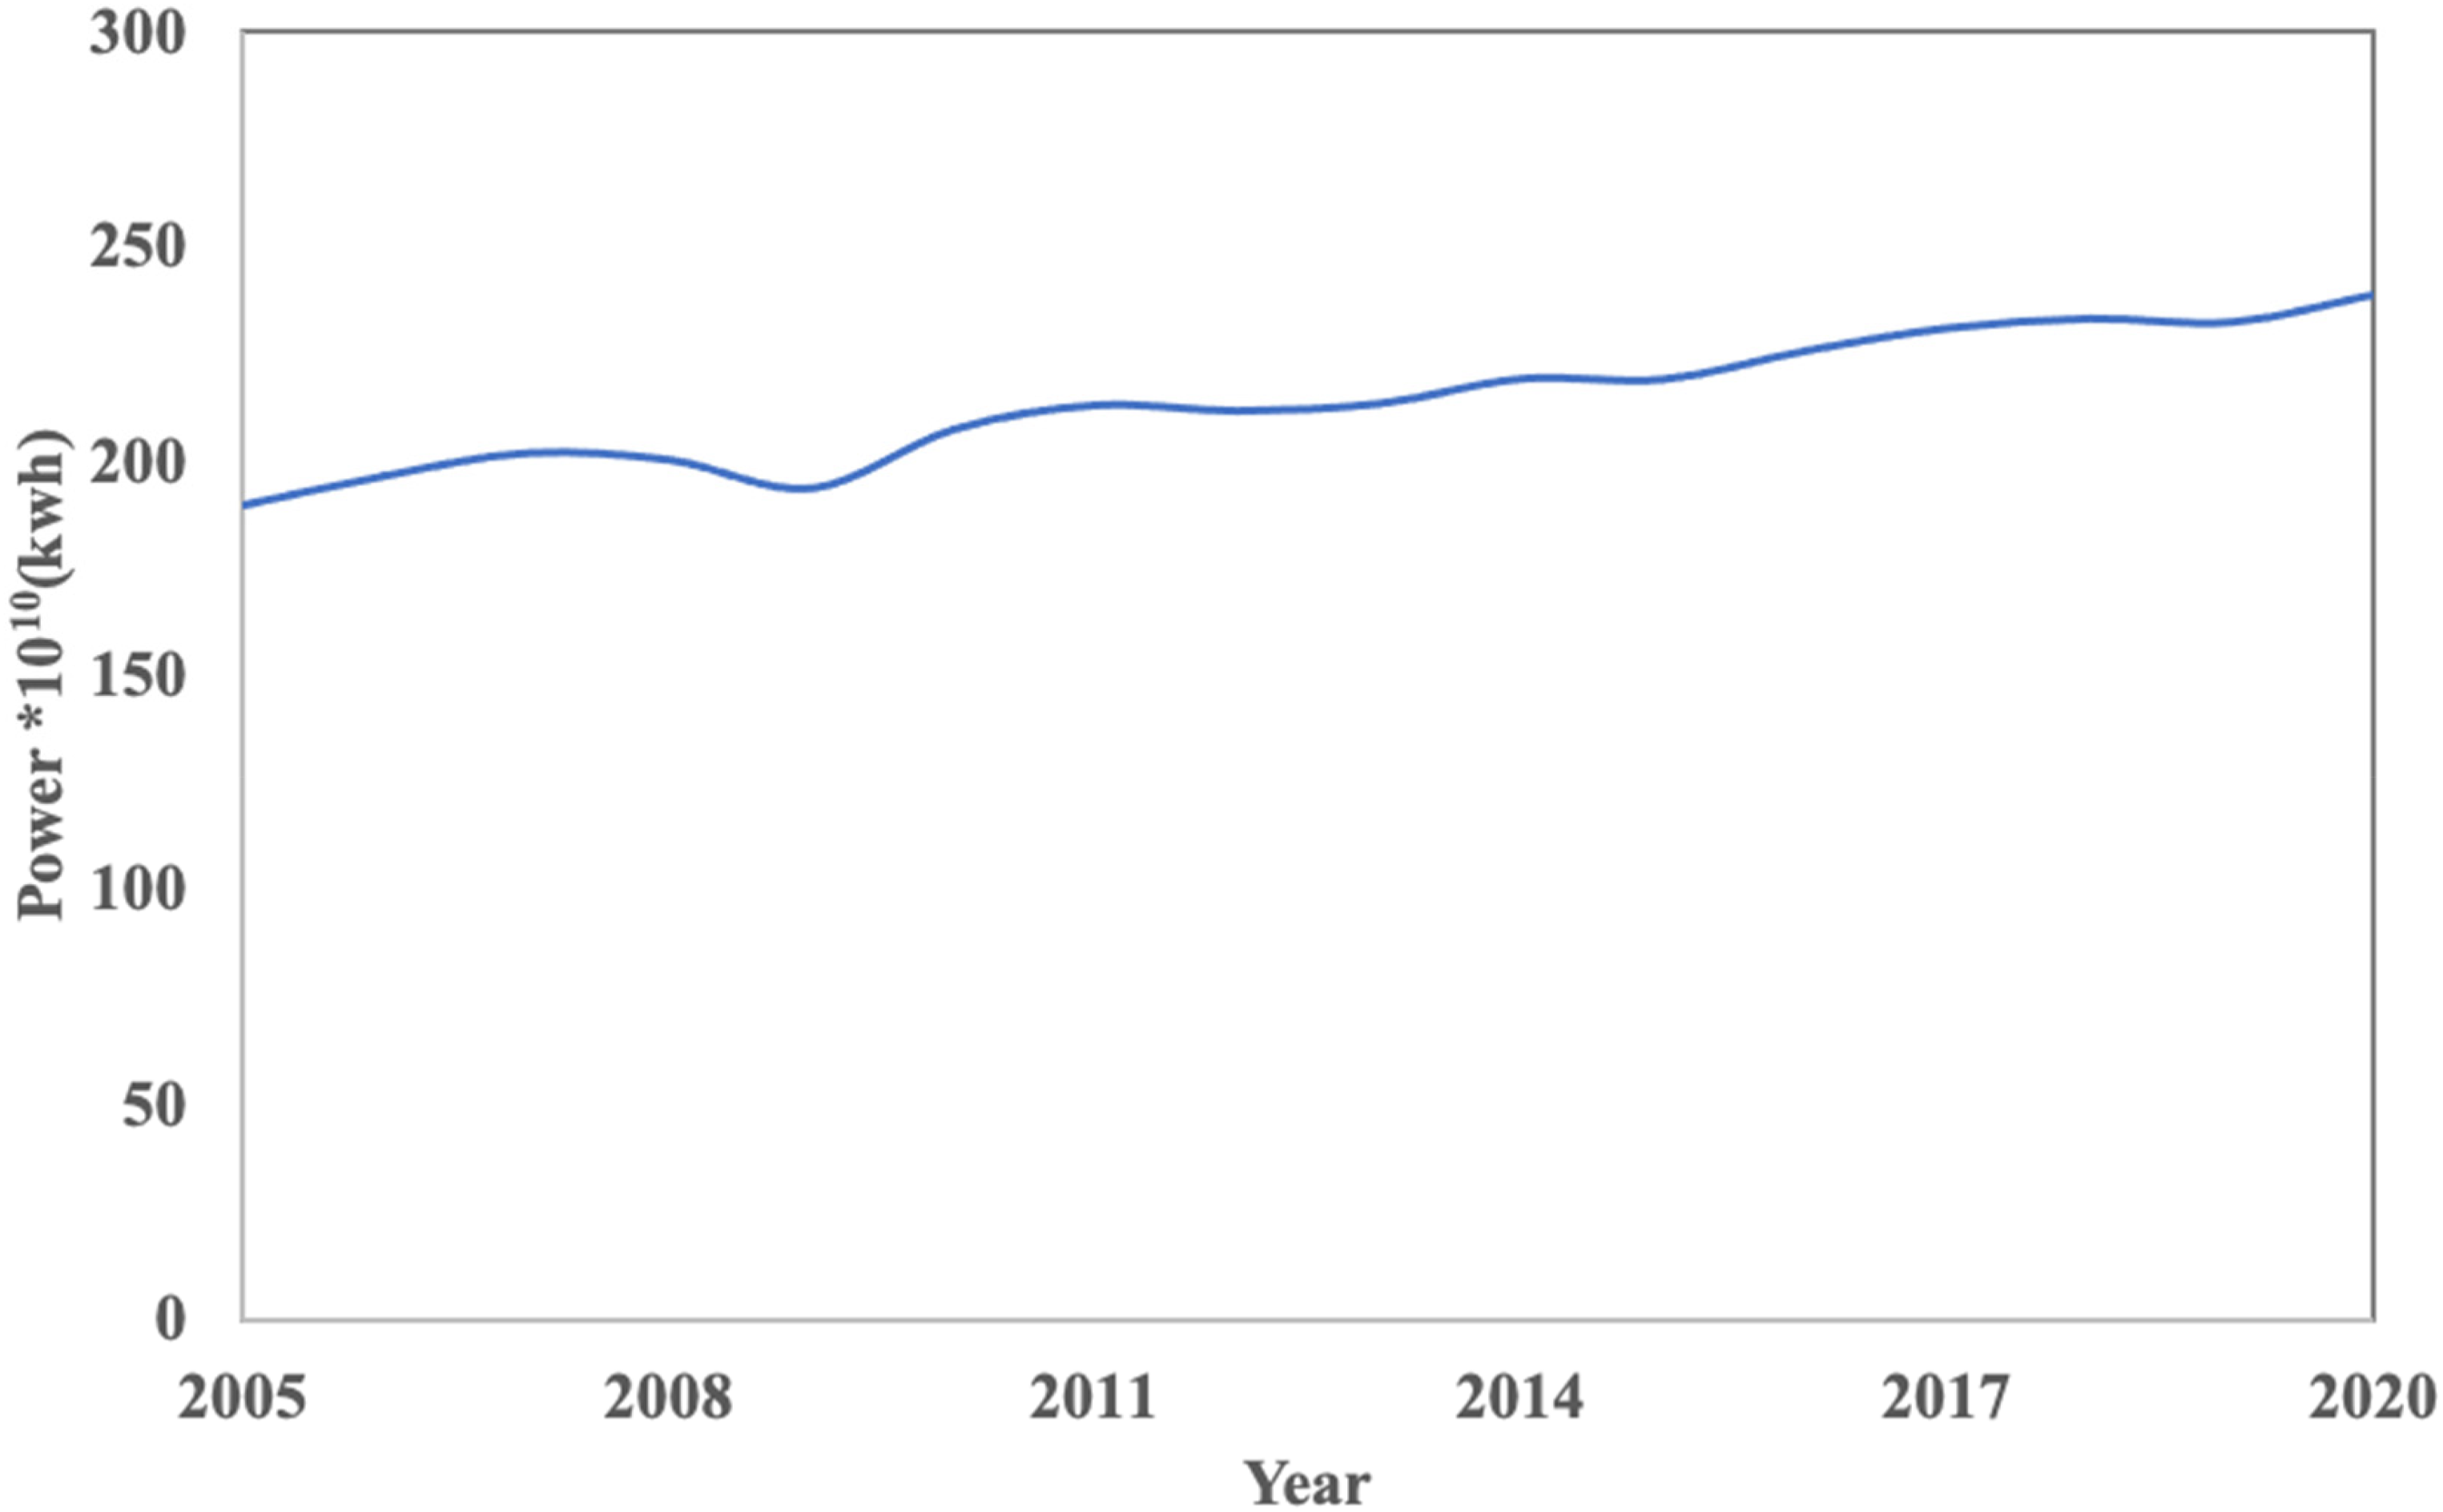
Power generation from 2005 to 2020.
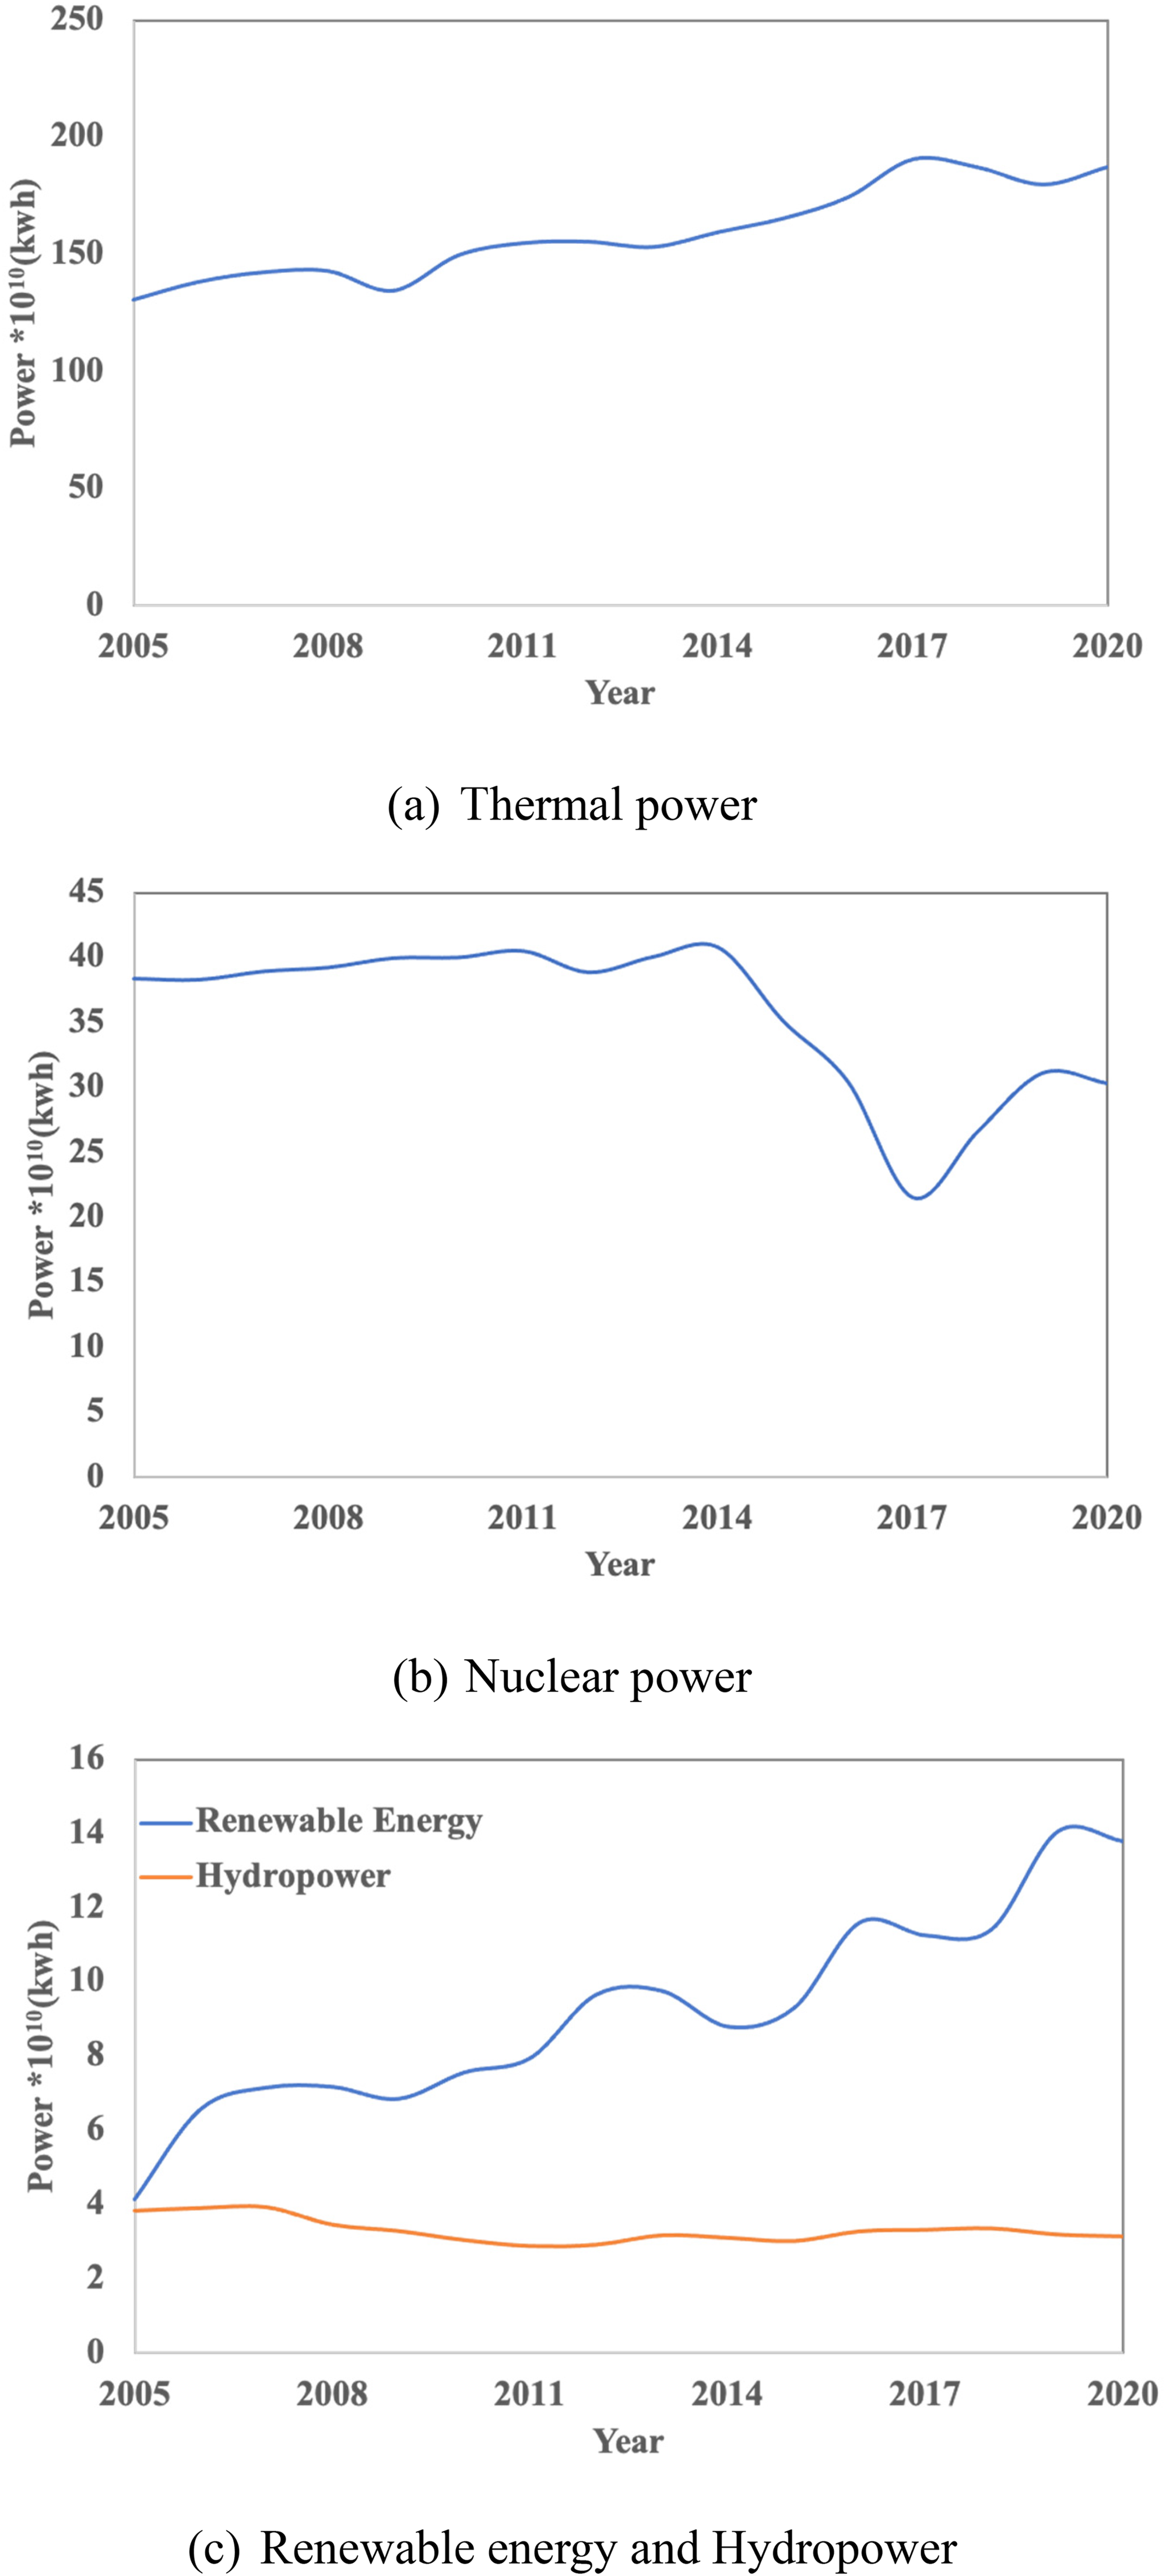
Power generation by each power source. (a) Thermal; (b) Nuclear; (c) Renewable Energy and Hydropower.
Energy assessment via GHGs emissions
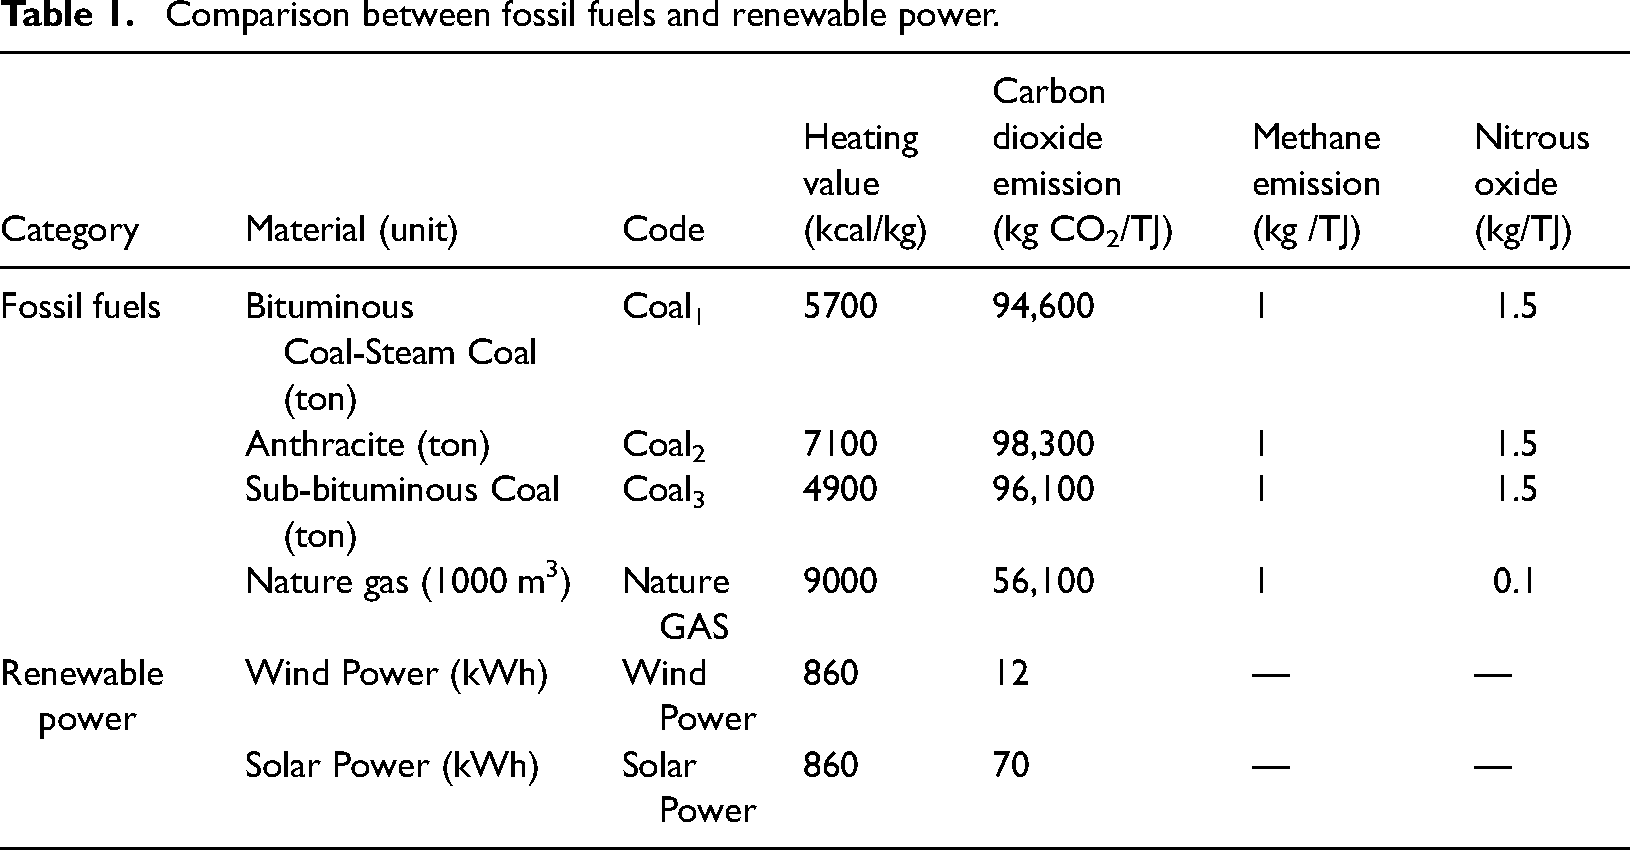
To assess the GHG emissions from power generation in Taiwan, Table 1 shows the collected heating value, 54 GHG emission coefficient 55 of fossil fuels, including bituminous coal-steam coal (Coal1), anthracite (Coal2), sub-bituminous coal (Coal3), natural gas (Nature gas), and renewable energy (including wind and solar power). The heating value of coal is lower than that of natural gas, but its GHG emission efficiency is higher.
Comparison between fossil fuels and renewable power.
To assess the minimization of GHG emissions by power generation from thermal and renewable energy sources, this study establishes an objective function (equation (1)):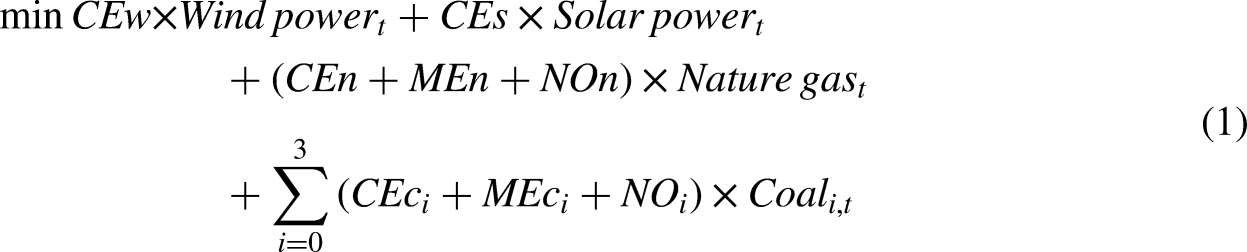
Greenhouse gases cannot be directly summed up to obtain overall emission values because they have varying GWPs. To calculate the emission values, all annual emission rates should be converted to tons of CO2 equivalent (tCO2 eq) using equation (2)
9
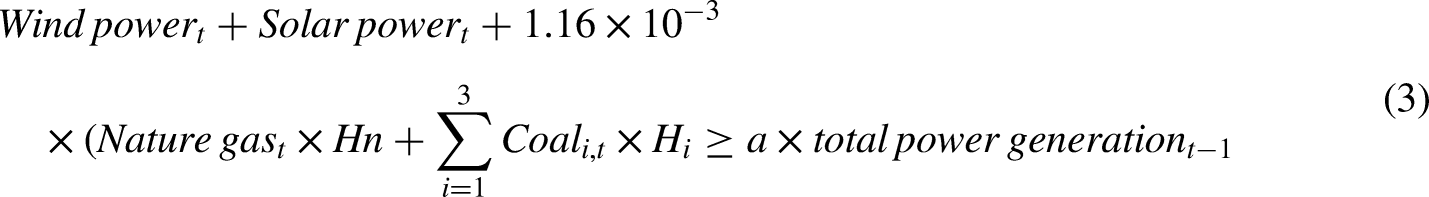
: Power generation constraint: Renewable energy constraint: Supply and demand constraint:
where Wind powert = power generation by wind power in t years; Solar powert = power generation by solar power in t years; Nature gast = Usage volume by nature gas in t years; Coali,t = Usage volume by each coal in t years; a = coefficient of total power generation calculated using the linear regression model; total power generationt−1 = total power generation of last year.
where b = coefficient of wind power generation calculated using the linear regression model; wind powert−1 = wind power generation of last year; c = coefficient of design wind power generation calculated using the linear regression model; after 2020, the design wind power generation was set as the upper boundary due to land use limitation in Taiwan; Dwind powert−1 = design wind power generation of last year:

where f = coefficient of demanded nature gas volume; g = coefficient of supplied nature gas volume; h = coefficient of each demanded coal volume; j = coefficient of each supplied coal volume.

Result
Trend of energy consumption by fossil fuels and renewable energy
Figures 3 and 4 show the energy consumption of coal, natural gas, wind power, and solar power. Figure 3(a) shows that coal1 decreased during 2005–2014 but slowly increased to 25 million tons in recent years. Coal2 had a high value in 2011 but was unstable during 2017–2020. Coal3 has increased since 2011 but gradually decreased to 12 million tons in recent years. Figure 3(b) shows that the amount of natural gas has increased rapidly since 2005. Figure 4 shows the generation of solar and wind power, where solar power rapidly increased from 2017 while wind power slowly increased during this period.
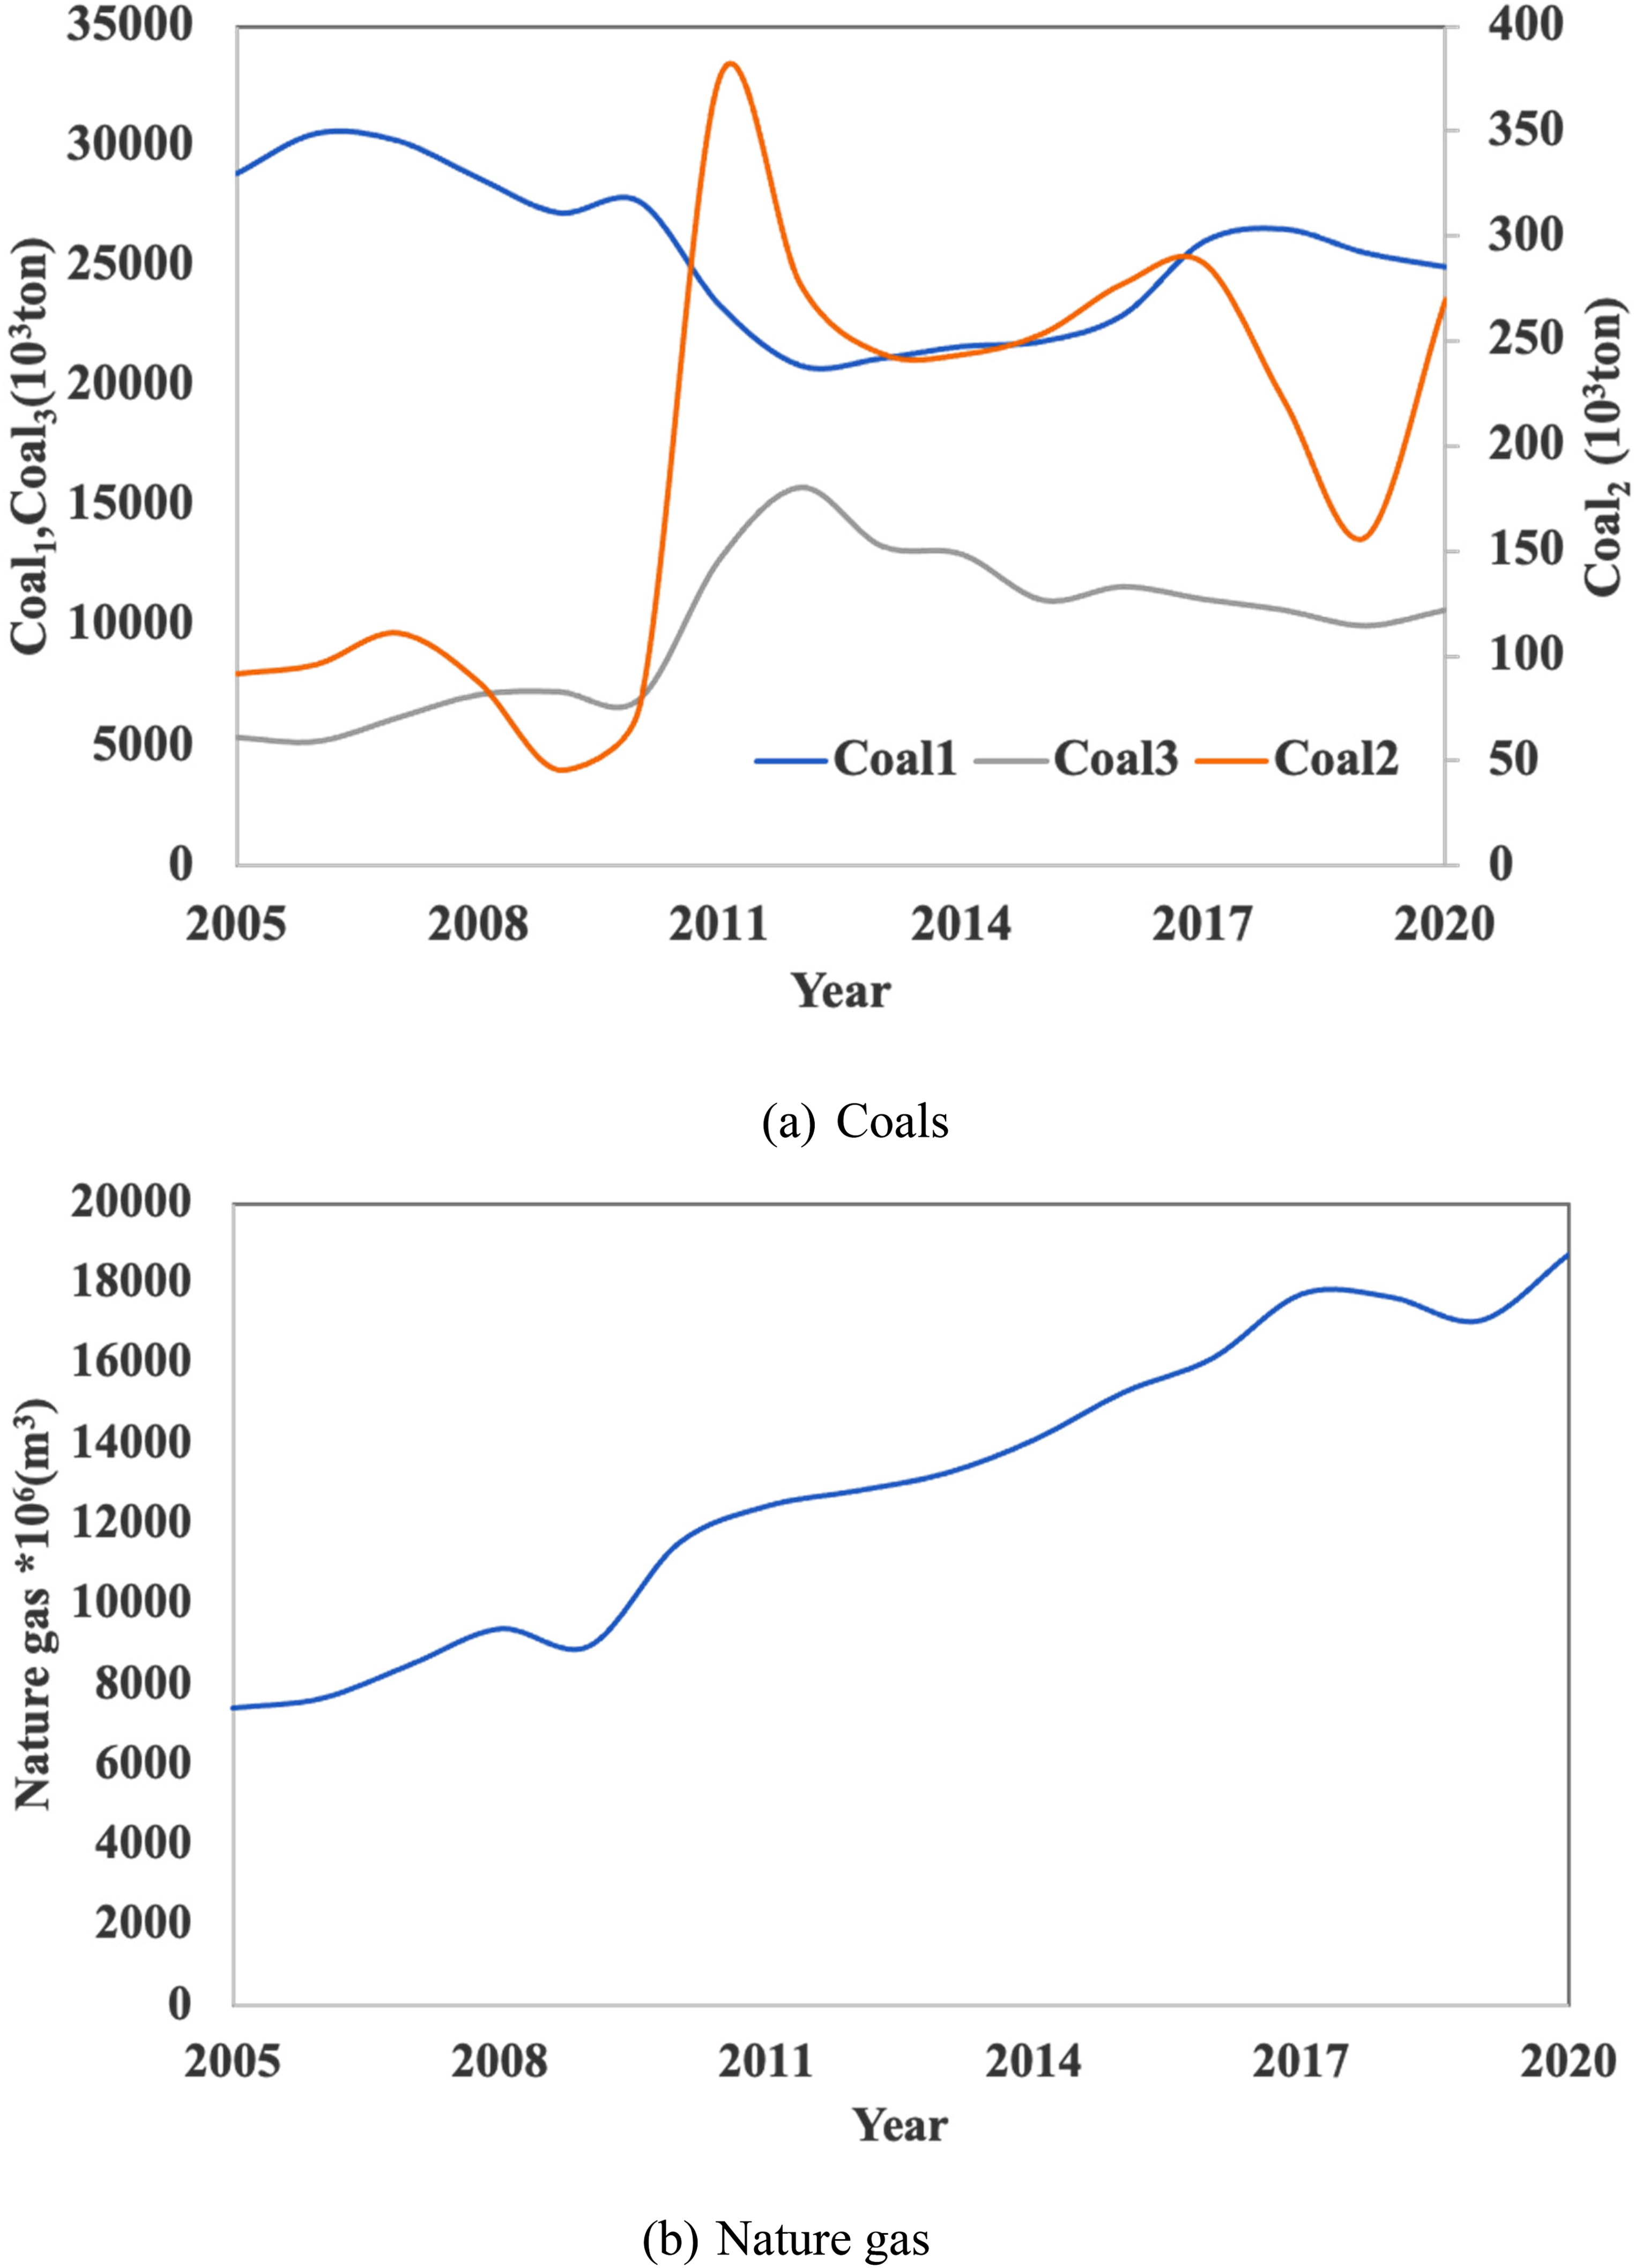
Energy consumption of fossil fuels. (a) Coals; (b) Nature gas.
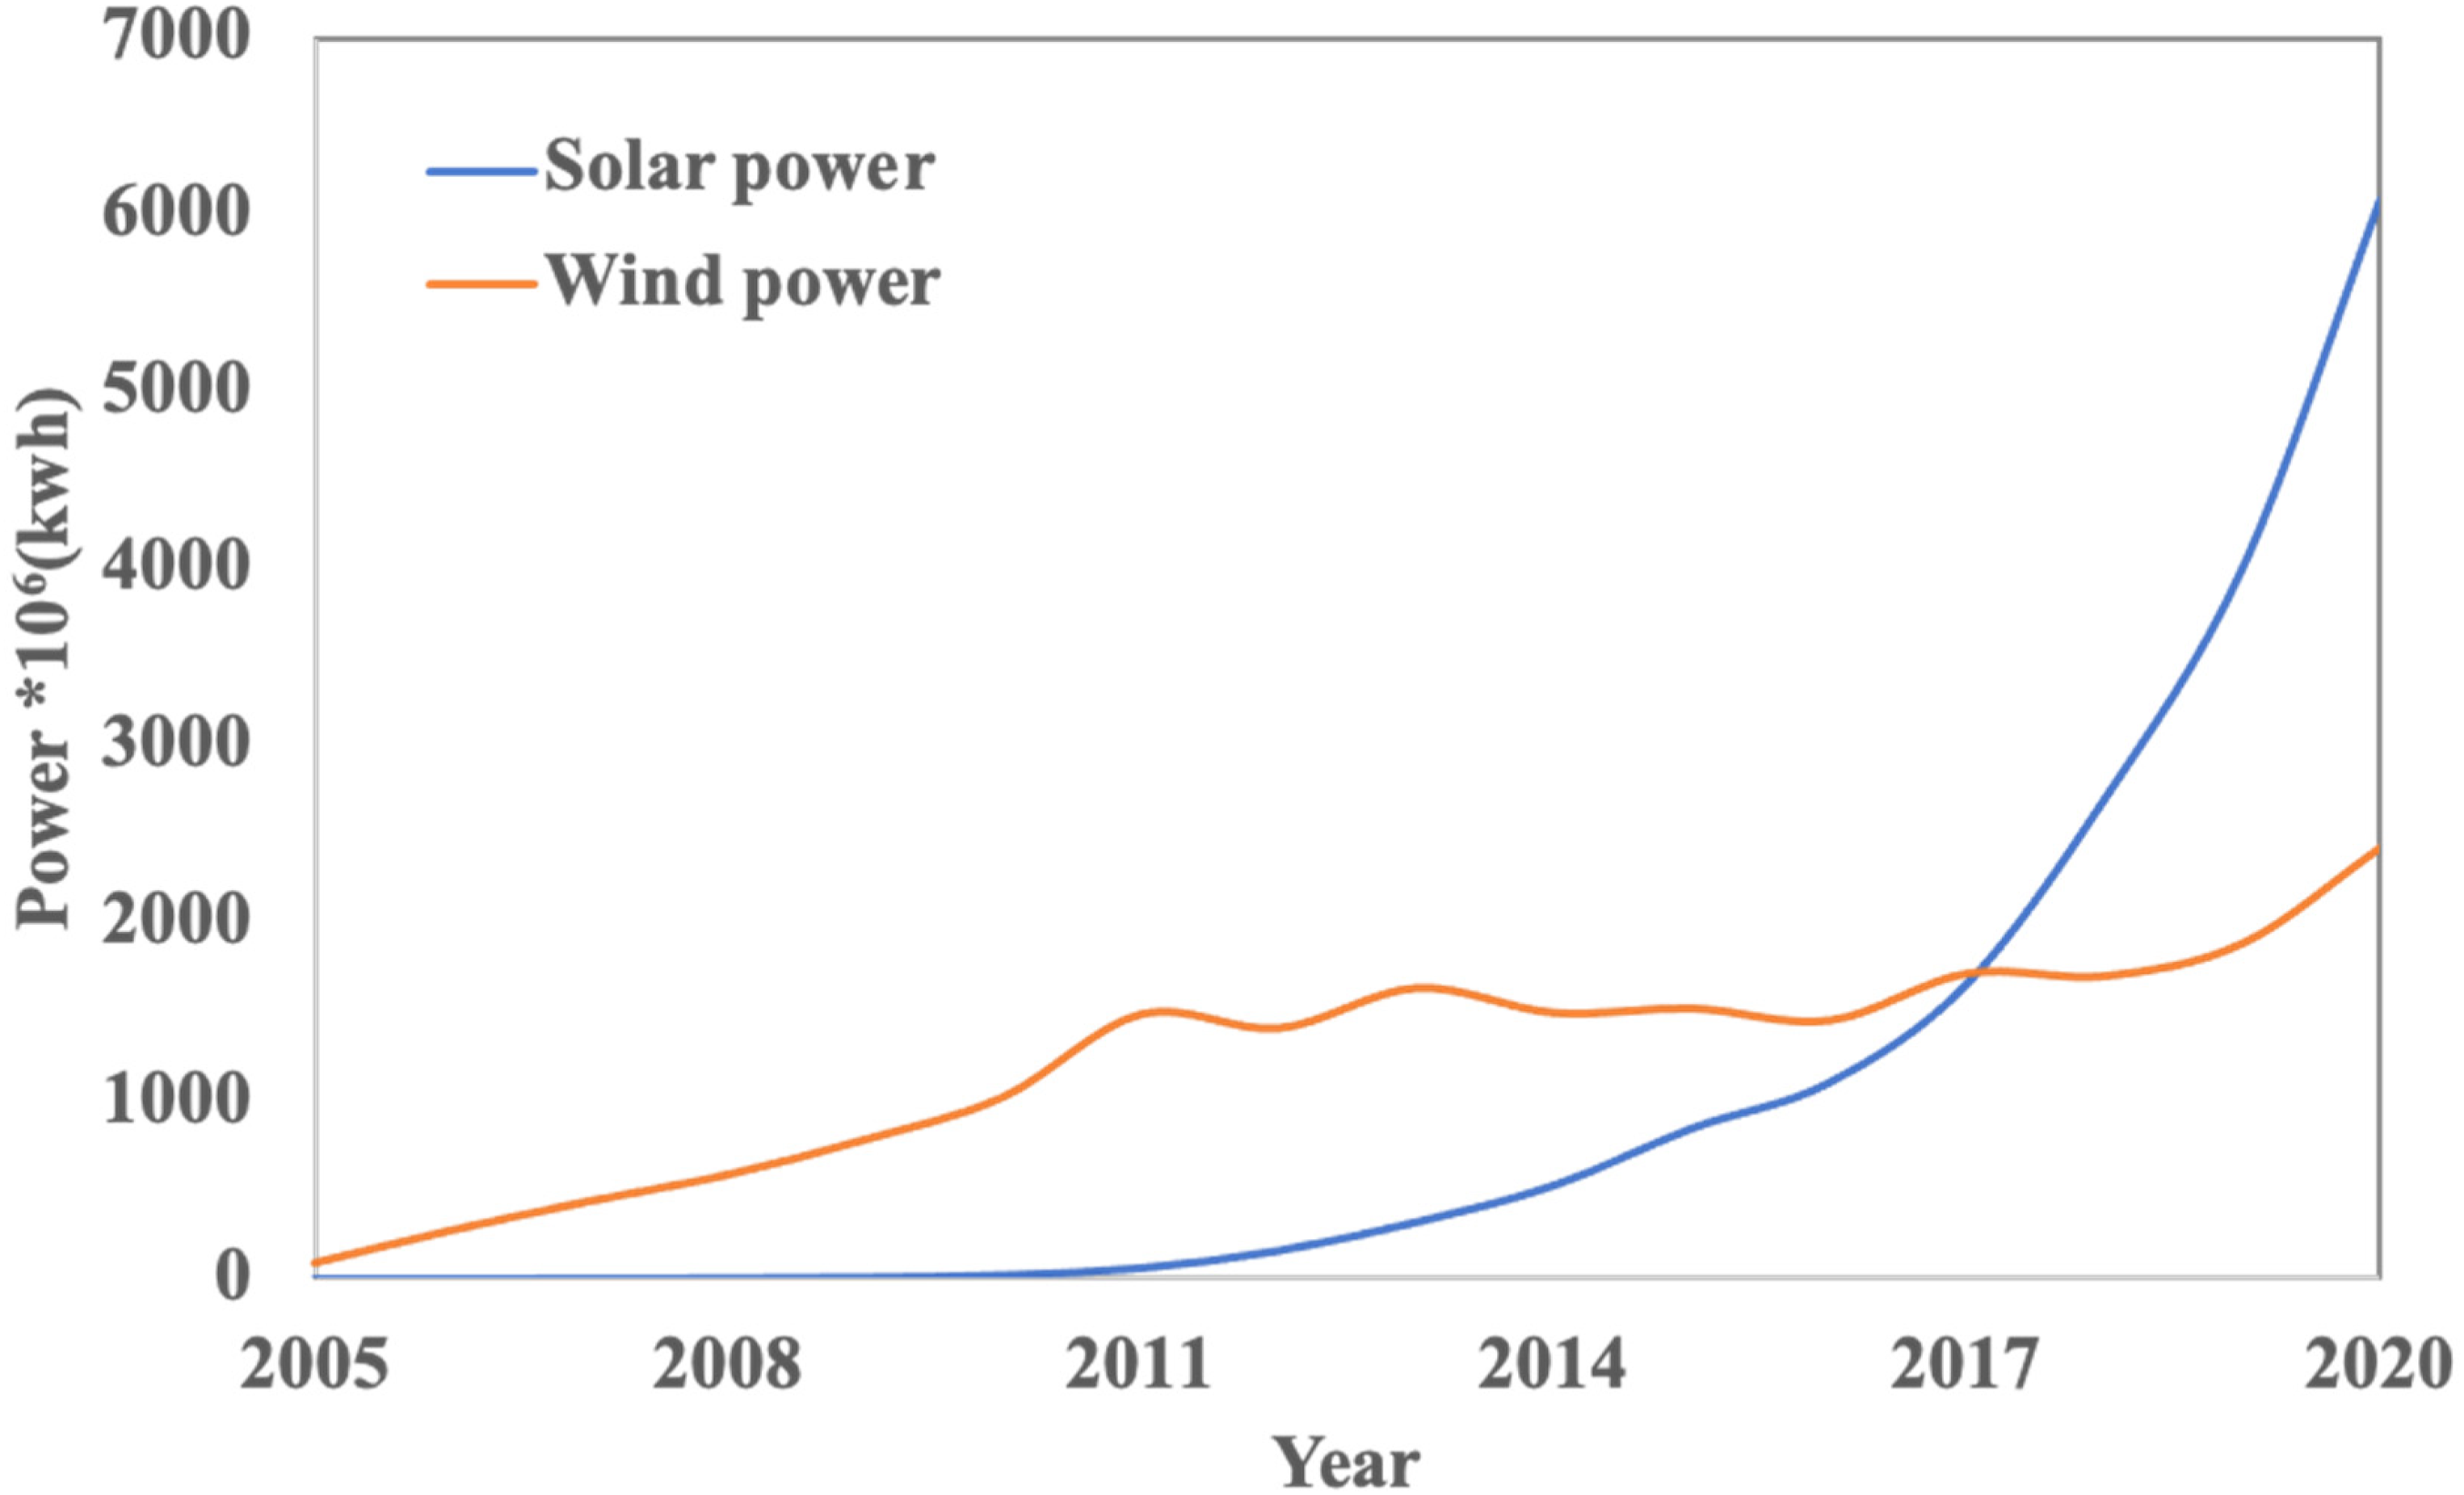
Renewable energy consumption during 2005–2020.
Scenario analysis
This study set up two scenarios to simulate fossil fuels and renewable energy with the goal of minimizing carbon emissions: (1) energy consumption in 2020, and (2) energy consumption increased by linear regression. Table 2 displays the coefficients for each parameter, where the demand and supply of coal1 and coal2 are <1. This indicates that coal1 and coal2 slowly increased, whereas coal3 increased rapidly. Wind power, solar power, and natural gas rapidly increased, particularly with respect to solar power.
Coefficient for each constraint.
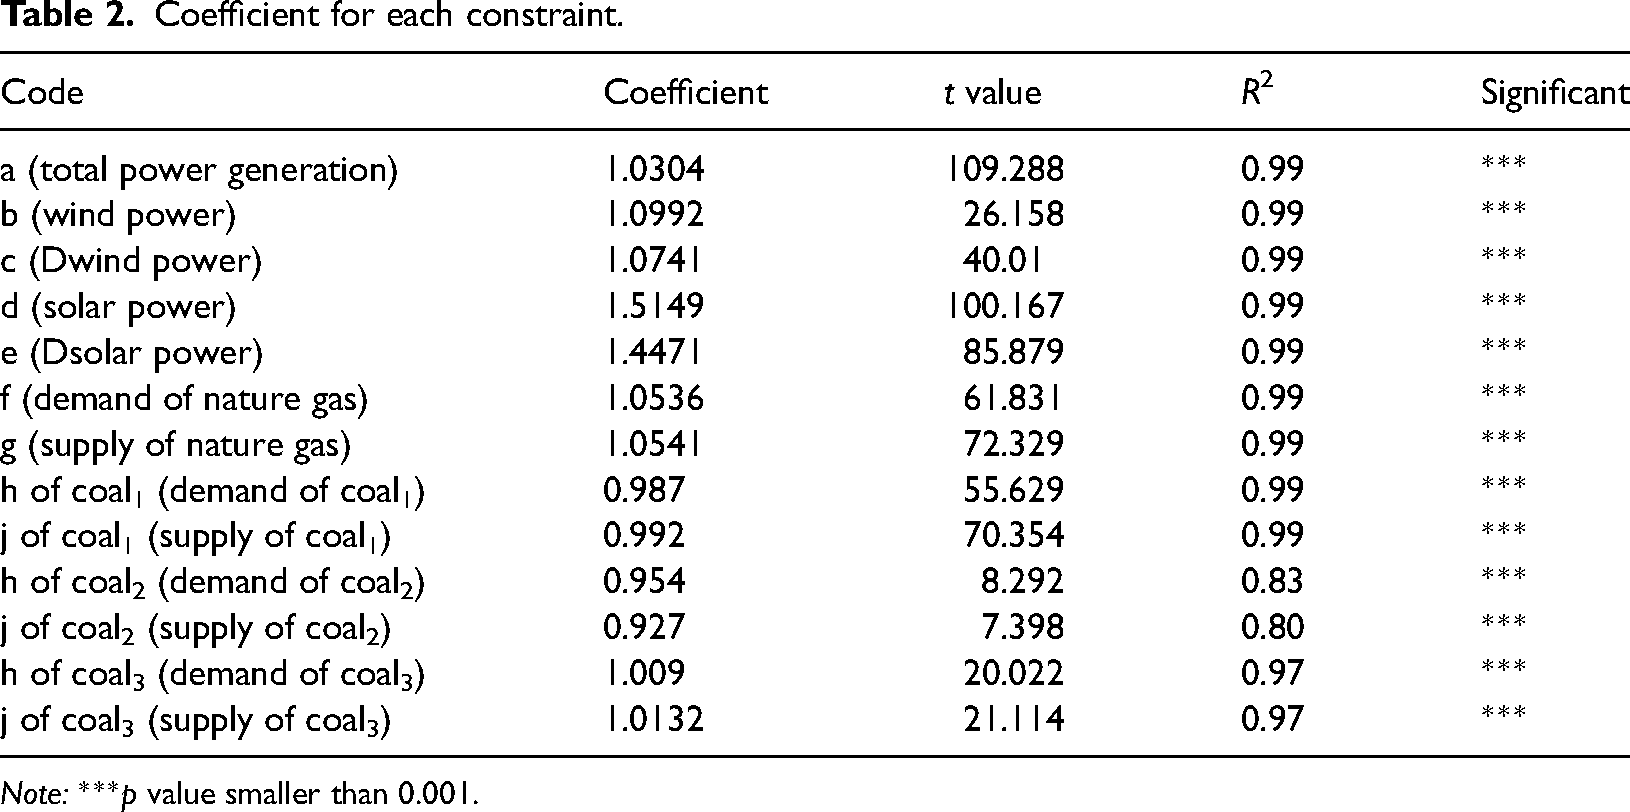
Note: ***p value smaller than 0.001.
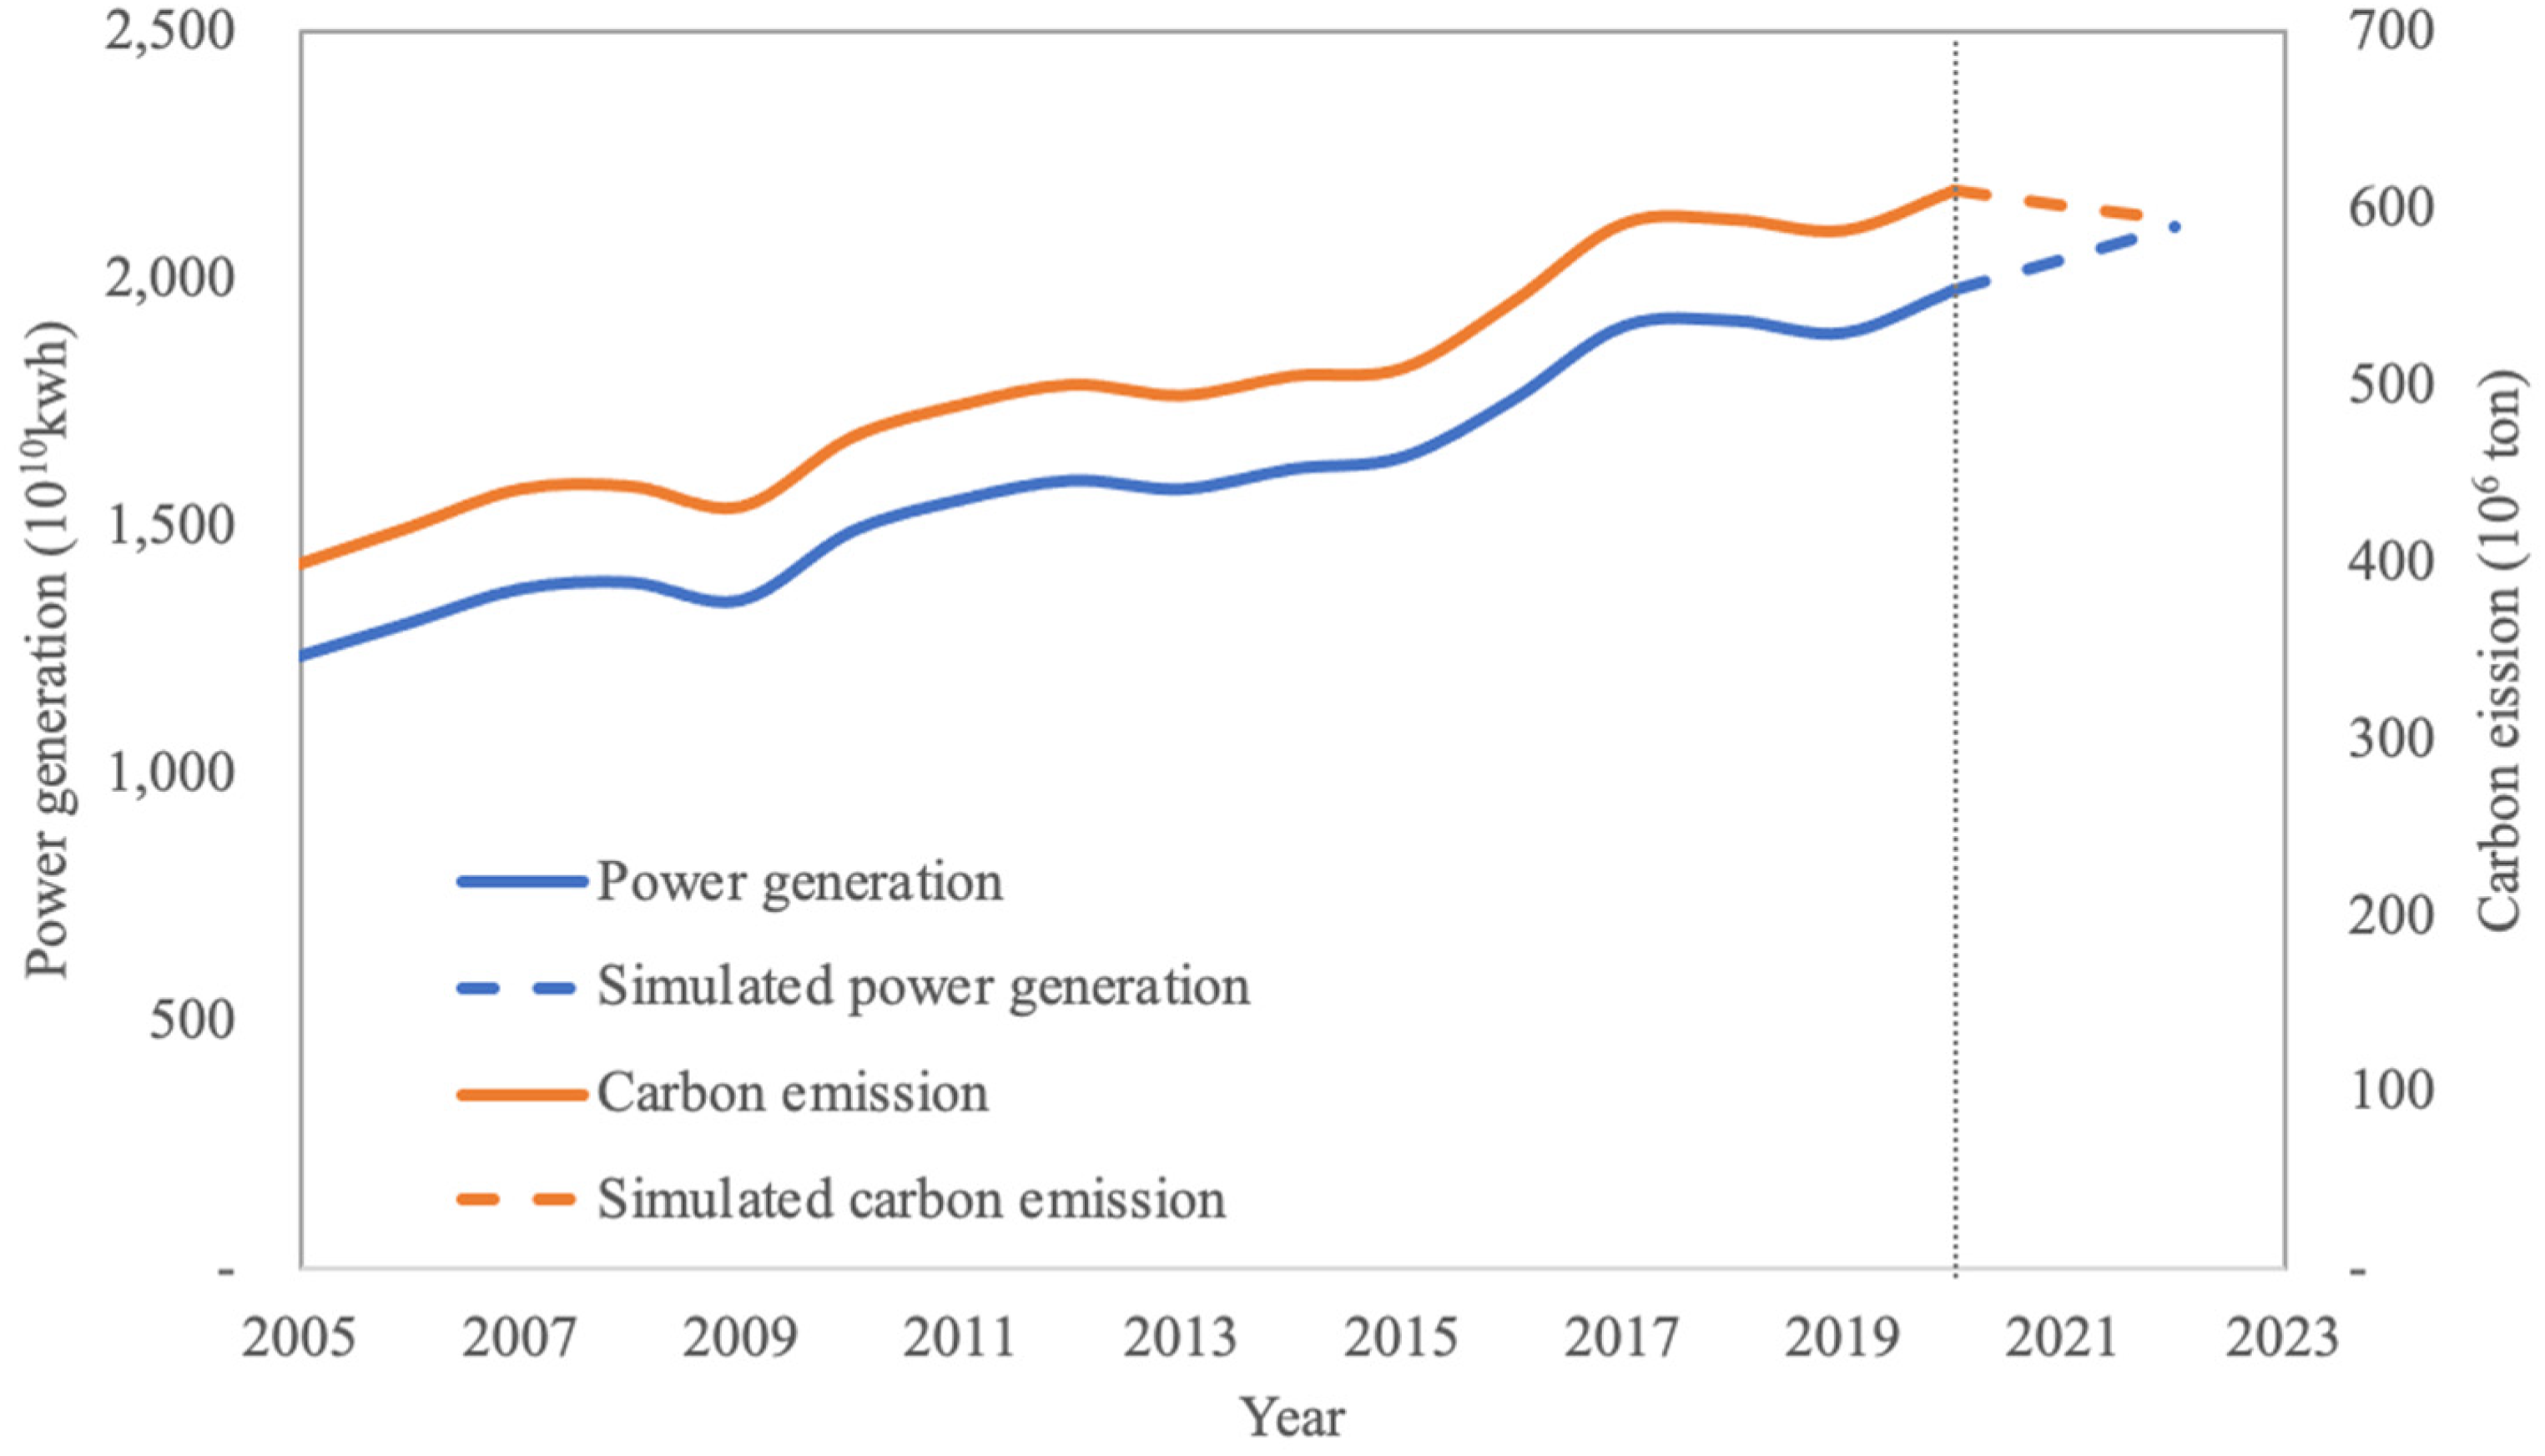
Table 2 shows the simulation results during 2005–2020 (Figure 5). A comparison of the energy consumption between the simulated and actual values is shown in Figure 5(a). The results showed that the simulated value was almost equal to the actual value. The simulated carbon emissions are shown in Figure 5(b). The actual carbon emissions were higher than the simulated values, but the simulated value was closer to the actual data after 2017. Figure 6 shows the simulated results for the energy consumption of each fossil fuel. It was observed that the simulated value of coal3 and natural gas was similar to the actual value, and the trend of coal1 has stabilized in recent years, but coal3 has increased.
Scenario 1: Energy consumption is equal to that in 2020 and carbon emissions are reduced by 20% of the value in 2005.
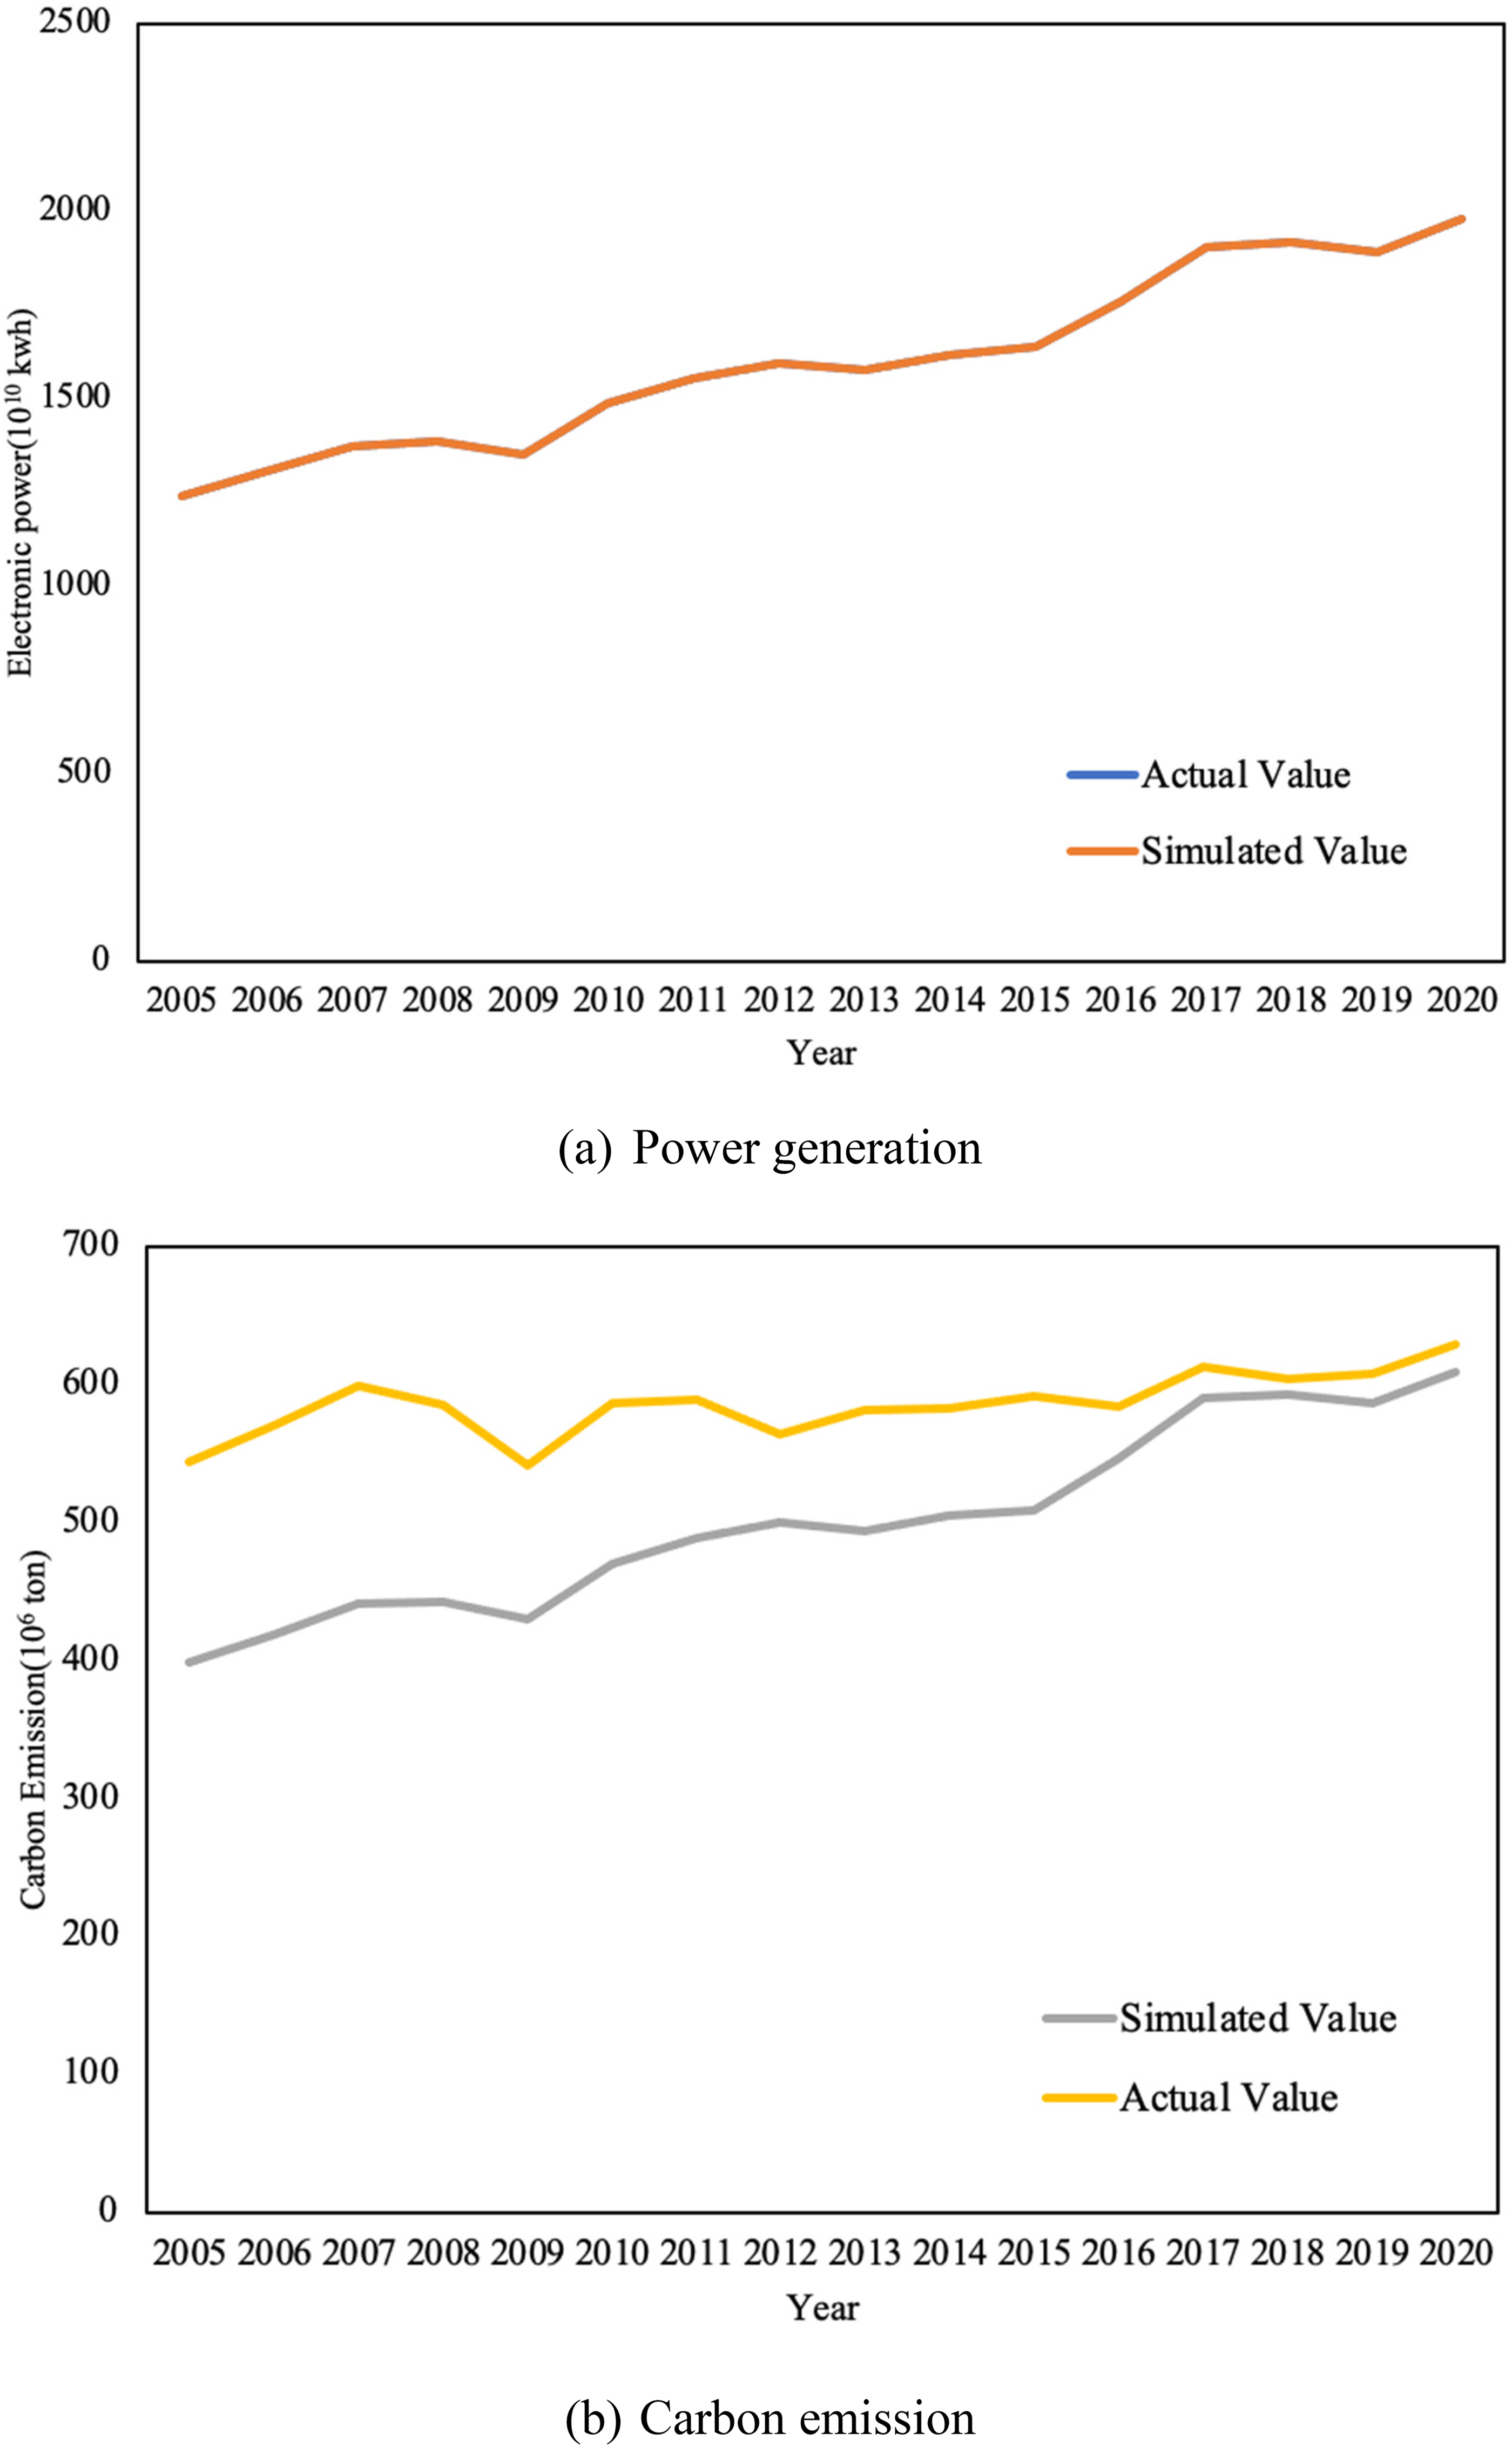
Comparison between simulated and actual value. (a) Power generation; (b) carbon emission.
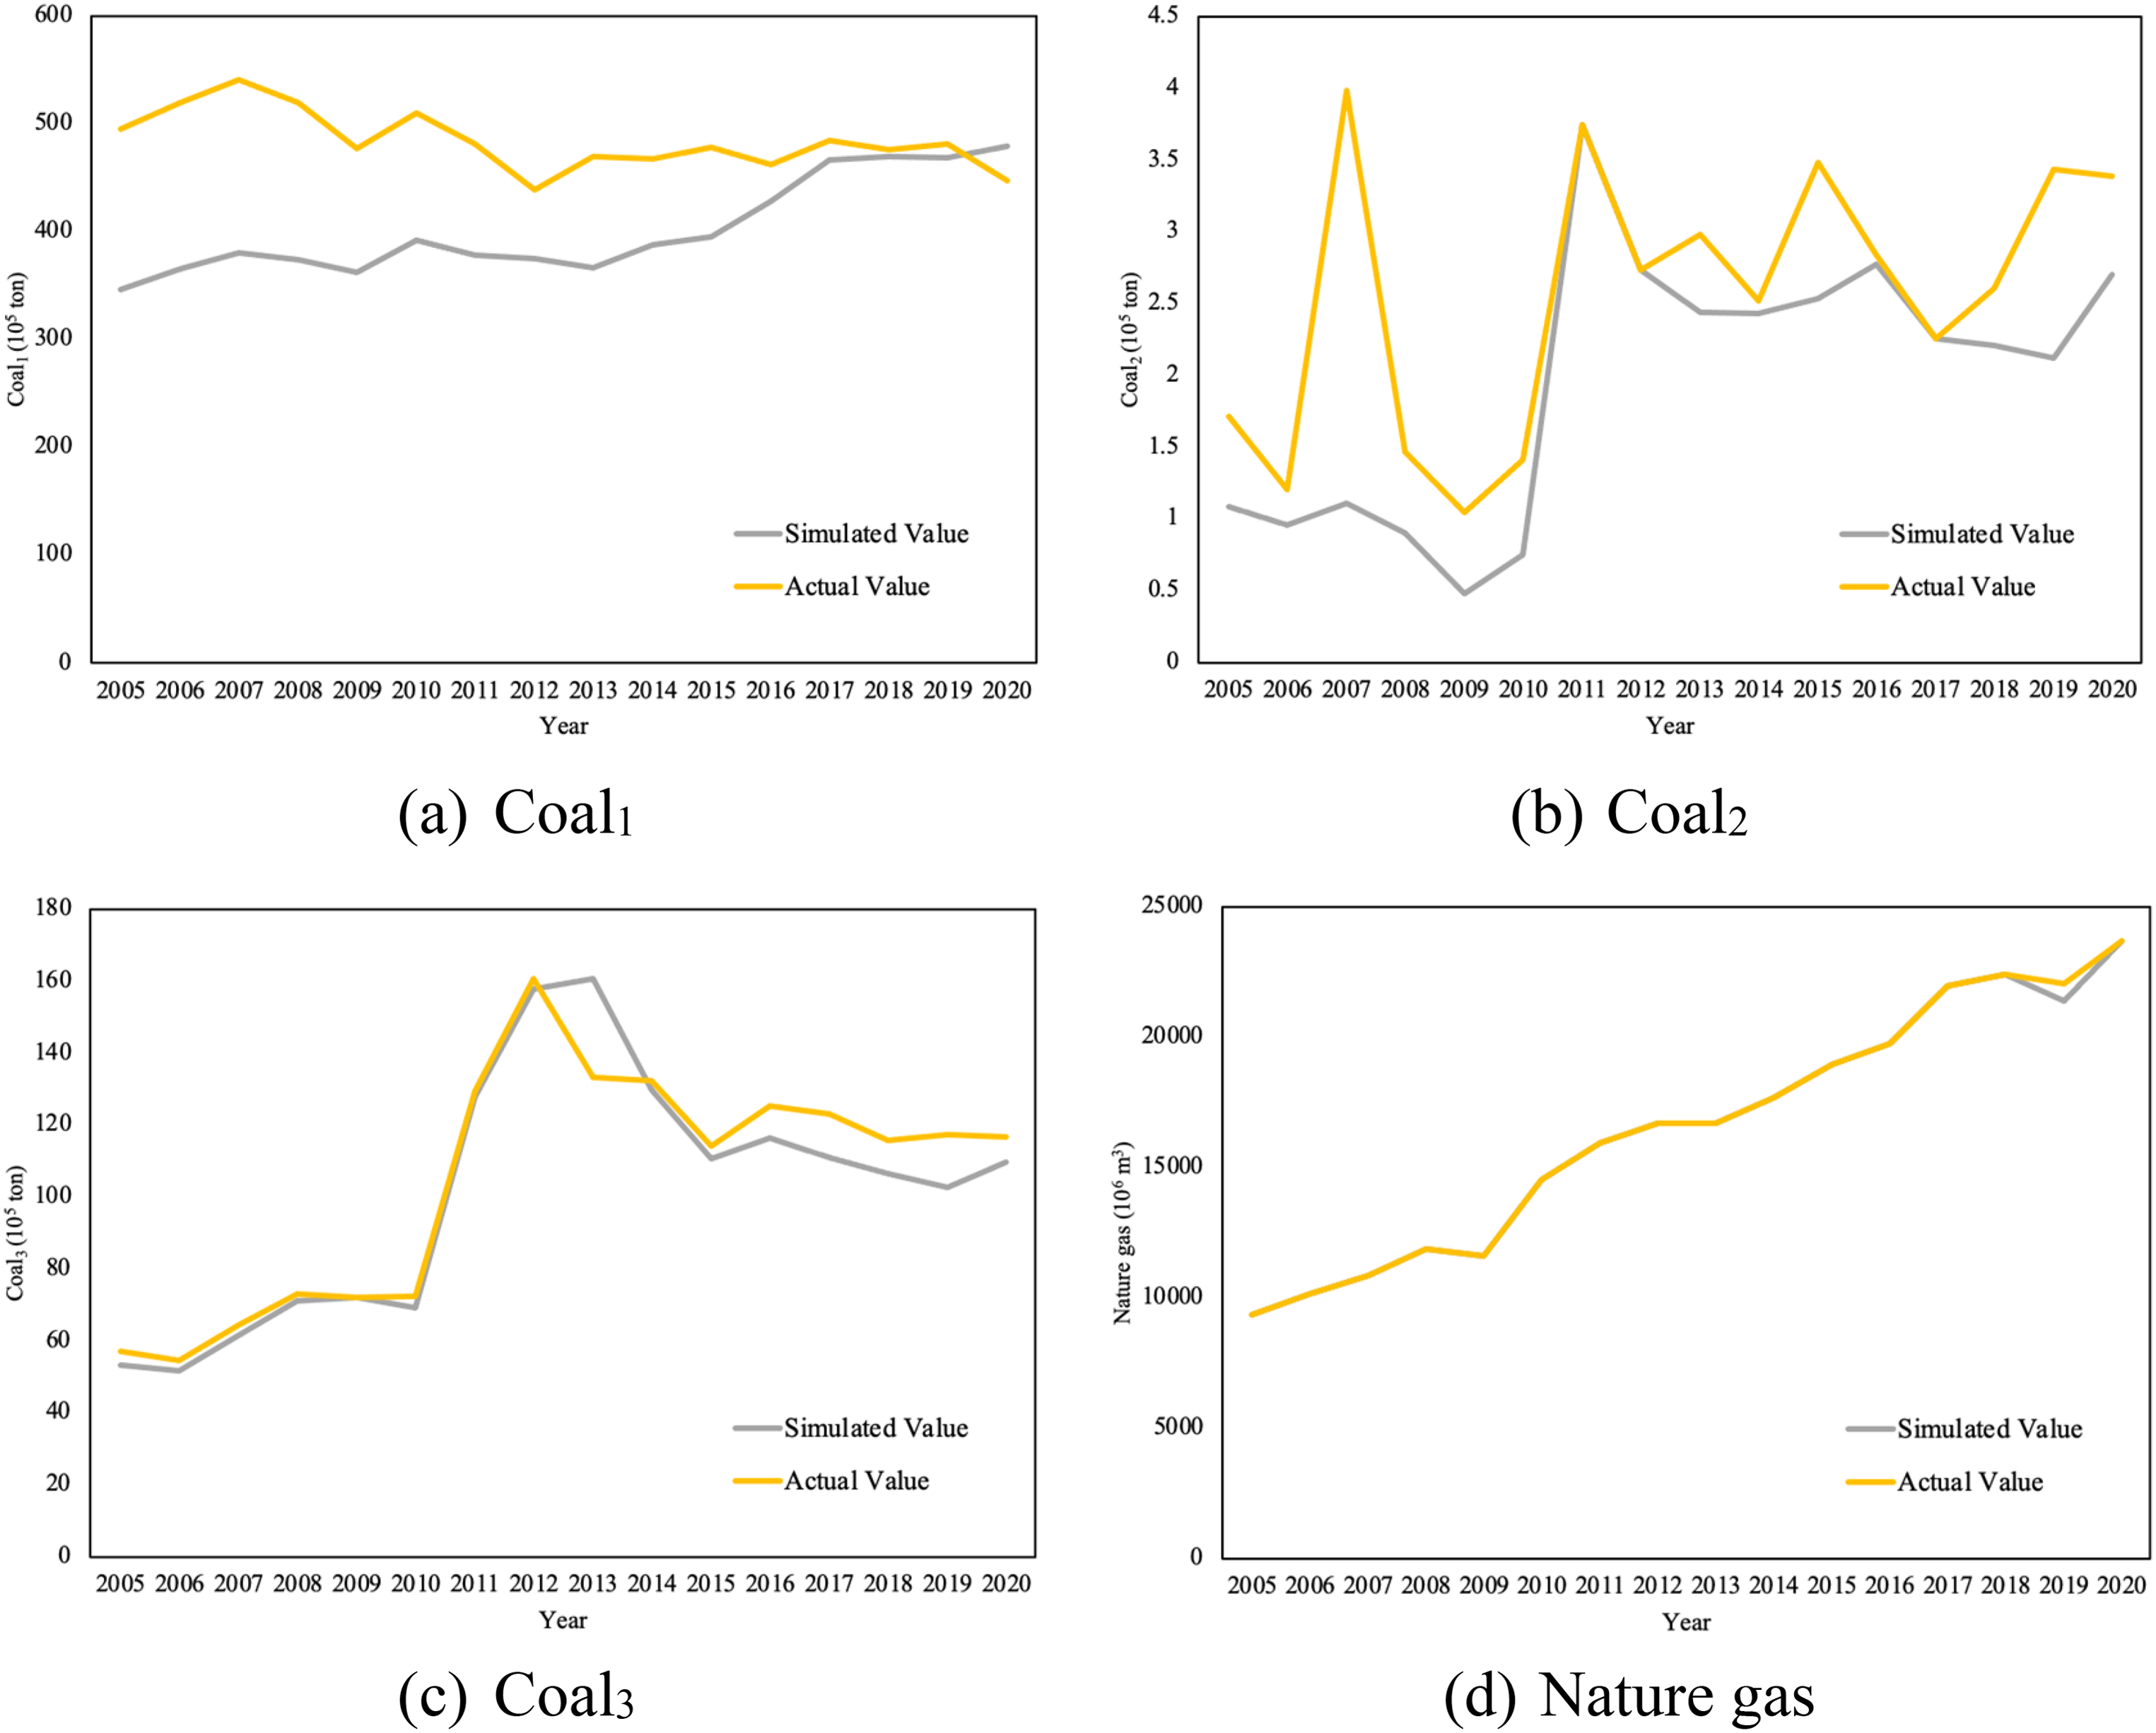
Energy consumption by each fossil fuels. (a) Coal1, (b) Coal2, (c) Coal3, (d) nature gas.
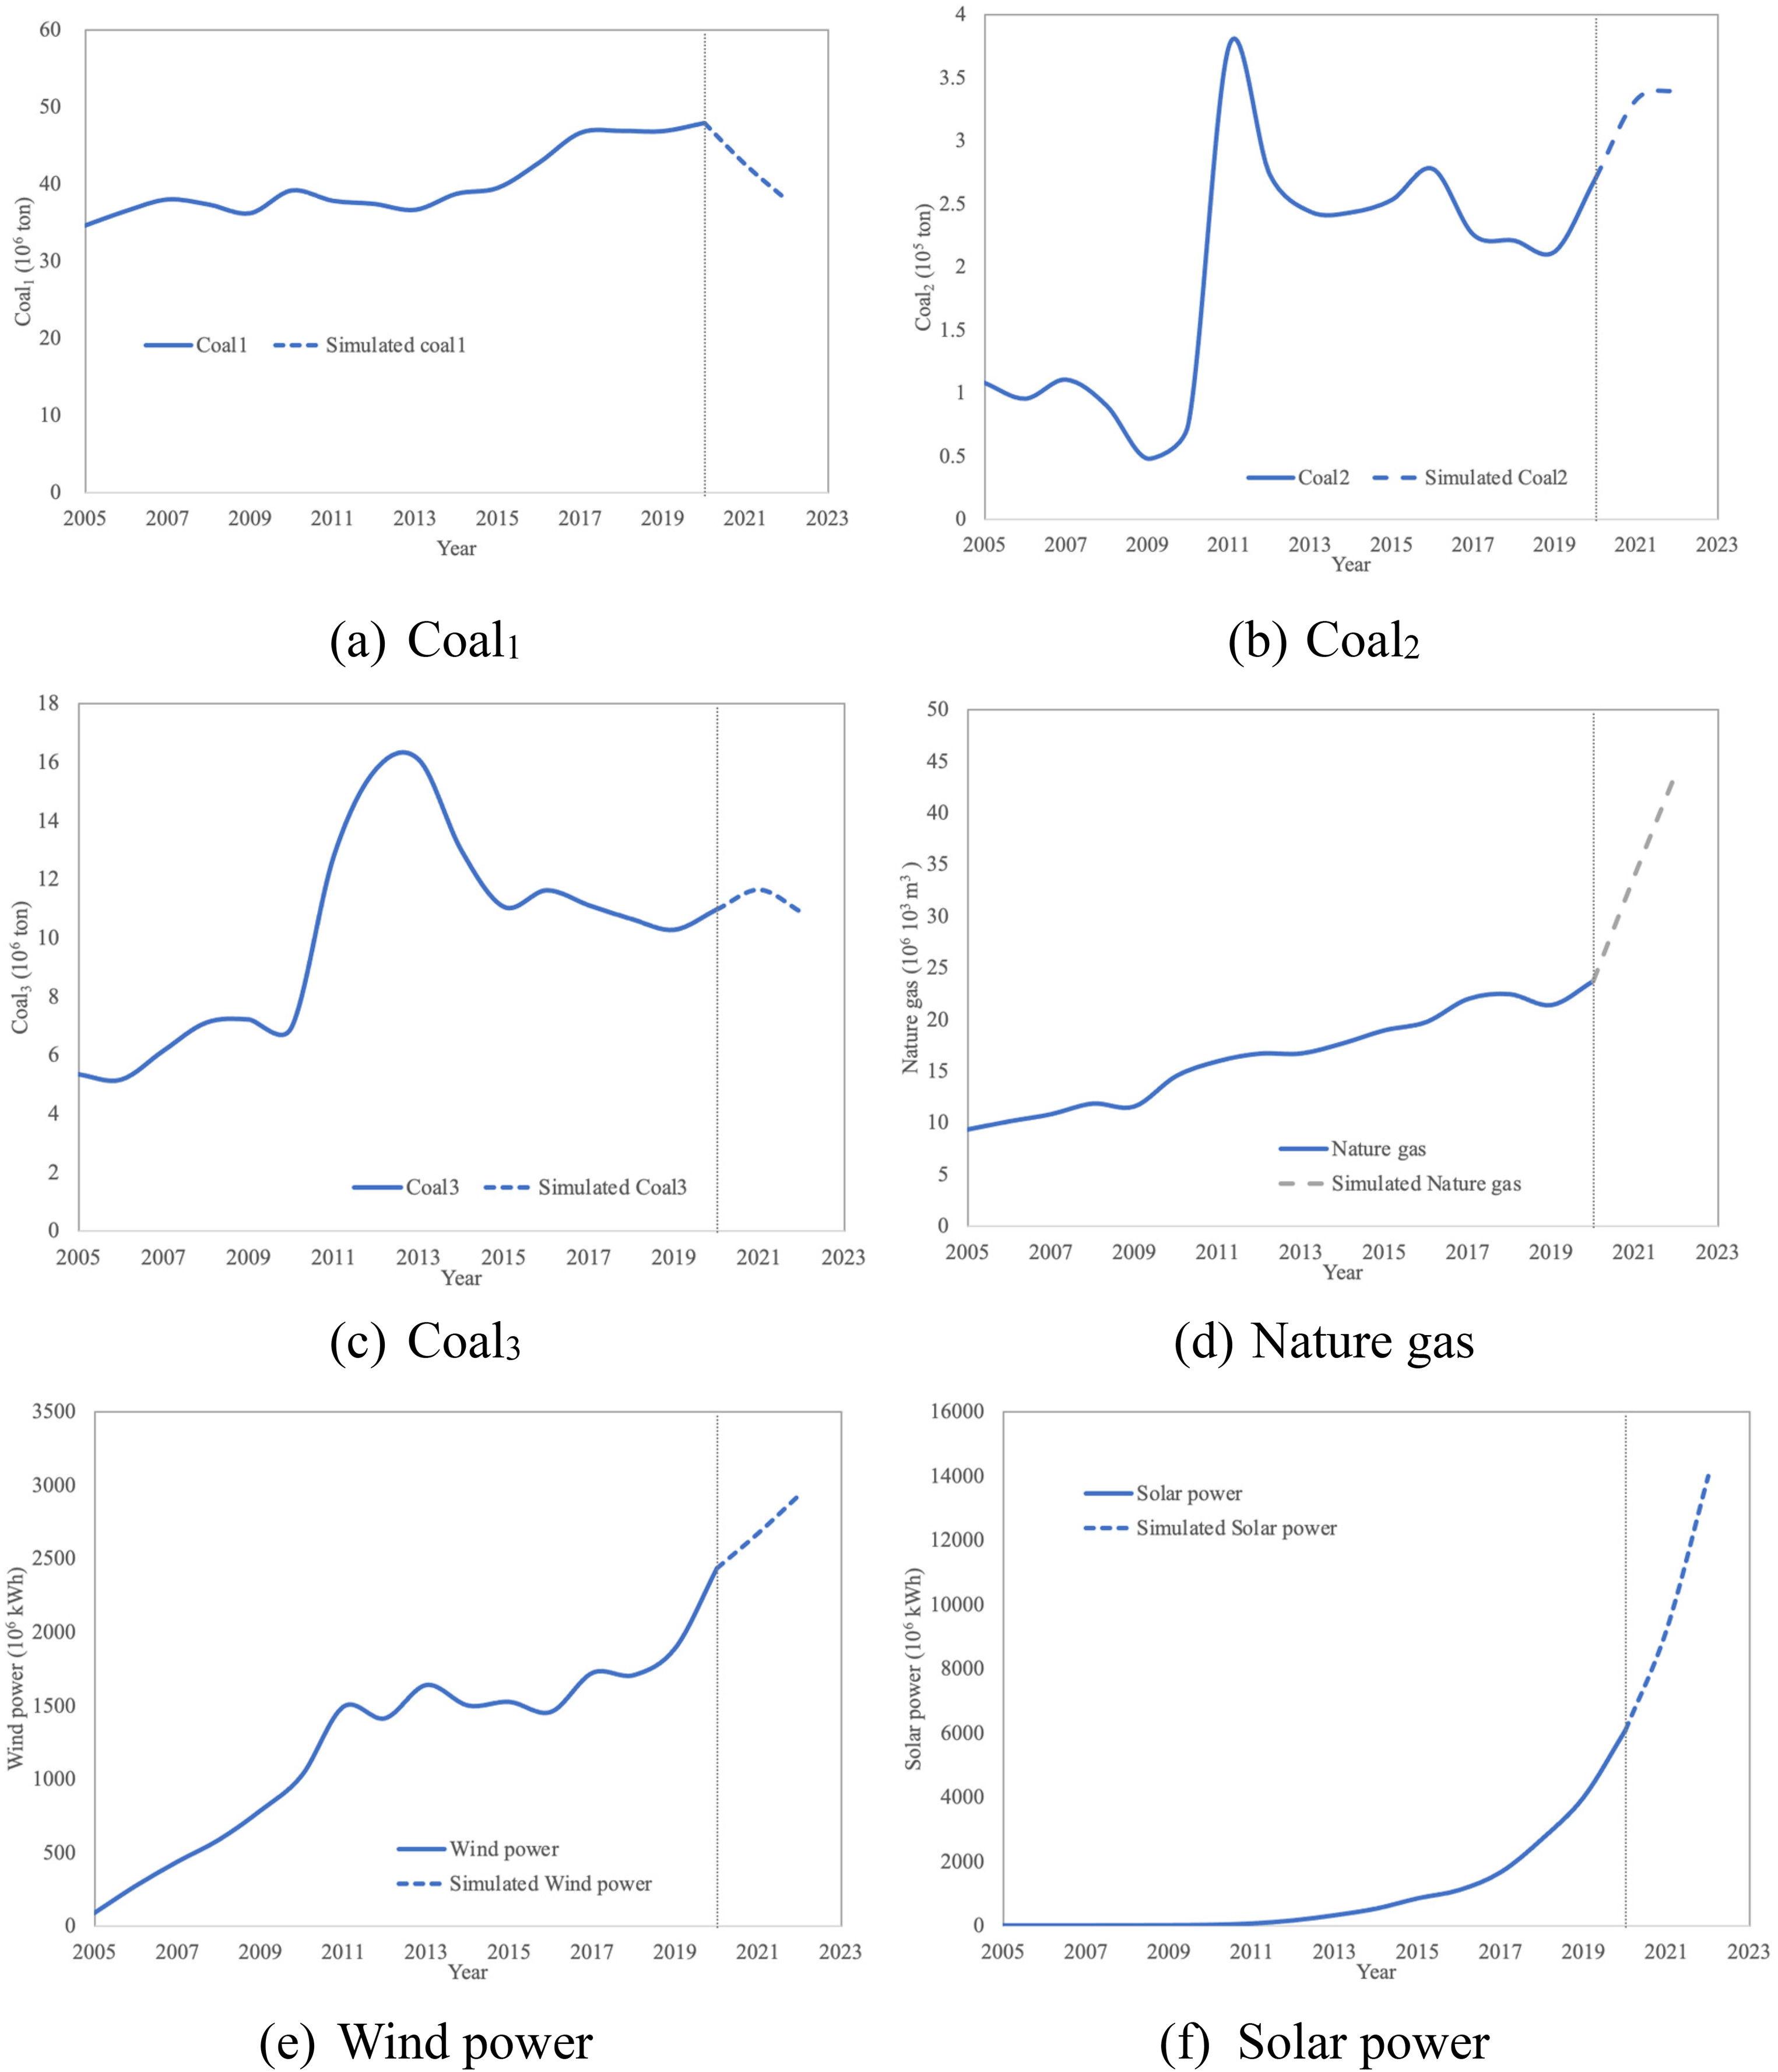
Figure 7 shows the simulation results for the carbon emissions after 2021. When the carbon emission decreased linearly based on the Taiwan policy, the demand of wind power and solar power will increase rapidly until 2024, natural gas increased linearly, and coal1 will decrease until 2030 (Figure 8). Coal2 will decrease during 2021–2025 and increase after 2025 when renewable power reaches the design power generation. Coal3 will decrease during 2021–2024 and become stable at 7000 tons after 2025.
Scenario 2: energy consumption grows linearly and carbon emission reduced to 20% of the value in 2005
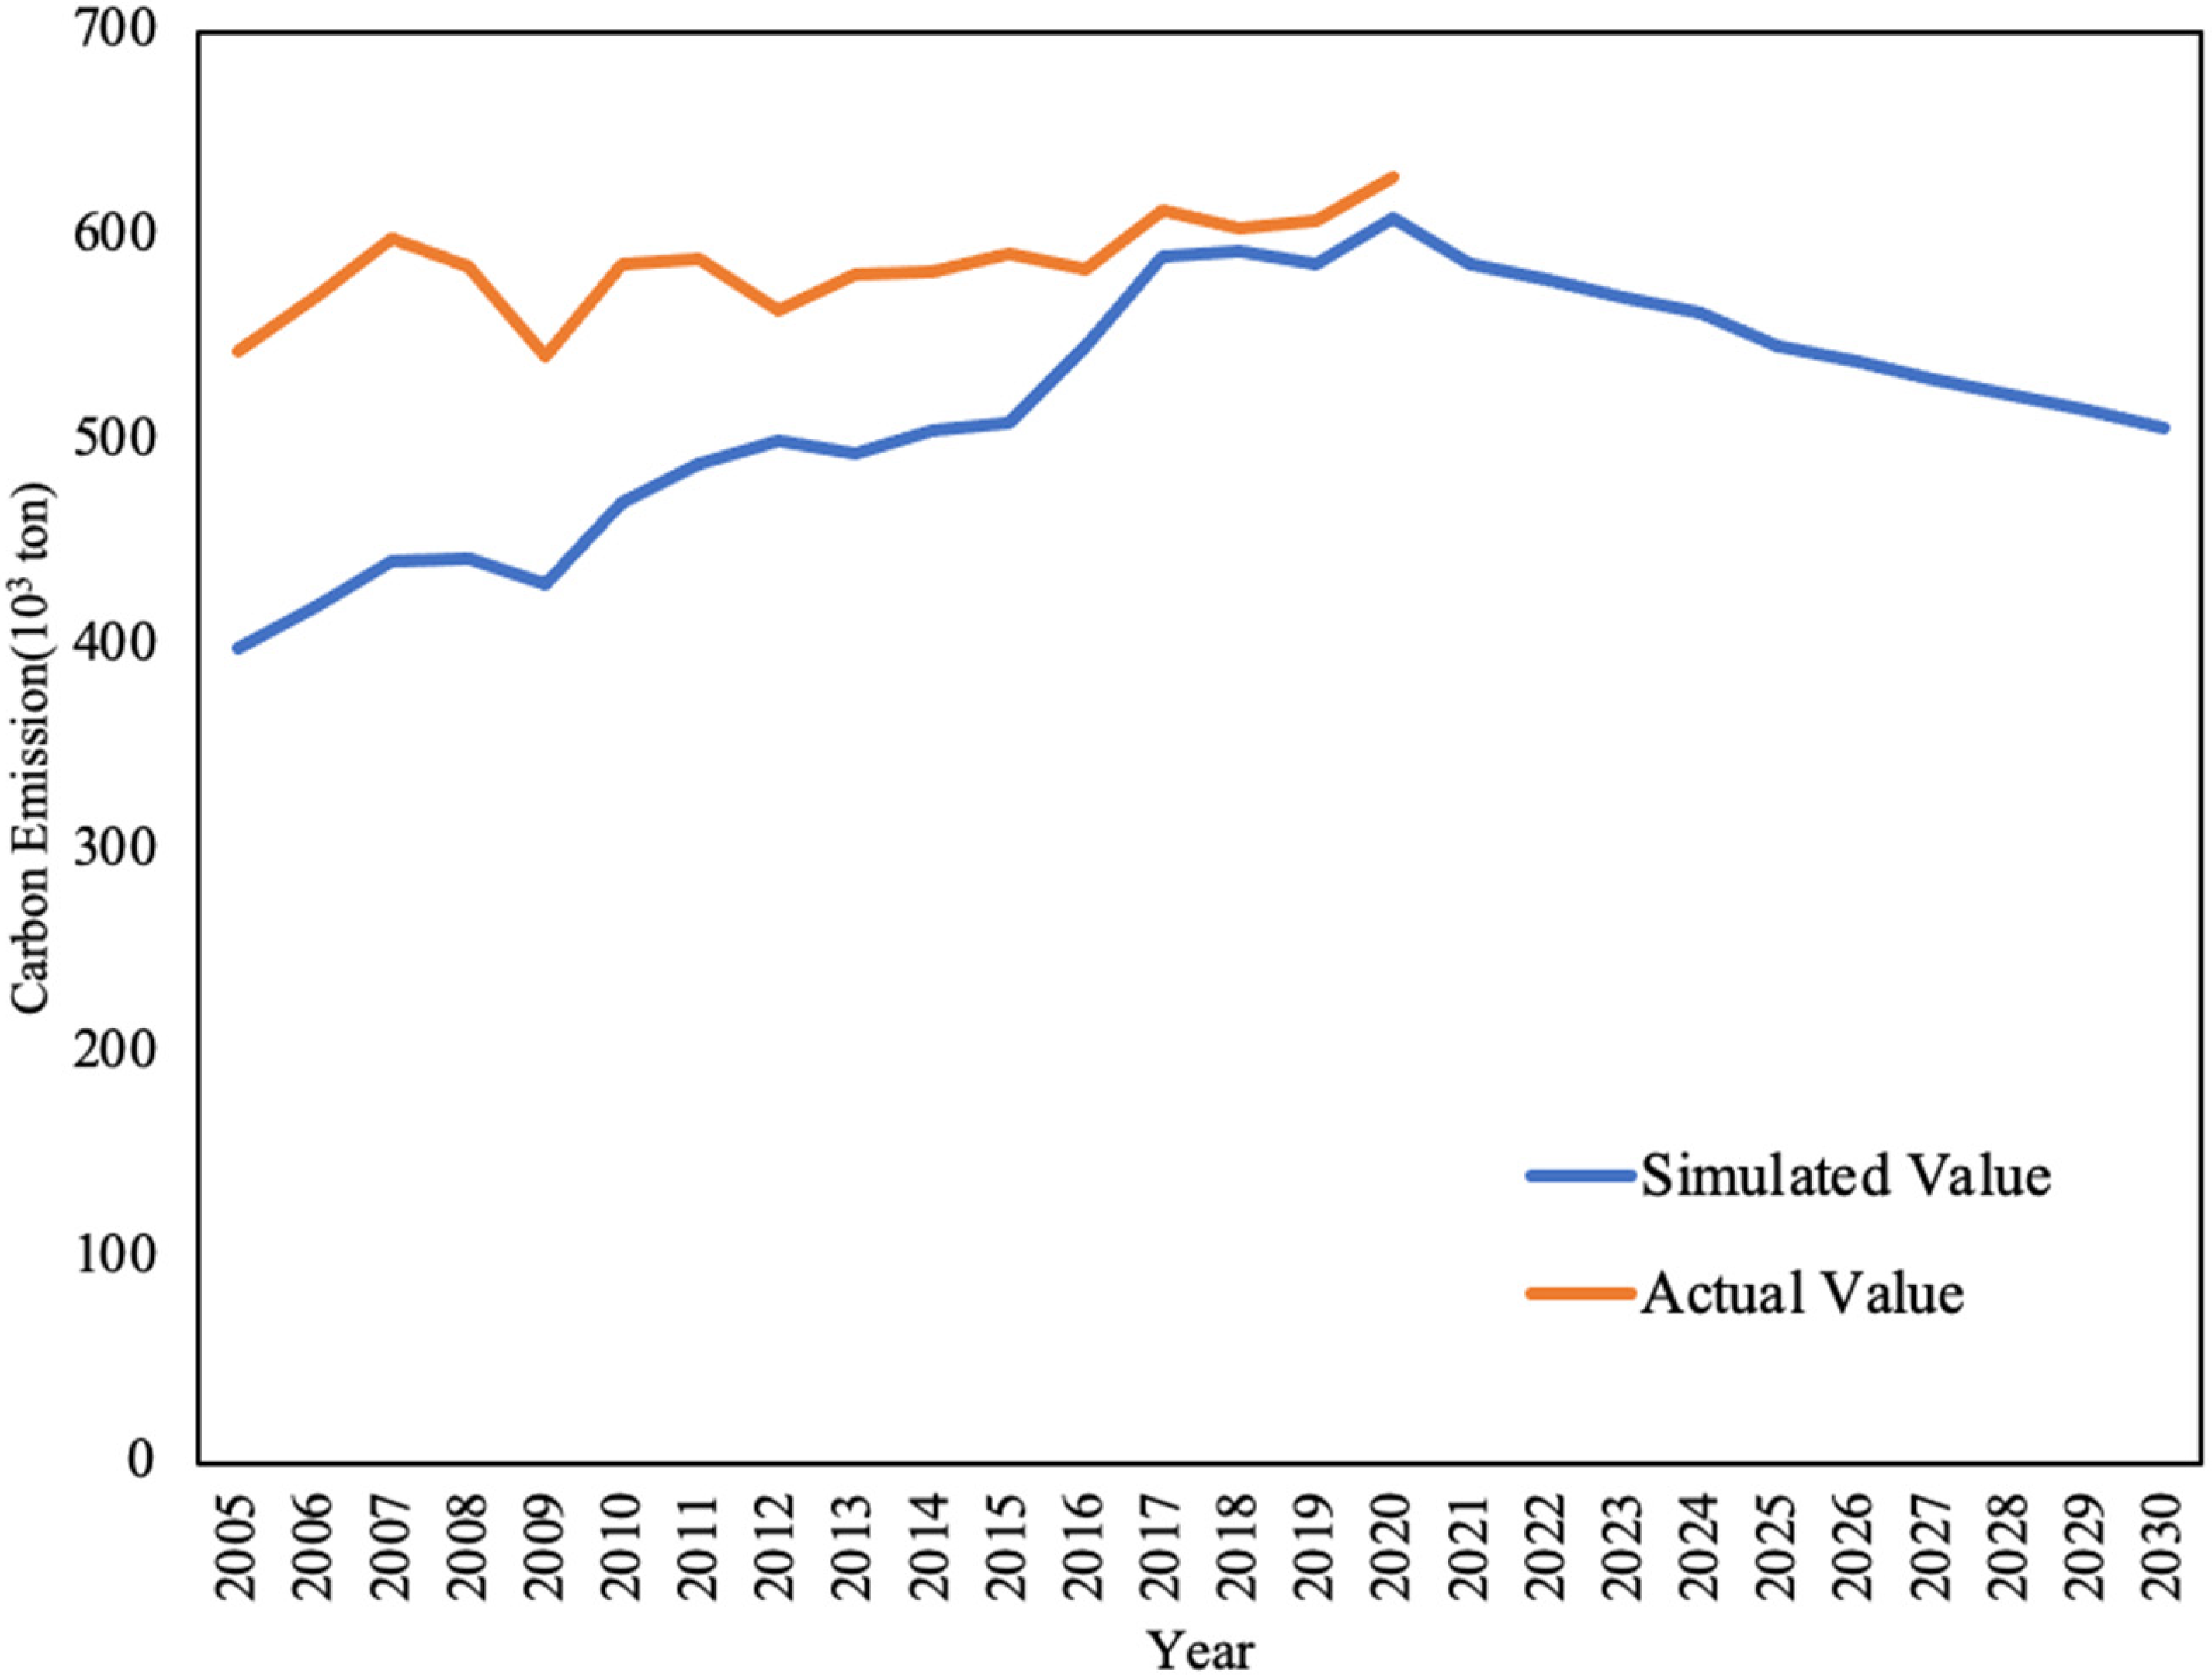
Carbon emission simulation by scenario 1.
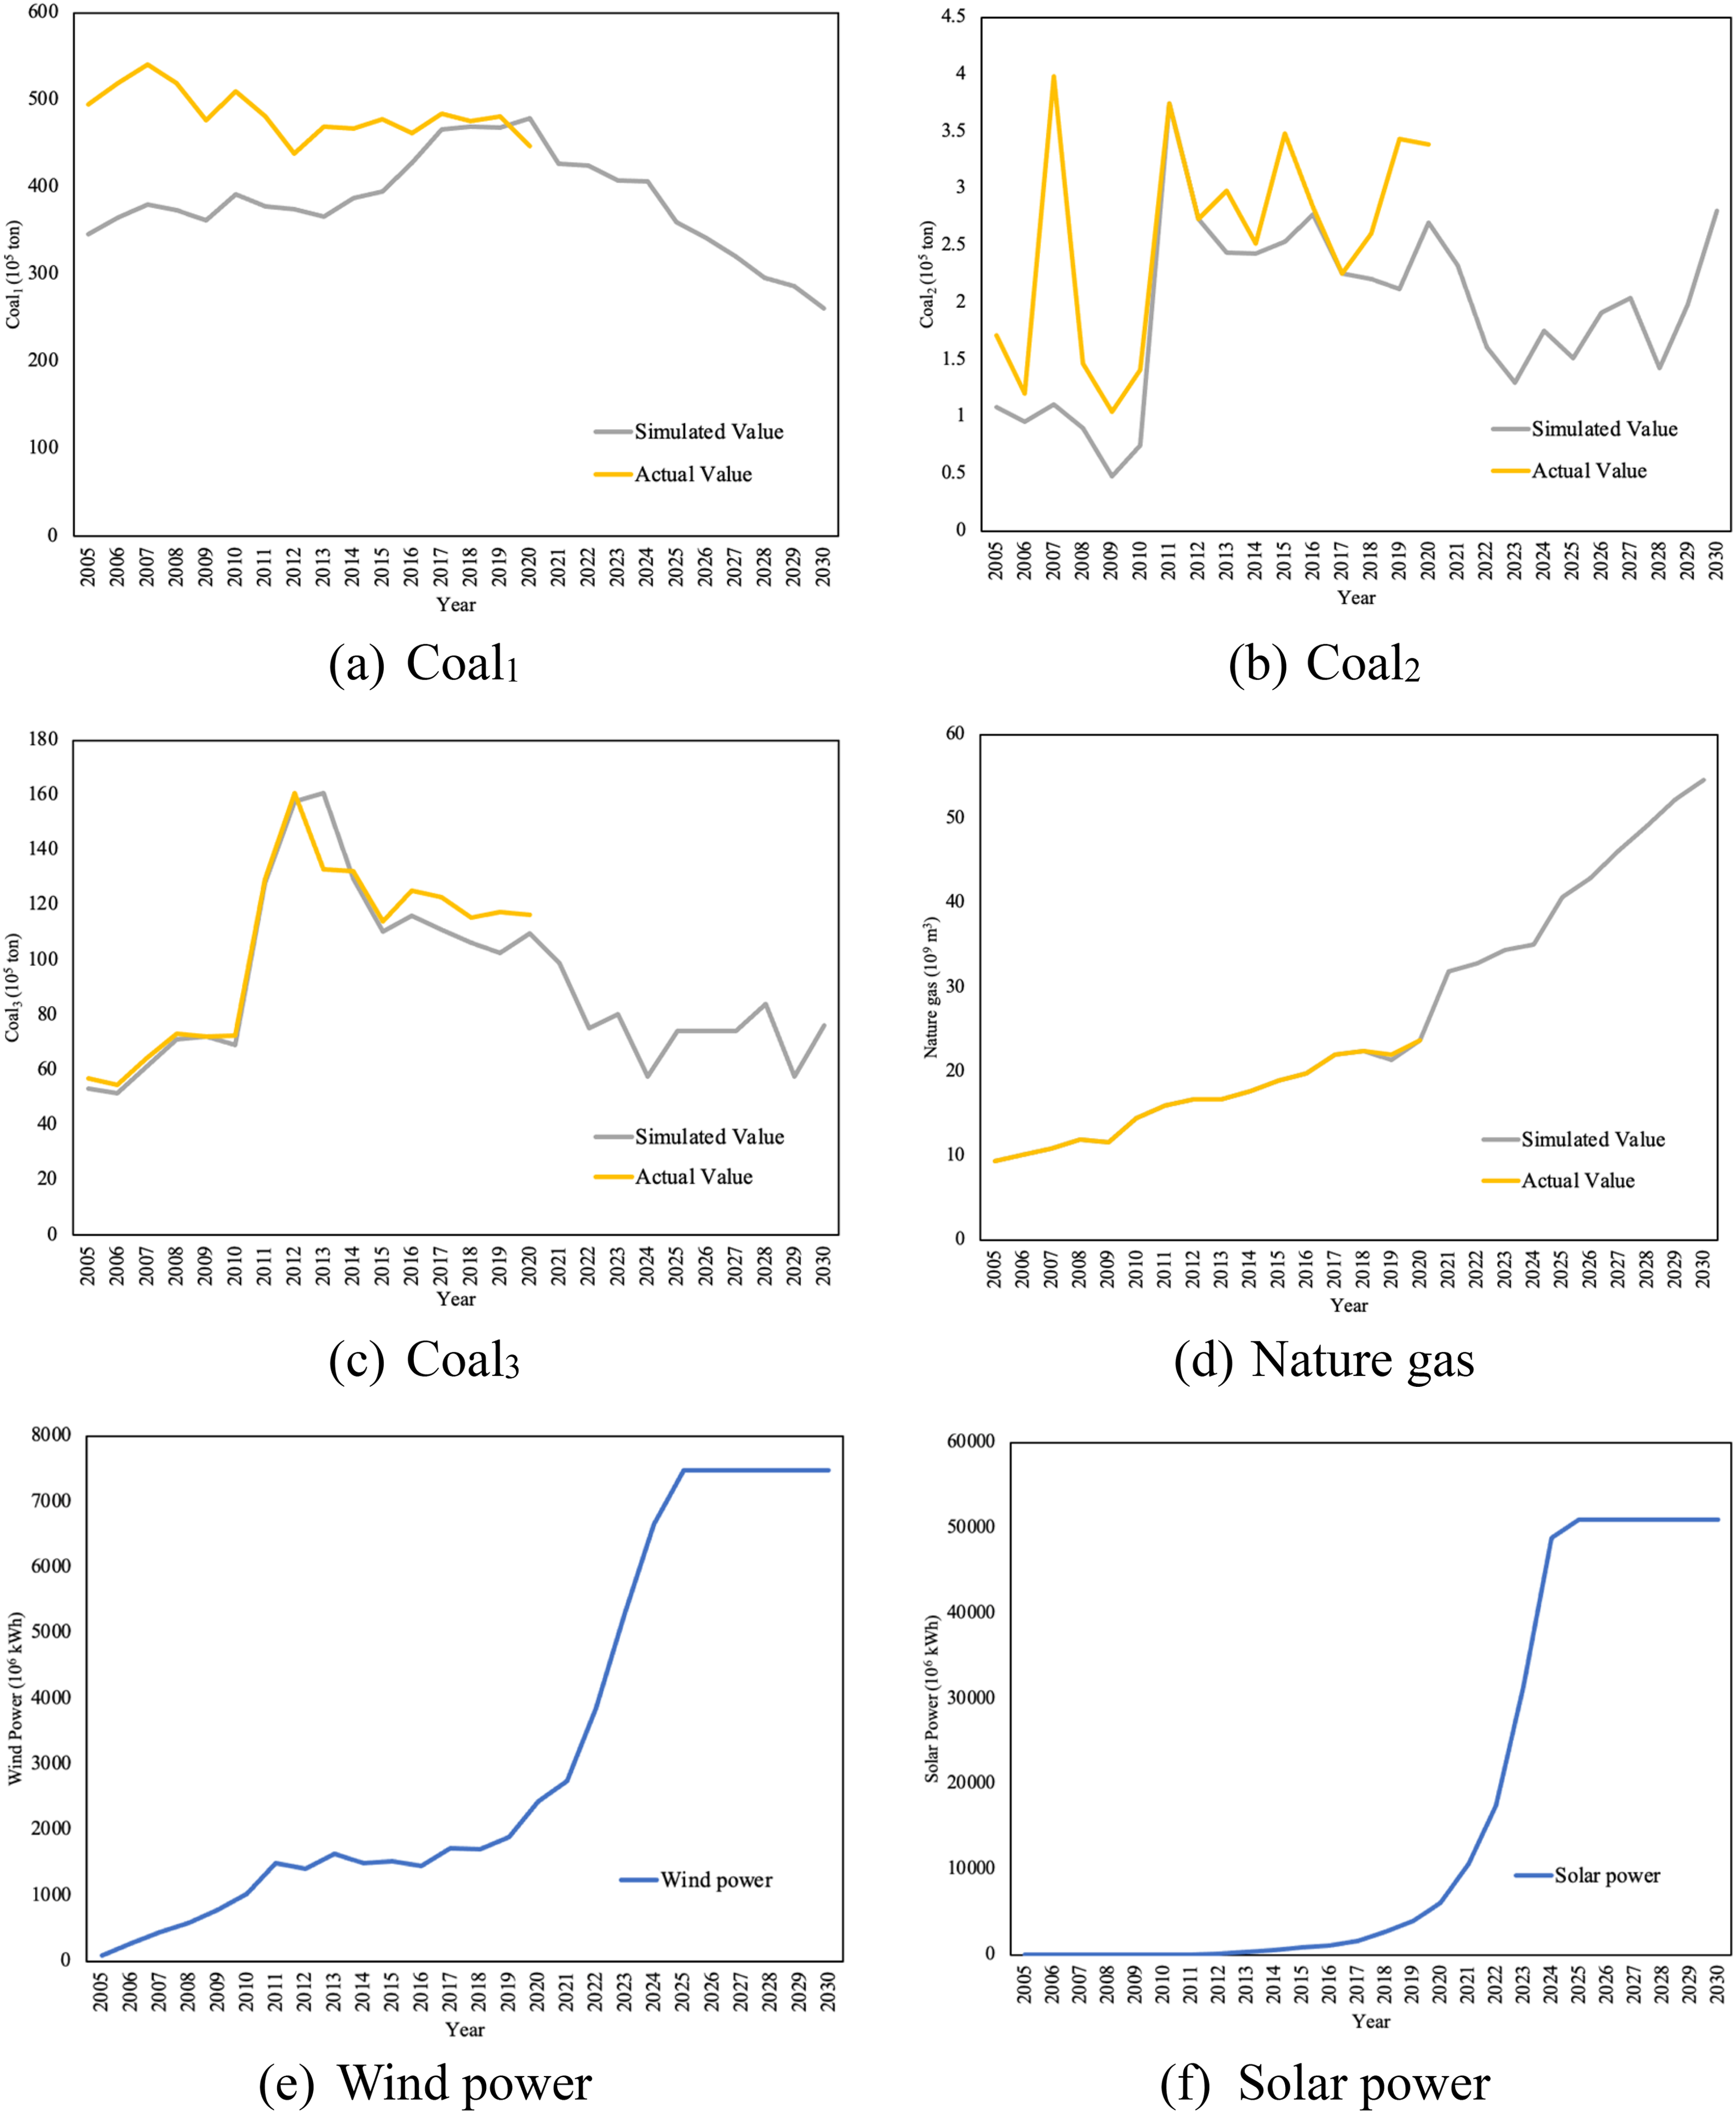
Consumption of each fossil fuels and renewable power by scenario 1. (a) Coal1, (b) Coal2, (c) Coal3, (d) Nature gas, (e) Wind power, (f) Solar power.
Figure 9 shows that the results of this scenario apply only to 2021 and 2022, where the power generation increased to 2000 billion kwh and carbon emissions reduced by 4% of the value in 2005. Thus, demand exceeded the supply and renewable energy reached the limit in that year. Figure 10 shows the consumption of each fossil fuel and wind and solar energy. When natural gas, wind power, and solar power reached the limit (Figure 10(d)–(f)), coal1 (Figure 10(a)) decreases linearly, coal2 increases to 350 thousand tons (Figure 10(b)), and coal3 reaches ∼10 million tons (Figure 10(c)).
Power generation and carbon emission simulation by scenario 2.
Consumption of each fossil fuels and renewable power by scenario 2. (a) Coal1, (b) Coal2, (c) Coal3, (d) Nature gas, (e) Wind power, (f) Solar power.
Based on scenario 1, this study points out that renewable energy generation must be increased rapidly when energy consumption is close to the value in 2020. However, Taiwan is a small island, and the Taiwanese government is concerned with land use and ecological issues.56,57 When renewable energy reaches its limit, we suggest the allocation of natural gas raise up to 54 million thousand m3, coal1, coal2, and coal3 are 26 million tons, 280 thousand tons, and 7.6 million tons, respectively. According to the results of scenario 2, energy consumption in Taiwan must increase linearly in the future, especially after COVID-19. The Taiwanese government should consider ways to increase energy consumption and reduce carbon emissions.
Taking both scenarios into account, it can be inferred that the renewable energy measures currently planned and implemented in Taiwan may not be sufficient to completely replace traditional energy sources. These measures may only slow down or reduce the use of traditional energy sources. Therefore, achieving net-zero carbon emissions in Taiwan by 2050 would require more comprehensive strategies and measures to promote renewable energy development and utilization while also reducing the reliance on traditional energy sources.
Conclusion
This study proposes a strategy to plan and reduce GHGs emissions and energy consumption supply and demand in Taiwan under climate change policy. Taiwan's current policy promotes solar and wind energy as renewable energy sources, with natural gas as a secondary energy source. However, these sources are not enough to meet Taiwan's electricity demand, and traditional energy such as coal-fired and nuclear energy continue to generate electricity. As a result, Taiwan's overall carbon emissions remain at around 600 million tons. While maintaining the current level of renewable energy installations, carbon emissions in 2030 can be reduced to between 500 and 600 million tons. Considering both scenarios, it appears that Taiwan's planned renewable energy measures may not be sufficient to replace its existing traditional energy sources, but rather can only reduce or slow down power usage. Finally, this result can provide Taiwan’s government with energy policy considerations to achieve its net-zero carbon emissions goal by 2050.
Footnotes
Acknowledgments
This paper is supported in part by the Ministry of Science and Technology, Taiwan under grant MOST 111-2636-E-011-004.
Declaration of conflicting interests
The author(s) declared no potential conflicts of interest with respect to the research, authorship, and/or publication of this article.
Funding
The author(s) disclosed receipt of the following financial support for the research, authorship, and/or publication of this article: This work was supported by the Ministry of Science and Technology, Taiwan (grant number MOST 111-2636-E-011-004).