
Abstract
This article proposes a hybrid method to design and manage the electronic vehicle payment station network in the event of power demand uncertainty. The proposed method is an integrated process with confusing virtual-anticipation and chemical reaction enhancement, hence named as chaotic quasi-oppositional chemical reaction optimization (CQOCRO) method. The key objective of the CQOCRO method is to develop a reliable model to assist in the design and management of an EVCS location, power supply line hazard and power demand entropy. The CQOCRO method creates a random nonlinear model of disruption that includes equivalent tactical outcomes and operational outcomes for designing and managing a stable EVCS network in the event of power demand uncertainty. Because of the extreme electricity flow, the power line is overheated which is handled by the proposed method. The proposed method addresses the possibility that excessive current flow-related line overheating could result in power line failure. The design of EVCS is based on the factors like type of power supply network, location and opening hours of charging stations, limited resources, potential for power supply line failure due to high load, and uncertainty of power demand. Accordingly, the performance of the CQOCRO method is done in MATLAB platform and the performance utilizes the existing techniques.
Keywords
Introduction
Currently, electric vehicles (EVs) are attracting more and more attention as there is a growing concern about climate change, emissions, and reliance on fossil fuels. 1 In the recent year, the sales of EVs are increased in other countries, like US and governments also develop new policies to buy the EVs vehicles. 2 Hence, due to the growth of the EV market, there is a vital requirement for a reliable e-transport system that is competent for handling enormous loads.3,4 The power grid opportunities, as well as challenges are obtained from the large EV penetration.5,6 The operation of EVs based on electricity instead of petrol provides the change of energy needs from gas pipes to the utility grid. 7 For example, existing electrical network systems are affected by the high intrusion of EVs.8,9
When the penetration of EVs is increased means then the power demand is also increased from 17.9% to 35.8% as revealed by a recent report. 10 When the flow of power is high then the distribution line is overheating which leads to failure of the distribution line. 11 Accordingly, when the charging of a large number of EVs is not managed, then it can affect the utility grid considerably. This factor compels the vital requirement to hold the large-scale use of EVs, effective design, and management of EV charge stations to achieve an efficient phase process with genuine environmental protection. 12 If replace the internal-combustion engine vehicles to EVs then the electricity demand to the grid is increase. If there will be more EVs on the market, they can be charged at different times of the day, thus adding more loads to the utility grid. 13 Therefore the power grid distribution line can be affected by overheating. 14 Therefore, the management and expansion of the charging station are critical to the extreme load that can cause severe disruptions in the power grid system. 15
Hence, to overcome these problems, power generation companies necessitate to improve power supply systems, enhance capabilities and integrate other energy sources (e.g. renewable energy sources [RES], vehicle to grid [V2G]), establishing active category-wise assessment options will encourage higher fees and thus increase nonexistent rising loads.16,17 Integrating RES utilize V2G is a viable option when planning optimal charging schedules for EVs to reduce the excessive load on the grid. 18 There are various research works are focused on the charging scheduling of EVs and the integration of renewable energy utilizing V2G sources. 19 The key objectives of this work are to recognize the optimal integration of sources operating in a satisfactory setting, while minimizing cost and electrical construction losses. 20 One of the models is the stochastic optimization model, which is used to determine EV charging techniques based on instantaneous charging, high load output, and access to renewable energy. 21
Electrified shared mobility services must manage their daily charging operations and plan their charging infrastructure to reduce overall charging operation time and cost. Existing research, however, frequently treats these issues independently. This paper proposes a mixed-integer linear programming formulation for the flow refueling location problem (FRLM). The authors also show how this model can be applied to a situation where the driving range changes throughout a trip. Although these extensions are useful, the authors only focus on charging station expansion choices and give little or no consideration to the management of the additional charging stations. However, in order to aid in the development of this long-term sustainable transportation system, both short- and long-term charging station decisions must be optimized concurrently. In order to solve small- to medium-sized problems, the scenario decomposition algorithm (SDA) demonstrates high computational capability. For large-scale problems, SDA cannot produce quality solutions.
Contribution and novelty
The contribution of this work is that it proposes a hybrid method to designing and managing the electronic vehicle payment station network in the event of power demand uncertainty.
The proposed method is an integrated process with confusing virtual-anticipation and chemical reaction enhancement, hence named as chaotic quasi-oppositional chemical reaction optimization (CQOCRO) method.
The key objective of the CQOCRO method is to lessen the electricity cost and maximizing the utilization of charging stations.
The CQOCRO method creates a random nonlinear model of disruption that includes equivalent tactical outcomes and operational outcomes for designing and managing a stable EVCS network in the event of power demand uncertainty.
Accordingly, the performance of the CQOCRO method is done in MATLAB platform and the performance utilizes the existing techniques.
The novelty of this work is that it proposes an optimization method for designing and managing an EV charging station network in the event of power demand uncertainty. The method uses a technique called CQOCRO to improve the design and management of EV charging stations. This method aims to improve the efficiency and effectiveness of EV charging stations.
The remaining article is depicted below: next section illuminates recent research work. The next section illuminates the configuration of the planning and management of EVCS with the proposed CQOCRO method. The next section describes the design and manage electric vehicle charging stations using CQOCRO method. The next section describes the results and discussion. The last section concludes this article.
Recent research works: a brief review
Various research works based on the expansion of the EV charging station using various techniques and features were previously existed in the literature. Some of them were reviewed here.
Xia et al. 22 have suggested a dynamic wireless charging system (DWCS) of EVs to define the locations as well as meet the demand of EVCS. The purpose of the introduced method was to increase the economic effects of wireless charging. The traffic assignment issues were solved by Nesterov's model, which was incorporated with many traffic patterns of the traffic network (TN). The distribution of road traffic density was analyzed by the traffic wave theory. In the distribution network, the effect of EV connection systems on the price of power line expansion was taken into account. Kim and Hur 23 have suggested the EV charging decentralization algorithm to decrease the congestion of the system and the analysis of power based on the demand for EV charging. The introduced model was considered the prediction of wind power by the ARIMAX model. Through the charging frequency weight of seasons and time was utilized to perform the random sampling. The evaluation of the measurement of data was utilized to predict the EV charge requirement. Rani and Mishra 24 have illustrated the Fermatean fuzzy system for the issue of selection of EVCS location. The introduced method was the multiple-objective optimizing method depending on the analysis of ratio including the full multiplicative form (MULTIMOORA) method; maximize deviation method along Einstein aggregation operators in a Fermatean fuzzy environment. By the maximizing deviation method the standards weights were calculated. Einstein operations for FFS were utilized to collective the decision information. Pal et al. 25 have elucidated differential evolution (DE) and Harris Hawks optimization (HHO) method for EVCS location planning operation. Based on the demand of charging, the weights were given the places like supermarket, road connections, houses, etc. The major purpose of the introduced method was cost reduction, reduction of voltage deviation, reduction of land cost, serve EVs with less cost. The EVCS development was done by the classification of the area into three different zones. The 2 m point estimation method (2 m PEM) was utilized to solve the uncertainties of EV issues.
Mishra et al. 26 have suggested the solitary-valued neutrosophic information-based additive ratio assessment (ARAS) method for the analysis of EV charging station location. A single-valued subjective and objective-weighted integrated method was established to determine the criteria through collective objective weights. Feng et al. 27 have elucidated the integrating multiple-criteria decision-making (MCDM) method was established by the linguistic entropy weight (LEW) method and fuzzy axiomatic design (FAD) for EVCS location planning operation. A pane of five procedural, financial, communal, and environmental as well as city planning specialists presented results from the criteria performance along with weights of the various alternatives. The LEW method was utilized to calculate the weights of the criteria. The FAD method was utilized to determine the appropriate location of EVCS. The optimal EVCS location was determined by the integrated LEW–FAD method. Fokui et al. 28 have illustrated a hybrid bacterial foraging optimizing method as well as particle swarm optimization (BFOA-PSO) method for the placement of EV charging station into the distribution network. The introduced method utilized the source as rooftop PV. The major purpose of introduced method was a reduction of losses of reactive power, and deviation of voltage, and improves the voltage stability index.
Zhou et al. 29 have analyzed the growth of new energy science and as a result, EVs have gained worldwide recognition and have become increasingly popular in a number of nations. A number of issues, including a lack of charging stations, an uneven distribution, and high costs, have been brought on by the rapid growth of EVs, and these issues continue to grow more serious. The introduced method uses Ireland as a case study for its research in order to address the aforementioned issues. It attempts to develop a social net cost model first, and then figures out the net operating cost of charging stations according to various distribution scenarios. These models separated the net social cost into two categories: overall environmental cost and economic cost. The economic costs of construction include fees and construction costs, while the environmental costs include carbon dioxide emissions and electricity consumption. However, the implementation of the genetic algorithm can be costly, challenging to comprehend, and challenging to optimize. According to Ye et al. 30 the widespread installation of EV charging stations were required due to the rapid adoption of EVs. The demand for intelligent controllers, which provide charging and electric grid services, was high in order to increase the profitability of charging stations. Due to the unpredictable arrival time and the charging requirements of EVs, it was difficult to decide on the best charging schedule. According to Lee and Kim's 31 investigation from 2022, distribution system operators (DSOs) struggle to schedule distributed energy resources due to rising power demand and the penetration of renewable energy. The aim was to estimate photovoltaic energy-integrated energy storage system (PV-ESS) charging/discharging rates, EV charging costs, and demand response (DR) incentive values taking voltage management into account. The presented study introduces an evolutionary game theory (EGT)-based new scheduling strategy that takes voltage management for a multi-agent system (MAS) into account in order to achieve the best energy operation for a distribution network. To lower the system's operating costs, the agents collaborated to find the best scheduling by using its individual behavioral pattern functions and the EGT as a decision-making tool. The scheduling of charging and discharging, planning of EV charging, and participation in demand response are all tasks that can be performed by photovoltaic energy storage systems, EV charging power, and loads, respectively. However, one of the most fundamental restrictions of game theory was that each participant had to be aware of the cost functions of the others.
Background of the research work
The assessment of the recent research work displays that the expansion of EV charging stations is more challenging. When the flow of power is high, then the distribution line is overheating may leads to failure of the distribution line. Accordingly, when the charging of a large number of EVs is not managed, then it can affect the utility grid considerably. This factor is a key requirement for maintaining large-scale use of EVs and effective designing and managing of EV charging stations to achieve an efficient grid process with real environmental protection. While these extensions are in effect, the authors focus only on the decisions to expand the charging station and have little respect for how to achieve them. However, the development of this upcoming maintainable transport system is achieved by simultaneously improving the location of the charging station with the management of the charging station. In addition, current studies do not focus on the reliability of the power network. Furthermore, however, no continuous experiment has been explored on how to make the power grid more uniform to withstand the planned demand load generated by the growth in acceptance of EVs. Therefore, an optimal solution is required. These shortcomings were the motivation for doing this research work.
Configuration of the planning and management of EVCS with proposed CQOCRO method
In this article, a hybrid CQOCRO method is proposed to prevent disturbance to design and manage EVCS, taking into account the planned and operational effects below random power demand. The proposed method is utilized to plan the reliable EVCS as well as solve the issues based on the handling of uncertain power demand. Because of the extreme flow of power, the failure of the power line and regardless of this effect, interdependent network performance. 32 The proposed method is also analyzed based on the road network that provides information about the management of EV cost of the total system and the design of an optimal system. The key objective of the proposed method is to develop a reliable model that facilitates the design and administration of EVCS, while considering the power supply disruption and demand uncertainty. Based on factors, like type, location, and opening time of the CS and the low resources, the potential for power supply line failure owing to high load and random power demand, the proposed method designs the power supply network.
The major challenge is to place the CS in a reliable manner for the consideration of power demand inconsistency as well as power supply disruption. To achieve this objective, the transportation network is segregated into cells and the possible locations are present inside the cell. 33 Assume that there are two varieties of CS, such as CS with the power grid, RES, V2G, CS with swappable batteries, and power grid, RES, V2G. Consider the requirement of CS is fulfilled by three sources, such as general power generators, PV power, and V2G connection. The location of power generators is power stations and they transmit electricity by power grids. When power is supplied to a CS automatically, that is, the power supplied by RES, power generators, and V2G is not enough to meet the power requirement of the CS, the network is penalized for unsatisfactory requests due to power shortage and/or introducing power as of external network. Figure 1 shows that the configuration of management of EVCS with the proposed CQOCRO method.
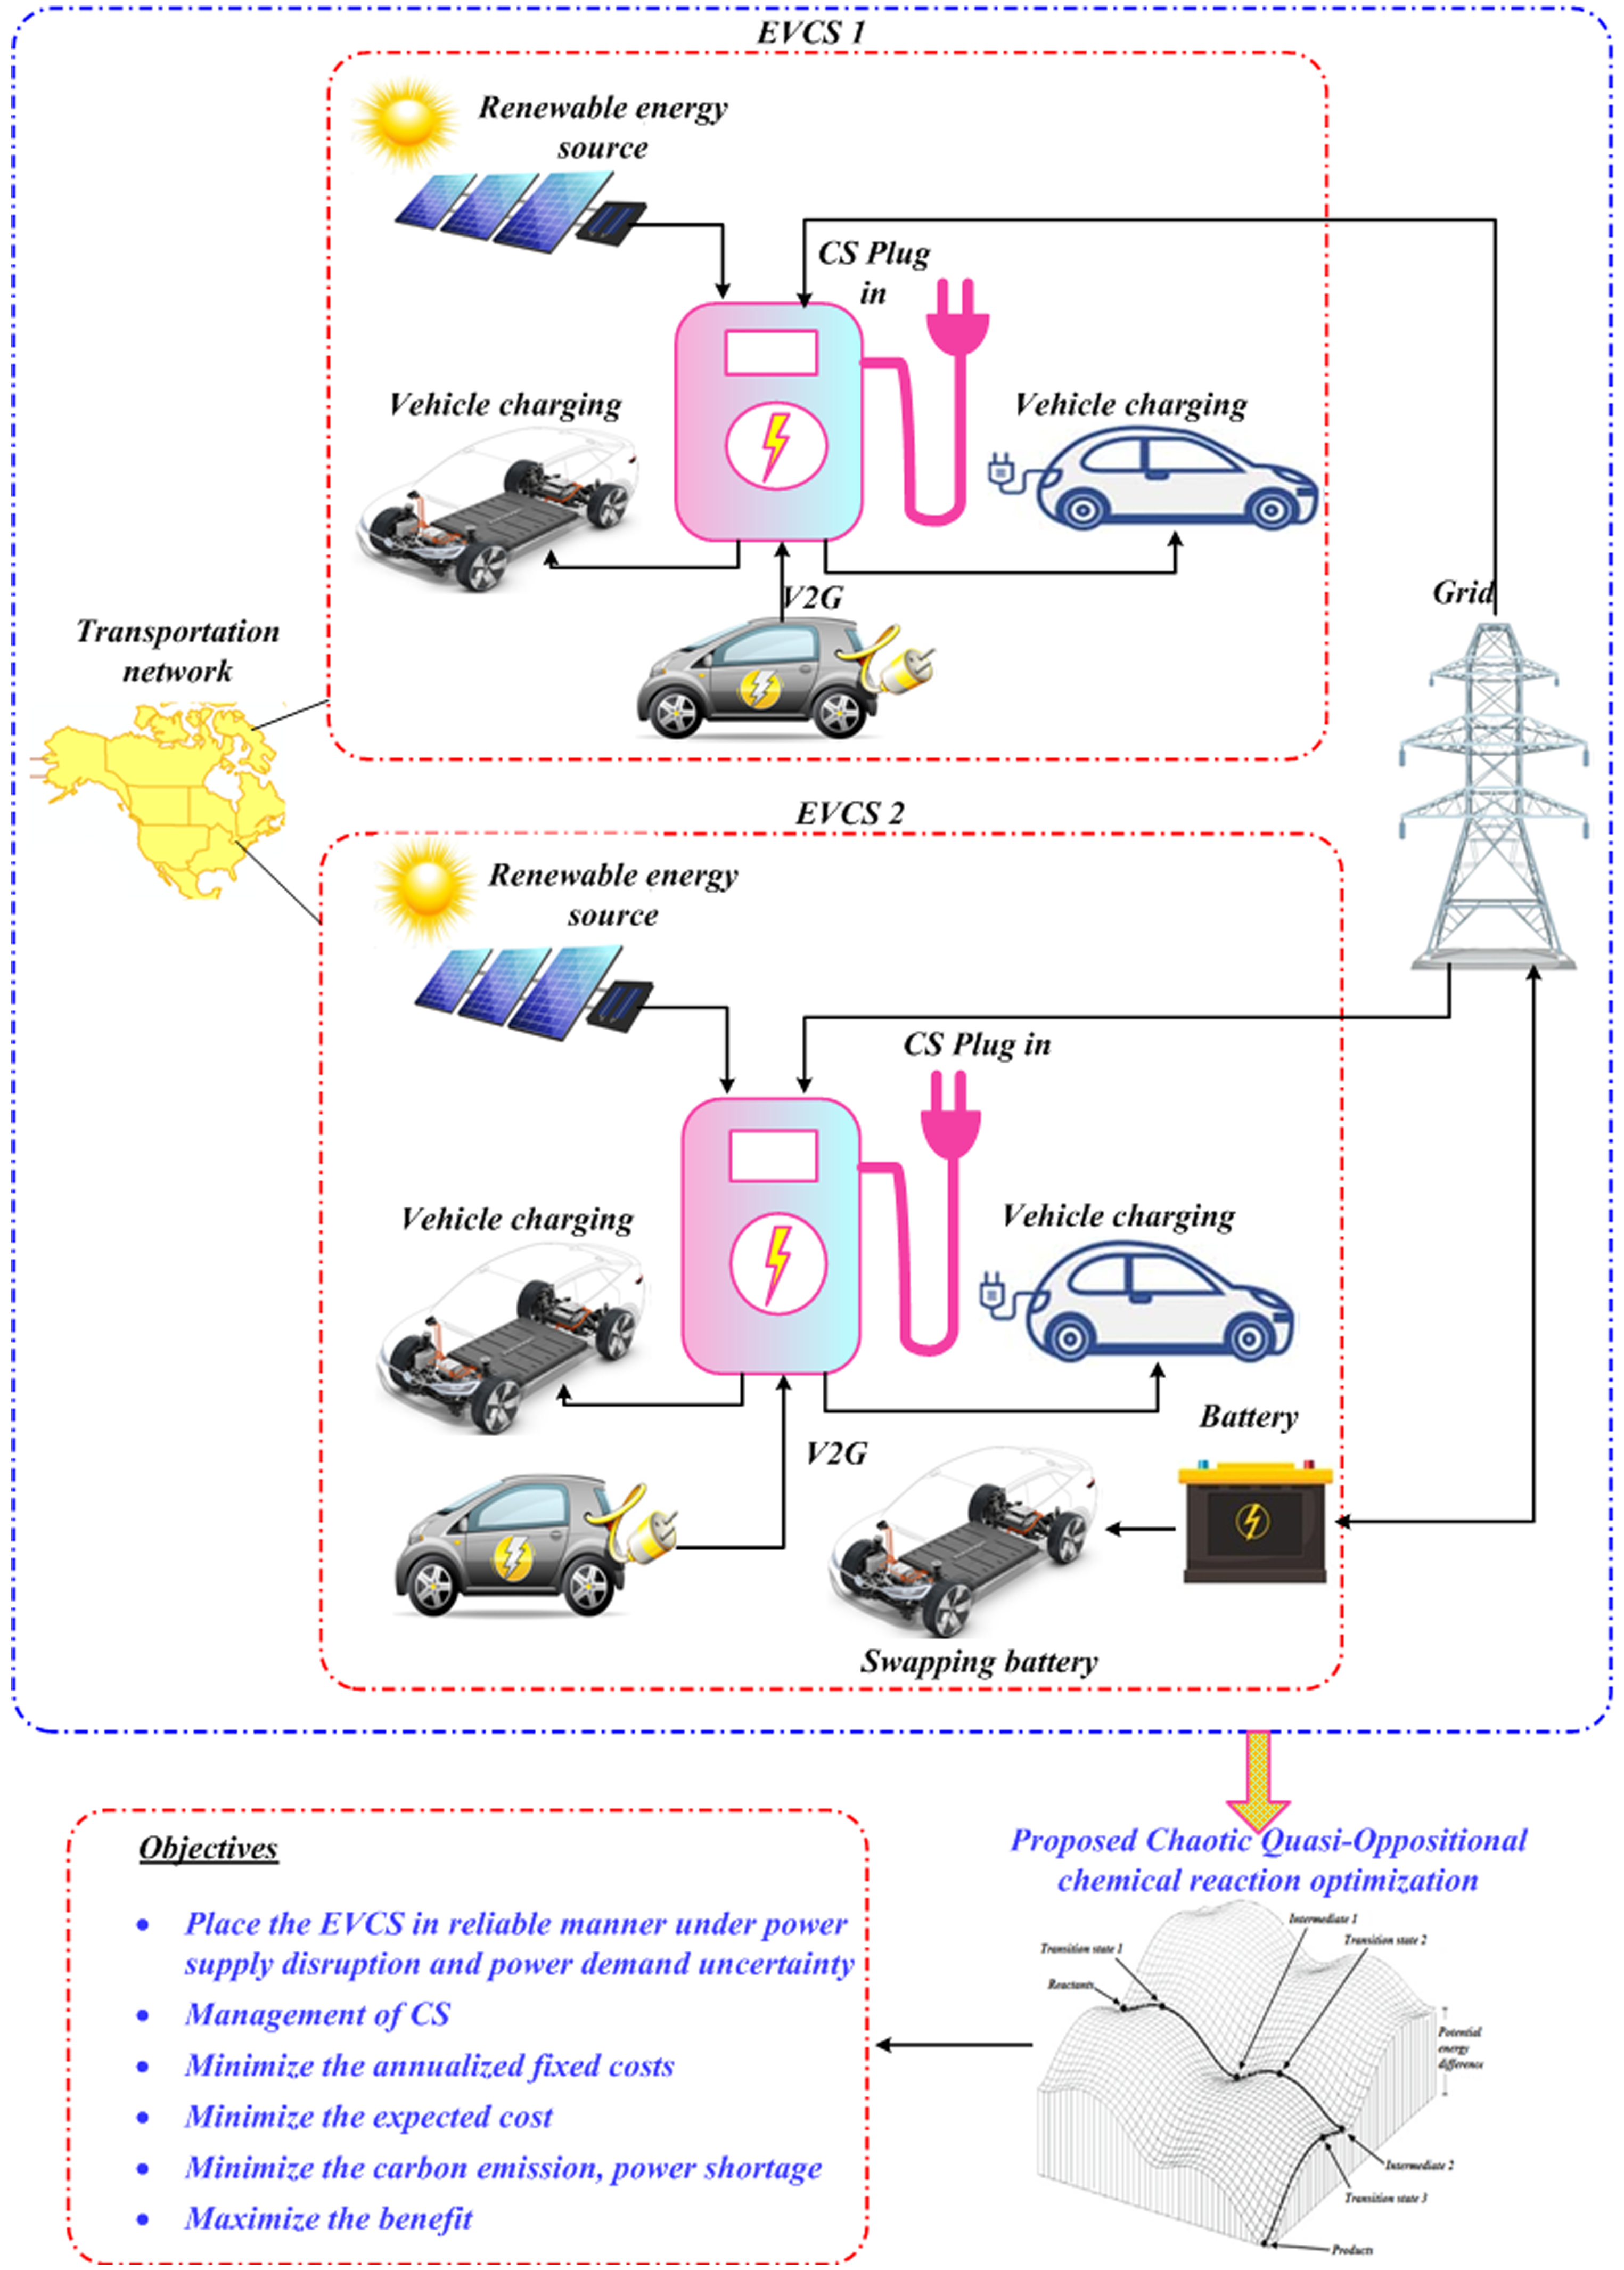
Configuration of management of EVCS with proposed CQOCRO method.
Due to the uncertainty of the sources, it is also difficult for a small-scale network. Consider the power demand as a random variable. Based on that, a set of scenarios is determined. The number of EVs is traveled to every cell and the requirement of charging under every scenario is utilized to determine the demand power. The calculation of the V2G electricity is obtained from the required discharge power of EVs percentage in every time and scenario. The cost of electricity is different for various periods of time, so the cost is calculated by the usage of electricity with a certain unit cost.
Supply lines overheat when high currents are applied, resulting in supply line failures. The temperature of the line is observed in order to reduce this result. Before determining the disaster of a supply line, the power run load is greater than the capacity of the line. These all problems are used to reduce the decision of location and decision of hourly management, which is incorporated into the number of charging, discharging, exchanging, and storing batteries, V2G amount, renewable, and power grid procedure decisions, amount of EV car traffic is increasing over time, opened EVCS also depend on the RES, consider all the EV chargers are fast charging DC chargers, hence less time is needed to satisfy the demand, EVCS is integrated with V2G mode, which is used to promote EV owners. The batteries are considered to be swappable or recharged batteries at any EVCS.
Modelling of photovoltaic systems
The maximum power output for the PV module is obtained depending on the ambient temperature and the solar radiation.
34
The photovoltaic power is described below,


Modelling of prevention of distribution line failure
For preventing distribution line failure, Ren et al.
35
here introduce the decisions and control. Commonly, the line of distribution is thin and constant temperature is flow through that. Let, area in cross sectional is denoted as


The surface line temperature is expressed as,

here constant parameter is denoted as
The above equation describes that the temperature of line is indirectly depend on the velocity of air.


Objective formulation
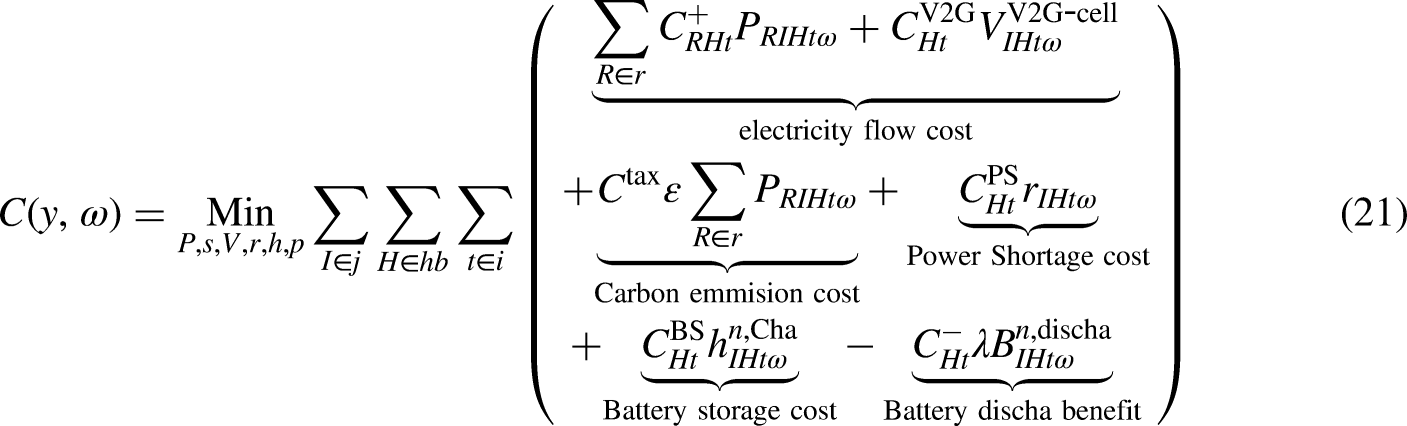
The objective function of the system is cost reduction that is described in two terms, that is, utilizing CS first in a specific area, reduction of expected cost incorporated with the flow of power by the grid, V2G, carbon discharge, power shortage, battery storing choices.

Constraints
Constraints based on the minimization annualized fixed costs
Guaranteeing that Constraints based on the minimization of expected cost
In a certain period, CS opening is fulfill the minimum power demand is described as,


The power shortage is must be compensated by guaranteeing the demand of electricity for every CS must fulfilled by RES, completely charging batteries, PG, V2G, and/or an exterior resources and is described as follows,

In the EVCS2, the number of swapped batteries is limited as, EVCS2 battery storage management constraints
In EVCS2 is open then it start with


The presented fully charged batteries are determined by,


when the charging cost of CS is established means then the
The relation among two consecutive time and years for the power flow is described as,


Policy implications
The CQOCRO technique is utilized to design and manage an EV charging station network in the event of power demand uncertainty stations. Policymakers should focus on designing policies that promote smart charging strategies, such as time-of-use pricing or demand response programs, to manage the load on the grid. The proposed method is to increase the overall efficiency and effectiveness of these stations, while also reducing costs and minimizing environmental impacts. Air quality improvement, climate change mitigation, decreased reliance on imported oil, and the growth of India's EV industry. The findings of the study can inform policy decisions regarding the optimal location, capacity, and design of charge stations to ensure efficient and effective integration with the overall energy grid.
To provide incentives for the development and deployment of more advanced EV charging technologies. This could help to accelerate the widespread adoption of these technologies and promote sustainable, low-carbon transportation systems.
Interoperability and Standardization: Policymakers should consider promoting interoperability and standardization of EV charging infrastructure. This ensures that different charging stations are compatible with multiple EV models, reducing consumer concerns and promoting widespread adoption. Establishing common protocols and technical standards can encourage competition, innovation, and cost reduction in the EV charging market.
Public Awareness and Education: Policymakers can play a vital role in raising public awareness about the benefits of EVs and the availability of charging infrastructure. Educational campaigns and outreach programs can address any misconceptions, promote consumer confidence, and encourage the adoption of EVs.
Finally, policymakers might consider working with private sector partners to develop public–private partnerships and other collaborative initiatives aimed at promoting the use of EVs and facilitating the expansion of EV charging infrastructure. By working together, governments and private sector organizations can help to remove some of the major obstacles preventing the widespread use of EVs and accelerate the transition to a more sustainable, low-carbon transportation system.
These policy implications can help facilitate the integration of long and short-term planning decisions to design and manage EV charging stations effectively, ensuring a seamless transition toward a cleaner and more sustainable transportation system.
Design and manage electric vehicle charging stations using CQOCRO method
One of the meta-heuristics optimization methods is chemical reaction optimization (CRO) which is inspired by chemical reactions. The normal process of converting unsafe materials into solids is defined as a chemical reaction. A chemical reaction starts with high energy with some unstable molecules. Through a series of simple reactions, molecules intermingle with each other. Finally, it is transmitted to low energy to help their existence. The thermodynamics laws are used for the chemical reactions. The first law describes the conservation of energy that means energy is changed in one form to another and the second one describes the system entropy. Through the intermediate and transition stage, the chemical reaction is obtained. The proposed method is utilized the quasi-oppositional CRO method. This upgraded version integrates with CRO and utilizes semi-anti-based learning for a better quality process and faster integration. In this article for the control of voltage quasi-oppositional CRO method is utilized. The hierarchical process of CQOCRO is described as given below,
Step 1: Initialization Step 2: Random generation Step 3: Fitness evaluation Step 4: Quasi-oppositional based learning (QOBL) Step 5: Molecular collision Step 6: Chaotic local search Step 7: Determine the minimum value Step 8: Stopping criteria
The boot parameter of the system is the initial stage of this method. Here is a sum of the released percentage levels of EVs charging in network rooms, mass, upper and lower bound, power line temperature, a segment of charging price, maximum available batteries, count of the plug-in as well as plug-out charge station are initialized
At this point, the gain parameters are arbitrarily generated by using the following matrix,
Determine the fitness function for each parameters value, which are estimated by,
There are inverse numbers rather than arbitrary numbers to resolve learning based conflicts. OBL added the optimization method to increase the accuracy and speed of the system. OBL is also extended to quasi-opposite numbers because it is more effective than inverse numbers. Consider the point
In this step, check the molecular collision, if it chosen the one molecule then checks the decomposition criteria, otherwise check the synthesis criteria.
CLS investigates the close search space of present solutions to make a novel candidate. A novel solution is created as current population, that utilize the below equation
In this step, check any minimum values are present.
Check the condition for termination. If it satisfies means best solution is obtained, otherwise go to step 5 and repeat the process. Figure 2 displays the flowchart of the CQOCRO method.


Flow chart of the CQOCRO method.
Decomposition criteria
Decomposition criteria is described as,


Synthesis criteria
Synthesis criteria is described as,

Results and discussions
This article describes the performance of the CQOCRO system based on simulation. The proposed CQOCRO method is a hybrid wrapper of confusing semi-reactive and chemical reaction enhancement. The major purpose of the proposed method is locating EVCS by considering the power requirement uncertainty, electricity distribution line disruption. The proposed method manages the energy efficiently by reducing the cost of the system. The CQOCRO method is simulated on the MATLAB platform, as well as compared with the effects using existing methods. The proposed method is analyzed under three scenarios such as the basic situation scenario and the large difference situation with the small difference situation.
Case 1: performance analysis of system based on effect of variation of power demand
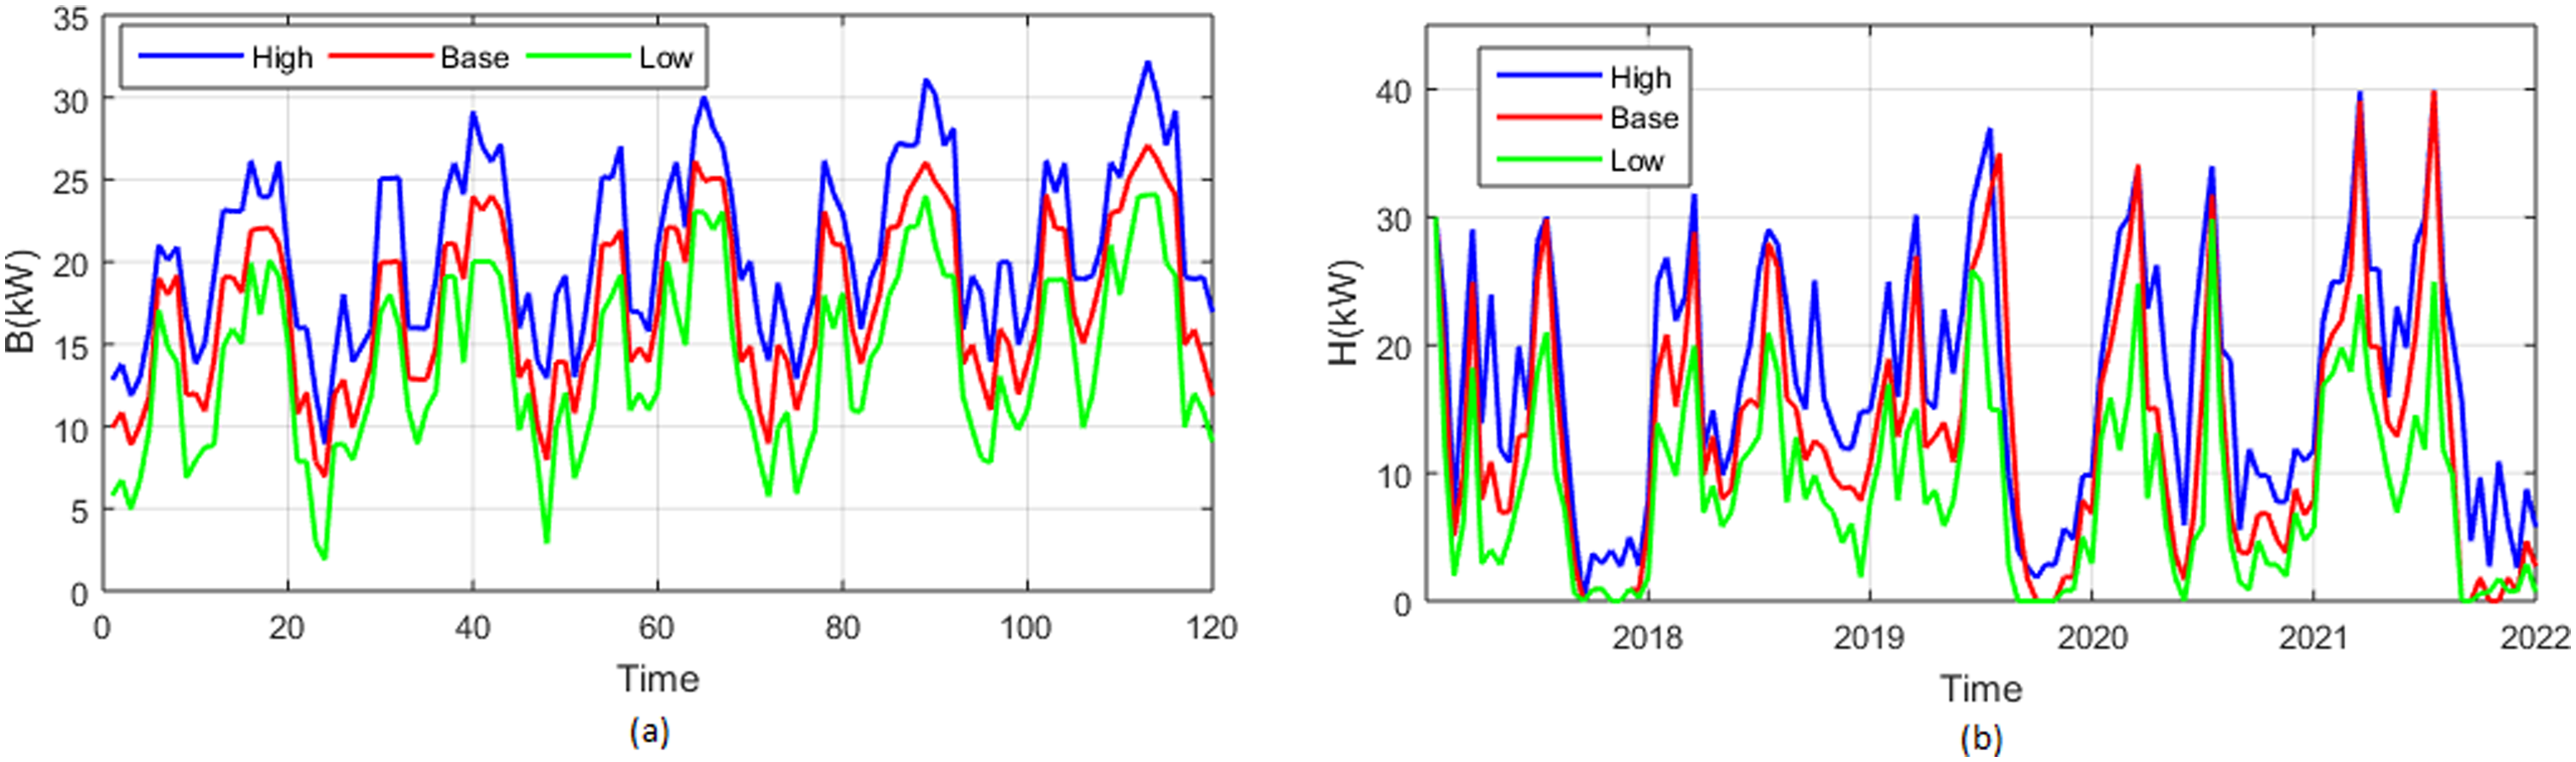
Here, the performance of system is analyzed based on variation of requirement of power or variation of EV charging percentage. Due to this variations the systems how to affect the performance is analyzed. The performance is analyzed under three cases such as base case, high variation and low variation of charging percentage. The high charging variation level means 50% and low means 15%. Figure 3 shows the analysis of EV charging percentage over year. Sub plot 3(a) shows the analysis of energy flow under base, low and high variation of scenario of charging percentage. The energy flow is increased from year to year. In 2018, the current from the grid to the chamber to charge the EV was 280 kW at high variance, 250 kW in low and base case scenario. It is increased in 2019 and the values of base, low and high variation cases are 290, 210, and 320 kW, respectively. At the year of 2020, the variation of energy in base, low and high variation cases become 310, 250, and 350 kW. Sub plot 3(b) shows that the V2G to location, energy flow activity analysis. Here the energy at 2018 under the cases like base, low, high variation becomes 90, 100, and 130 kW, respectively. Here the impact of the EV charging percentage is increased from year to year. Analysis of impact of EV charging percentage over year in RES to cell, number of swapped batteries for charge EV is displays in Figure 4. Subplot 4(a) shows the electricity flow from RES to cell. Under analyzing the base, low, high variation scenario, the energy is increased one level then it decreased to zero and it continue like that. The energy after 2021 year, the base scenario analysis then the energy become 390 kW and the low variation of charging percentage, then the energy become 320 kW, at high variation of charging percentage, then the energy become 450 kW, respectively. Subplot 4(b) displays the impact of EV charging percentage under the count of swapped batteries. The swapped battery energy is also increased from year to year. The lower variation scenario, the energy is varied up to 800 kW. Under the base case, the energy is varied up to 950 kW and the high variation of EV charging percentage, the energy is varied up to 1150 kW. From these (Figures 4 and 5) results, as the amount of car charge rate variation increases, the amount of power used to meet the power requirement further increases from multiple power sources (grid, RES, V2G). The model is portrayed as too complex for many time consuming parameters such as renewable energy access, energy values and car runs, which can definitely affect the hourly performance of the CS. Also, EV demand is met by power grid and V2G at low charging times.
Power analysis of year-round EV charge percentage: (a) G2V and (b) V2G.
Power analysis of EV charge percentage in use of power resources throughout the year: (a) electricity flow from RES to cell and (b) number of swapped batteries for charge EV.
Analysis of the power of the EV charge percentage in the performance of batteries over many years: (a) number of batteries to charge in the cell and (b) number of discharged batteries at cell.
Analysis of power EV charge percentage on battery performance for many years is shown in Figure 5. Here, how the number of charging and discharging batteries in EVCS2 can affect the charging percentage of EV is described. Subplot 5(a) shows the effect of EV charging percentage under the effect of number of charging batteries at cell is described. The proposed system is analyzed under three scenarios like base case, low variation scenario, high variation scenario. From year to year the variation of charging is high. In 2018, the number of charged batteries energy at base case is 20 kW, at low variation scenario its energy become 18 kW and at high variation of charging percentage, the energy becomes 25 kW. In 2019, the energy of number of charged batteries at base case become 18 kW, at low variation the energy become 10 kW and at high variation scenario the energy become 22 kW, respectively. In 2022, the energy of number of batteries charged at cell becomes 20 kW, 18 kW, 21 kW for base, low and high variation scenarios. Subplot 5(b) shows the effect of EV charging percentage under the effect of count of discharge battery at cell is illustrated. In 28th an hour, the number of discharged batteries energy at base case is 10 kW, at low variation scenario its energy become 14 kW and at high variation of charging percentage, the energy becomes 7.5 kW. In 60th hour, the energy of number of discharged batteries at base case become 8 kW, at low variation the energy become 14 kW and at high variation scenario the energy become 5 kW, respectively. In 85th hour, the energy of number of batteries discharged at cell becomes 7.5, 16, and 7.5 kW for base, low and high variation scenarios. From Figure 5, it is conclude that the power requirement of EV is increased when the charging percentage variation increases which case an increase in charge.
An analysis of the power of the EV charge percentage in the performance of batteries over several years is shown in Figure 6. Here, in EVCS2 the count of charging, discharging battery is how to impact the charging percentage of EV is described. Subplot 6(a) shows the effect of EV charging percentage under the number of swapped batteries at cell is described. The proposed system is analyzed under three scenarios like base case, low variation scenario, high variation scenario. From year to year the variation of charging is high. In 18th hour, the number of swapped batteries energy at base case is 23 kW, at low variation scenario its energy become 20 kW and at high variation of charging percentage, the energy becomes 26 kW. In 40th hour, the energy of number of swapped batteries at base case become 24.8 kW, at low variation the energy become 20 kW and at high variation scenario the energy become 28 kW, respectively. In 110th hour, the energy of number of swapped batteries at cell becomes 27, 24, and 33 kW for base, low and high variation scenarios. Supply 6(b) shows the effect of the EV charging percentage under the effect of the number of fully charged batteries in the battery. In 2018, the number of fully charged battery power in the base case is 20 kW, at low variation scenario its energy become 12 kW and at high variation of charging percentage, the energy becomes 25 kW. In 2019 middle month, the energy of number of full charged batteries at base case become 33 kW, at low variation the energy become 25 kW and at high variation scenario the energy become 35 kW, respectively. In 2021, third month, the energy of number of batteries full charged at cell becomes 39.8, 25, and 40 kW for base, low and high variation scenarios. From Figure 6, it is conclude that the power requirement of EV is increased when the charging percentage variation increases which case an increase in charge. While the off-peak hours, the batteries charging are increasing and in subplot 6(b) shows that while peak hours the discharging is increasing. Hence the variation of charging percentage highly affects the system performance.
Analysis of the power of the EV charge percentage in the performance of batteries over many years: (a) number of swapping batteries in the cell and (b) the number of batteries that are fully charged in the cell.
Case 2: performance analysis of the system based on effect of power grid disruption
This article is the performance of analysis system based on the grid disruption. Consider the maximum allowable power consumption of the grid and the CS placed in the cell and the flow of power from grid to CS is set as zero for consecutive times. Analysis of power resource utilization with management of power disruption is displays in Figure 7. When power disruption is managed then the grid power is varied from year to year. All the sources power is increased from one year to other years. The grid power in 2018 is 5500 kW and it increased to reach 7000 kW at 2020th year. Then it also increased to reach 7500 at 2021st year. The shortage of power is varying from year to year. The shortage power is below or equal to 1000 kW. The V2G mode power utilization in 2018 and 2019 years are same and after that it increased from year to year. The V2G power is below 2000 kW from 2018 to 2020. At 2021 and 2022, the V2G power utilization is increased up to 2500 kW. The RES utilization is constantly increased from year to year. Here there is not a big change occur in the RES utilization of system.
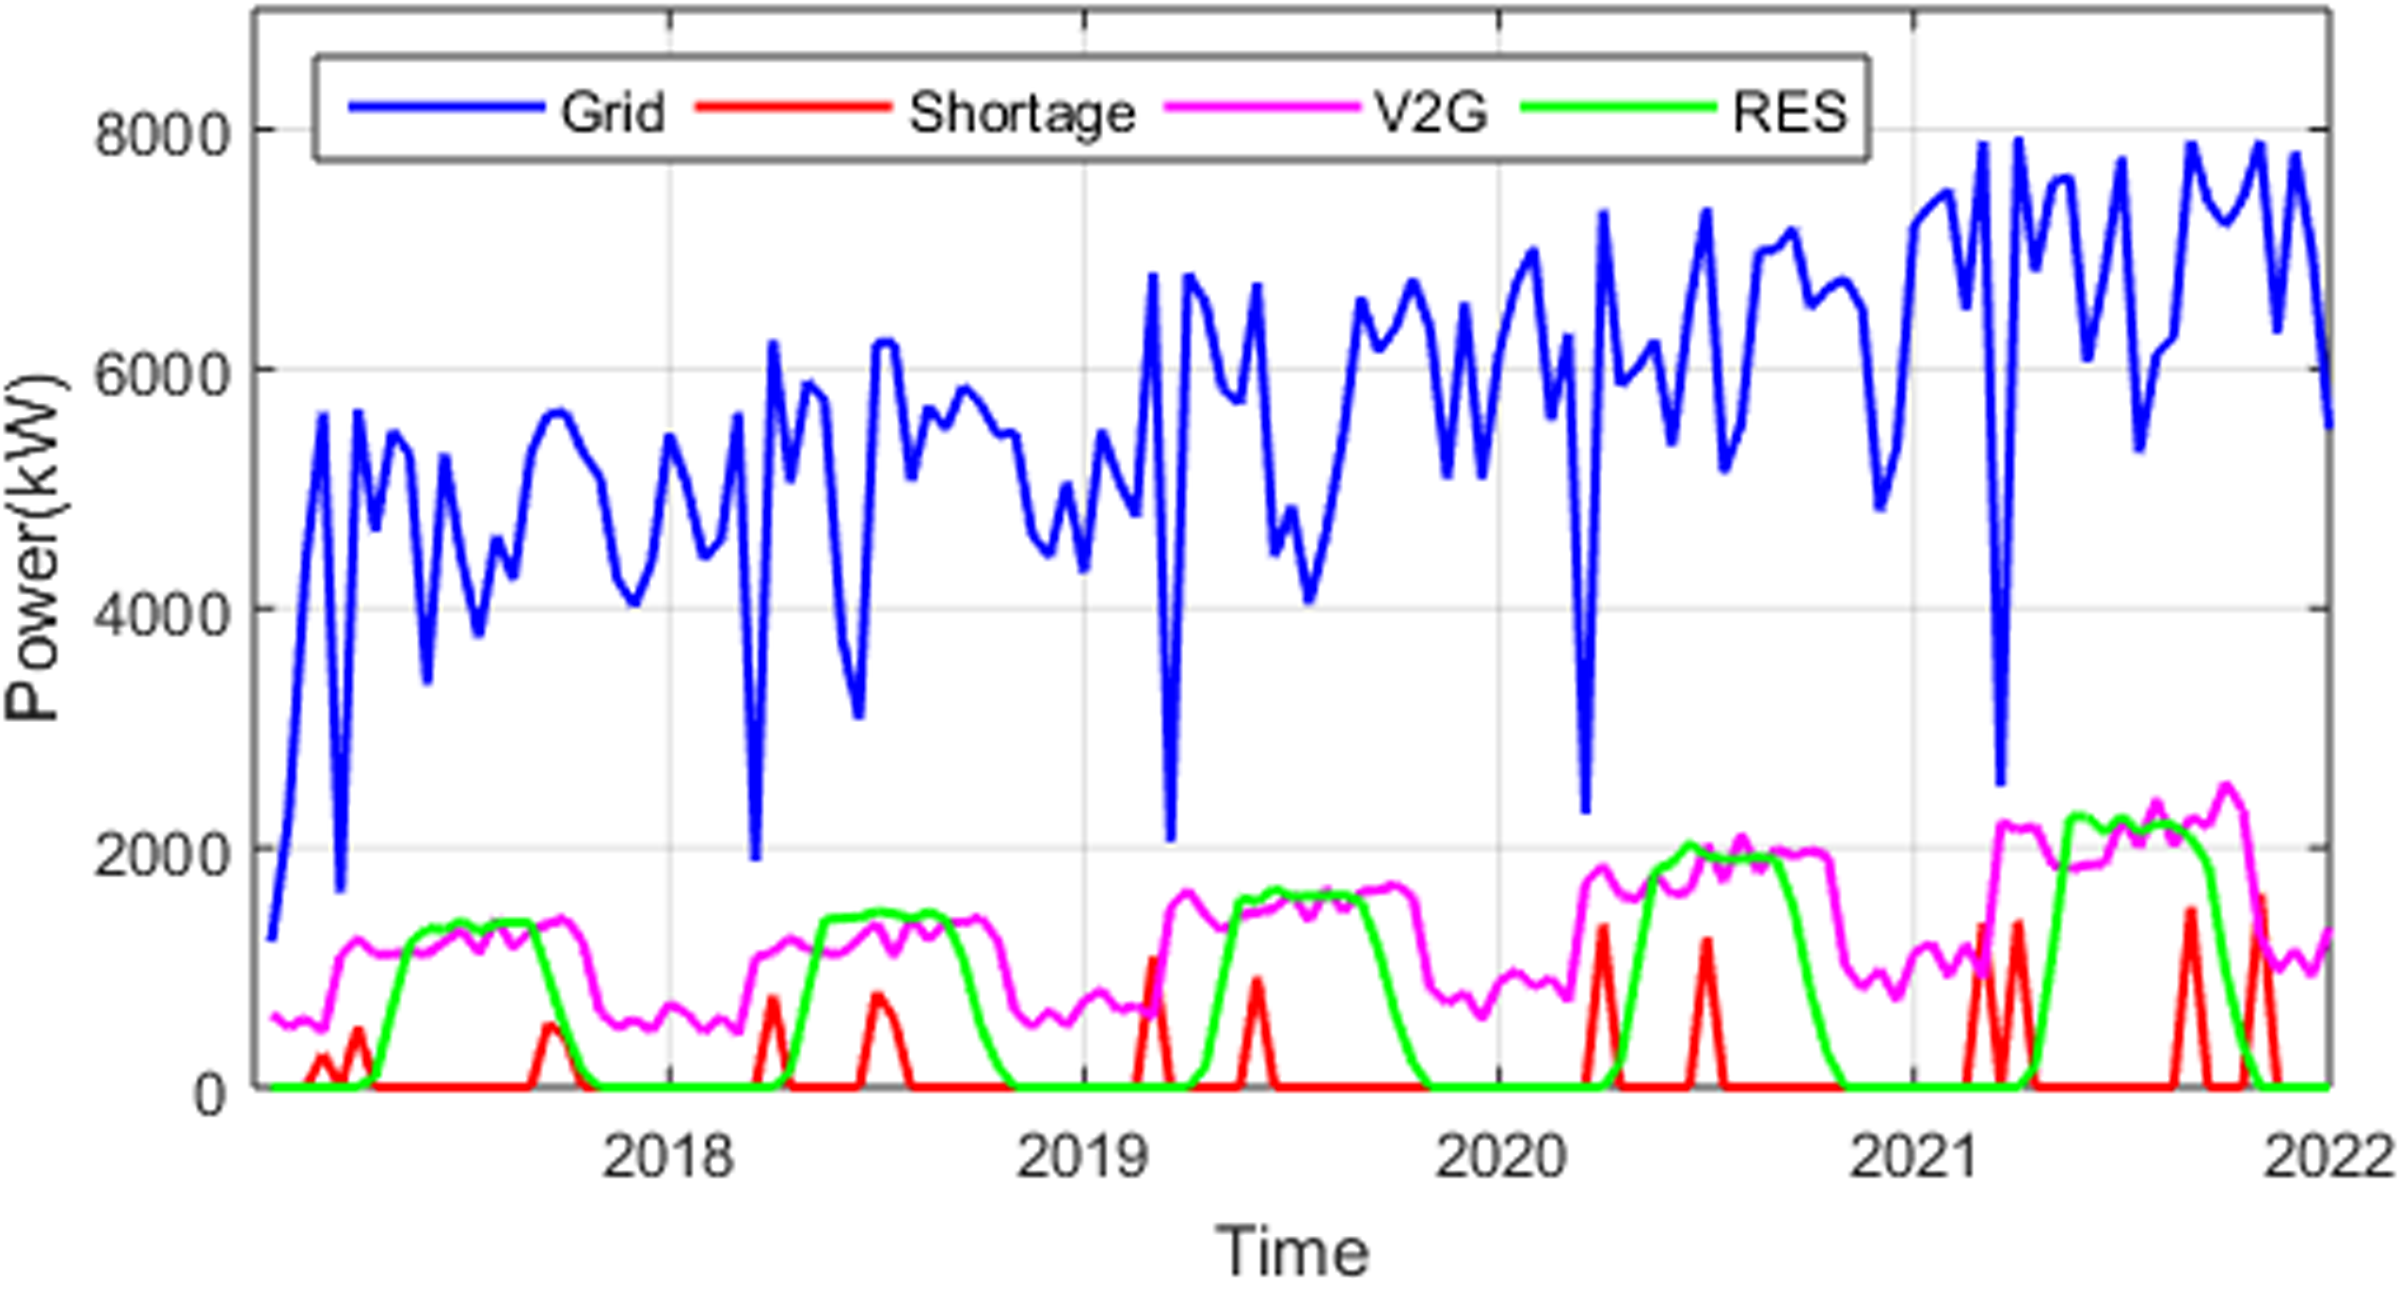
Analysis of power resource utilization with management of power disruption.
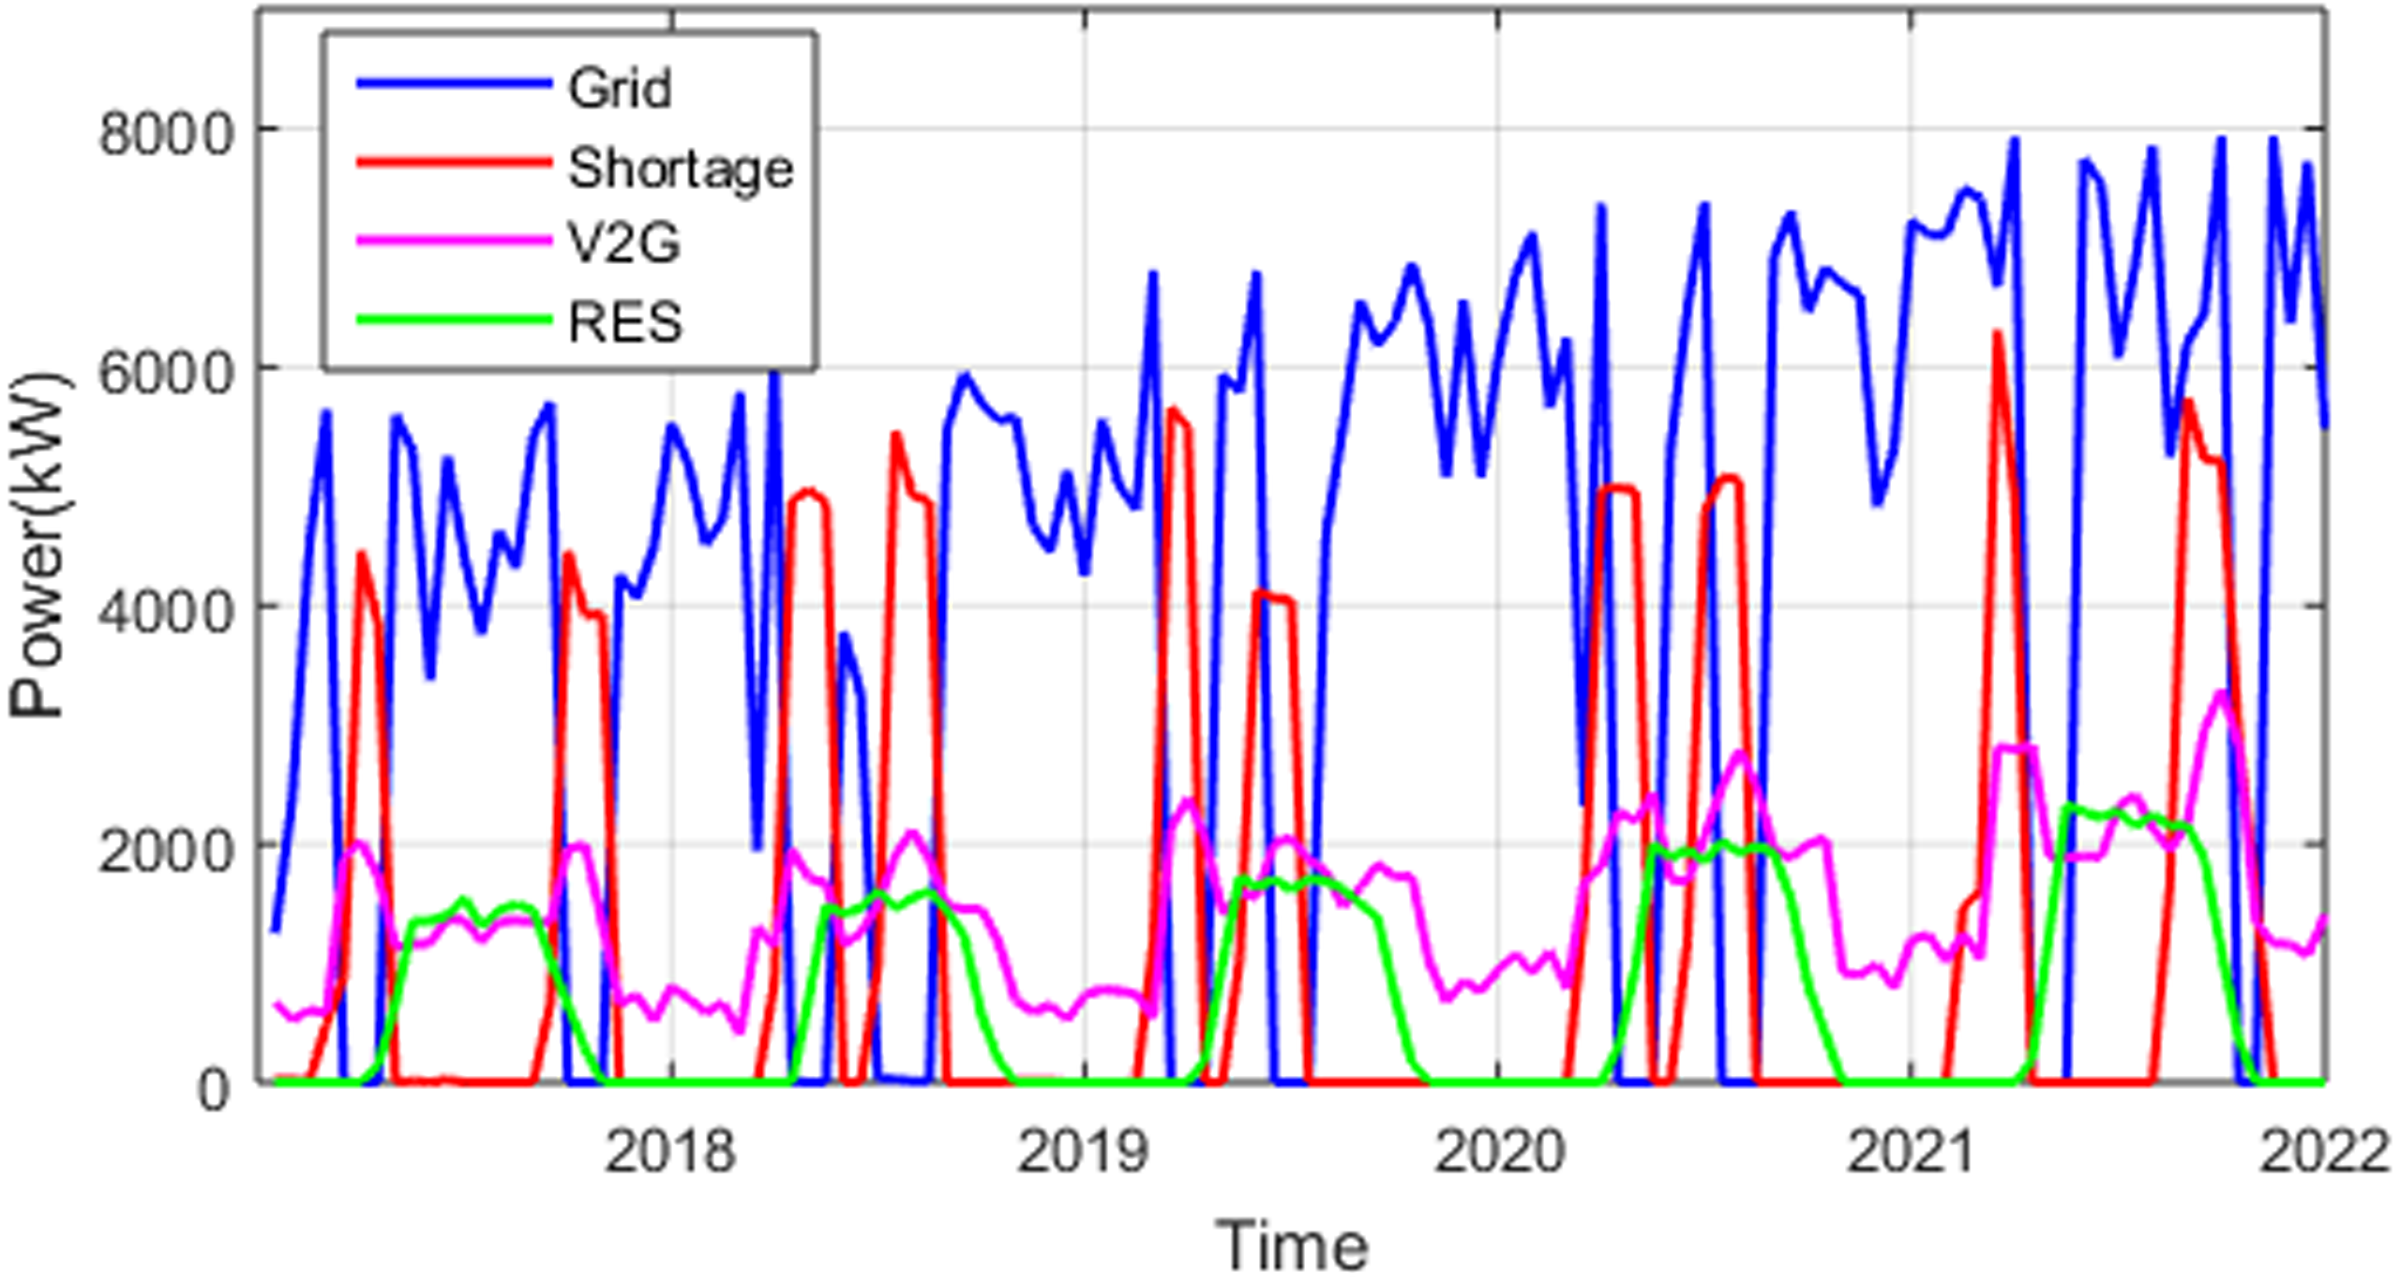
Analysis of power resource utilization without management of power disruption is displays in Figure 8. When power disruption is not managed then the grid power is varied from year to year. All the sources power is increased from one year to other years. The grid power in 2018 is 5500 kW and it increased to reach 7000 kW at 2020th year. Then it also increased to reach near 8000 at 2021st year. The shortage of power is varying from year to year. The shortage power is below or equal to 6100 kW for all the year analysis. The V2G mode power utilization in 2018 and 2019 years are same and after that it increased from year to year. The V2G power is 2000 kW from 2018 to 2019. At 2020 and 2021, 2022, the V2G power utilization is increased up to 3000 kW. The RES utilization is constantly increased from year to year. Here there is not a big change occur in the RES utilization of system. From Figures 7 and 8, it is conclude that the power disruption is managed means then the shortage power is decreased and it is managed by sources like V2G and RES. The proposed method power shortage is managed efficiently.
Analysis of power resource utilization without management of power disruption.
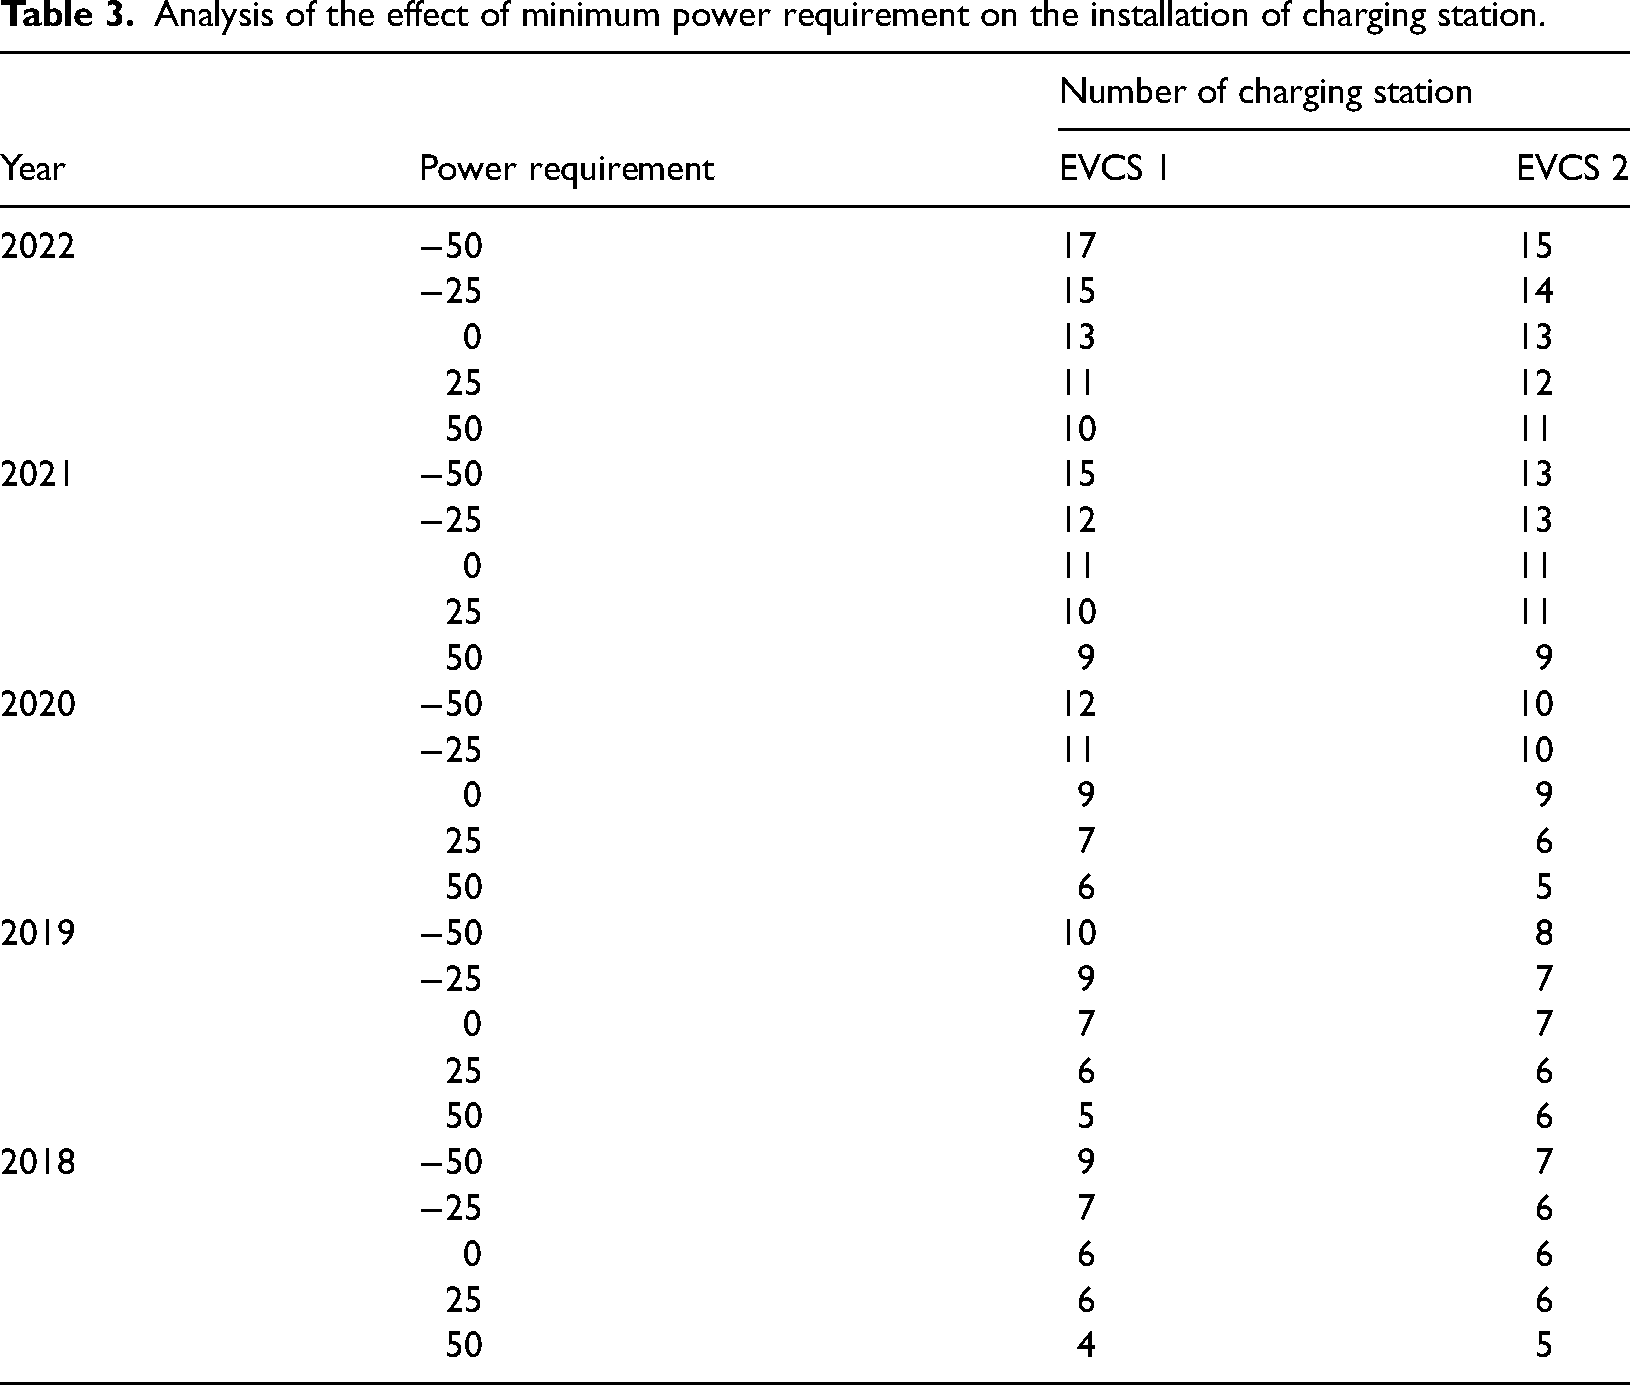
Case 3: performance analysis of the system based on the effect of minimum power requirement on installing charging station
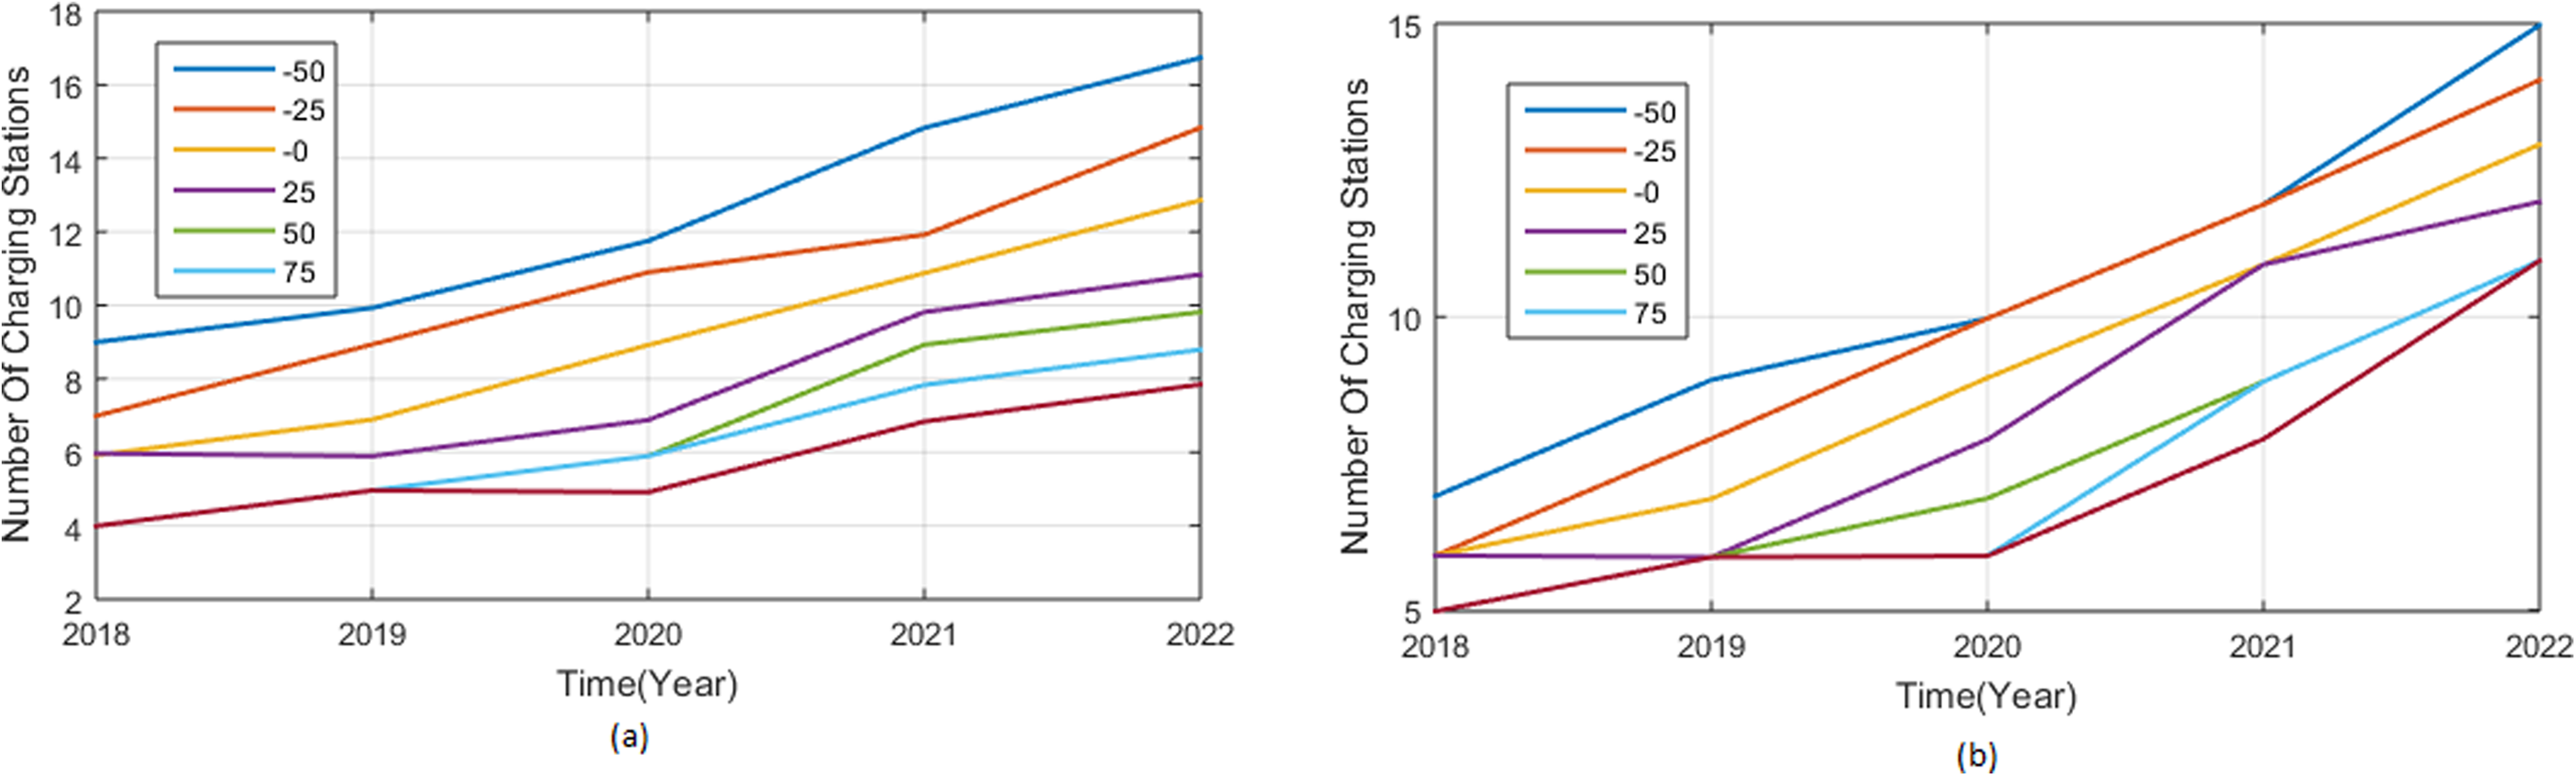
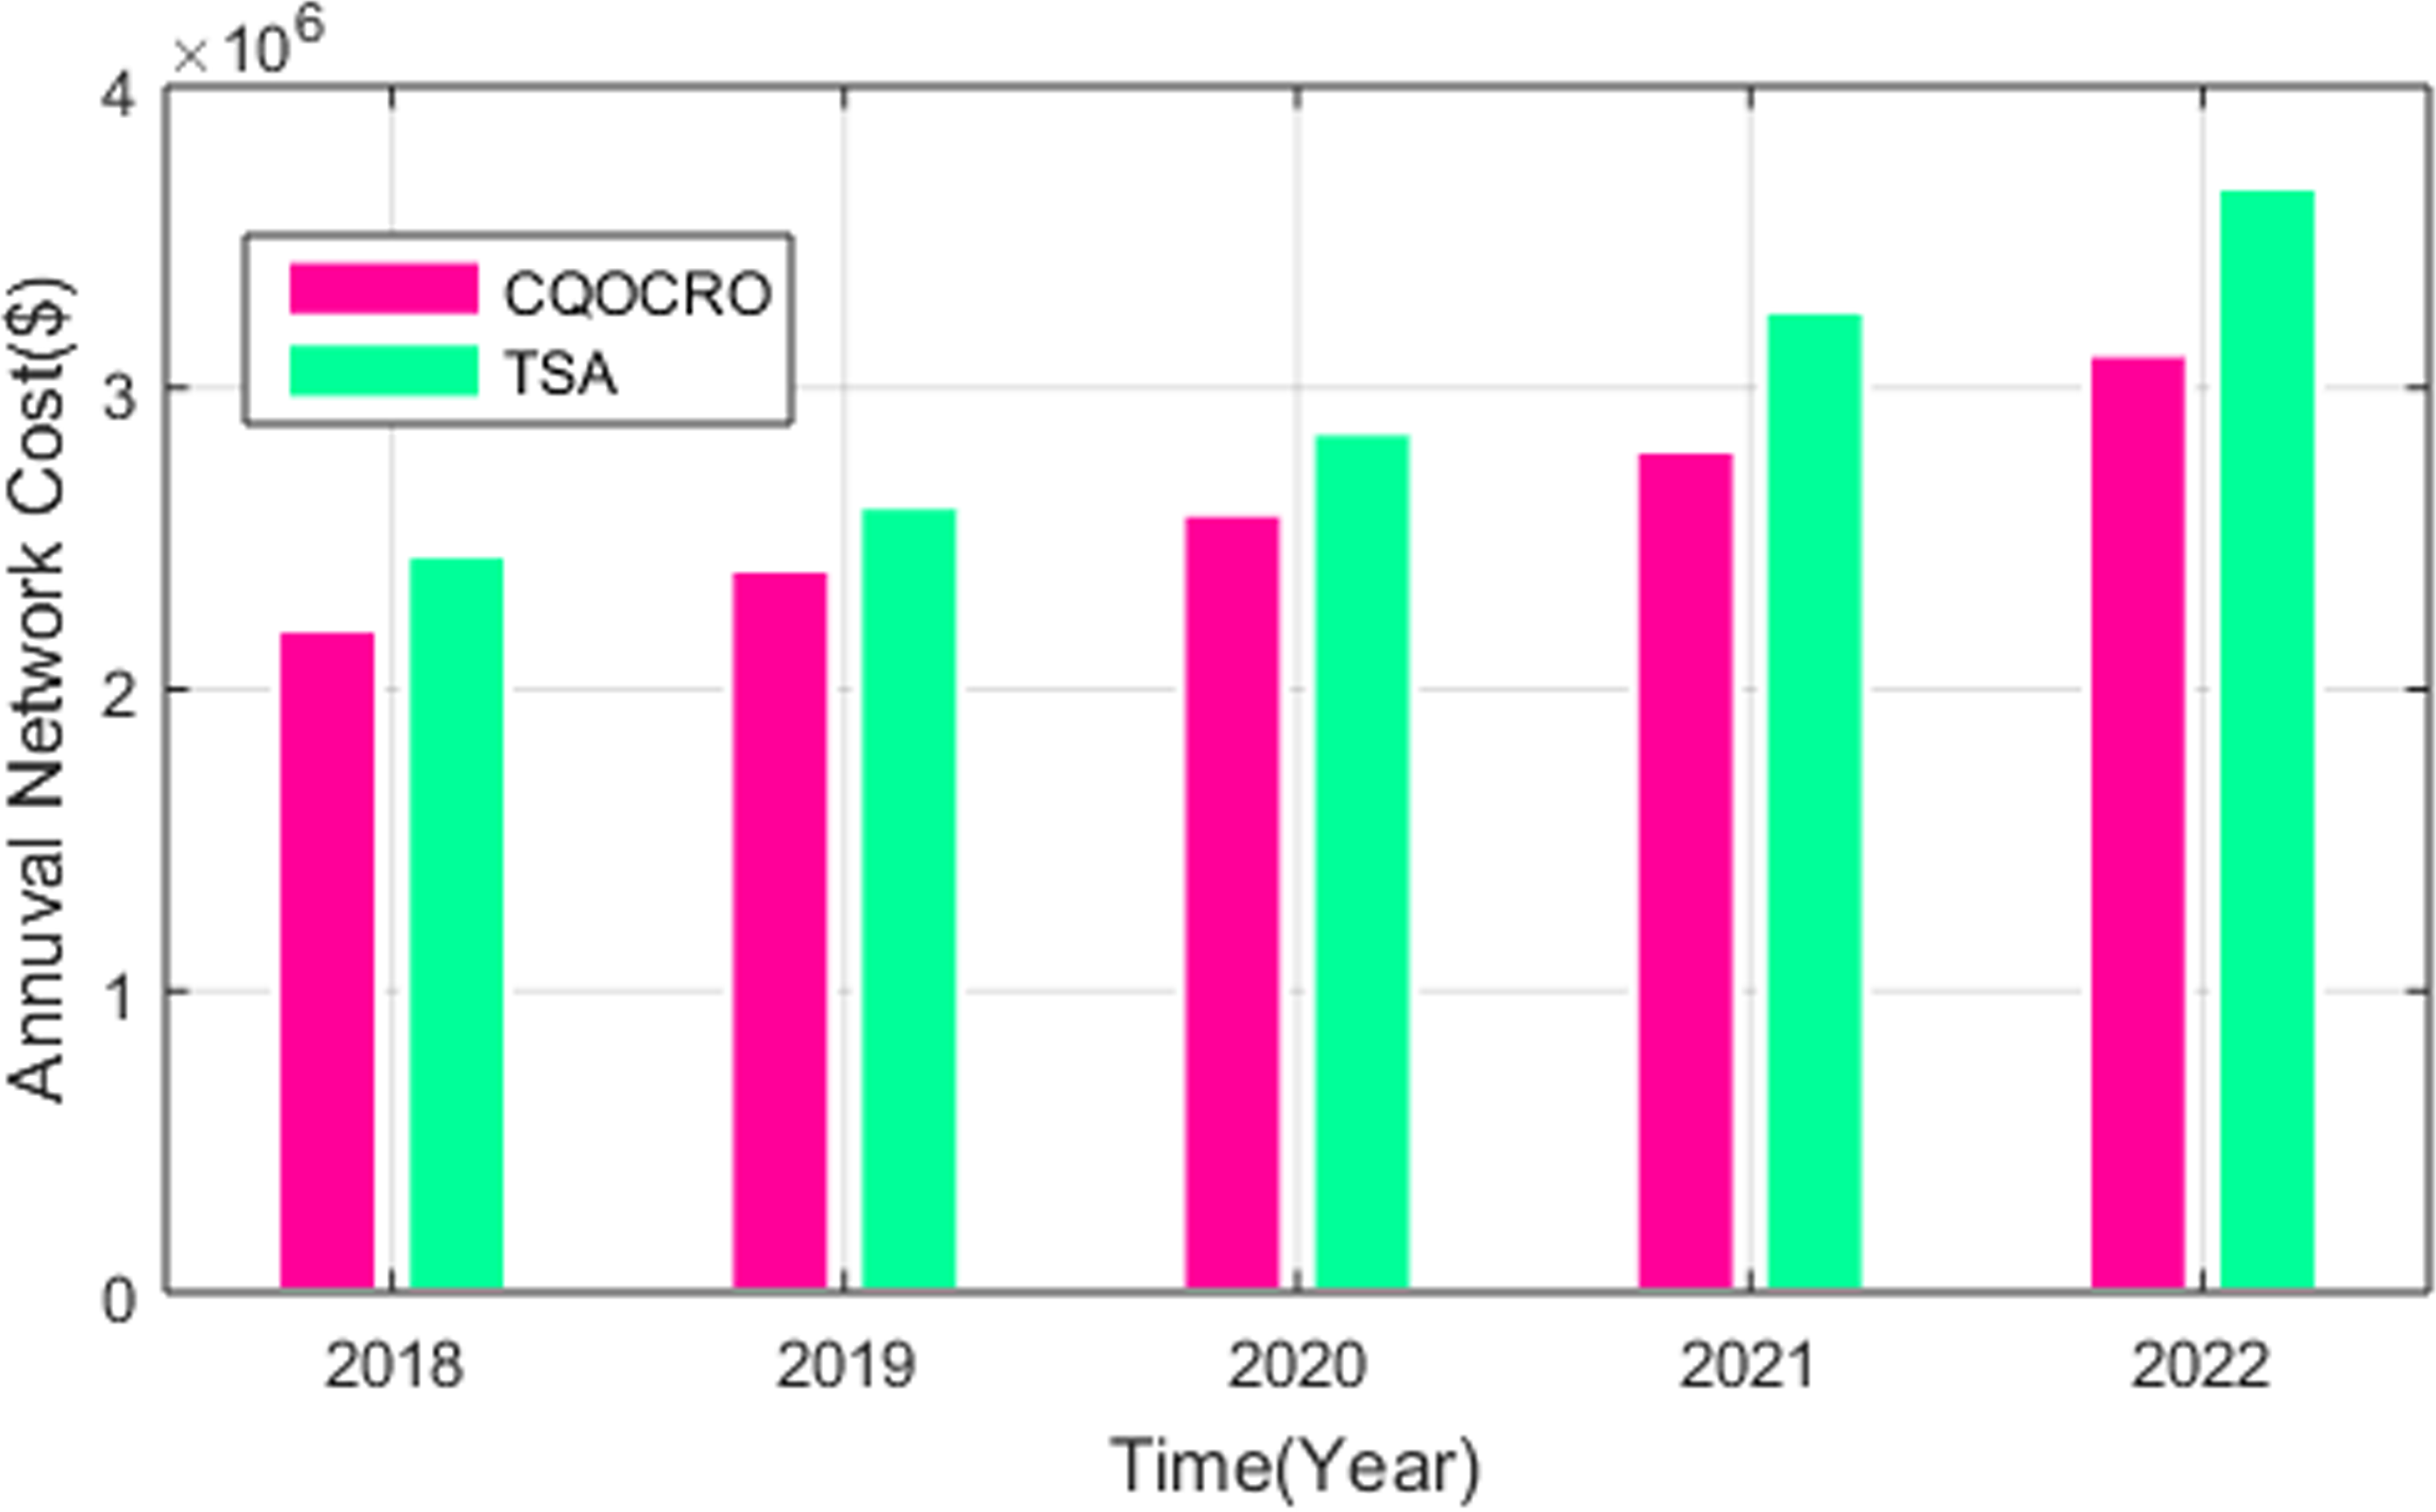
This case describes the effect of less demand power along cost to set a CS on the network. Analysis of effect of minimal power necessity on establishing charging-station (a) EVCS 1 (2) EVCS 2 is shown in Figure 9. Subplot 9(a) shows the EVCS 1 number of charging station establishment with requirement of power. When the power requirement is −50 then the charging station is increased from 9 to 10 at 2019. In 2020, it is increased to 12, in 2021, it is increased to 15, in 2022, and it is increased to 17 CS. If the minimum charge demand is high means then the charging station establishment is low. Subplot 9(b) shows the EVCS 2 number of charge station establishment with requirement of power. Here, the power requirement is negative then the charging station number is high and the demand is positive then the CS number is less. When decreasing the charging requirement then the percentage is changed to negative number. When increasing the requirement of power, the percentage is changed to positive number. From Figure 9, it is conclude that the inverse relationship among minimum power demand changes to develop the CS as well as net number of CS. Comparison of annual network cost of proposed and existing methods is shown in Figure 10. The proposed method is compared to the Tunicate Swarm optimization (TSA). In 2018, the annual network cost of proposed method is 2.2 × 10⁶$ and TSA is 2.5 × 10⁶$. In 2019, the annual network cost of proposed method is 2.3 × 10⁶$ and TSA is 2.6 × 10⁶$. In 2020, the annual network cost of proposed method is 2.6 × 10⁶$ and TSA is 2.8 × 10⁶$. In 2021, the annual network cost of proposed method is 2.9 × 10⁶$ and TSA is 3.2 × 10⁶$. In 2022, the annual network cost of proposed method is 3.1 × 10⁶$ and TSA is 3.5 × 10⁶$. From Figure 10, it is conclude that the proposed method provides lesser cost than the TSA method.
Analysis of effect of minimal power necessity on establishing charging-station: (a) EVCS 1 and (b) EVCS 2.
Estimation of the proposed annual network cost with the TSA method.
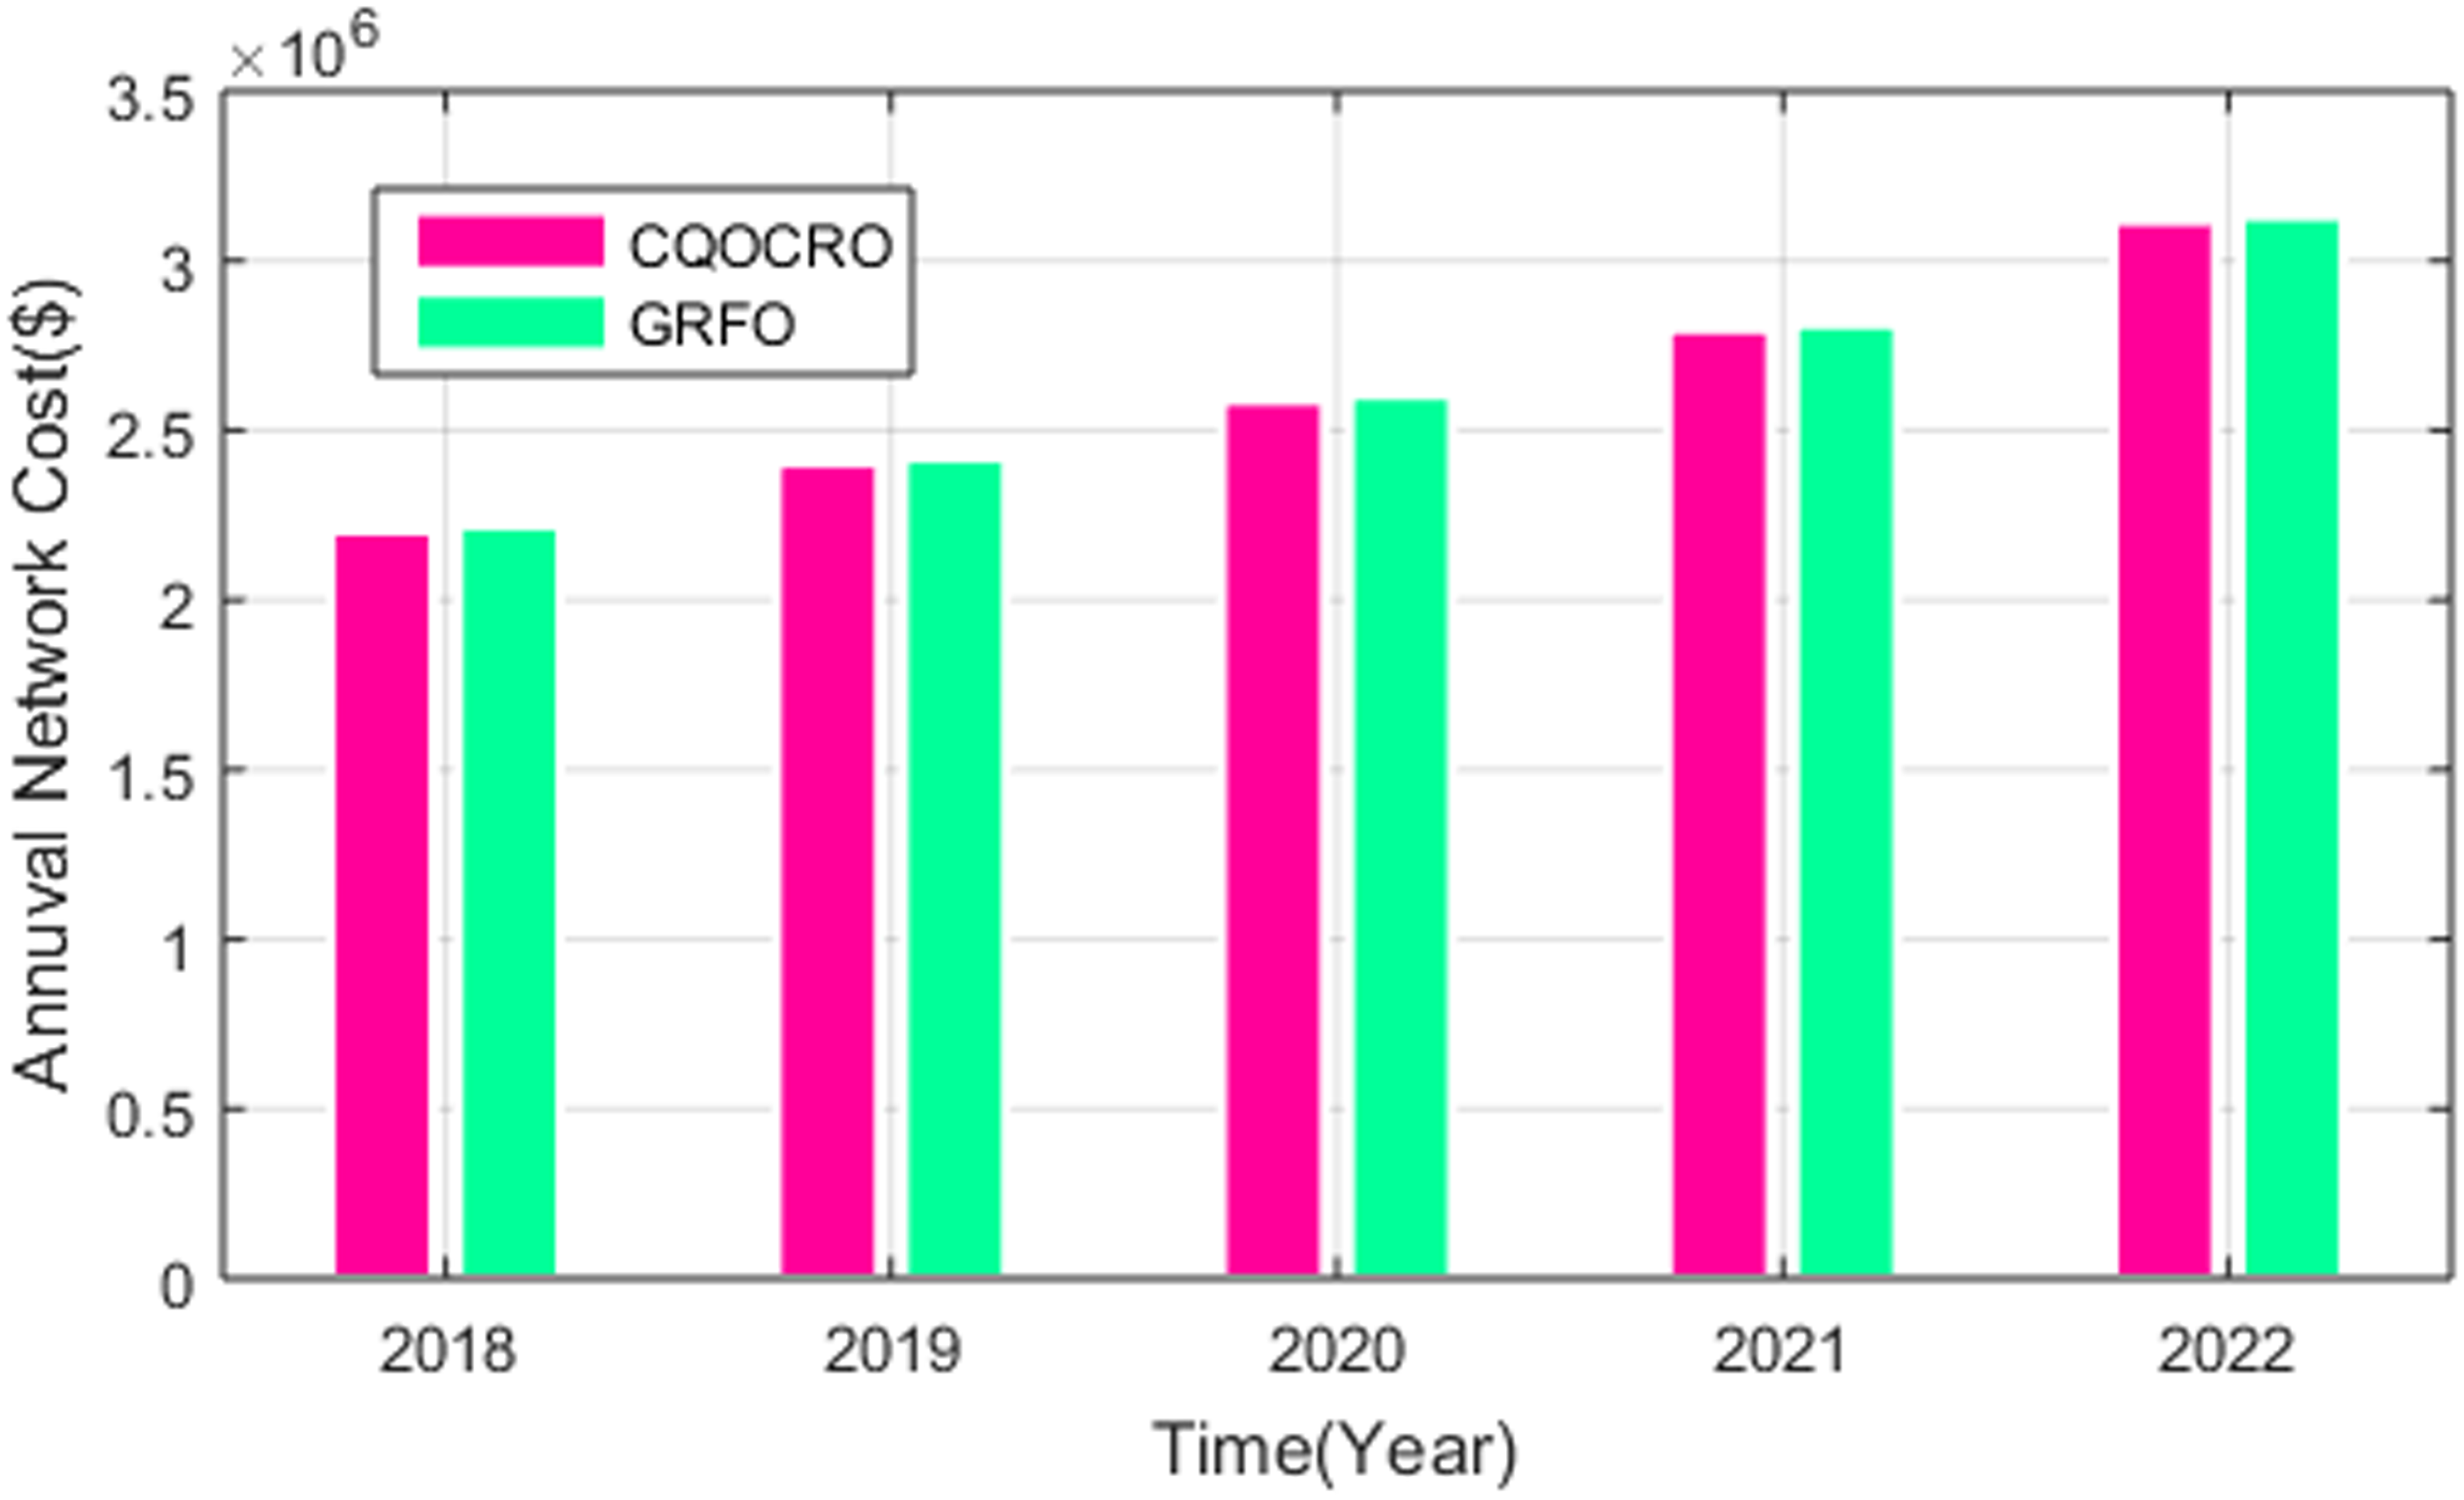
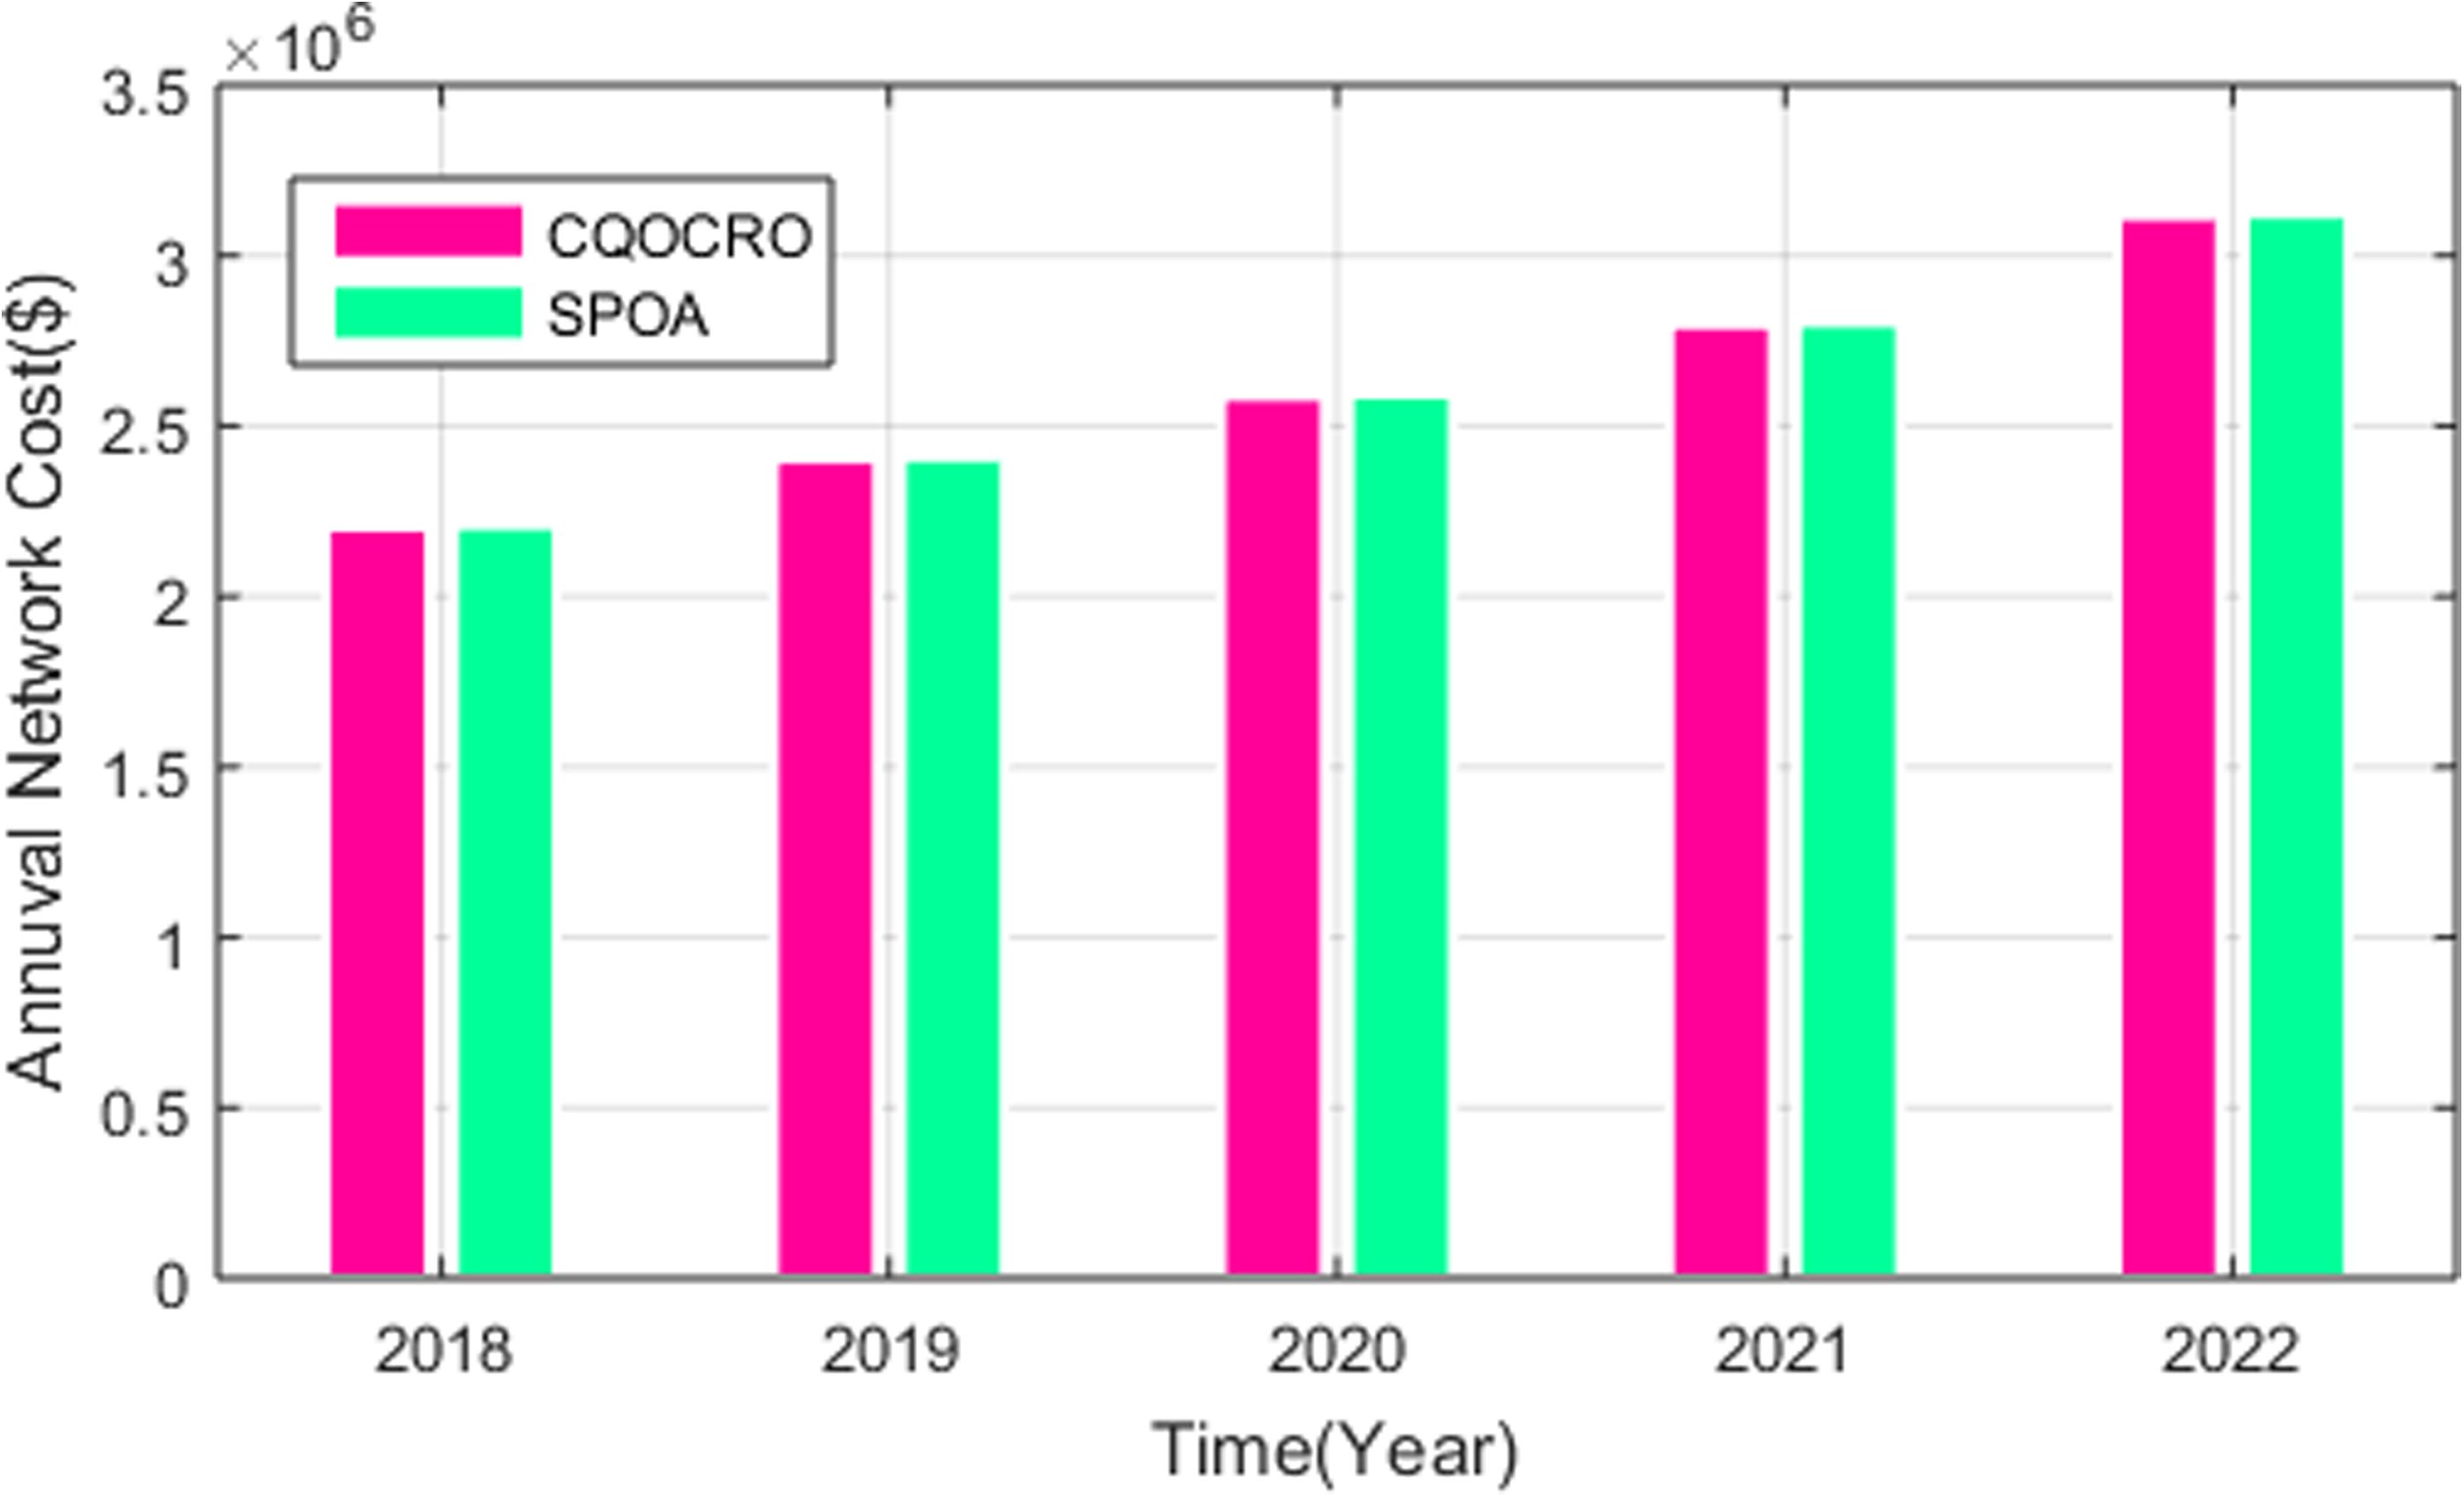
Estimation of annual network cost of proposed with Garra Rufa fish optimization (GRFO) method is shown in Figure 11. The proposed method is compared to the GRFO method. In 2018, the annual network cost of proposed method is 2.2 × 10⁶$ and GRFO is 2.21 × 10⁶$. In 2019, the annual network cost of proposed method is 2.8 × 10⁶$ and GRFO is 2.81 × 10⁶$. In 2020, the annual network cost of proposed method is 2.6 × 10⁶$ and GRFO is 2.61 × 10⁶$. In 2021, the annual network cost of proposed method is 2.75 × 10⁶$ and GRFO is 2.76 × 10⁶$. In 2022, the annual network cost of proposed method is 3.1 × 10⁶$ and GRFO is 3.2 × 10⁶$. From Figure 11, it is conclude that the proposed method provides less cost than the GRFO method. Comparison of annual network cost of proposed and Student psychology optimization algorithm (SPOA) method is shown in Figure 12. The proposed method is compared to the SPOA method. In 2018, the annual network cost of proposed method is 2.2 × 10⁶$ and SPOA is 2.21 × 10⁶$. In 2019, the annual network cost of proposed method is 2.8 × 10⁶$ and SPOA is 2.81 × 10⁶$. In 2020, the annual network cost of proposed method is 2.6 × 10⁶$ and SPOA is 2.61 × 10⁶$. In 2021, the annual network cost of proposed method is 2.75 × 10⁶$ and SPOA is 2.76 × 10⁶$. In 2022, the annual network cost of proposed method is 3.1 × 10⁶$ and SPOA is 3.2 × 10⁶$. From Figure 12, it is conclude that the proposed method provides lesser cost than the SPOA method.
Estimation of annual network expenses proposed with GRFO method.
Estimation of the proposed annual network cost with the SPOA method.
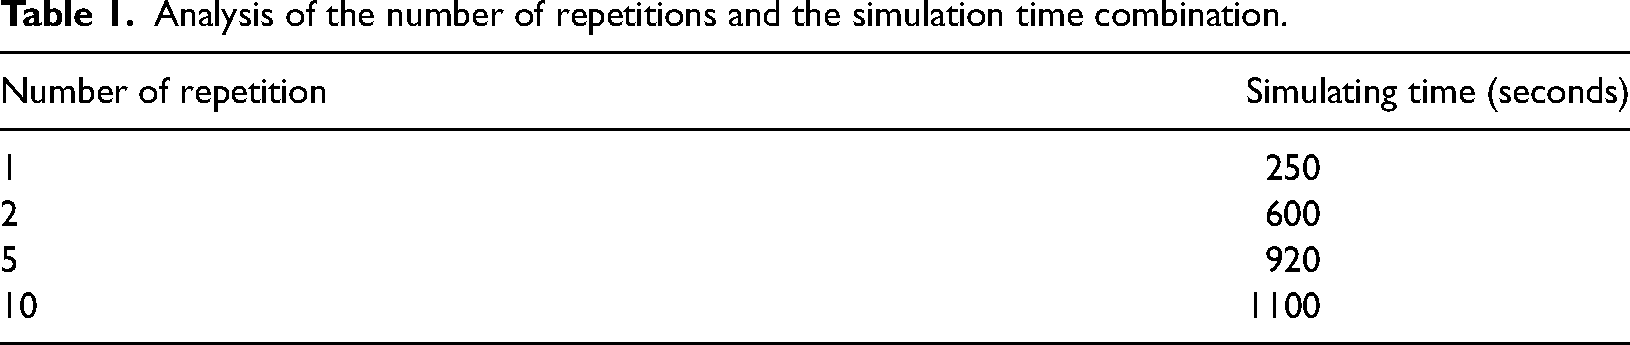
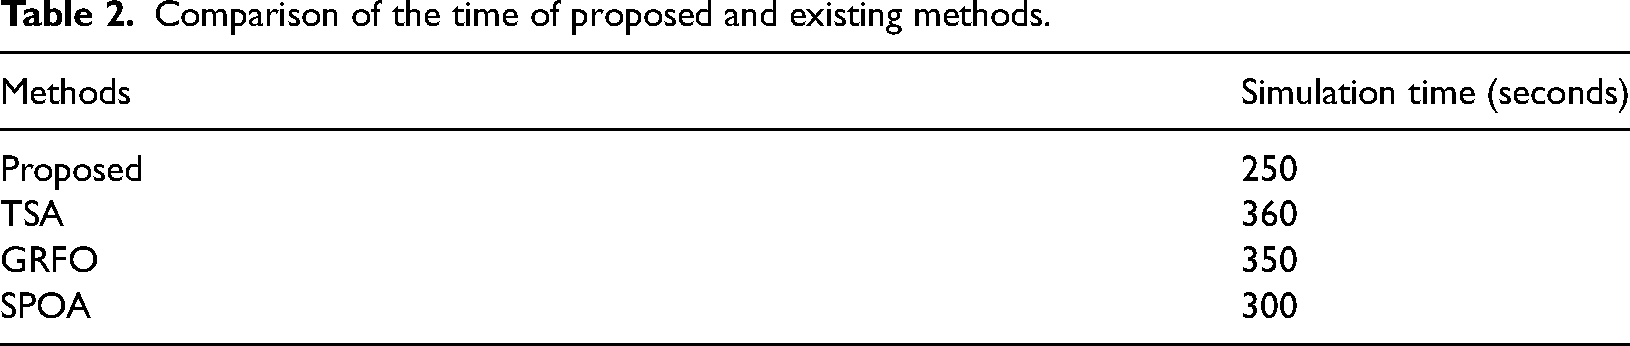
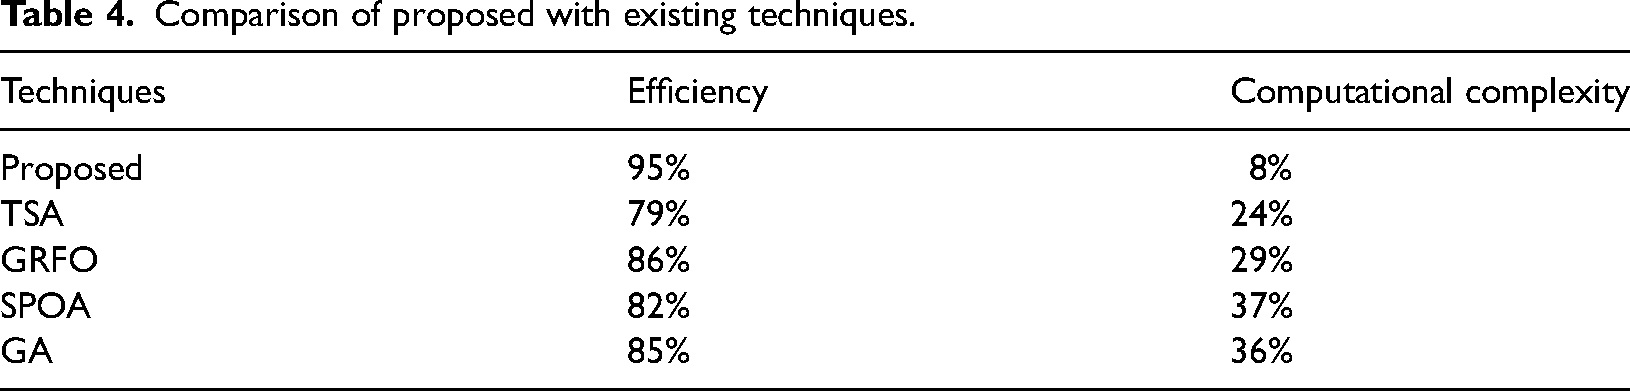
Table 1 depicts analyzes the connection of the number of repetitions and simulates the time of the proposed method. In the proposed method number of iteration is 1 then the simulation time is 250 seconds The iteration is 2, and then the simulation time is 600 seconds iteration is 5, and then the simulation time is 920 seconds Iteration is 10, and then the simulation time is 1100 seconds Comparison of the time of proposed and existing methods is tabulated in Table 2. The proposed method simulation time is 250 seconds, the TSA method simulation time is 360 seconds, the GRFO method simulation time is 350 seconds, and SPOA method simulation time is 300 seconds, respectively. From Table 2, conclude that the proposed method simulation time is less than the existing method is proved. Analysis of effect of minimum power requirement on establishing CS is tabulated in Table 3. Here, the power requirement is presented in positive and negative values. The positive value power means the charger count is decreased and the negative value means charging count is increasing. The number of charging is analyzed based on year. Table 4 depicts the Comparison of proposed with existing techniques. Here, the efficiency and computational complexity of proposed methods become 95% and 8%. The existing methods, like TSA, GRFO, SPOA, and GA (genetic algorithm) efficiency becomes 79%, 86%, 82%, and 85% and computational complexity becomes 24%, 29%, 37%, and 36%, respectively. From the result the proposed method has higher efficiency while having a low computational complexity compared to the other techniques.
Analysis of the number of repetitions and the simulation time combination.
Comparison of the time of proposed and existing methods.
Analysis of the effect of minimum power requirement on the installation of charging station.
Comparison of proposed with existing techniques.
The results show that this method can significantly improve the economic performance of charging stations, including reducing operating costs. The CQOCRO technique allows for the consideration of multiple objectives, such as minimizing the cost of electricity and maximizing the utilization of charging stations. This method designing and managing an EV charging station network in the event of power demand uncertainty. The proposed technique in designing and managing EV charging stations can lead to more efficient and profitable operations. This is particularly important in the context of increasing demand for EVs and the need to develop sustainable transportation solutions.
Conclusion
The paper proposes a technique called CQOCRO to optimize the design and management decisions of EV charging stations. The technique handles uncertainties such as demand fluctuations and electricity price variations, and can make both short-term and long-term decisions simultaneously. The paper also provides a case study to demonstrate the efficiency of the proposed method. The proposed method is used to solve the excess flow of power because of the power line overheating. The factors like location, type of CS, time of opening CS is determined and effectively manage the resources like grid, PV, V2G. The proposed technique is reduce the operation cost of EV charging stations by optimizing multiple decision variables, such as the number of chargers, the charging power level, and the scheduling of charging sessions. Another economic impact of EV production is the creation of new jobs. The proposed method is done in MATLAB platform. The simulating outcome is analyzed under three cases, such as effect of variation of power demand, effect of minimal power requirement on installing charging-station, effect of power grid disruption and analyzed three scenarios like base case, low variation of charging, high variation of charging. The proposed method shows better results in all methods like TSA, GRFO, and SPOA. From this comparison, it concludes that the proposed method provides optimal outcome than the existing method. Implement a dynamic pricing strategy to encourage EV owners to charge their vehicles during off-peak hours to minimize the load on the grid during peak hours and reduce the cost of charging. Consider the use of renewable energy sources, like solar power to create electricity for EV charging stations to reduce dependence on fossil fuels and decrease greenhouse gas emissions. Future research can explore the applicability of the proposed technique to more complex and dynamic scenarios.
Footnotes
Declaration of conflicting interests
The authors declared no potential conflicts of interest with respect to the research, authorship, and/or publication of this article.
Funding
The authors received no financial support for the research, authorship, and/or publication of this article.
B Venkata Prasanth received the BTech Degree in Electrical & Electronics Engineering from Sri Krishnadevaraya University & MTech Degree in Electrical Power Systems from Jawaharlal Nehru Technological University, Ananthapur, India. He received his PhD degree in Electrical & Electronics Engineering from Jawaharlal Nehru Technological University, Hyderabad, India in year 2009. He has got a teaching experience of more than 21 years. Currently, he is working as Professor in Electrical & Electronics Engineering Department and Dean of Academics & Quality Control, QIS College of Engineering and Technology, Ongole, India. He has published 107 papers in various National & International Journals & Conferences. He guided 05 number of research scholars and guiding 03 numbers in various topics of Electrical & Electronics Engineering. His research interests include application of Intelligent Controllers to Power System Control Design, Power System Restructuring, Power System Economics & Optimization.
B Mouli Chandra is a Professor at QIS College of Engineering & Technology, Ongole, Andhra Pradesh, India. He received his PhD from faculty of Electrical & Electronics Engineering, Jawaharlal Nehru Technological University (JNTUH), Hyderabad in 2015 and MTech (Power Electronics) from Rajeev Gandhi Memorial College of Engineering and Technology (Autonomous), Nandyal, Kurnool Dist., A.P in the year 2007. He received his BTech in Electrical & Electronics Engineering from Jaya Prakash Narayan College of Engineering (Autonomous), Mahabub Nagar, Telangana, in the year 2004. He has more than 15 years of experience in teaching, research. His research interests include Power electronic converters, Power electronics control of AC & DC Drives, Power Grid integration & Electric vehicles.
C Subba Rami Reddy is a Professor and Asso. HoD, Electrical and Electronics Engineering, B V Raju Institute of Technology, Vishnupur, Narsapur, Medak, Telangana, India – 502313. He received the BE degree in Electrical and Electronics Engineering from the University of Madras, Chennai, the MTech degree in Power Systems Operation and Control from S.V. University, Tirupati, and the PhD degree in JNTUH, Hyderabad in 2000, 2007 and 2015 respectively. He has 22 years of teaching experience and published 40 research papers. He is the recipient of the NPTEL Discipline STAR award during JAN–APR 2023. Since 2017, he has been with the B V Raju Institute of Technology, Narsapur, Medak, Telangana where he is currently Professor and Associate HoD of Electrical and Electronics Engineering. His current major research interests include the design of power converters for drives, smart inverter for solar PV systems, Modular multilevel converters, Generation of PWM pulses for power converter switches using Labview based NI myRio, DSP processors and FPGA kit using the appropriate control strategy.
T Murali Krishna received UG degree from Institution of Engineers (India), Kolkata in 2001, the MTech in Electrical Power Systems and PhD from JNTUA, Anantapuramu in 2005 and 2016 respectively. He is presently working in Chaitanya Bharathi Institute of Technology as an Associate Professor in the Department of EEE. His research interests include Multi Level Inverters, FACTS, Wavelets, renewable energy integration etc.