
Abstract
Shrimp consumption is increasing owing to its rich nutrition and delicious taste. As a result, the generation of shrimp shell waste is also increasing, while the current disposal method such as landfilling causes pollution and produces harmful leachate to living organisms and the environment. Therefore, a proper management strategy is needed to dispose of shrimp shell waste to mitigate the adverse effects caused to the environment. This study presents an in-depth approach to reveal the properties of shrimp shell waste and explore its potential for use in various applications. The shrimp shell waste was subjected to pyrolysis–gas chromatography/mass spectrometry and thermogravimetric-Fourier transform infrared spectroscopy pyrolysis to evaluate the gas composition from pyrolysis. Thermogravimetric-Fourier transform infrared spectroscopy analysis reveals that when the optimal temperature for pyrolysis is 400 °C–600 °C, the predominant functional group of gases produced are –CH, –OH, and –NH. On the other hand, the results of pyrolysis–gas chromatography/mass spectrometry indicate that hydrocarbon (51.86%) is the main product of shrimp shell waste pyrolysis at 900 °C, which can be used in paints, paint thinners, rubber, printing inks, adhesives (glue). Although it has a calorific value of 15.113 MJ/kg, it cannot be directly burned because of its high nitrogen concentration (10.85 wt.%) which may generate harmful pollutants such as nitrogen oxides. Overall, pyrolysis is recommended as a viable method for converting shrimp shell waste into versatile products.
Introduction
With its delicious taste and nutritional value, shrimp has become a popular delicacy among people due to improved living standards. As per the Food and Agriculture Organization of the United Nations, 1 the United States emerged as the leading consumer of prawns in 2019, which consumed 496,287 tonnes. Shrimp is usually exported frozen with or without the shell. Therefore, about 50%–60% of the non-edible parts are discarded as waste materials, such as shrimp heads, tails, and shells. 2 Due to the popularity of shrimp dishes, large amounts of shrimp shell waste (SSW) are generated. Approximately 6–8 million tons of SSW are discarded annually, posing a pressing environmental concern.3,4 Most of the SSW produced by the factory is sent to landfills or dumped into the sea,5,6 while some SSW are sent to waste treatment plants for incineration. 7 These treatments have caused enormous damage to the environment. For example, the rapid decomposition of these wastes after being buried in landfills will lead to the proliferation of flies and mosquitoes, spreading diseases and affecting people's health. 8 Furthermore, due to their high nitrogen content, the incineration of SSW also produces toxic gases such as nitrogen oxides. 9 Consequently, there is a need for efficient and environmentally friendly treatment methods to reduce adverse effects on human health caused by current disposal methods.
Pyrolysis is a highly promising thermochemical process for creating solid and volatile products including gases and liquids under an inert environment. The results are affected by various parameters, including feedstock qualities, heating rate, and temperature. 10 It is possible that SSW could be transformed into products with added value due to its high levels of calcium, nitrogen, and phosphorus.11–14 Thermogravimetric analysis and Fourier transform infrared spectroscopy (TG-FTIR) may be employed together to identify and investigate the gas products formed during the pyrolysis of SSW. This instrument can identify the main gaseous products at 30 °C–900 °C. 15 But, TG-FTIR has limitations, such as a low heating rate (< 50 °C/min) and can only detect small molecules and compounds with low boiling points. 16 This limitation can be avoided by employing pyrolysis in tandem with gas chromatography/mass spectrometry (Py-GC/MS). Py-GC/MS may be used to scrutinize the pyrolysis behavior of biomass/waste material at varying heating rates and ultimate pyrolysis temperatures. 17 When using Py-GC/MS to detect the gaseous products emitted during SSW pyrolysis, there are limitations in terms of CO, H2, and CO2, while TG-FTIR can detect the release of light gases according to the temperature change, so it can pass use TG-FTIR to compensate for this limitation. Therefore, in order to accurately determine the gas composition emitted by SSW pyrolysis, it can be analyzed by combining TG-FTIR and Py-GC/MS.
Wastes including MSW, biomass, and food scraps have all been put through PyGC/MS and TG-FTIR analyses to resolve their pyrolysis behavior and gaseous products.18–22 In preceding works, some useful findings were found, such as the product distribution of the exhaust gas, the activation energy, or the pyrolysis kinetic model at a specific pyrolysis temperature. For instance, Ahmed et al. 23 employed Py-GC/MS and TG-FTIR to scrutinize the pyrolysis kinetics and gases emitted during SSW pyrolysis. According to the study, gases such as alcohol, carbon dioxide, amine, and alkanes could be detected at 800 °C.
The composition of pyrolysis gases has been investigated extensively in the past, yielding a plethora of useful information. To the best of our knowledge, in the existing research literature, there are few comprehensive studies on the gas composition and pyrolysis behavior of SWW combined with Py-GC/MS and TG-FTIR. By integrating Py-GC/MS and TG-FTIR, this work examined the gas composition and pyrolysis behavior of SSW in detail. As a result, a new technique for recovering value-added products from SSW could be developed.
Materials and methods
Procurement and pretreatment of SSW
Penaeus orientalis (shrimp) was selected as the feedstock in this study. The raw shrimp was purchased from Jingba Road Seafood Market, Zhengzhou, China. Firstly, the collected shrimp was boiled with 100 °C water to ease the separation of the shrimp body, shell, heads, and tails. Next, the shrimp shells were dried in an oven for 5 h at 105 °C to eliminate any moisture present (Figure 1(a)). Finally, a grinder (model: 2500Y) was used to grind shrimp shells into powder, and a particle size of < 125 mm was sieved. Upon completion of the sieving process, the resulting powder was carefully transferred into a hermetically sealed container to be safely stored for future use in upcoming experiments (Figure 1(b)).
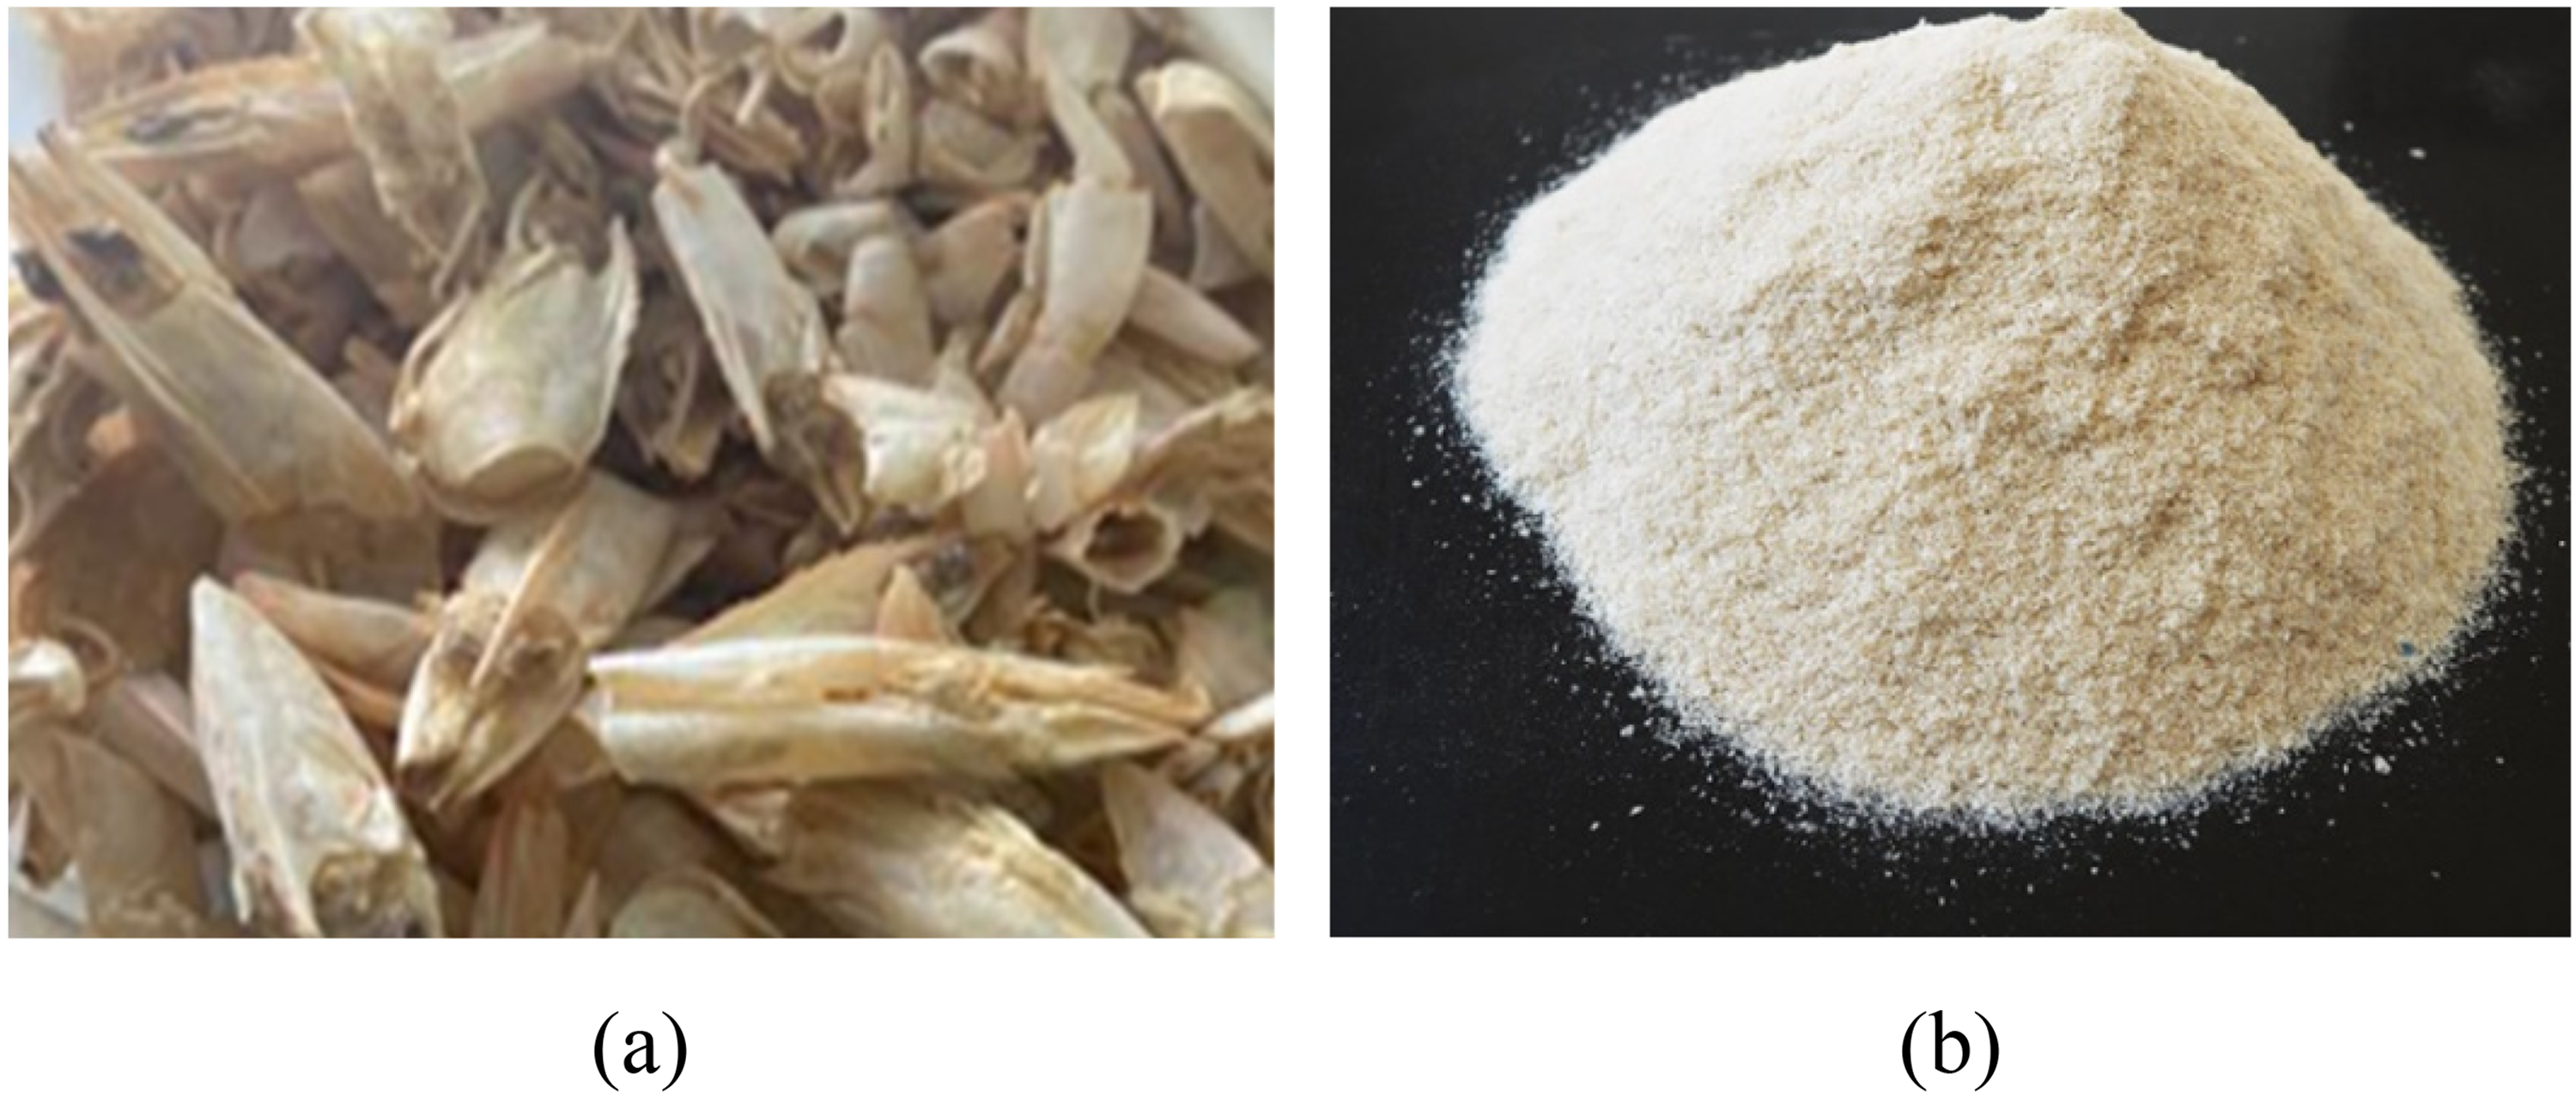
(a) Shrimp shell waste (SSW) from seafood market and (b) SSW in powder form.
Chemical properties of SSW
In order to quantify the hydrogen (H), carbon (C), sulfur (S), and nitrogen (N) present in SSW, a FlashHEA 1112 elemental analyzer manufactured by Thermo Electron Corporation in the USA was adopted. First, the SSW that has been completely dehydrated is encapsulated in tin capsules, and 3 mg of SSW powder is enough, and then analyzed by the automatic sampler of the elemental analyzer. The next step involves heating and incinerating the powder sample at a high temperature of 1000 °C. This process will produce gaseous substances such as water, sulfur, and carbon dioxides to detect S, H, and C through infrared absorption. Detectors of thermal conductivity were then utilized to quantify the nitrogen content. The mass differences were then utilized to calculate the oxygen (O) content using the following formula: O (oxygen) = 100 wt.%-carbon–hydrogen–nitrogen–sulfur.
Energy properties of SSW
The energy properties of SSBs were determined by calculating the high heating value (HHV), fuel ratio (FR), and the molar ratios of H/C and O/C. The term “HHV” stands for the maximum heat produced when a material burns.
24
The bond energy among H, C, and O in SSW can be obtained by calculating the molar ratios of H/C and O/C.
25
The fuel characteristics of solid fuels are determined by FR. If the FR value of the sample is too low, the combustion speed will be too fast, which is inappropriate for direct application as fuel.
25
The following equations are the calculation methods of HHV, FR, H/C, and O/C (equation (1) to (4)).


Thermogravimetric analysis
SSW was analyzed at a fixed nitrogen flow rate of 50 mL/min using an STA-8000 thermogravimetric analyzer manufactured by PerkinElmer, USA, to determine the approximate analysis of volatile compounds, moisture content, and fixed carbon. From 30 °C to 900 °C, a 10 mg sample was heated at 25 °C/min. Weight loss was utilized by weighing samples at 150 °C and 550 °C, respectively, to determine the sample's water content and volatiles. Equation (5) was utilized to calculate the amount of fixed carbon:

Thermochemical analysis using TG-FTIR
The product composition and pyrolysis behavior of SSW were scrutinized with the aid of a Fourier transform infrared spectrometer (FTIR) and thermogravimetric analyzer (TA Instruments, New Castle, USA, TGA Q500) shown in Figure 2. The SSW was heated in the TG analyzer at a 25 °C/min heating rate. Using a 50 mL/min nitrogen flow rate, 10 mg of samples were heated from 30 °C to 900 °C. For dynamic process control and to accommodate potential sample temperature gradients, a sample weight of 15 mg per run was ensured. In order to prevent any potential condensation of gas and subsequent reactions, it is imperative to maintain a temperature of 200 °C when introducing exiting gas into the gearbox line (Gu et al., 2013). The infrared spectral recording resolution range was set to 400–4000 cm−1, the scanning frequency to 64 scans/min, and the recording resolution to 4 cm−1. Utilizing the spectral database, analyze the FTIR spectra of the SSW.
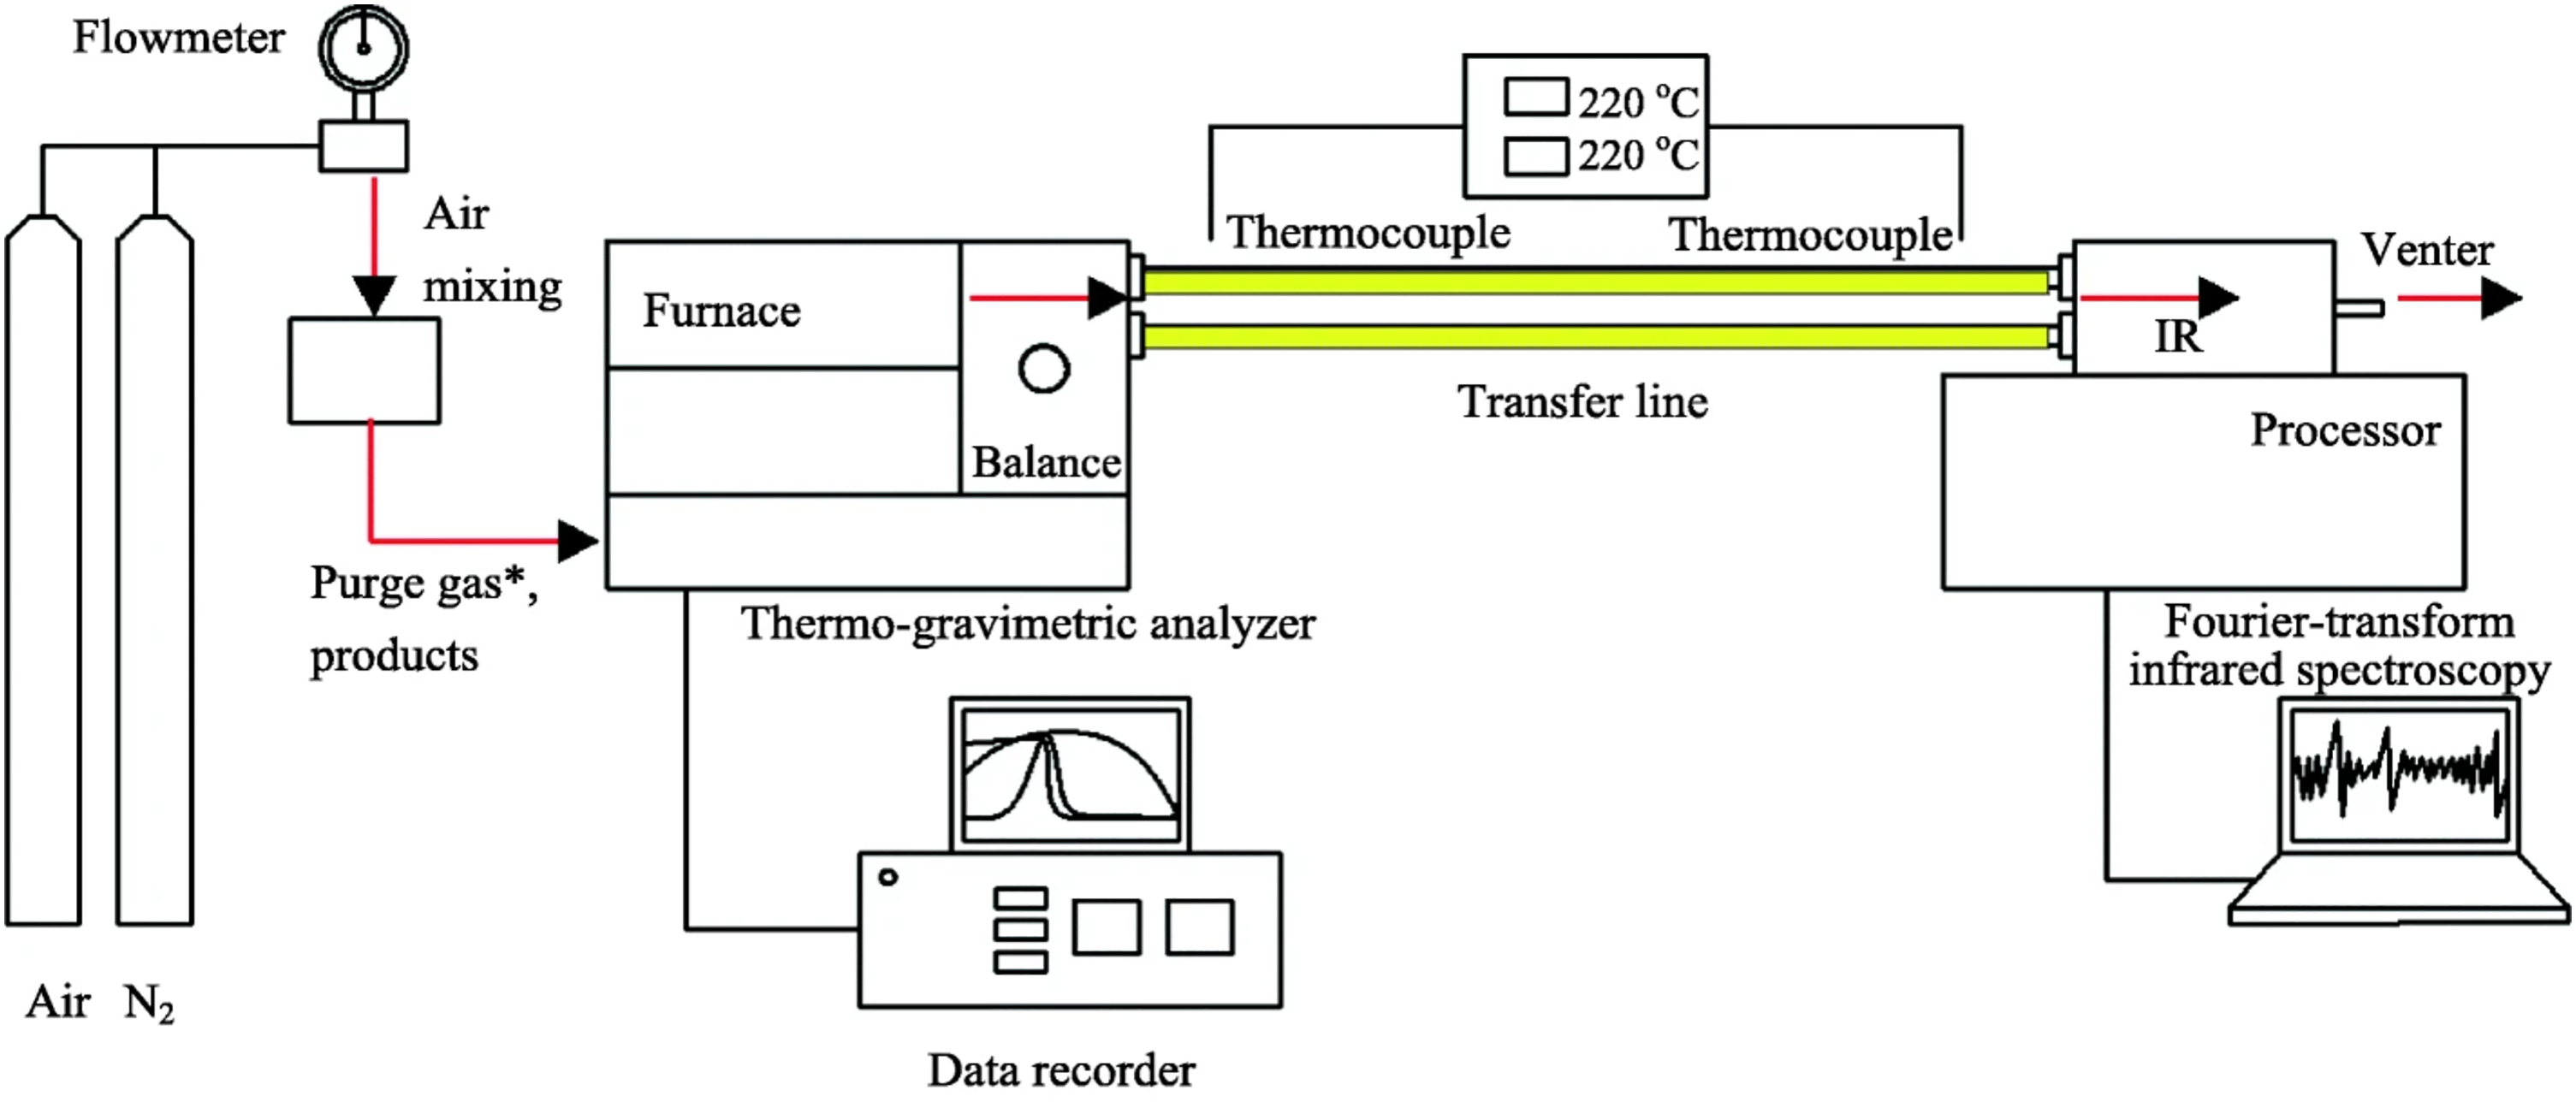
Schematic diagram of thermogravimetric analysis and Fourier transform infrared spectroscopy (TG-FTIR). 26
Py-GC/MS analysis
Figure 3 shows the pyrolysis apparatus (Frontier EGA/PY3030D, Frontier, Japan) in conjunction with gas chromatography (TRACE1310, Italy) and mass spectrometer (ISQ, USA) was used to analyze gases emitted from the pyrolysis of SSW. The impact of pyrolysis temperature on the composition of SSW gas was studied by selecting 300 oC, 500 oC, 700 oC, and 900 oC as the pyrolysis temperatures, 30 s as the pyrolysis duration and 50 oC/min as the heating rate. The pyrolysis product delivery line and sampling valve temperature were set to 320 oC to prevent gas condensation. Gas chromatography separated pyrolytic vapors on a polar quartz capillary column (30 m × 0.25 mm × 0.25 m). The shunting mode employs a 100:1 shunt ratio and 50 mL/min shunt rate. Starting at 50 oC, the GC/MS temperature was held for 1 min before being raised to 300 oC at 10 oC/min. The ion source temperature was 300 oC, the mass spectrometer's scanning range was 40,800 amu at 70 eV electron energy, and the transmission line temperature was 320 oC. Utilizing the NIST mass spectrometry library, the gas composition was determined. At least three analyses were conducted to ensure that the experiment could be repeated and the results could be averaged.
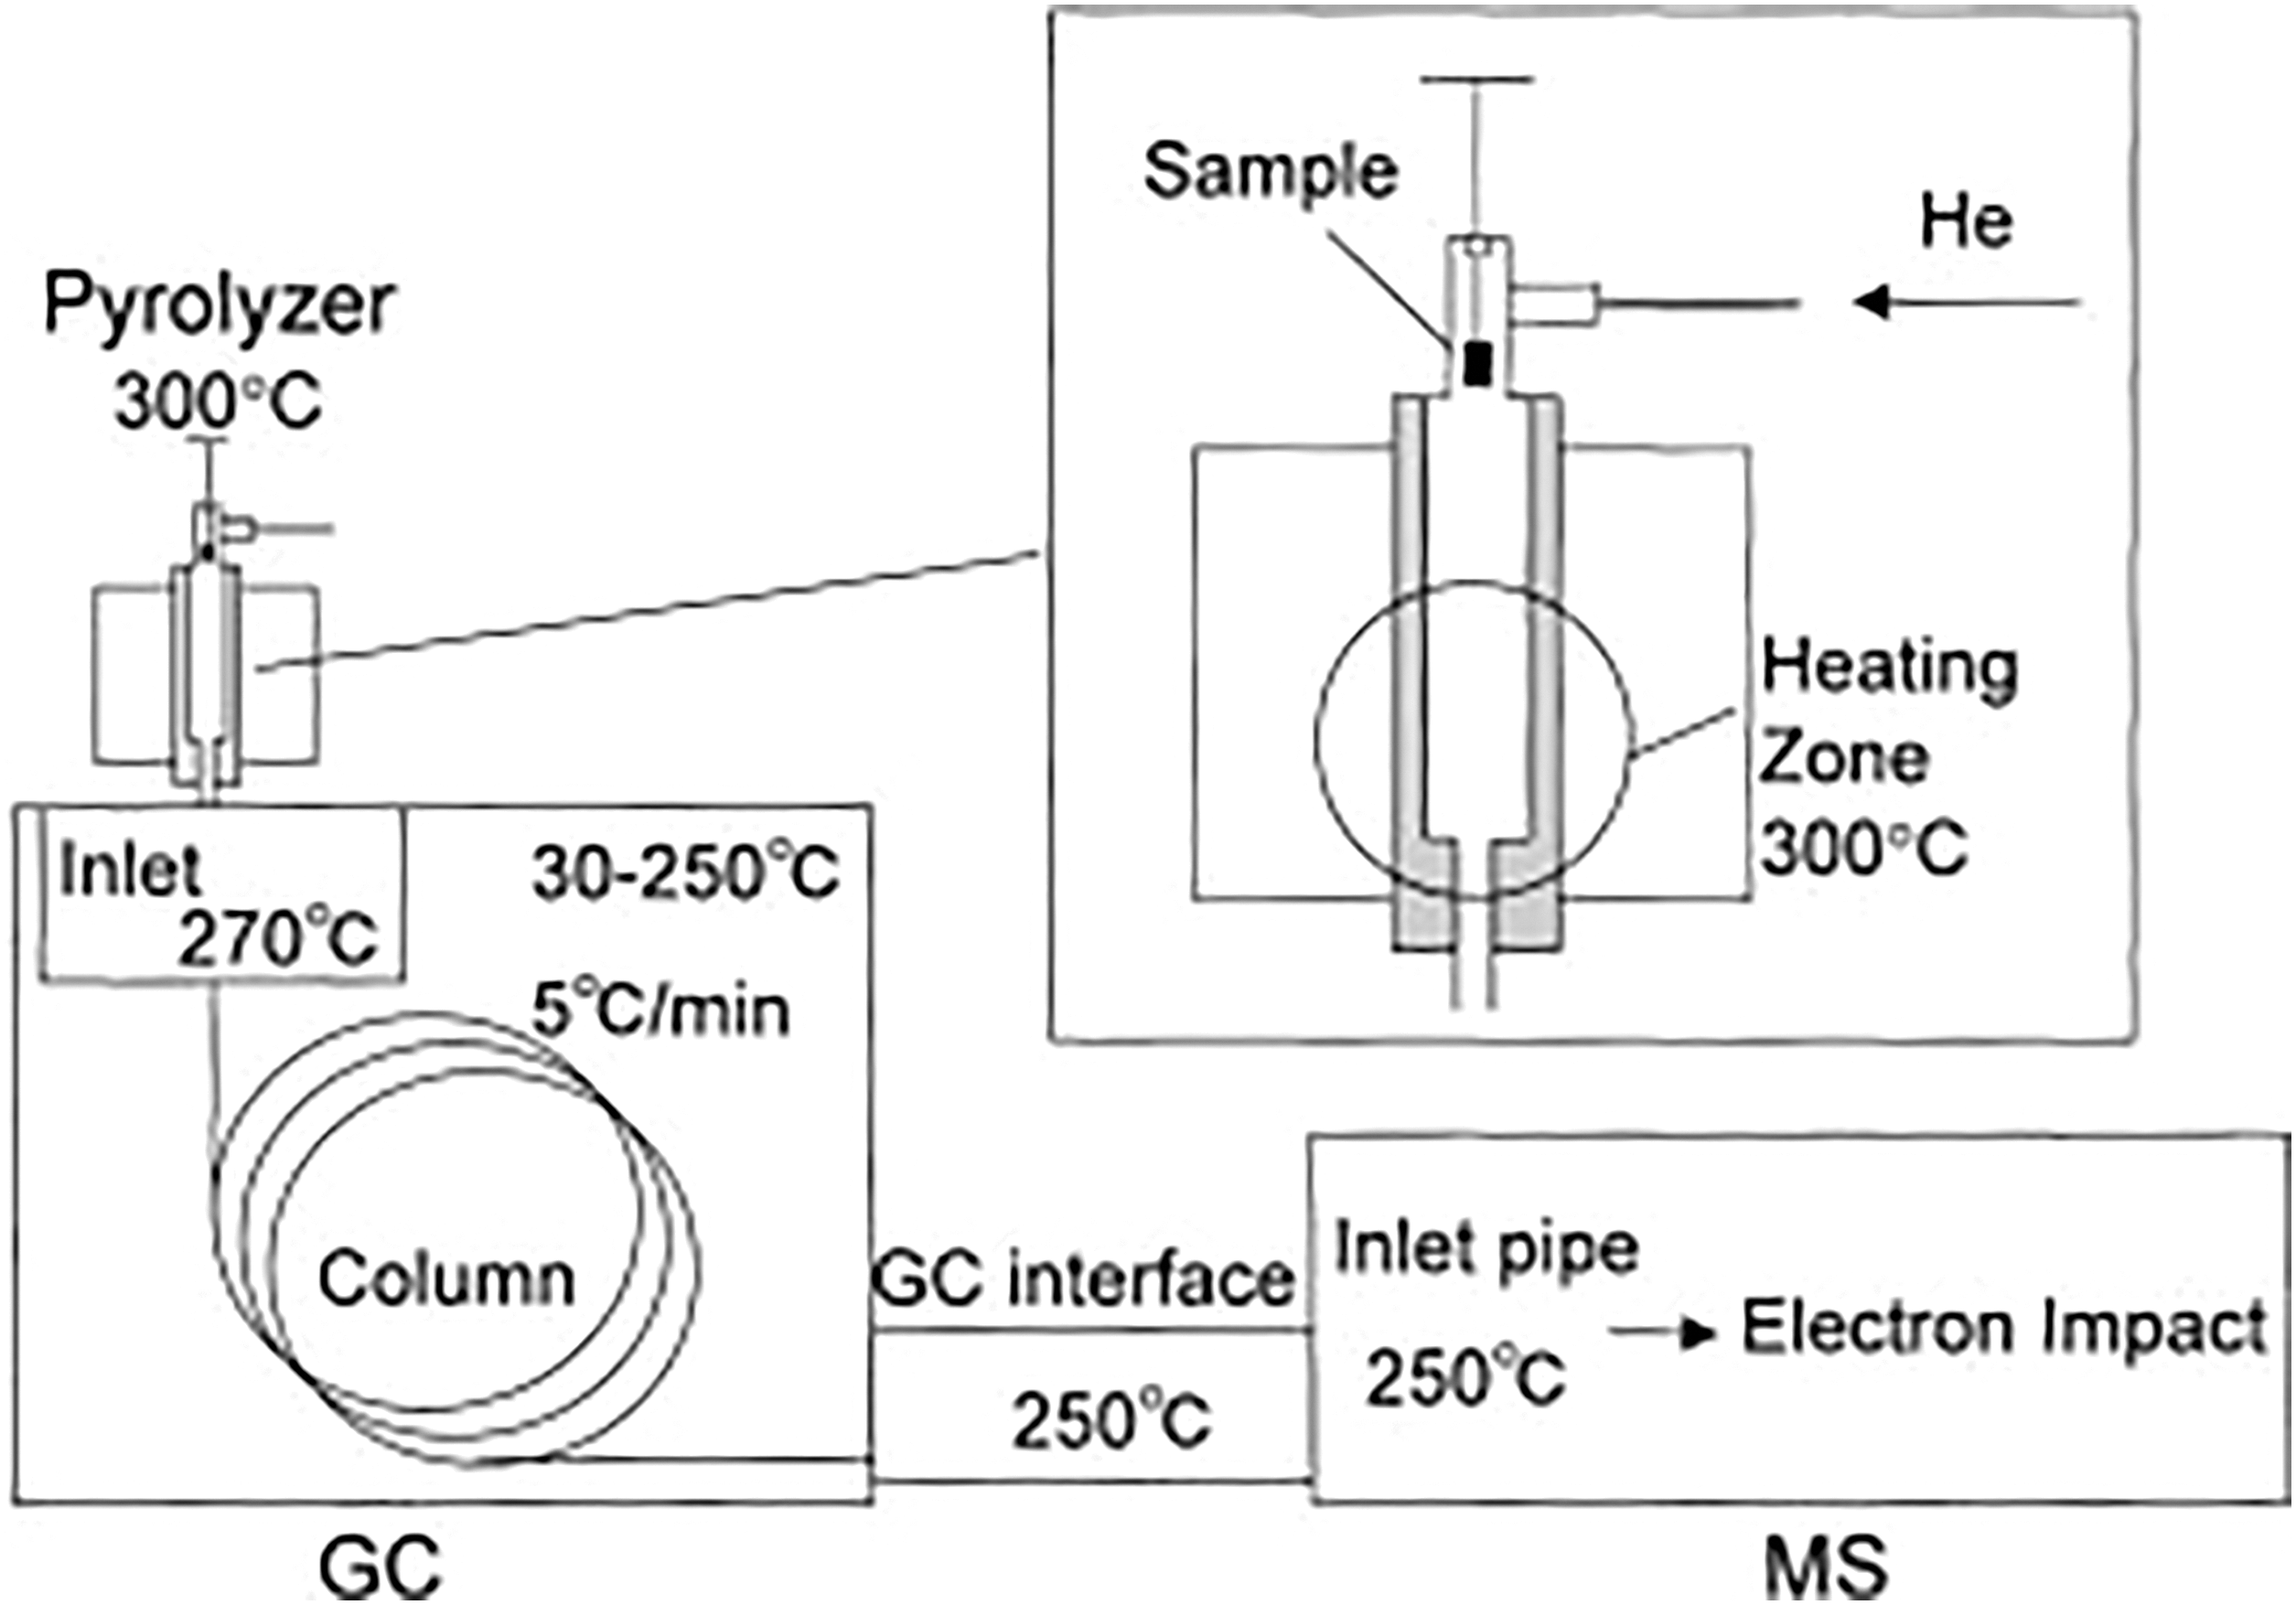
Schematic diagram of pyrolysis in tandem with gas chromatography/mass spectrometry (Py-GC/MS).,49
Results and discussion
Chemical properties of SSW
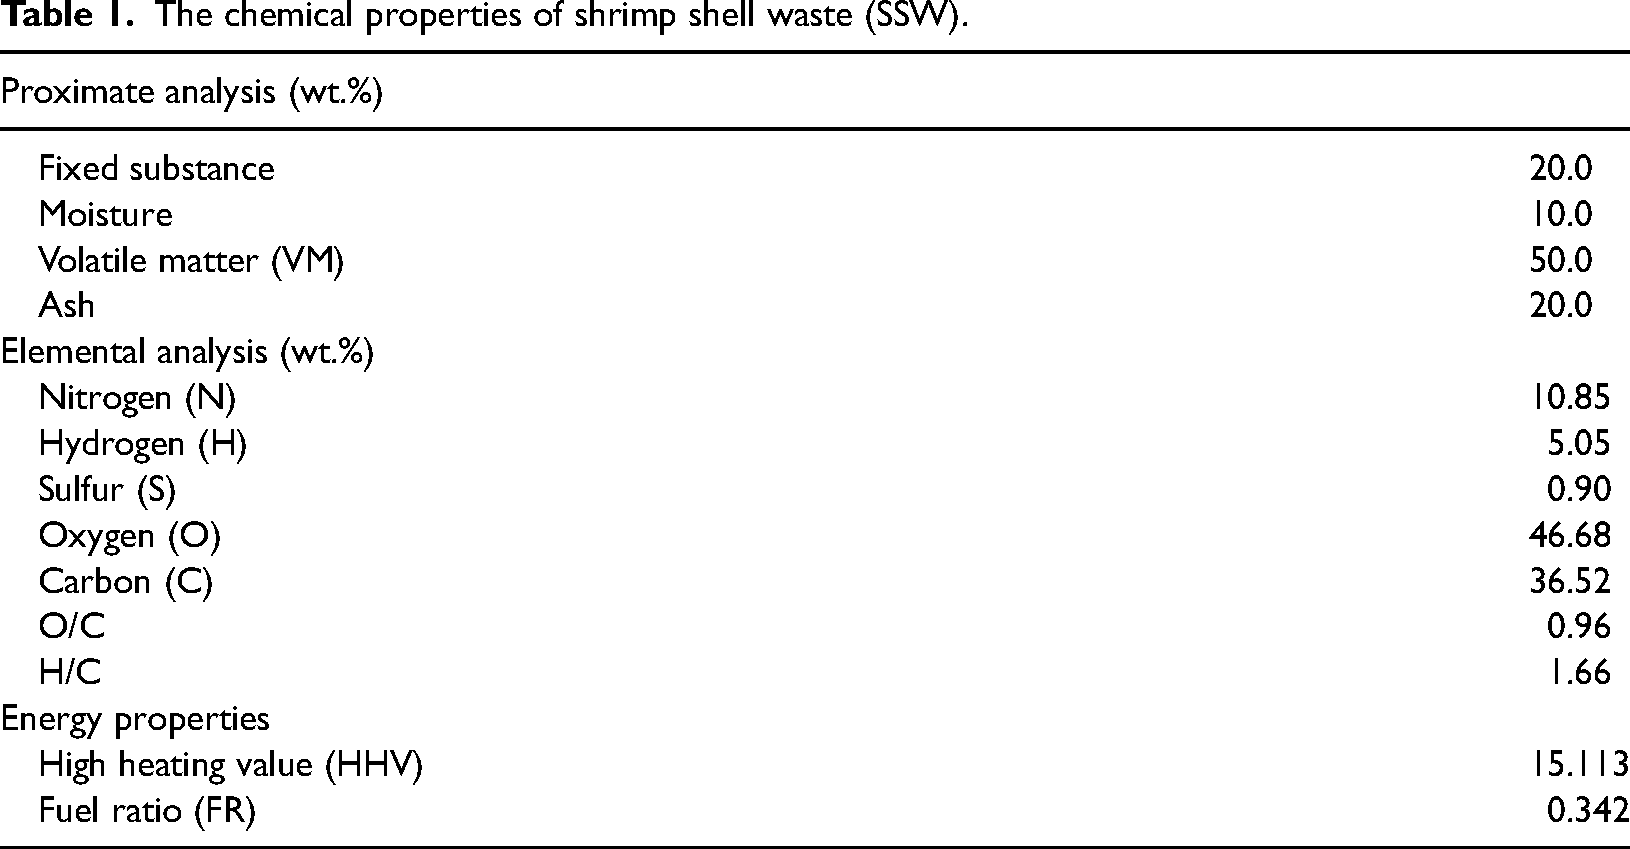
Table 1 demonstrates the chemical properties of SSW at different heating rates. The main elements in SSW were oxygen (O) (46.68%) and carbon (C) (36.52%), followed by nitrogen (N) (10.85%) and hydrogen (H) (5.05%), and sulfur (S) was about 0.902%. SSW contains many C and O derived from the protein and CaCO3 in the shell. 27 As shown in Table 1, the HHV of SSW was 15.11 MJ/kg. SSW contains a considerable amount of N and S, while combustion of SSW will produce NO, NO2, SO2, and other harmful gases; hence it is not recommended to be burned directly for disposal. 28 Compared with direct combustion, SSW can produce bio-oil through pyrolysis. In previous studies, it was found that bio-oil emits less polycyclic aromatic hydrocarbons and NOX during the combustion process and has the potential to be used as a fuel. 29 Therefore, SSW is not suitable for direct combustion to avoid the emission of harmful gases, and bio-oil can alleviate this situation. Besides that, the FR of SSW was in the range of 0.336–0.342, while a lower FR denotes ineffective combustion and increased emissions of air pollutants. 28 Therefore, SSW is not suitable for direct combustion.
The chemical properties of shrimp shell waste (SSW).
Thermogravimetric analysis
Figure 4 depicts the SSW's TGA curve. In this experiment, we observed the TGA curve of the SSW at two distinct heating rates of 10 °C/min and 25 °C/min. The mass reduction can be broken down into three phases. The initial 10% mass loss before 200 °C was attributed to the evaporation of moisture and the decomposition of the lipids component. The second decomposition temperature ranges between 200 °C and 600 °C. Approximately 50% of the weight was lost during this period. In this situation, the degradation of protein and chitin may lead to weight loss. 27
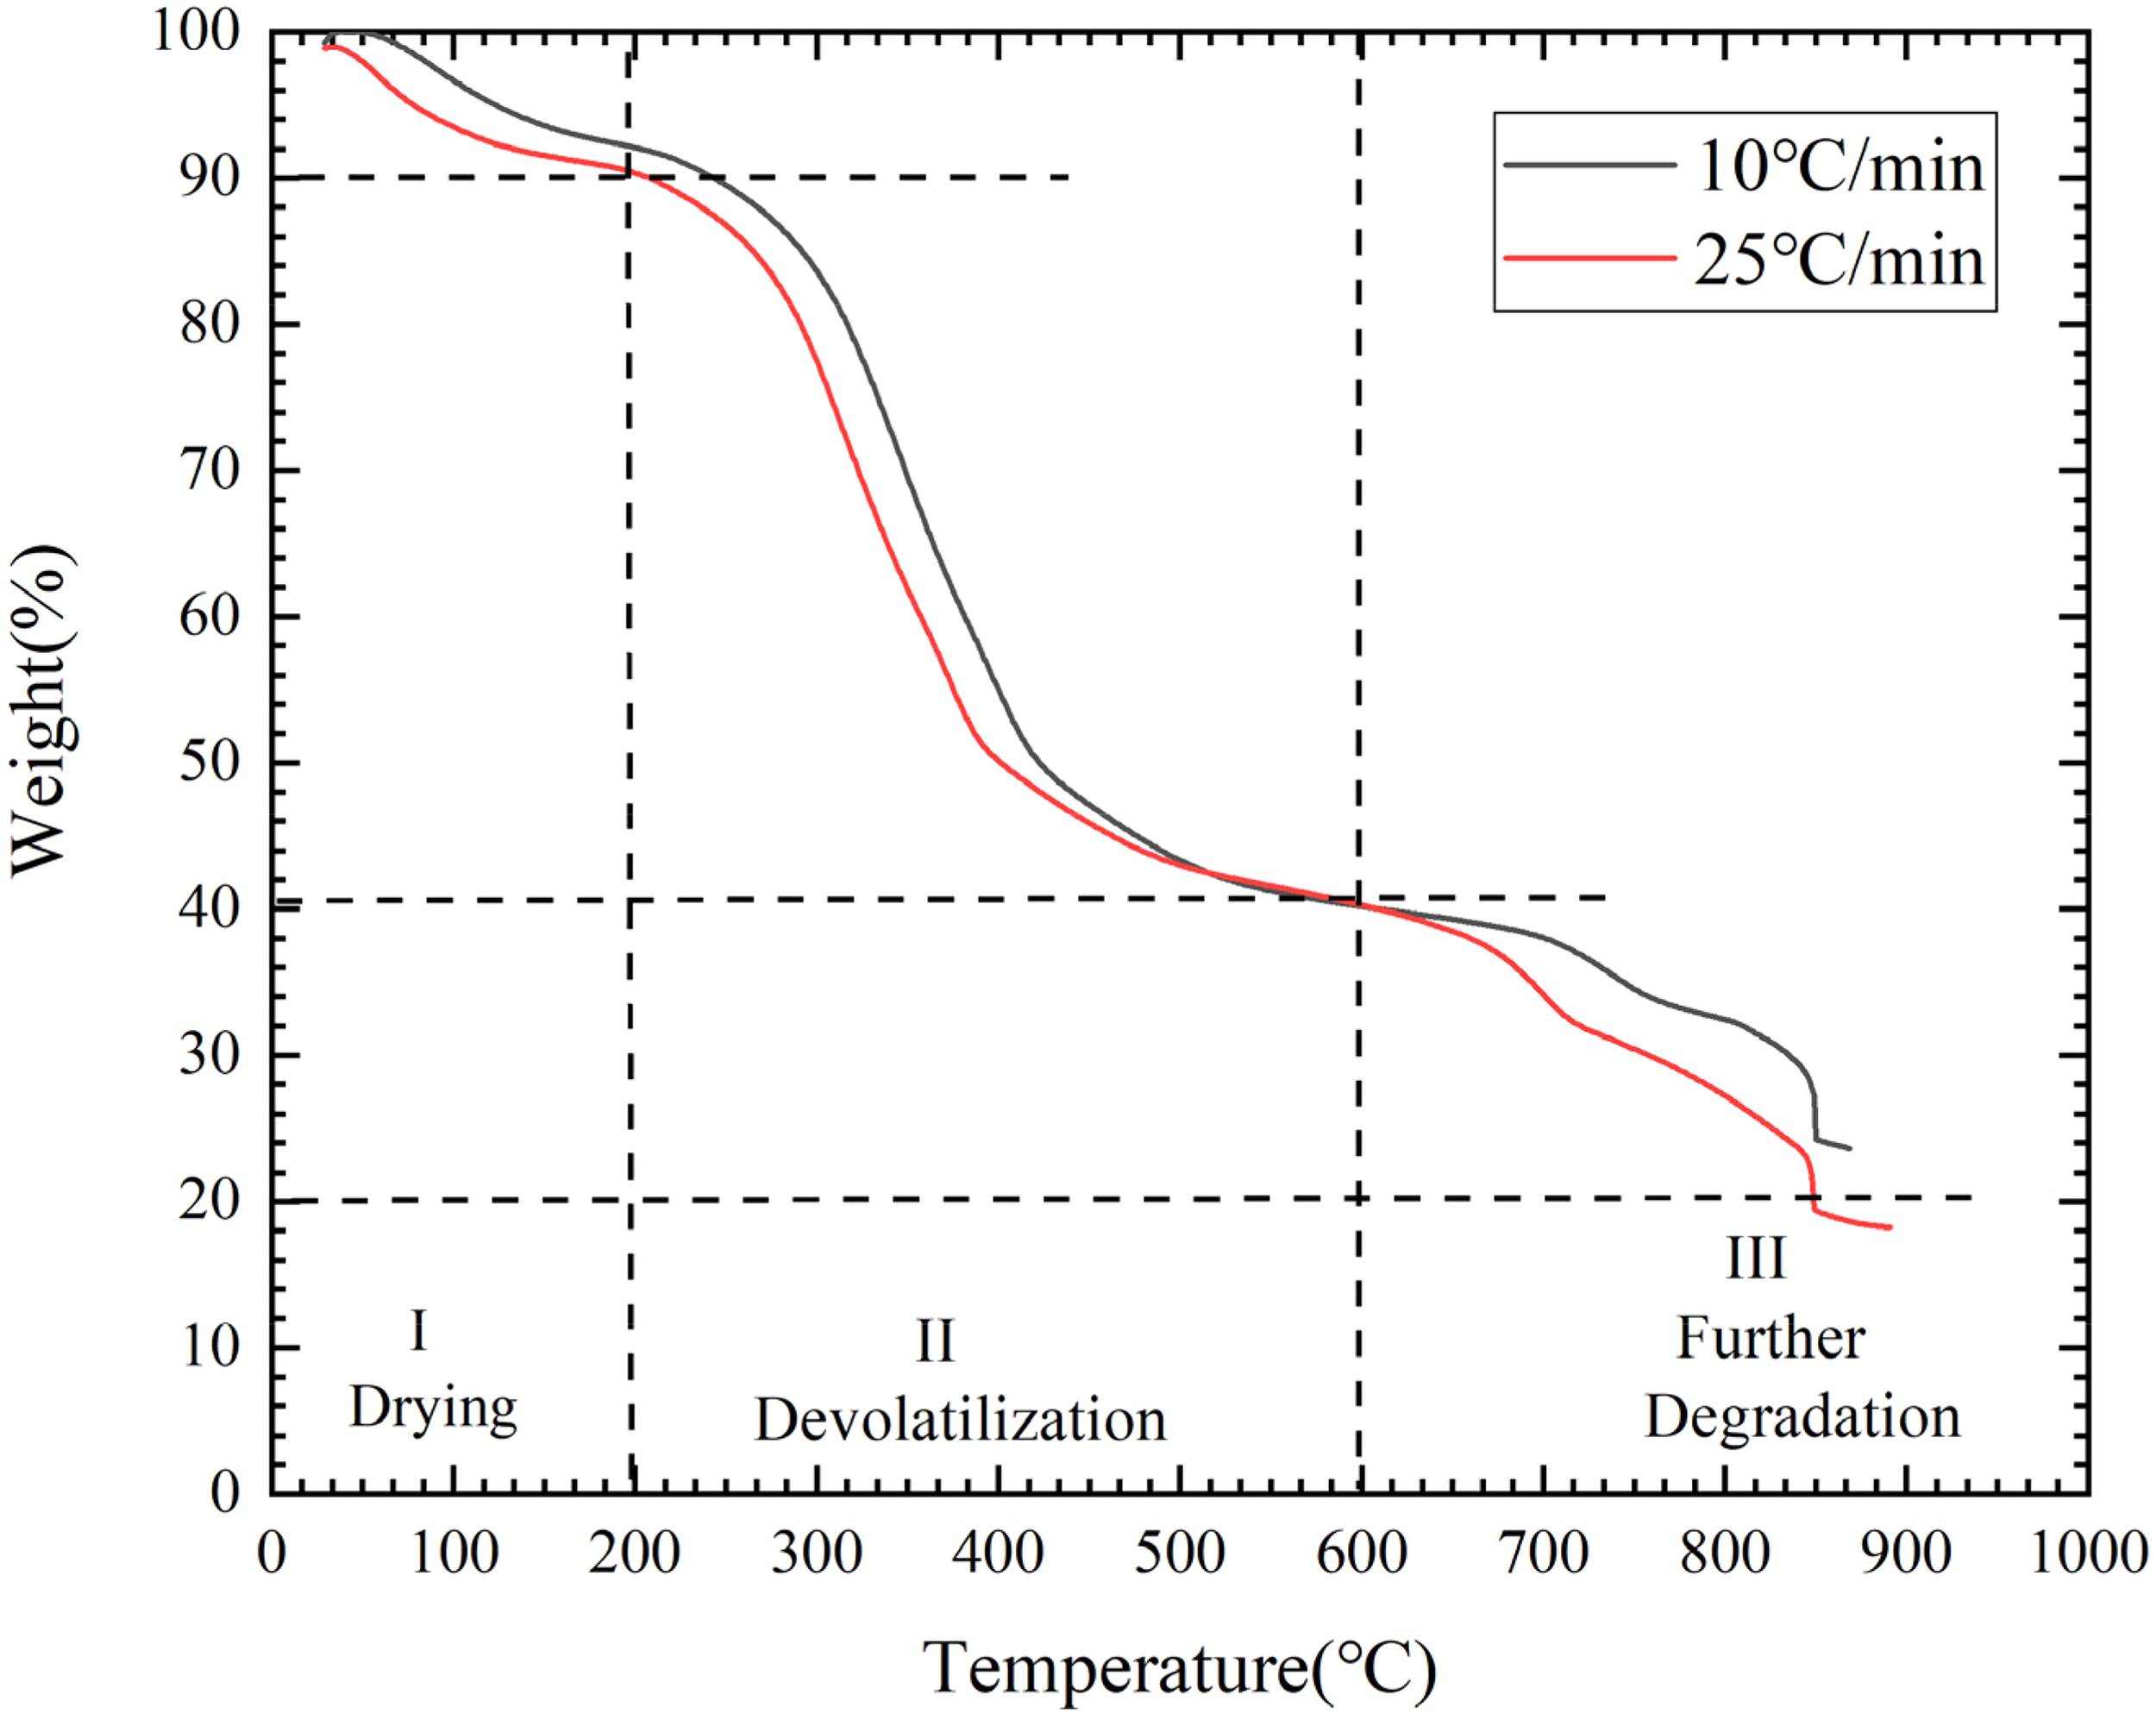
The thermogravimetric analysis (TGA) curves of shrimp shells at heating rates of 10 °C and 25 °C.
About 20% of the prawn shell's weight was lost during the third stage (> 600 °C) due to the secondary decomposition of SSW. High temperatures disrupt chemical bonds and macromolecular compounds in this section.30,31 It has been observed through TGA profiles that the heating rate influences the pyrolysis process. This effect is evident across various heating rates. Accelerating the heating process can reduce pyrolysis time by overcoming heat and mass transmission constraints. 27
TG-FTIR analysis
The FTIR spectra of SSW at different temperatures are shown in Figure 5. Through the study of the FTIR spectrum of SSW, it was found that there are components such as CO2, CaCO3, phenols, alcohols, lipids, proteins, carbohydrates, nitrogen-containing functional groups, and furan rings. At 90 °C, peaks detected at 3700 − 3600 and 1700 − 1500 cm−1 were assigned to H2O. This may be due to the evaporation of different forms of water during pyrolysis and the cleavage or reaction of oxygen functional groups. 32 The peaks detected at 2400 and 600 cm−1 belonged to CO2. 33 The release of CO2 is primarily due to the decarboxylation of organic acids, sugar cleavage, and reforming. 33 The FTIR spectra of SSW at 400 °C, 600 °C, and 800 °C do not show noticeable differences. The stretching vibration of −OH was detected in the 3800–3500 cm−1 range, which inferred the existence of phenols and alcohols in SSW. 27 Stretching and bending at 3200 and 3000 cm−1 inferred the presence of C−H due to the dehydrogenation of proteins, lipids, and carbohydrates in the shrimp shell. 34 In addition, C–H bonds can be generated in the pyrolysis of heterocyclic aromatic compounds such as pyridine, pyrrole, and indole. 35 At temperatures between 600 °C and 800 °C, the organic matter undergoes pyrolysis and becomes volatile, causing a fluctuation in the peak.3637–38
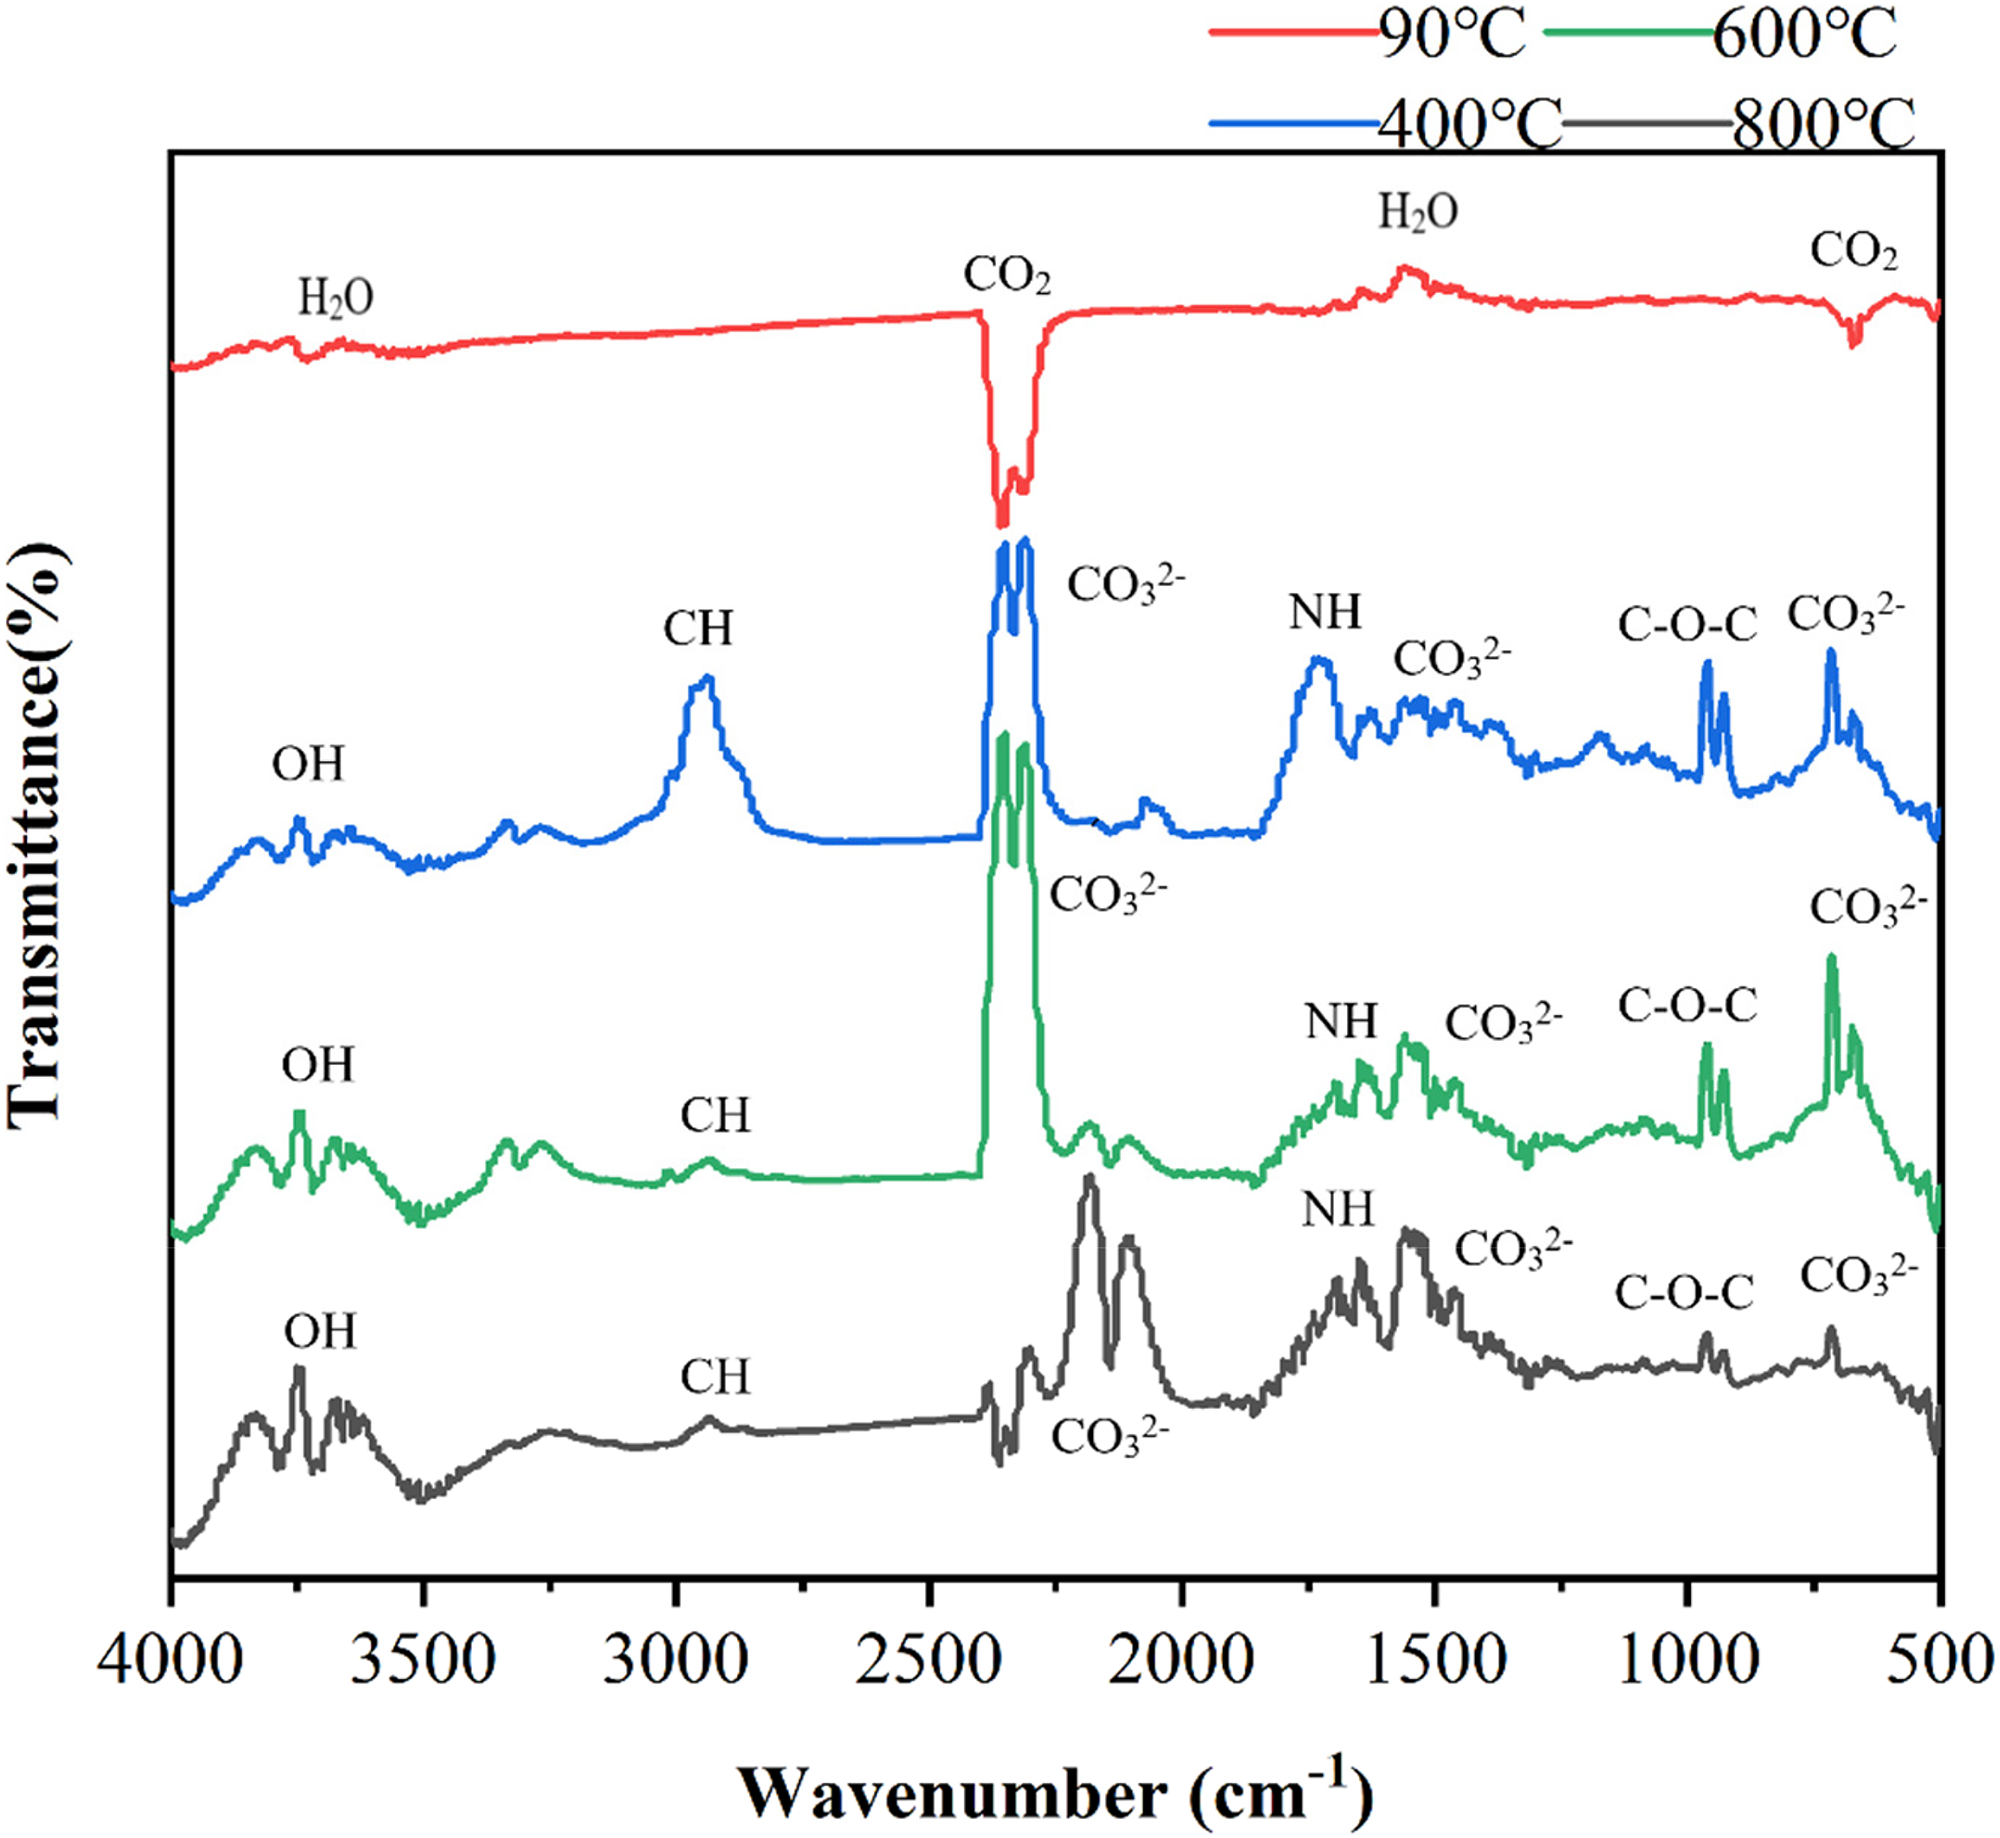
Fourier transform infrared spectroscopy (FTIR) spectra of shrimp shells at different temperatures.
Furthermore, N–H absorption peaks (bending vibrations at 1700–1600 cm–1) were observed, possibly due to the presence of N-containing functional groups in proteins and chitin. 39 The overlapping peaks among 1200 and 1000 cm−1 were ascribed to C–O–C functional groups, which mainly originate from the furan ring, and the elevated temperature promoted the decomposition of the furan ring, shortening the peak at higher temperatures, which can also be detected by GC/MS analysis to confirm (“Py-GC/MS analysis” section).4041–42 The fluctuations at 2300, 1600, and 600 cm−1 are due to the gradual conversion of organic calcium to CaCO3 during CO32− pyrolysis. 27 It can be seen from TG-FTIR that the pyrolysis reaction of SSW is the most violent in the range of 400 °C–600 °C. For example, at 600 °C, glycosidic bonds C–N bonds in chitin, and C–R bonds in amino acids are more likely to occur. lysis. Therefore, 400 °C–600 °C is the optimal pyrolysis temperature range for SSW. 27 From the spectra, it can be concluded that the volatiles released during the pyrolysis of SSW undergo complex decomposition and reformation reactions, while more specific components released were identified via Py-GC/MS.
The optimal pyrolysis temperature range for SSW, as indicated by the FTIR spectra, appears to be between 400 °C and 600 °C. Within this range, key transformations were likely to have occurred, including the decarboxylation process, leading to significant CO2 release. This suggests the efficient degradation of complex organic materials. The spectra also highlight the production of high-value by-products like phenols and alcohols, as evidenced/– by –OH stretching vibrations. Additionally, critical bio-components show signs of dehydrogenation, implying that bonds in these materials are breaking down into simpler, more volatile compounds. Nitrogen-containing functional groups are also being altered, as indicated by N–H absorption peaks, which is relevant for further biochemical applications. Therefore, the 400 °C–600 °C range offers a balanced scenario for multiple objectives: (1) breaking down complex molecules, (2) releasing valuable compounds, and (3) maintaining energy efficiency, making it the most advantageous temperature range for the pyrolysis of SSW.
The pyrolysis of SSW offers significant advantages over direct burning, particularly when high contents of nitrogen-containing chemicals are produced. Direct combustion of SSW with high nitrogen content risks could emit harmful nitrogen oxides, contributing to environmental and health issues such as air pollution and respiratory problems. 43 In contrast, pyrolysis allows for the controlled conversion of SSW into valuable nitrogen-containing chemicals and diverse pyrolysis oils. These products have a wide range of potential industrial applications, from fertilizers to chemical feedstocks, adding economic value to the waste-to-wealth process. Additionally, pyrolysis aligns with sustainable waste management strategies by fully utilizing the resource and minimizing environmental impact, thereby making it a more advantageous and responsible method for SSW treatment. 44
Py-GC/MS analysis
Table 2 illustrates the chemical composition of SSW detected during pyrolysis. These chemical components can be classified into carboxylic acids, hydrocarbons, nitrogen-containing compounds, ketones, esters, alcohols, phenols, sulfur-containing compounds, benzene, aldehydes, and light gases. Among them, olefins, aromatics, and alkanes are classified as “hydrocarbons.” The remaining oxygenates are classified as “other.” The most peculiar is CO2, which is only found at 700 °C and is classified as a light gas. Lower molecular weight compounds could not be detected due to the limitations of GC/MS in detecting light gases. The compounds produced by SSW pyrolysis varied significantly with the pyrolysis temperature. As shown in Table 2, there are different maxima and minima of gaseous compounds. First, in terms of ketones, the percentage dropped from 14.08% (500 °C) to 4.48% (700 °C) and 2.37% (900 °C) at a higher temperature. During the pyrolysis of glucose at 500 oC, the C–C bond breaks and aldol condensation occurs, resulting in a high concentration of ketones (14.08%). 45 Cyclic ketones are also one of the elements that make up ketones. The primary source of cyclic ketones is the cyclisation of 1-deoxyglucose ketone, an intermediate in the Maillard reaction among sugars and amino acids. 46 Proteins denature, the Maillard process accelerates, and more cyclic ketones are produced as the temperature rises. After these reactions peaked at 600 °C, the ketone concentration started to decrease, thus decreasing to 4.48% and 2.37% at 700 °C and 900 °C, respectively. 45
Classification of gaseous compounds in shrimp shell waste at different temperatures.
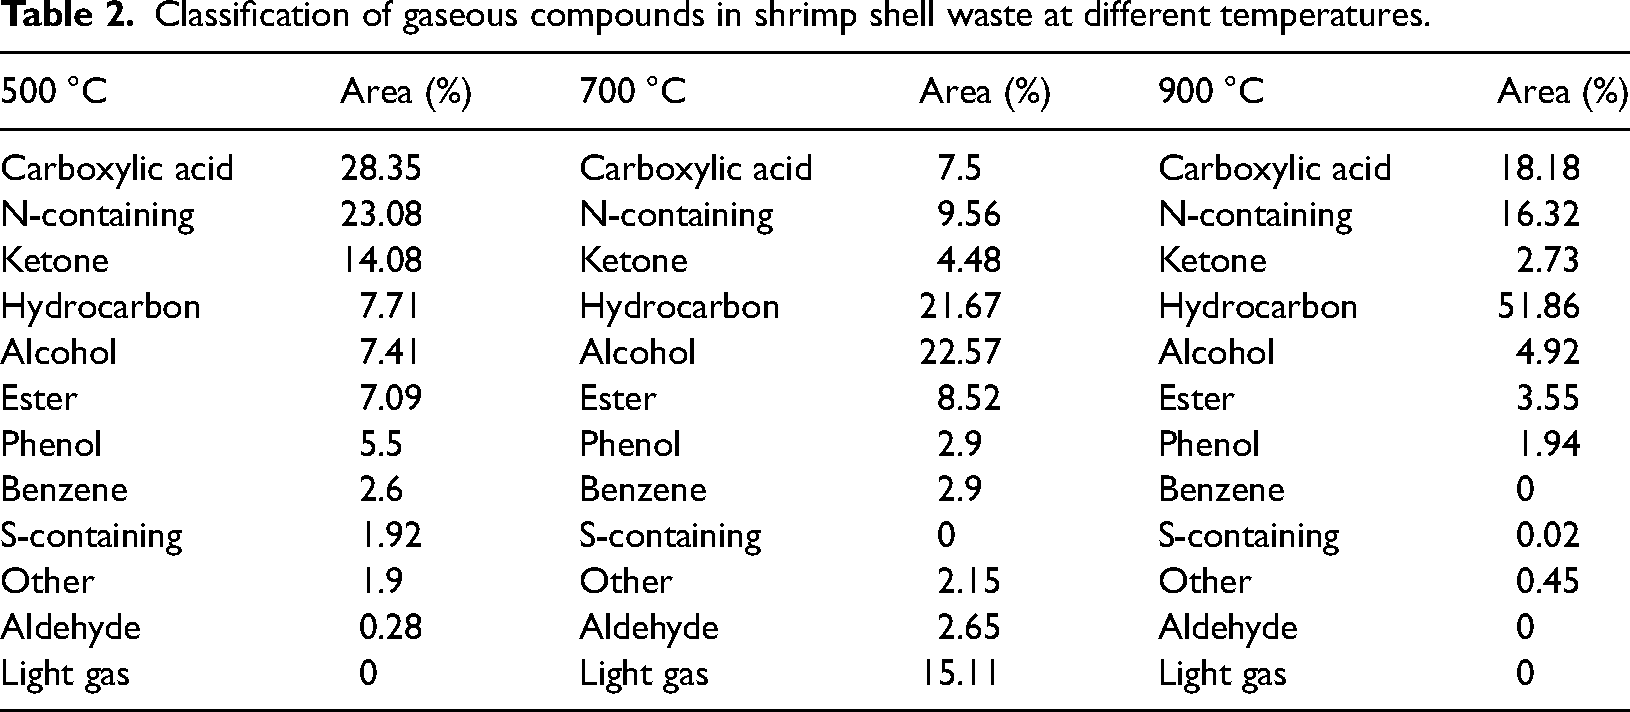
The amount of phenolic chemicals gradually reduced as the temperature rose. The primary source of phenolic chemicals is lignin decomposition, typically occurring at temperatures below 450 °C. 45 At higher temperatures, phenolic compounds are further demethoxylated and alkylated, so as the temperature increases, the proportion of phenolic compounds decreases.47,48 In contrast, the proportion of hydrocarbons gradually climbed from 7.71% to 21.67% to 51.86% as the temperature rose from 500 °C to 900 °C. The breakdown of proteins and the cyclisation of hydrocarbons, which encourages the synthesis of cyclic hydrocarbons, are the leading causes of this increase. 45
The proportion of nitrogen-containing compounds was 23.08% at 500 °C, 9.56% at 700 °C, and 16.32% at 900 °C. Proteins with nitrogen-containing functional groups and chitin start to decompose between 500 °C and 700 °C and therefore show a downward trend. At 900 °C, the Maillard reaction occurs, which causes the amino acids decomposed from protein to react with sugars to generate many N-heterocyclic compounds, increasing the amount of N-containing compounds. 45
At different temperatures, the content of carboxylic acid (28.35%) was the highest at 500 °C, the content of alcohol compounds (22.57%) was the highest at 700 °C, and the content of hydrocarbon compounds (51.86%) was the highest at 900 °C. Moreover, these compounds have high utilization value. Carboxylic acid can be used in polymers, solvents, and food additives. Alcohol can be used as fuel and scientific research or industrial raw materials, and a 50% volume of ethylene glycol in water is widely used as an antifreeze product. Hydrocarbons are used in lubricating oils, bitumen, and waterproofing. Therefore, with pyrolysis, SSW may be transformed into useful byproducts.
Conclusion
This study conducted a series of analyses of SSW and the pyrolytic products of SSW. SSW generates volatiles such as alcohols, esters, and other organic materials through various events throughout the pyrolysis process, including dehydration, depolymerization, cracking, dehydrogenation, and decarbonization. The findings of TG-FTIR analysis suggested that 400 °C–600 °C represents the optimal pyrolysis range of SSW. In addition, Py-GC/MS analysis revealed that the contents of different gas compounds generated by SSW at different temperatures also differed. Among them, at 500 °C, carboxylic acid compounds accounted for the most (28.35%), and at 700 °C, alcohol compounds accounted for the most (22.57%), and at 900 °C, hydrocarbons accounted for the most (54.86%). These compounds can be recycled into value-added products. Therefore, SSW can be efficiently and environmentally friendly recycled using pyrolysis technology into versatile products.
Supplemental Material
sj-docx-1-eae-10.1177_0958305X231215317 - Supplemental material for Pyrolysis recovery and product distribution of shrimp shell waste: Insights from thermogravimetric-Fourier transform infrared spectroscopy and pyrolysis–gas chromatography/mass spectrometry characterization
Supplemental material, sj-docx-1-eae-10.1177_0958305X231215317 for Pyrolysis recovery and product distribution of shrimp shell waste: Insights from thermogravimetric-Fourier transform infrared spectroscopy and pyrolysis–gas chromatography/mass spectrometry characterization by Lingbo Meng, Shin Ying Foong, Peter Nai Yuh Yek, Rock Keey Liew, Abdulnasser M Karami, Meenakshi Verma, Nyuk Ling Ma, Christian Sonne, John Chi-Wei Lan and Su Shiung Lam in Energy & Environment
Footnotes
Acknowledgements
The authors would like to thank Yuan Ze University and Saveetha Institute of Medical and Technical Sciences for the facilities and support provided to Prof Lam. This work was also funded by the Researchers Supporting Project Number (RSPD2023R764), King Saud University, Riyadh, Saudi Arabia.
Declaration of conflicting interests
The author(s) declared no potential conflicts of interest with respect to the research, authorship, and/or publication of this article.
Funding
The author(s) disclosed receipt of the following financial support for the research, authorship, and/or publication of this article: This work was supported by the Ministry of Higher Education, Malaysia, under the Higher Institution Centre of Excellence (HICoE), Institute of Tropical Aquaculture and Fisheries program (Vot 63933 and 56051, UMT/CRIM/2-2/5 Jilid 2(10)). This work was funded by the Researchers Supporting Project Number (RSPD2023R764), King Saud University, Riyadh, Saudi Arabia.
Supplemental material
Supplemental material for this article is available online.
References
Supplementary Material
Please find the following supplemental material available below.
For Open Access articles published under a Creative Commons License, all supplemental material carries the same license as the article it is associated with.
For non-Open Access articles published, all supplemental material carries a non-exclusive license, and permission requests for re-use of supplemental material or any part of supplemental material shall be sent directly to the copyright owner as specified in the copyright notice associated with the article.