
Abstract
While South and Southeast Asian countries have experienced resilient economic growth over the years, the region has also been a global hotspot for biodiversity loss. Thus, this study examines the income-biodiversity loss nexus within the framework of the N-shaped environmental Kuznets curve (EKC) for South and Southeast Asian countries by employing annual sample data over the period of 2013–2019. The N-shaped nexus between income and biodiversity loss is analyzed using the negative binomial regressions to deal with count outcomes and to overcome the over-dispersion issues. The estimation results consistently depict that the N-shaped EKC hypothesis holds true for South and Southeast Asia in both the aggregated model and disaggregated models (eight taxonomic groups). It is discovered that the threatened species rises when income reaches between $11,607 and $16,329 and declines when income goes to $38,880 and $52,303 over the sample period. Agricultural land and threatened species are positively related. Further, the control of corruption can lessen the decline in biodiversity. Our study reveals some important policies to achieve sustainable development without affecting the health of ecosystems in South and Southeast Asia.
Introduction
At present, one million animal and plant species are facing the risk of extinction globally. Amongst others, more than 40% of the amphibian species, approximately one third of reef forming corals and 33% of the marine mammals are endangered. For land-based animals, the number of species has shrunk by 20% since early twentieth century. 1 Such major losses in biodiversity are mainly due to overexploitation of natural environment, climate change and pollution. 2 To be consistent with the rapid growth in population size and economic development, land clearing activities for the purpose of raising livestock, producing woods and expanding urban spaces have been rampant globally. Diminishing natural habitats can cause animals to compete over limited food supply that in turn leading to the extinction of some of the species. Climate change is another important culprit contributing to biodiversity loss. Extreme weather conditions have caused a large amount of species to migrate to areas which are not suited for and intensifying the rates of mortality for certain organisms. On the contrary, the destruction of the natural environment would dampen nature's ability to absorb carbon dioxide in the atmosphere, causing more severe climatic change in the years to come. 3 In addition, the survival of animal and plant species can be at stake due to pollution problem. Environmental degradation tends to destroy their natural habitats. For instance, contaminated water adversely affects the food chains for organisms living in or nearby oceans and rivers, and cause some of these species to go extinct.
According to the United Nations, 1 the current biodiversity crisis is expected to deter the achievement of most of the Sustainable Development Goals (SDGs), including SDGs pertaining to poverty, hunger and health. a Thus, biodiversity loss is not merely an environmental issue, but also leading to adverse economic and societal impacts. With the extinction of a variety of species in the nature, the ecosystem would not be able to function in a proper manner. For instance, deforestation destroys animal habitat and nutrients transport services that trees can furnish to the ecosystem. On the other hand, human beings depend heavily on plants and animals for food and medicine. b Declining biodiversity, therefore, affects the well-being of human beings by threatening the global food security and limiting the development of new drugs for future diseases. 4 Moreover, the economic costs of biodiversity loss are huge. The world has to bear trillions annually for activities such as irrigation and soil reclamation when the nature fails to function as it should be. A loss of 2 to 4.5 trillion dollars needs to be borne by countries each year due to biodiversity loss that occurs in the forests worldwide. 5
Over the past decades, South and Southeast Asian countries have been suffering from severe biodiversity loss as a result of ever-growing human population. Large scale crop production and infrastructural development have contributed to a significant decline in forest areas and loss in natural habitats of flora and fauna species. 6 It is worth highlighting that South and Southeast Asia experiences the greatest rate of biodiversity loss in the world. 7 In South and Southeast Asia, Malaysia has the greatest average number of threatened species (i.e., 1351), followed by Indonesia and India with 1348 and 1049 species, respectively, as shown in Figure 1. In terms of real GDP per capita, Malaysia has recorded a moderate level of average income per head at US$11,342. However, the real GDP per capita over the period from 2013 to 2020 is relatively lower for Indonesia and India, at US$4027 and US$1,875, respectively. At another extreme, Timor-Leste, Bhutan and Nepal are reported to have the least average number of endangered species. Specifically, Timor-Leste a relatively poor country in the region (with an average real GDP per capita of US$895) has the fewest number of threatened species (i.e., 27). Bhutan, a country with an average per capita income of US$2,924, has an average threatened species of 80. This is followed by Nepal—the poorest nation in the region (i.e., real GDP per head = US$767), with an average 104 vulnerable species from 2013 to 2020. On the other hand, Figure 1 shows that Singapore is the richest country in South and Southeast Asian region with an average constant dollar GDP per capita of US$55,800. On average, 300 species of organism are at risk in the island country. Another high-income country in the region, Brunei has a per capita income of US$32,578, but records a relatively low number of endangered species at 212 cases.
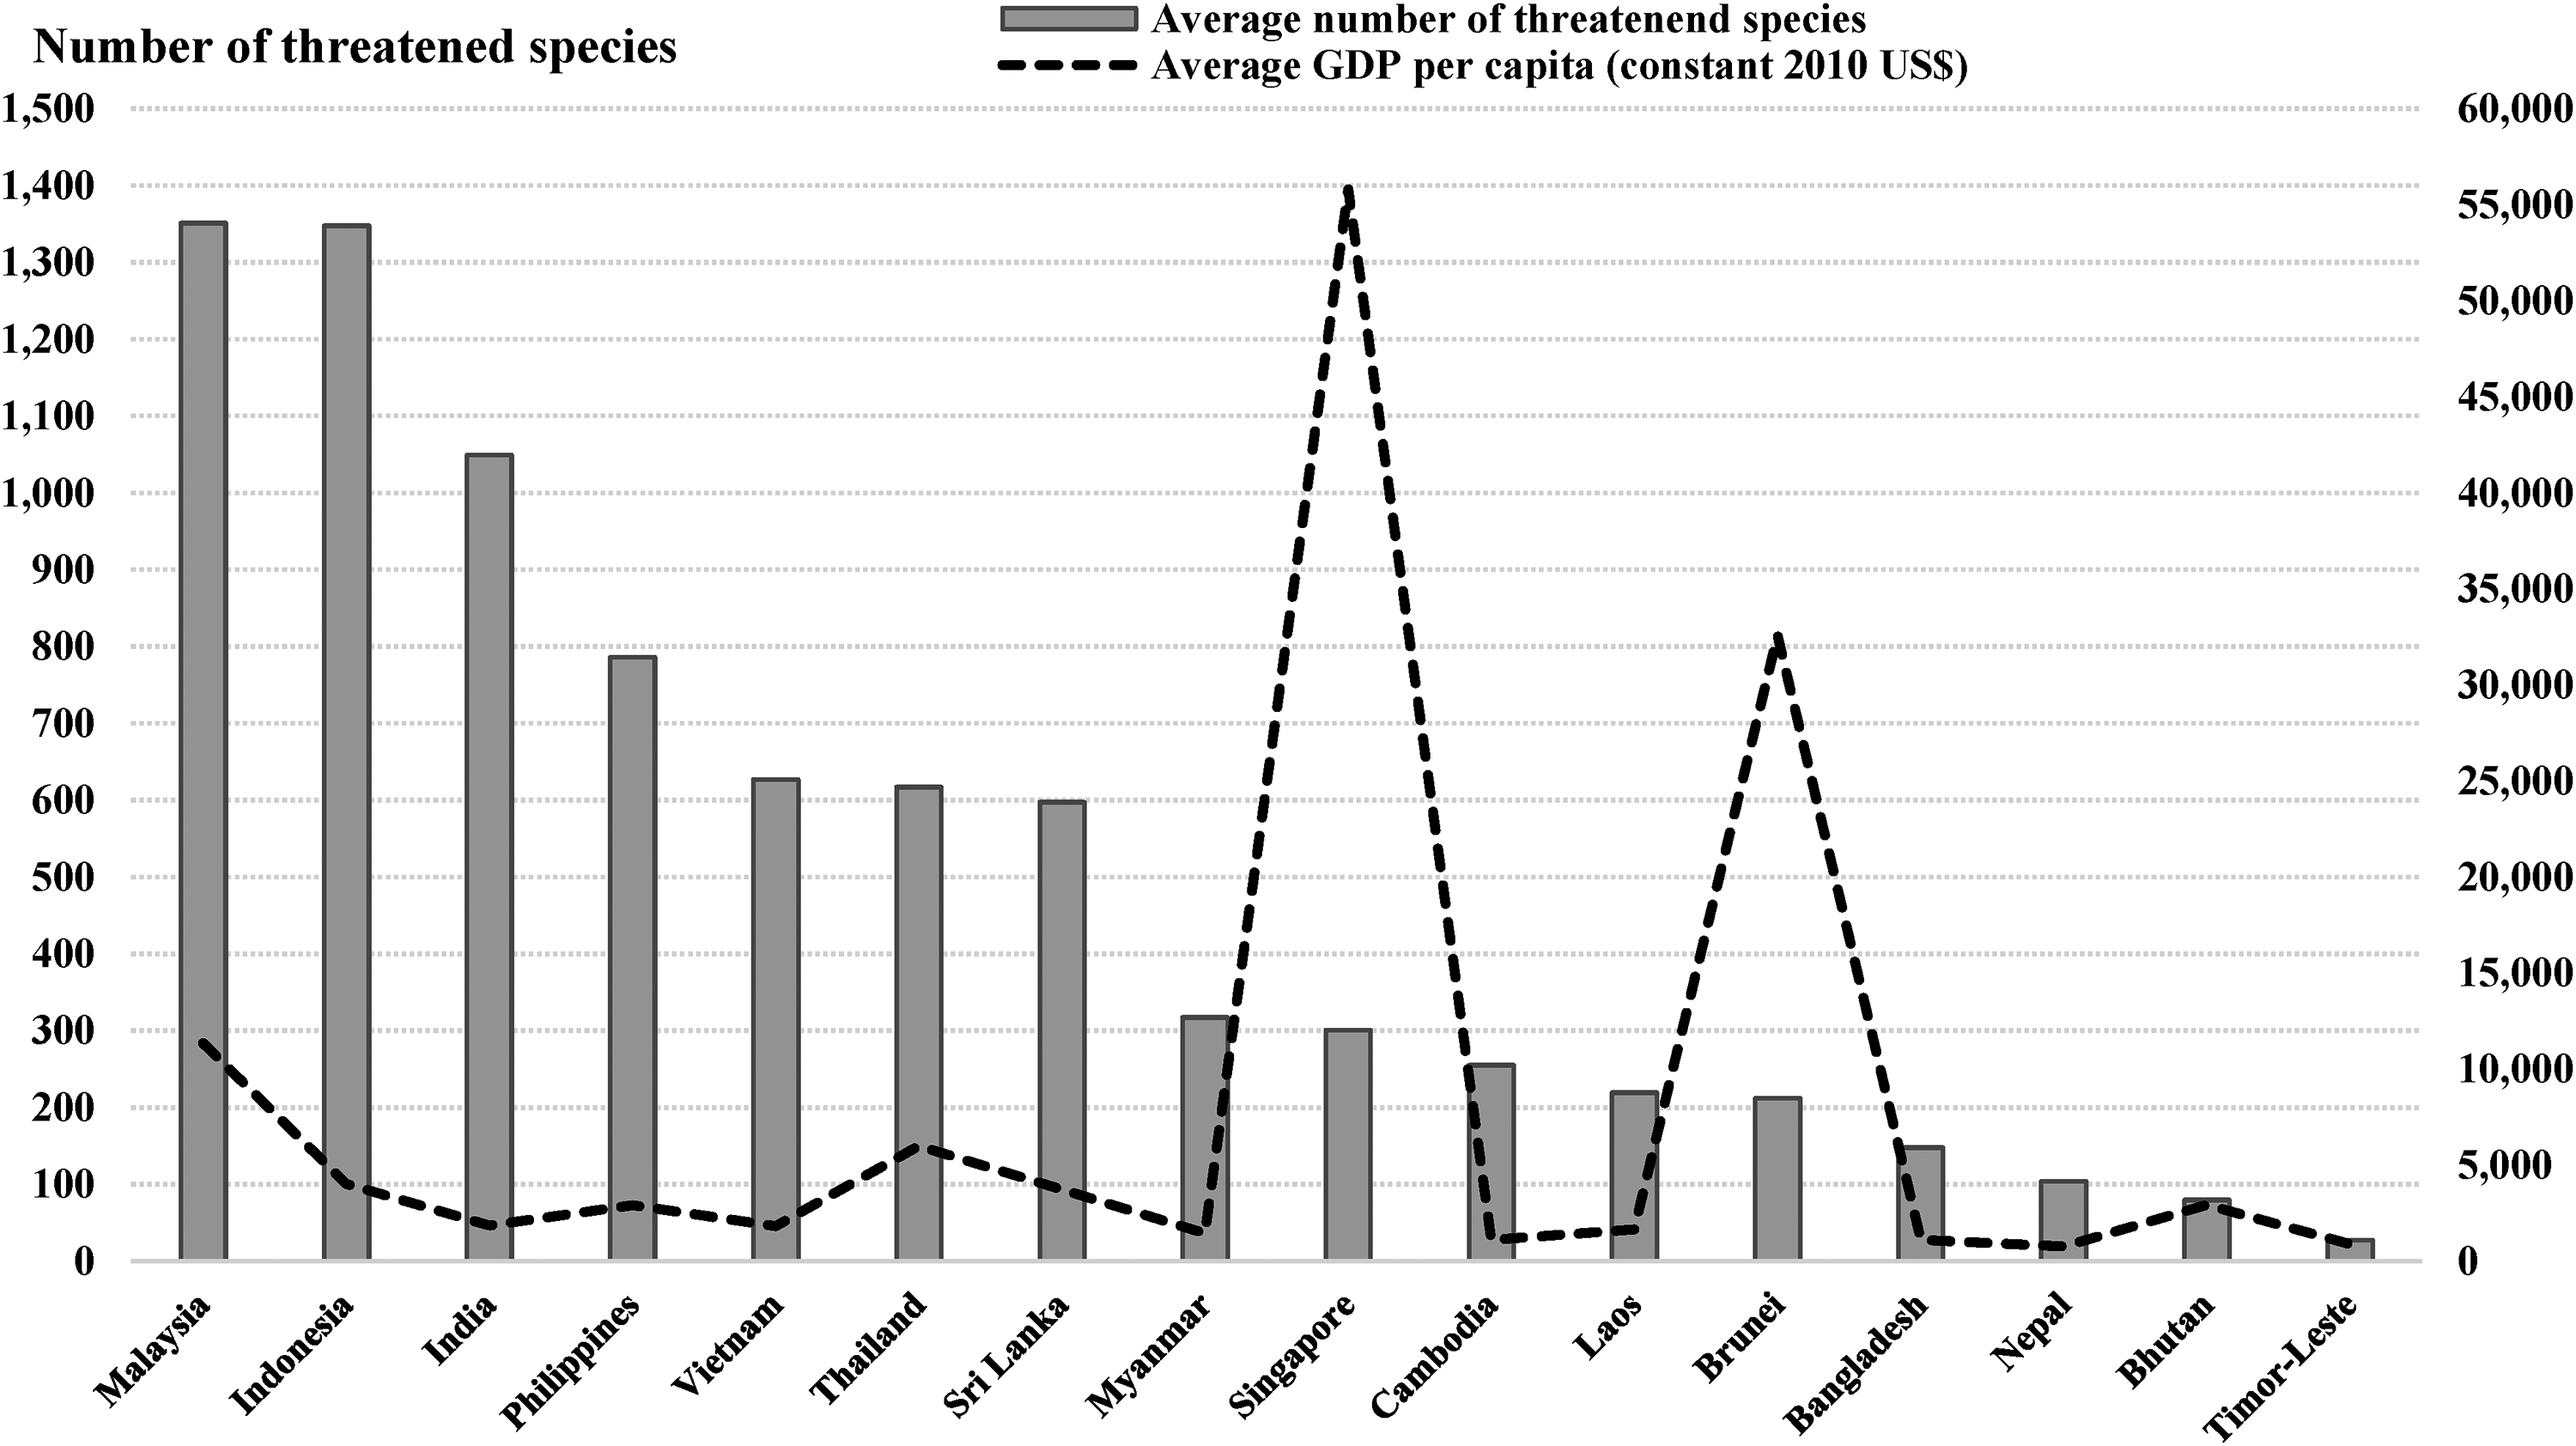
Number of threatened species and GDP per capita, annual average, 2013–2020.
As our study intends to investigate the linkage between real GDP and biodiversity loss (in terms of different taxonomic groups), it is therefore essential to have a look at the breakdowns of the number of endangered species. Figure 2 demonstrates the details of the number of endangered species in accordance to taxonomic groups in South and Southeast Asia. Amongst others, plant species have the highest number of extinctions, followed by other inverts and fishes. Specifically, 183 species of plants have disappeared from 2013 to 2020 in the region. In the meantime, 106 and 67 types of other invertebrates and fishes have been wiped out, respectively. Moreover, it is shown that the number of threatened mammals and birds are also relatively high. The survival of 51 species of mammals was at stake. Meanwhile, 46 species of birds have lost from the wild for the period between 2013 and 2020. Reptiles, amphibians, and molluscs, however, have recorded relatively lower cases of extinction with 24, 19 and 8 species, respectively.
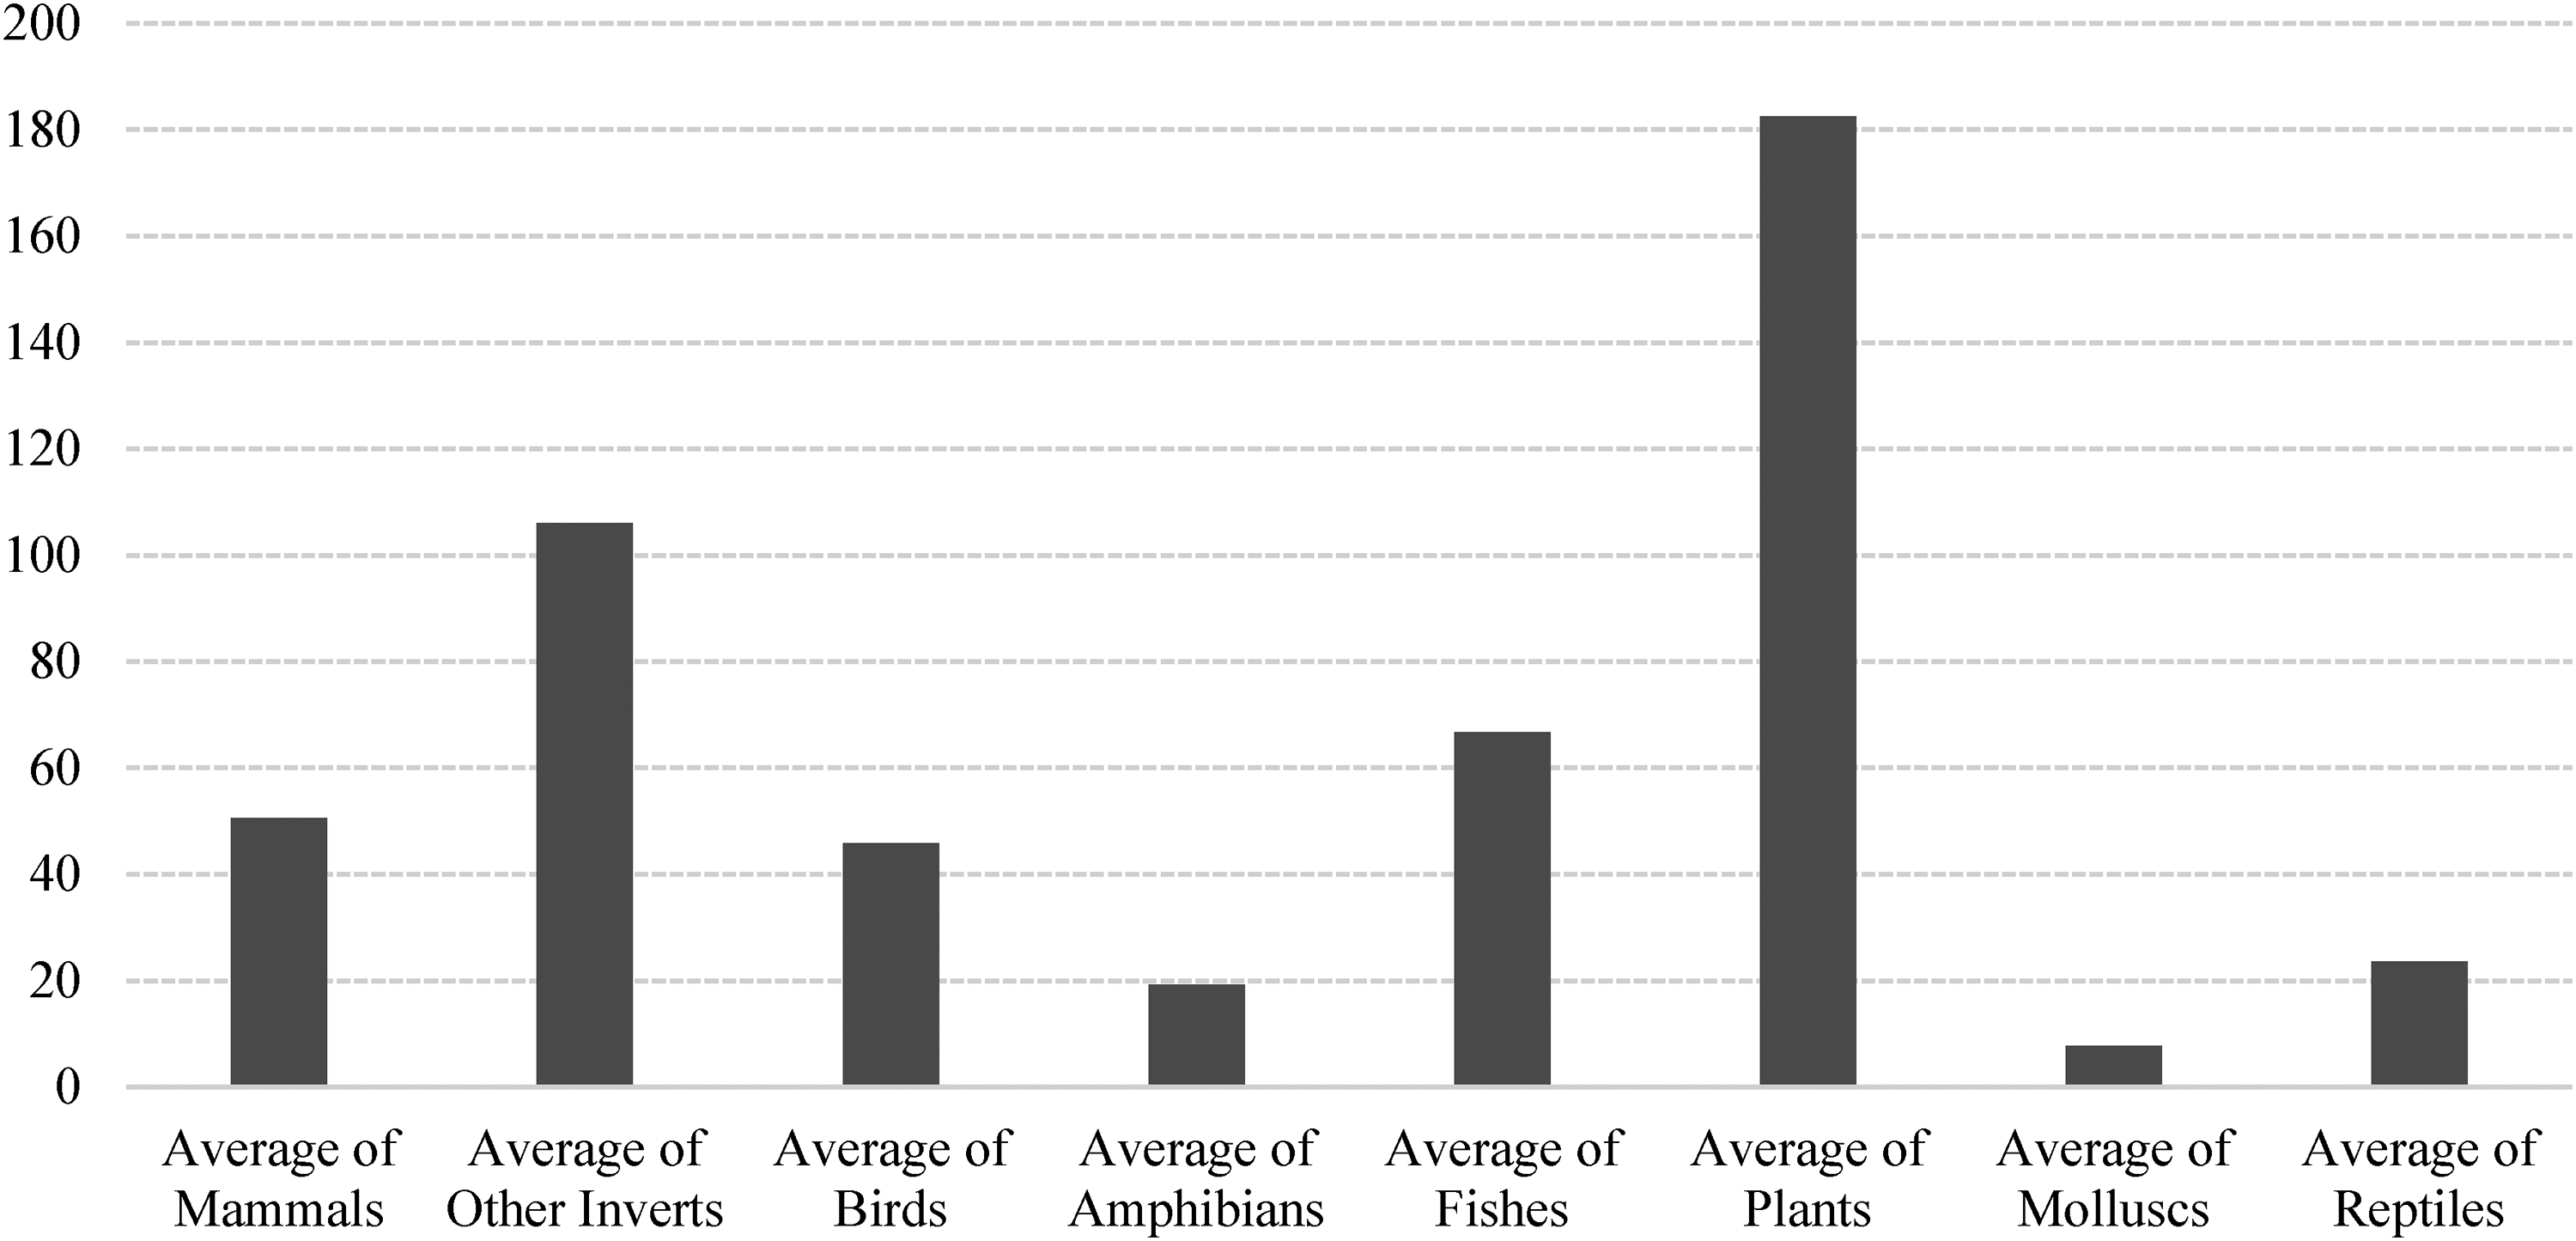
Number of species at risk by taxonomic groups, annual average, 2013–2020.
Numerous studies on the linkage between economic growth and environmental pollution have been conducted, following the pioneering work of Grossman and Krueger. 10 Generally, these past studies have considered air pollution (including CO2 emissions), water pollution and deforestation as the indicator for environmental degradation. In view of the fact that South and Southeast Asia is facing a severe crisis of biodiversity loss, the income-biodiversity loss nexus is worth further exploration. Our study, therefore, contributes to the existing literature in several important ways. First, different from the previous research, our study utilizes biodiversity loss as the yardstick for environmental degradation. Not only we consider biodiversity loss as the measure for environmental degradation, most importantly, this study analyzes the association between real GDP and various types of endangered species such as mammals, reptiles and so forth. By considering merely the aggregated model may not allow the policymakers to produce comprehensive environmental policies in tackling the issue of biodiversity loss. Hence, the examination of the disaggregated models involving different taxonomic groups is also highly essential. However, past studies that analyze the relationship between income and taxonomic groups remain scarce (e.g., Refs. 11 and 12). Second, our study is the first attempt validating an N-shaped EKC linkage between real GDP and different categories of endangered species in South and Southeast Asia. Based on the literature, past EKC studies have rarely scrutinized the N-shaped nexus between real GDP and threatened species. The cubic functional form (coined as N-shaped) on biodiversity destruction and national income is still far less investigated, except for several previous studies (e.g., Refs. 13 and 14). Nonetheless, such a N-shaped study on South and Southeast Asia is still absent in the literature. The existing research on South and Southeast Asia has focused mainly on analyzing a quadratic linkage between real GDP and biodiversity loss (e.g., Ref. 15). To this end, our study aims to fill the research gaps by examining the N-shaped nexus between national income and biodiversity loss in South and Southeast Asia based on comprehensive taxonomic groups. Third, from the methodological perspective, our study expands the current state of research by conducting a count data analysis using negative binomial regression model. The negative binomial regression model is appropriate to be employed due to over-dispersion (in which regessand refers to the number of endangered species). The issue of over-dispersion needs to be taken into account in order to avoid wrong inferences.
The rest of the paper is organized as follows. The next section presents an overview of the past studies pertaining to economic growth and biodiversity loss. Section 3 discusses the data sources and methodology. Detailed result interpretations are demonstrated in Section 4. The summary and policy implications of the study are shown in the final section of this paper.
Literature review
Theoretical perspectives
Global environmental degradation is alarming in the ecosystem. The environmental Kuznets curve (EKC) framework, introduced by Kuznets 16 to elucidate the income inequality, later, has been utilized by Grossman and Krueger 10 to address environmental quality issues. The parabolic EKC suggests that a successive increase in country's prosperity and affluence could resolve rather than aggravate the environmental deterioration. In the initial stages of economic expansion, marked by the intensive utilization of a nation's resources, there is a persistent rise in the ecological footprint, ultimately hastening environmental degradation. After a specific income level is attained, the environmental issue will be alleviated as income rises. With higher income, countries are likely to shift to environmental-friendly technology virtue of greater awareness, lesser harmful economic activities, and more effective regulation for environmental protection; driving better environmental quality. 17
Environmental sociology ecological modernization (EMT) theory is much the same as the EKC hypothesis. In EMT theory, critical environmental damages take place during the early phases of industrialization and modernization. As development and modernization progress, “ecological rationality” is materialized where the environmental issues are disseminated in society, making the reshuffling of institutions, economic, and political along with ecological sustainability. 18 Nonetheless, the EKC hypothesis highlights on environmental degradation to national income while EMT theory links the environmental issues with country's modernization. In contrast, the critical political economy (CPE) theory advocates that urbanization and country development are key factors of environmental problem. In alternative to the “tipping point”, CPE theory states that continued economic growth magnifies the environmental degradation virtue of the profit maximization.19–21 As a result, conflict arises between environmentally sustainable and national growth as producers fail to incorporate environmental costs into the manufacturing process.
Biodiversity loss and economic growth
One of the major environmental issues in the ecosystem is biodiversity loss. Undoubtedly, economic development and growth through human activities are the key drivers increases ecological footprint22,23 and leading to environmental degradation.24–27 According to Pachauri et al., 28 global economic growth has induced an upsurge of greenhouse gas (GHG) emissions, shifting the climates toward an unprecedented rate that surpass the adaptability of natural biological species. In consequence, this changing species population sizes and ranges, affecting the phenology of species such as the timing of growth, leafing and flowering, migration, and hibernation, and engendering extinction of species.28–31 Climate change also alters habitat and increases the risk of extreme disasters such as droughts, floods, wildfire, and storms 32 ; hence, posing an immense impact on biodiversity and sabotaging the conservation efforts.33,34
Albeit climate change is a significant factor in driving biodiversity loss, nevertheless, agricultural expansion has been the major concern to threaten biodiversity as rising per-capita GDP has contributed to a greater demand for food 35 ; thus, further increasing the land-use intensification.36,37 According to Asafu-Adjaye, 11 a larger degree of economic output is often associated with a higher land conversion rate for producing goods and services. Land-use conversion renders the destruction of habitat and ecosystems that predominately causes the richness and native species diversity to decline. 27 Land-based human production and consumption increase the risk of soils salinization and erosion, pesticides drift, and contamination of air, surface and ground water38–40 that directly and indirectly threaten amphibians, mammals, insects, birds, and reptiles.41,42
By testing the monotonic nexus between threaten species and economic growth, Asafu-Adjaye 11 affirms that higher GDP results in a detrimental effect on species such as birds and mammals. Nonetheless, the composition of economic output is the key feature to threaten biodiversity. Low-income nations, notably, experience a more significant loss of biodiversity virtue of their economic structure, which is linked to a higher component of agricultural output. The author sheds light that the slash-and-burn farming technique, for instance, is one of the main causes of biodiversity loss and deforestation. Wiedmann et al. 43 claim that some Global North countries reduced their domestic materials usage even economies flourished, yet this condition is accomplished by demanding resource-intensive items from the Global South countries. Therefore, the affluence nations (production-based) reveal a decreasing biodiversity footprint intensity, signifying that species loss is outsourced to low-income nations. 44
Instead of a monotonic relationship, a strand of research perceives the relation between economic growth and biodiversity loss through the lens of the EKC framework. By including plants, amphibians, birds, reptiles, mammals, invertebrates, and fishes, Naidoo and Adamowicz 45 disclose per capita GNP is correlated with five taxonomic groups (birds, invertebrates, plants, reptiles, and amphibians) in developed countries. In particular, the EKC hypothesis is established for bird species where increasing country prosperity and wealth contribute to a lower threat on bird species, which is in contrast to other taxa surveyed. Similarly, in the work of Perrings and Halkos, 12 the nexus between income and threatened species follows a quadratic function across major taxonomic categories (birds, reptiles, mammals, and plants). The tipping points, on the other hand, differ depending on the taxonomic categories. As poorer countries’ economies are highly dependent on the agriculture sector, the encroachment and anthropogenic activities in natural habitats lead to growing stress on terrestrial species. Due to the need for country development, deforestation might severely threaten to biodiversity Murtazashvili et al. 46 Nevertheless, Ajanaku and Collins, 24 assert that deforestation would only pose significant damage to the species before reaching the income threshold; hence, the EKC hypothesis is confirmed in African countries.
Despite some research have confirmed the validity of the EKC hypothesis, the results are mixed and have not gained the same conclusion. For instance, Clausen and York 47 and Cuthbert et al. 48 divulge that the EKC hypothesis does not hold for environmental quality and biodiversity, indicating biodiversity is irreparably damaged after crossing the threshold values of national income. Mills and Waite 49 supports the EKC theory for biodiversity where the increasing per capita income is coupled with a higher species conserved, the support is eradicated after including the country-specific dummies. Asafu-Adjaye 11 reasons that biodiversity is classified as a unique rank of environmental destruction related to complex ecosystems that are irreversibly lost. Even if a country is attempted to protect endangered species through conservation, it is improbable to recoup its species richness as income rises. 50 The authors highlight that the anthropogenic human activities that drive the extinctions outstrip the formation of new species; hence, countries’ prosperity will certainly exacerbate biodiversity loss, contributing to an unsustainable environment. Additionally, given biodiversity is regarded as a public good, this renders little motivation to individuals and countries to invest in such resources; as a result, the rate of biodiversity degradation is escalating as income grows. 11
Since biodiversity loss is perceived as irreversible damage to ecosystem functioning, Benedek and Fertő 13 opt to test the N-shape of forest recovery that may have different impacts on biodiversity. The analysis result uncovers that the EKC is a cubic function with two tipping points of GDP per capita emerged, implying larger forest cover does not certainly accompany an improvement in ecosystem or mitigation in biodiversity loss. This finding is in line with McPherson and Nieswiadomy, 51 who examine the EKC hypothesis in both quadratic and cubic terms and reveal an N-shape relation in mammals and birds’ species; this shows that a higher degree of species loss is linked to economic growth. Hence, N-shaped EKC suggests that the nexus between biodiversity loss and economic growth may no longer be in accordance with linear relationship or traditional EKC hypothesis as environmental degradation will rise again beyond the threshold income level.
Data and methods of estimation
Data
A panel of 16 South and Southeast Asian nations (Bangladesh, Bhutan, Brunei, Cambodia, India, Indonesia, Laos, Malaysia, Myanmar, Nepal, Philippines, Singapore, Sri Lanka, Thailand, Timor-Leste and Vietnam) are considered for this study. Based on previous studies, the number of endangered species are used to measure the biodiversity loss. 52 The threatened species are made up of mammals (MAMM), birds (BIRD), reptiles (REPT), amphibians (AMPH), fishes (FISH), molluscs (MOLL), other invertebrates (OTHER) and plants (PLANT). The disaggregated data corresponds to the number of threatened species for each taxonomic group while the aggregated data refers to aggregation of eight taxonomic groups of endangerd species (TOTAL). We collected the number of endangered species data from different versions of The IUCN Red List. Due to data availability constraints on threatened species, this study covers the period from 2013 to 2019, at an annual frequency basis. Apart from the biodiversity loss measures, the included regressors are constant gross domestic product per capita expressed in 2010 US Dollars (GDP), square of GDP (GDPSQ), cubic of GDP (GDPCU), agricultural land measured in 1000 ha (ALAND) and control of corruption index (CORRUPT). The CORRUPT index runs from −2.5 at the lowest index (weak control of corruption) to + 2.5 at the highest index (strong control of corruption). Our data are sourced from Food and Agriculture Organization, 53 World Development Indicators, 8 and Worldwide Governance Indicators. 54
Negative binomial regression
Studies of ecology and biodiversity depend greatly on species counts,55,56 for instance, ecological count data such as the amount of endangered species and amount of species richness. Counts may be significantly skewed, contain a substantial number of zeros, and have extreme values in health psychology.
57
Similarly, ecological count data frequently display over-dispersion.
58
Due to the over-dispersion, negative binomial regression is preferable for biodiversity loss modeling, where the response variable is the number of endangered species. Over-dispersion is the situation in which the variance is greater than the mean, var(yi)>E(yi).59,60 Failure to account for over-dispersion may lead to wrong inferences. For instance, reduces the standard error of the estimates, increases the test statistics of the estimated coefficients and thus overestimates the significance.
61
As noted by Coxe et al.,
61
there may be two reasons for over-dispersion in cross-section data. First, there exists individual variations in responses that are not considered in the estimation. The resulting problem is typically because of omitting a relevant variable from the model. The over-dispersion could be also the result of other factors such as model misspecification and excess zero counts, other than omission of important variables.
62
Second, there exists a circumstance called contagion (or known as state independent). It is not necessary that each occurrence results in an independent occurrence.
61
Hence, this makes species and ecosystem closely interconnected.
47
For example, the likelihood that one fish species will go endanger depends on the condition of other fish species.
47
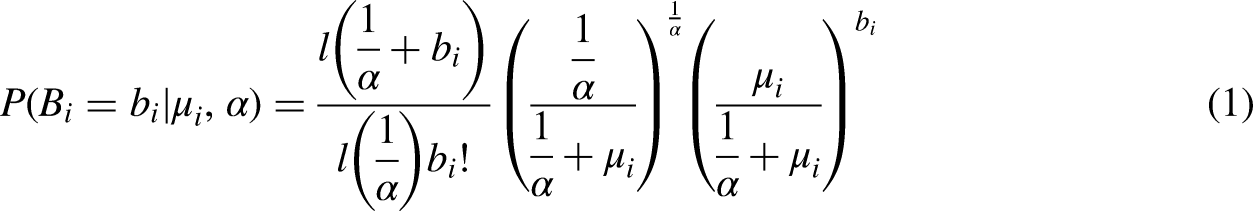
As such, the negative binomial distribution for bi can be stated as below:
Model specification for biodiversity loss
There have been growing interests in the EKC hypothesis for threatened species and species richness framework.
51
Thus, in accordance with Li et al.,
14
the model for biodiversity loss using the cubic specification of EKC can be written as:

Empirical results
Summary statistics and correlation matrix
Summary statistics of the key variables studied are provided in Table 1. There were on average 502 threatened species recorded over the sample period, ranging widely from 20 in Timor-Leste to 1662 in Malaysia. In particular, across the 16 countries of South and Southeast Asia, threatened plant showed the largest average amounts of species (183 species) whereas threatened molluscs exhibited the least average amounts of species (eight species). For regressors, the average GDP per capita per year was recorded at $8124.1; Singapore was the most developed country in the South and Southeast Asia, with a GDP per head of $59,374.4 while Nepal was found to experience the lowest GDP per capita of $664.8. The average agricultural land between 2013 and 2019 based on 16 countries was 20,744.4 (1000 ha). India's agricultural land of 179,728.0 (1000 ha) was the largest across 16 countries while Singapore has registered about 0.7 (1000 ha) of agricultural land. The average control of corruption index was estimated at −0.2. Singapore has attained a high level of governance with a score of 2.2 and the lowest was in Cambodia (−1.3). Next, the unconditional variance is higher than its mean, suggesting that the threatened species count data were over-dispersed.
Summary statistics.
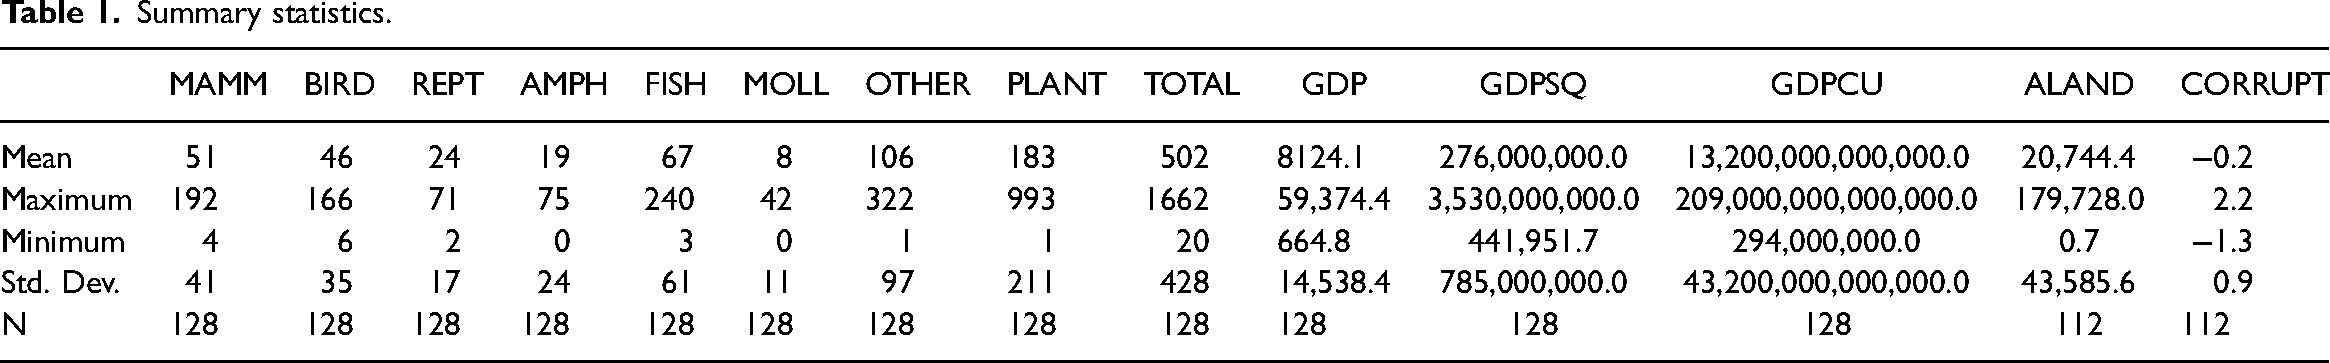
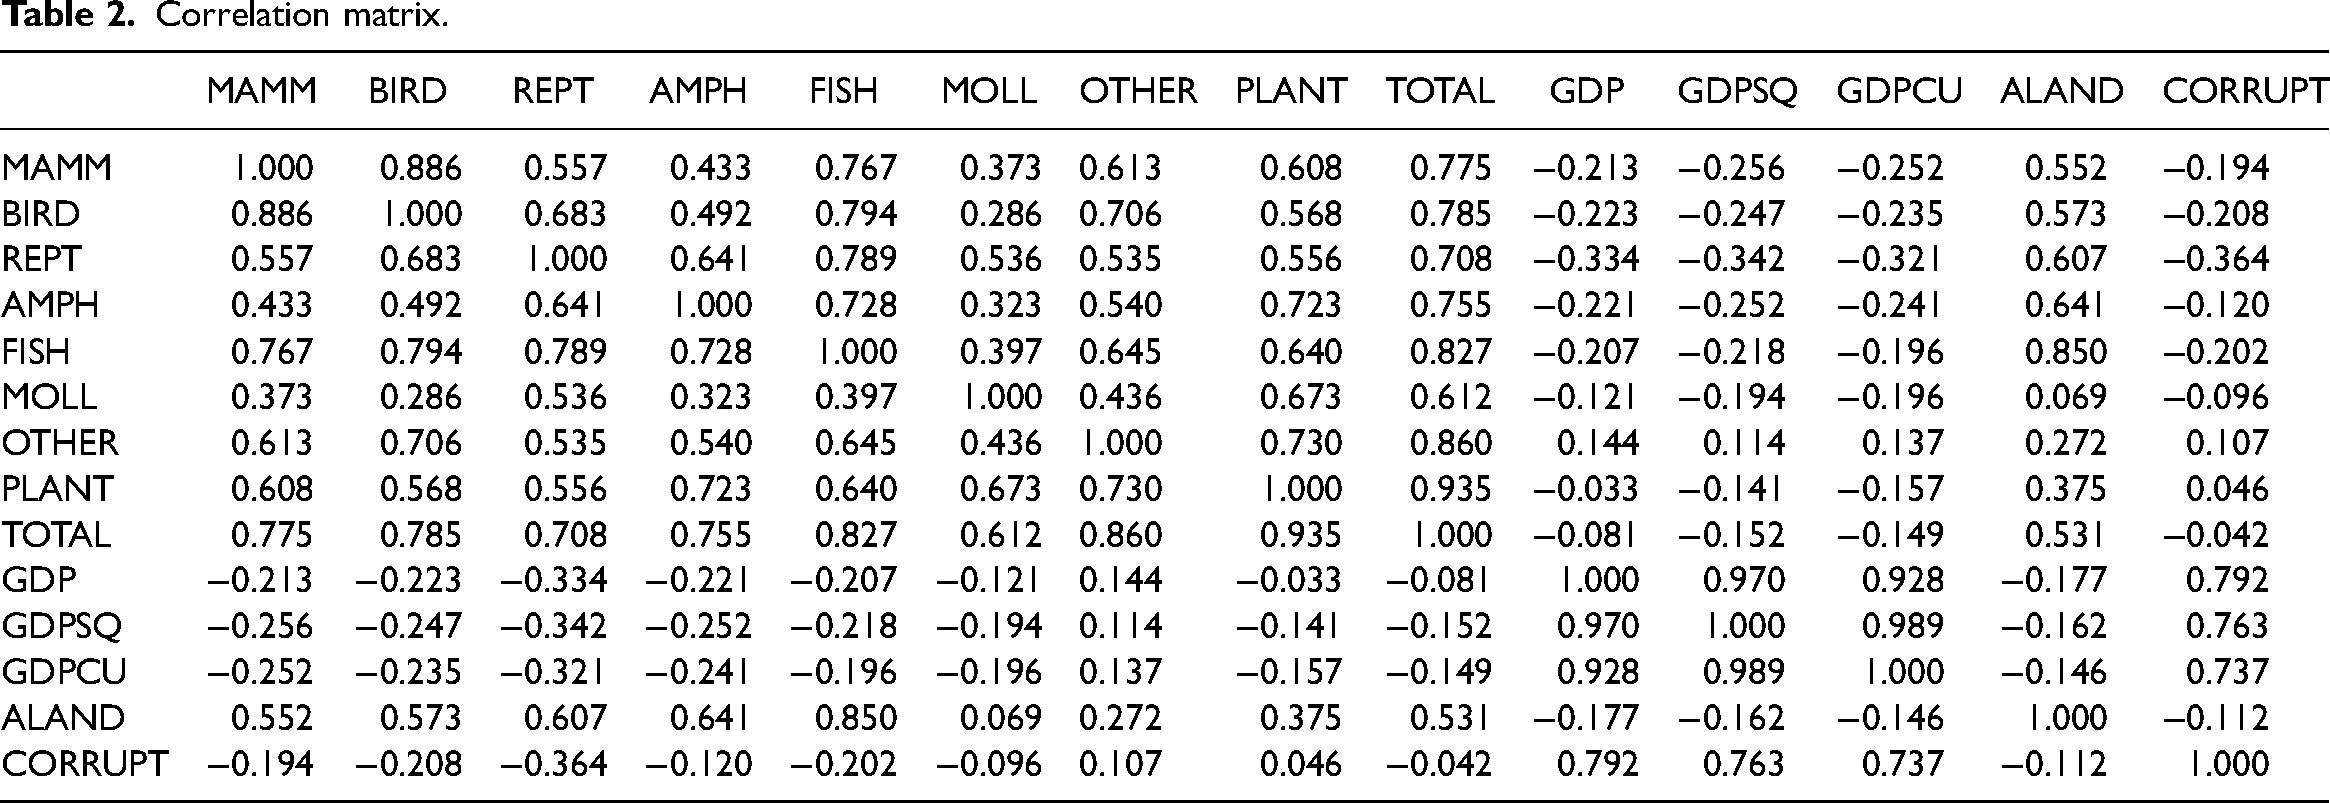
Table 2 shows the correlation matrix. When including GDP per capita, its squared (GDPSQ) and its cubed (GDPCU) will lead to potential problem of multicollinearity.65,66 This can be evidenced by the pairwise correlations between GDP, GDPSQ and GDPCU exceed 0.80. For example, strong correlations were found between GDP and GDPSQ (rGDP, GDPSQ = 0.970); GDP and GDPCU (rGDP, GDPcu = 0.928) and GDPSQ and GDPCU (rGDPSQ, GDPCU = 0.989), signaling the presence of multicollinearity.
Correlation matrix.
Regression results
The results of the negative binomial regression are presented in Table 3. Model 1 – model 8 indicate the regression results when the outcome variable is the disaggregated data such as MAMM, BIRD, REPT, AMPH, FISH, MOLL, OTHER and PLANT, respectively while model 9 is the estimated result for the aggregated data of TOTAL.
Negative binomial regression.
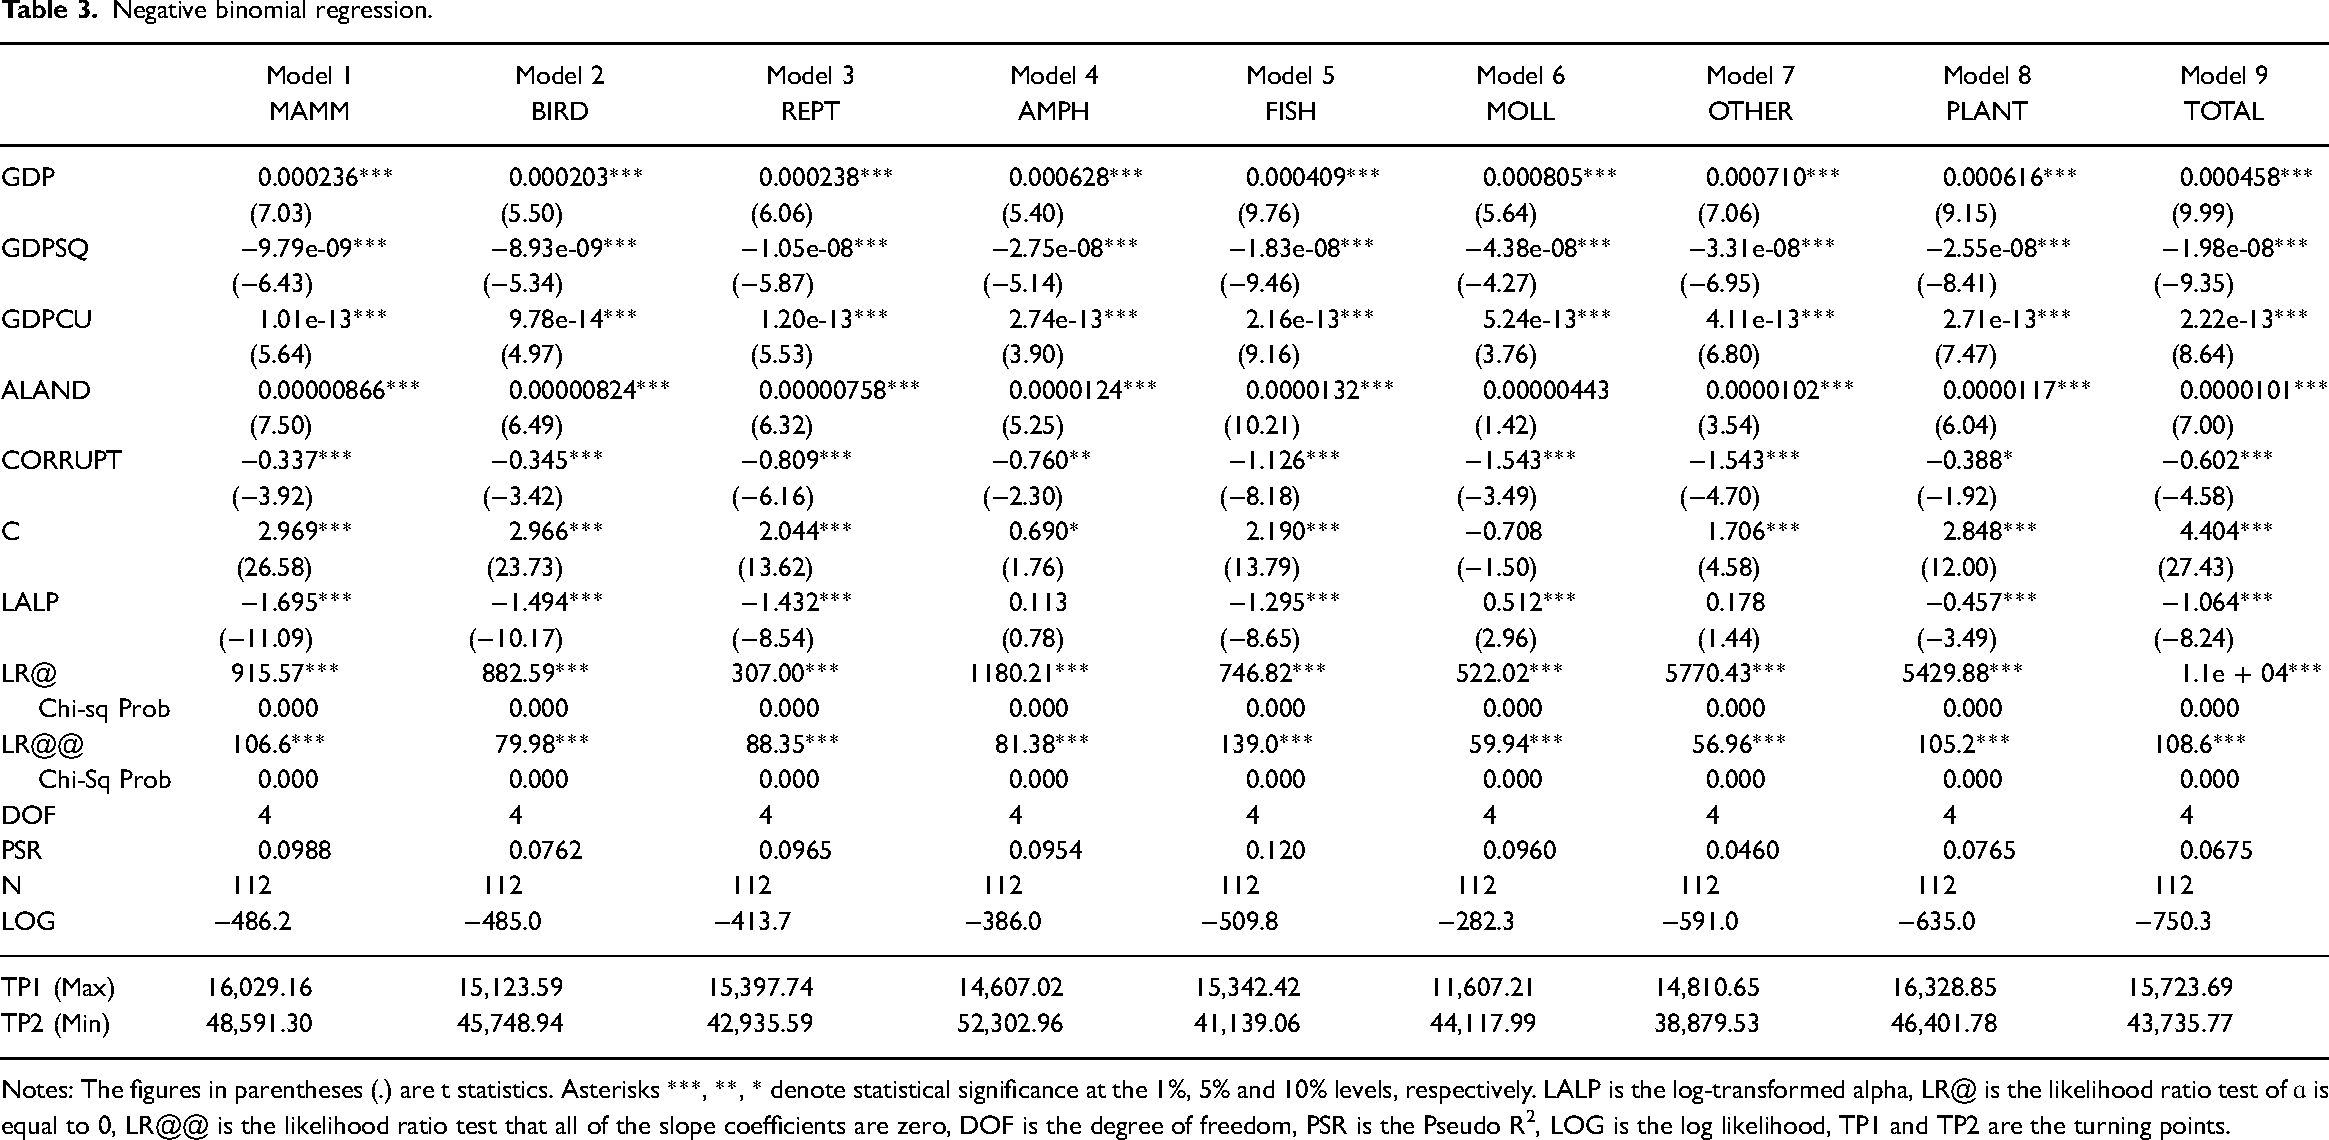
Notes: The figures in parentheses (.) are t statistics. Asterisks ***, **, * denote statistical significance at the 1%, 5% and 10% levels, respectively. LALP is the log-transformed alpha, LR@ is the likelihood ratio test of ɑ is equal to 0, LR@@ is the likelihood ratio test that all of the slope coefficients are zero, DOF is the degree of freedom, PSR is the Pseudo R2, LOG is the log likelihood, TP1 and TP2 are the turning points.
The presence of over-dispersion can be tested using the likelihood ratio (LR) of alpha (ɑ) is equal to zero. The test statistic ranges from 307 (model 3) to 11,000 (model 9) with all associated p-values of < 0.01 in Table 3. Thus, the null hypothesis that alpha (ɑ) equals zero can be rejected in all models, implying that the threatened species data are over-dispersed and thus the negative binomial estimation is a better choice. Ecological and behavioral count data exhibit over-dispersion.47,67
For goodness-of-fit of the estimated models, the chi-square statistic ranging from 60 (Model 6) to 139 (Model 5), so all models can reject the null hypothesis that all slope coefficients are concurrently equal to zero at the 1% level. This concludes that all the estimated models fit the data well.
The estimated coefficients of the GDP and GDPCU are positive and statistically significant at the 1% level while the signs of the GDPSQ are negative and statistically significant at the 1% level. This reaffirms the presence of a N-shaped EKC for the income-biodiversity loss relationship for the aggregated model (model 9) and the disaggregated models (model 1 – model 8). The majority of the countries in South and Southeast Asia have recorded a rise in the number of species at risk at the initial stage of development. This indicates that the South and Southeast Asia depends heavily on plants and animals for food and medicine. As a result, the region suffers from huge biodiversity loss at the initial stage of development. After achieving the first turning points ranged between $11,607 (Model 6) and $16,329 (Model 8), the number of threatened species decreased at the second stage of development. This is due to the fact that countries in the region have started to raise awareness in protecting biodiversity loss after reaching the first turning points. Meanwhile, the second turning points range between $38,880 (Model 7) to $52,303 (Model 4). This indicates that the region has experienced a rise in the quantity of endangered species in the third stage after reaching the second turning point. Therefore, there exists a trade-off between economic development and biodiversity loss in which rapid economic growth may result in sacrificing natural economic systems. While fast growing economy leads to better well-being, it also results in growing environmental concerns. Thus, to strike a proper balance between environment and development is necessary for maintaining rapid economic growth while sustaining the natural economic systems.
The agricultural land (ALAND) has an expected direct and statistically significant effect on threatened species in all models except for model 6. This implies that a rise in agricultural land increases the biodiversity loss in South and Southeast Asia. This is in line with earlier empirical results. 68 For example, recent studies revealed that rapidly expanding agricultural land use will reduce the richness of plants 69 and the amount of amphibians as well as reptiles. 70 On a similar note, results of 5 out 21 negative binomial regressions showed that land-use variables have an impact on threatened species. 45
For governance indicator, the parameter estimates for the control of corruption index (CORRUPT) are negative and statistically significant at the 1% level in all models except for model 8 (at the 10% level). This implies that nations with excellent control of corruption will lower the number of endangered species. Our results complement the findings from previous studies on the role economic freedom, corruption and democracy on threatened species. 71 Specifically, Dietz and Adger 50 found that an inverse connection between democracy and species richness. For both plants and mammals, Pandit and Laband 72 discovered that economic freedom and species imperilment have an inverted-U linkage. They also demonstrated that corruption and threatened birds and reptiles also in favor of such a relationship.
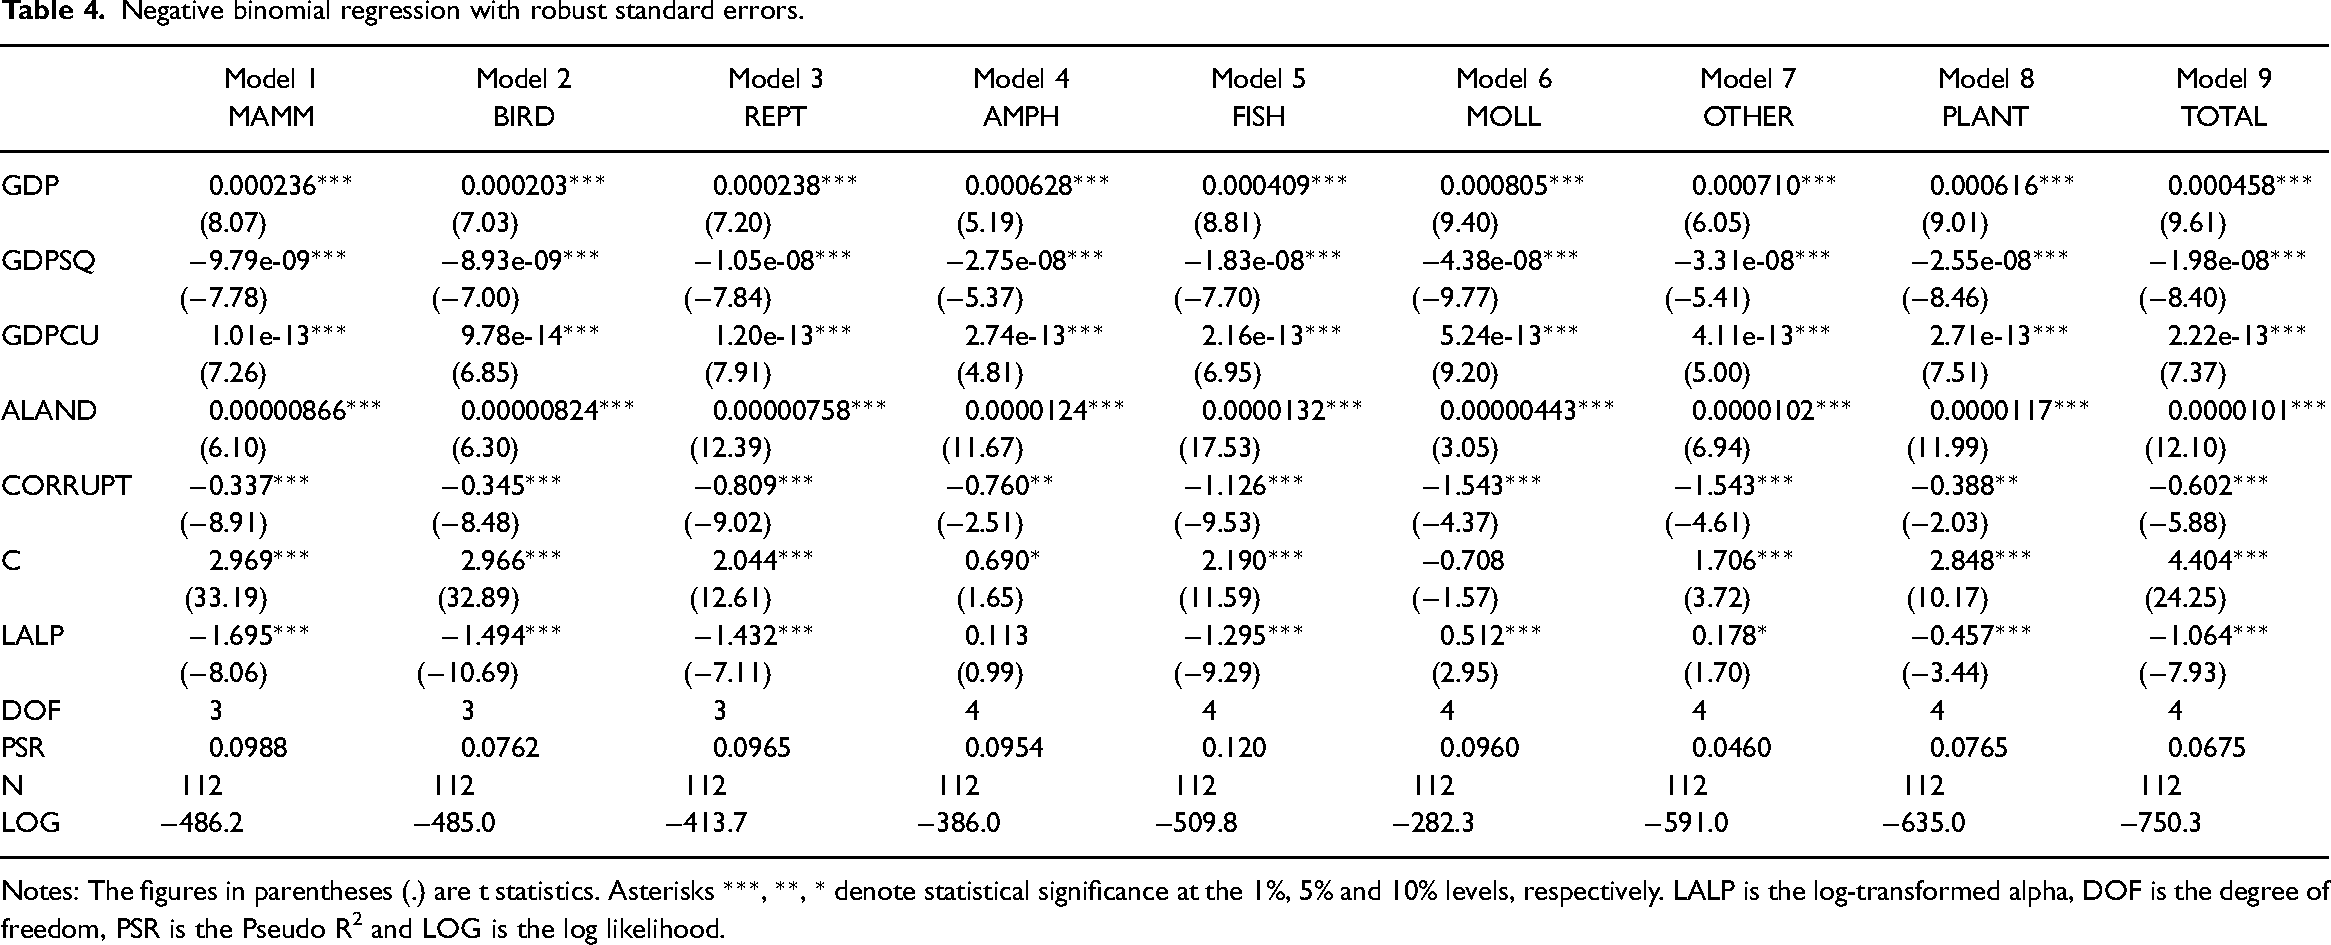
Lastly, we provide robustness checks using the robust standard errors for the negative binomial regression models as presented in Table 4. In all models, the sign and significance of the parameter estimates are similar to those in Table 3. In South and Southeast Asia, we also find compelling evidence of a N-shaped EKC link between income and biodiversity loss. Therefore, the robust standard errors for the negative binomial regressions confirm the robustness of our main findings.
Negative binomial regression with robust standard errors.
Notes: The figures in parentheses (.) are t statistics. Asterisks ***, **, * denote statistical significance at the 1%, 5% and 10% levels, respectively. LALP is the log-transformed alpha, DOF is the degree of freedom, PSR is the Pseudo R2 and LOG is the log likelihood.
Conclusion and policy implications
Biodiversity destruction is not merely an environmental issue, but also leading to adverse economic and societal impacts. The South and Southeast Asian nations have relatively high levels of biodiversity loss in the world. Over the last few decades, South and Southeast Asia has been suffering from the disappearance of species due to economic activity. The natural environment is closely connected to economic activity and growth. On one hand, rapid economic growth has a positive impact on human well-being. On the other hand, it can lead to excessive demand for necessities and hence ecosystem destruction. Therefore, the purpose of this study is to explore the N-shaped EKC for biodiversity loss in 16 countries of South and Southeast Asia over the period of 2013–2019. The biodiversity loss is considered as the measure for environmental degradation, can be further decomposed into the aggregated model and disaggregated models. The count data estimation-the negative binomial regression is used to examine the N-shaped nexus between income and biodiversity loss to deal with count outcomes and to overcome the over-dispersion issues.
The main outcome from this study reveals that income has a crucial impact on biodiversity loss of South and Southeast Asia. Specifically, the results confirm the existence of N-shaped EKC for income-biodiversity loss in both the aggregated and disaggregated models. The cubic specification of each EKC model has two turning points where the first turning points range between $11,607 and $16,329 while the second turning points range from $38,880 to $52,303. This indicates that the threatened species increases at an early stage of development; and declines after reaching a certain turning point. Subsequently, the threatened species go up again with rising income. Apart from income, agricultural land and biodiversity loss are directly related irrespective of the taxonomic groups. Moreover, a weak control of corruption is likely to exacerbate biodiversity loss and vice versa.
Based on the findings, our study has some important policy implications. First of all, the existence of an N-shaped EKC in the biodiversity loss indicates that countries in the South and Southeast Asia find it difficult to keep up environmental protection with continuous increase in GDP. In other words, economic growth in South and Southeast Asia does not serve as a permanent remedy for biodiversity loss. When the economy grows to a certain level in these countries, the number of threatened species rises. Hence, this verdict proposes that the South and Southeast Asian governments need to come out with policies that enable the achievement of sustainable development without destroying the biodiversity in these countries. Sustainable development policies aimed at achieving sustained economic growth and a healthy environment simultaneously, so as to ensure that continued economic development does not lead to worsened biodiversity loss. In relation to this, countries in South and Southeast Asia should develop a comprehensive national framework for biodiversity conversation, with clear long-term objectives. The biodiversity framework must seek to combat and reverse biodiversity loss by a stipulated time frame. This framework is of paramount importance to the South and Southeast Asian nations as it will define targets and pathways for biodiversity conservation and subsequently lead to sustainable growth. Besides, the policy makers should ensure that sound governance of sustainable development issues is incorporated as an integral component of all businesses. In this context, businesses should practice responsible management by considering and managing the social and environmental impacts of their activities on the ecosystems. To further encourage businesses to integrate biodiversity into their corporate management, policymakers could provide tax relief or exemption for businesses who engage in environmental preservation activities particularly when it comes to biodiversity conservation. Additionally, formal and informal educational programmes for the protection of biodiversity should be conducted to enhance environmental awareness among the general public. Consumers, for example, could be educated on the impact of their purchasing decisions on biodiversity and ecological balance. Lastly, stringent environmental laws should be designed and enacted to deter people from destroying the ecosystems. Market based approaches, for example, could be adopted to reduce biodiversity loss by charging environmental taxes on consumers and businesses.
A direct relationship between agricultural land and biodiversity destruction implies that South and Southeast Asian nations have to design and implement effective and sustainable land management policies to prevent illegal use of land for agricultural activities. For example, one of the approaches that can be adopted by the governments to reduce agricultural land usage is via zoning. With zoning, lands are assigned for different purposes such as business activities, residential usage and agricultural operation. Such policies are able to mitigate inappropriate usage of land for agriculture. Moreover, the governments should set stringent laws and regulations in controlling certain unfavorable agricultural land use practices such as overgrazing, fertilization and the use of agricultural pesticides that can lead to the growth of invasive plants. It is because an increase in invasive species would potentially cause a loss in biodiversity.
Apparently, corruption affects the governments’ concerns for biodiversity loss in South and Southeast Asia. As control of corruption is found to be beneficial to the biodiversity, it is recommended that South and Southeast Asian nations should consider ‘combating corruption’ as their policy priority. In relation to this, various anti-corruption initiatives need to be taken by the governments to ensure environmental sustainability over the long term. These initiatives may include institutional reforms, narrowing of income gaps and strengthening of financial management. Moreover, the policy makers should implement programs for the purpose of enhancing citizens’ awareness so that corruptive activities can be eliminated at the grassroot level.
The major limitation of the study was based on the numbers of threatened species. According to the IUCN Red List, “threatened” species is referred to species assessed as Critically Endangered (CR), Endangered (EN), or Vulnerable (VU). This study encourages future works to extend the N-shaped EKC hypothesis by (i) disaggregating the number of threatened species into CR, EN, and VU; (ii) focusing on the numbers of species in the IUCN Red List by category. For instance, numbers of Extinct (EX) species, numbers of Extinct in the Wild (EW) species, numbers of Near Threatened (NT) species, numbers of Data Deficient (DD) species, and numbers of Least Concern (LC) species.
Footnotes
Acknowledgements
The authors wish to thank the anonymous reviewers for their insightful comments and suggestions.
Author's contributions
Thian-Hee Yiew: Abstract, methods of estimation, conclusions.
Lin-Sea Lau: Introduction, policy implications and reviewing.
Ai-Lian Tan: Literature review.
Yan-Ling Tan: Empirical results and editing.
All authors read and approved the final manuscript.
Availability of data and materials
The data were collected from the IUCN Red List of Threatened Species, the World Bank's World Development Indicators, the Worldwide Governance Indicators and the Food and Agriculture Organization of the United Nations databases. It is available from the corresponding author on reasonable request.
Declaration of conflicting interests
The author(s) declared no potential conflicts of interest with respect to the research, authorship, and/or publication of this article.
Funding
The author(s) received no financial support for the research, authorship, and/or publication of this article