
Abstract
The urgency to address climate change becomes increasingly evident as we observe a rise in devastating natural disasters and significant changes in global temperatures. This comprehensive study critically assesses the adherence to climate targets set at COP26 and COP27, employing a dual approach encompassing theoretical and empirical aspects—basic and additional analysis. According to theoretical findings, China, Brazil, and South Africa are still experiencing an increase in climate change indicators despite their collective efforts. Notably, Brazil has shown limited progress in green financing initiatives. Moving to an empirical analysis covering 1995–2021, the study employs advanced econometric techniques, including panel ARDL, FMOLS, DOLS, CS-ARDL, and Grey forecasting models (GM (1,1) and DGM (1,1)). The past data on energy production using both renewable and non-renewable sources spanning from 2010 to 2021 to forecast energy production for the next 8 years, extending up to 2029. Results indicate that green financing, renewable energy consumption, natural resource rents, and government effectiveness significantly reduce GHG emissions. Conversely, economic growth, including its cubic form, exacerbates GHG emission trends. Moreover, the study validates the environmental N-shaped hypothesis in the examined countries, providing a complete understanding of climate change's intricate and multifaceted impacts. The grey forecasting model shows that Brazil, Russia, and South Africa are actively endeavoring to curb greenhouse gas emissions by transitioning toward renewable energy sources for energy production. This research contributes valuable insights for policymakers, emphasizing the importance of targeted interventions in green financing and sustainable practices to effectively address and mitigate climate change.
Introduction
Over millennia, the Earth has witnessed profound environmental challenges, encompassing global warming, climate changes, and natural resource depletion, all of which have had a lasting impact. The United Nations (2015) defined climate change as long-term alterations in global temperature averages and precipitation patterns. The significant increase in emissions of greenhouse gases (GHGs) is primarily attributed to human activities and excessive exploitation of natural resources. 1 This trend has been particularly noticeable since the 1800s. The studies of Ahmad et al. 2 and Moradi et al. 3 stated that human-induced carbon emissions have steadily increased global temperatures. Based on the existing data, it is evident that numerous major disasters occurred in different places around the world in 2023. 4 In February 2023, strong winds and high temperatures led to devastating forest fires in Chile's central and southern regions. These fires caused significant repercussions, including loss of human lives and widespread destruction of both property and natural resources. 1 Uruguay is grappling with a substantial drought stemming from a prolonged absence of rainfall since September 2022, coupled with rising temperatures during the summer months. Consequently, the Uruguayan government has declared a state of emergency in response to the situation. In March and June 2023, heavy rainfall in northern Paraguay and Argentina triggered substantial flooding. This catastrophic event forced numerous households to evacuate their homes. On February 6, 2023, two major earthquakes struck southeast Turkey and Northern Syria, leading to widespread devastation, the tragic loss of over 50,000 lives, and immediate disruption to local communities and their livelihoods. 2 In the recent past, specifically on September 8, 2023, Morocco saw a significant earthquake measuring 6.8 on the Richter scale. This earthquake tragically resulted in loss of life and left numerous individuals with injuries. In 2022, the Centre for Research on the Epidemiology of Disasters (CRED) recorded 187 occurrences of natural catastrophes in 79 countries. These events were primarily attributed to climate-related issues. Natural disasters in 2022 affected approximately 50 million people and are expected to yield economic losses exceeding 40 billion US dollars. It is worth noting that Asian countries such as India, Pakistan, Bangladesh, and the Philippines were among the hardest-hit countries. 3 These interlinked disasters underscore the crucial necessity for governments to collaborate at COP27 and accelerate climate action.
The signing of the 2015 Paris Climate Agreement spurred countries into swift action to reduce carbon emissions and prevent the disastrous consequences of climate change. 5 Various stakeholders, including scientists, the Intergovernmental Panel on Climate Change (IPCC), and other worldwide regulatory agencies, have emphasized the critical need to limit global warming. The dramatic shifts in weather patterns and temperatures resulting from these environmental issues have adversely impacted human existence. 6 Recently, the international community must immediately take strong measures to counteract these trends. Hence, a key goal of COP27 was to motivate nations to strengthen their commitments to reducing greenhouse gas emissions and to limit the global temperature with the ultimate target of capping it at 1.5°C. 7 Green financing has taken center stage at COP27 due to the escalating global climate changes and considerable environmental degradation. Green finance is a holistic framework encompassing investments and financial activities to bolster sustainable development initiatives and foster the economy's sustainable advancement.8,9
The following points highlight key recommendations for addressing climate-related challenges during COP26 and COP27. First, these conferences resulted in a significant achievement: a consensus to give financial resources to support nations that are particularly susceptible to the negative impacts of climate-related disasters such as floods, droughts, and environmental catastrophes. Second, the conference underscored the urgent need for immediate action in addressing climate-related challenges. In line with the United Nations (IPCC) recommendations, it is paramount to constrain global warming to around 1.5°C. Achieving this objective necessitates a decline in global greenhouse gas emissions by 43% by 2030. Third, at the latest stage of climate action, there is a strong emphasis on accountability for commitments made by sectors, businesses, and institutions. The objective is to prevent a situation where efforts are disregarded once their importance is reduced. Mr Stiell (Executive Secretary of UN Climate Change) highlighted the focus on accountability in his opening speech at COP27. UN Climate Change prioritizes the transparency of commitments from businesses and institutions in 2023. The UN Secretary-General has called for a plan to ensure transparency and accountability with non-state actors to be developed early next year.
The BRICS countries have actively participated in the COP meetings and have emerged as leaders in implementing strategies aimed at decarbonization. These countries have implemented several strategies and measures to tackle the issue of climate change, acknowledging their substantial role in global GHG emissions and their susceptibility to its consequences. For example, these countries have significantly invested in various renewable energy sources, including solar, wind, and hydropower.6,10 Exemplifying its global prominence, China is the foremost manufacturer and user of solar panels and wind turbines worldwide. 11 Furthermore, India, China, and Brazil have implemented extensive afforestation and reforestation endeavors to augment carbon sequestration and mitigate deforestation. Additionally, China has emerged as a prominent advocate for the advancement of green finance, shown by its proactive efforts to promote the issuance of green bonds to finance environment-friendly and low-carbon initiatives. The BRICS countries, known for their rapidly growing economies and substantial environmental footprint, play pivotal roles in shaping sustainable development trajectories. Examining their approaches to climate change offers insights into harmonizing economic growth with ecological considerations, highlighting the imperative for alternative energy solutions and robust environmental policies.
Studying BRICS countries holds paramount importance due to their significant roles as major contributors to global GHG emissions. In particular, China, India, and Russia stand out as pivotal players in this regard, with each country demonstrating substantial population growth, robust economic activities, and notable carbon emissions. Especially, these three countries collectively account for a significant portion of the world's GHG emissions, as evidenced by data from EDGAR 2020. 4 In 2021, China emitted a remarkable 11,336 million metric tons of CO2, making it the highest worldwide emitter of these GHGs. Approximately 58% of China's energy production is from coal, a carbon-intensive fuel. Consequently, the combustion of coal in China's industrial and power sectors releases considerable amounts of CO2 into the atmosphere. 5 , 6 In Addition, India is the third-largest CO2 emitter worldwide, producing 2674 million metric tons of CO2 emissions in 2021. Coal remains the primary energy source in India, meeting around 44% of the country's energy requirements. Additionally, petroleum and other liquid fuels constitute around 24% of India's energy mix (Energy Information Administration, 2021). 7 It is important to note that Russia is the fourth-largest contributor to CO2 emissions globally, emitting 1712 million metric tons of CO2 in 2021 (Energy Information Administration, 2021). 8 The abundance of natural gas reserves in Russia makes it a significant player in global energy markets, with natural gas serving as the country's primary energy and power generation. Moreover, coal usage in various industries and power generation increases Russia's CO2 emissions.
Figures 1 and 2 provide a comprehensive overview of climate change and green financing trends within the BRICS countries. A closer examination reveals a notable pattern: climate change is on a declining trajectory solely in Russia, contrasting with the overall positive trend of increasing green financing across all nations except Brazil within the BRICS consortium.
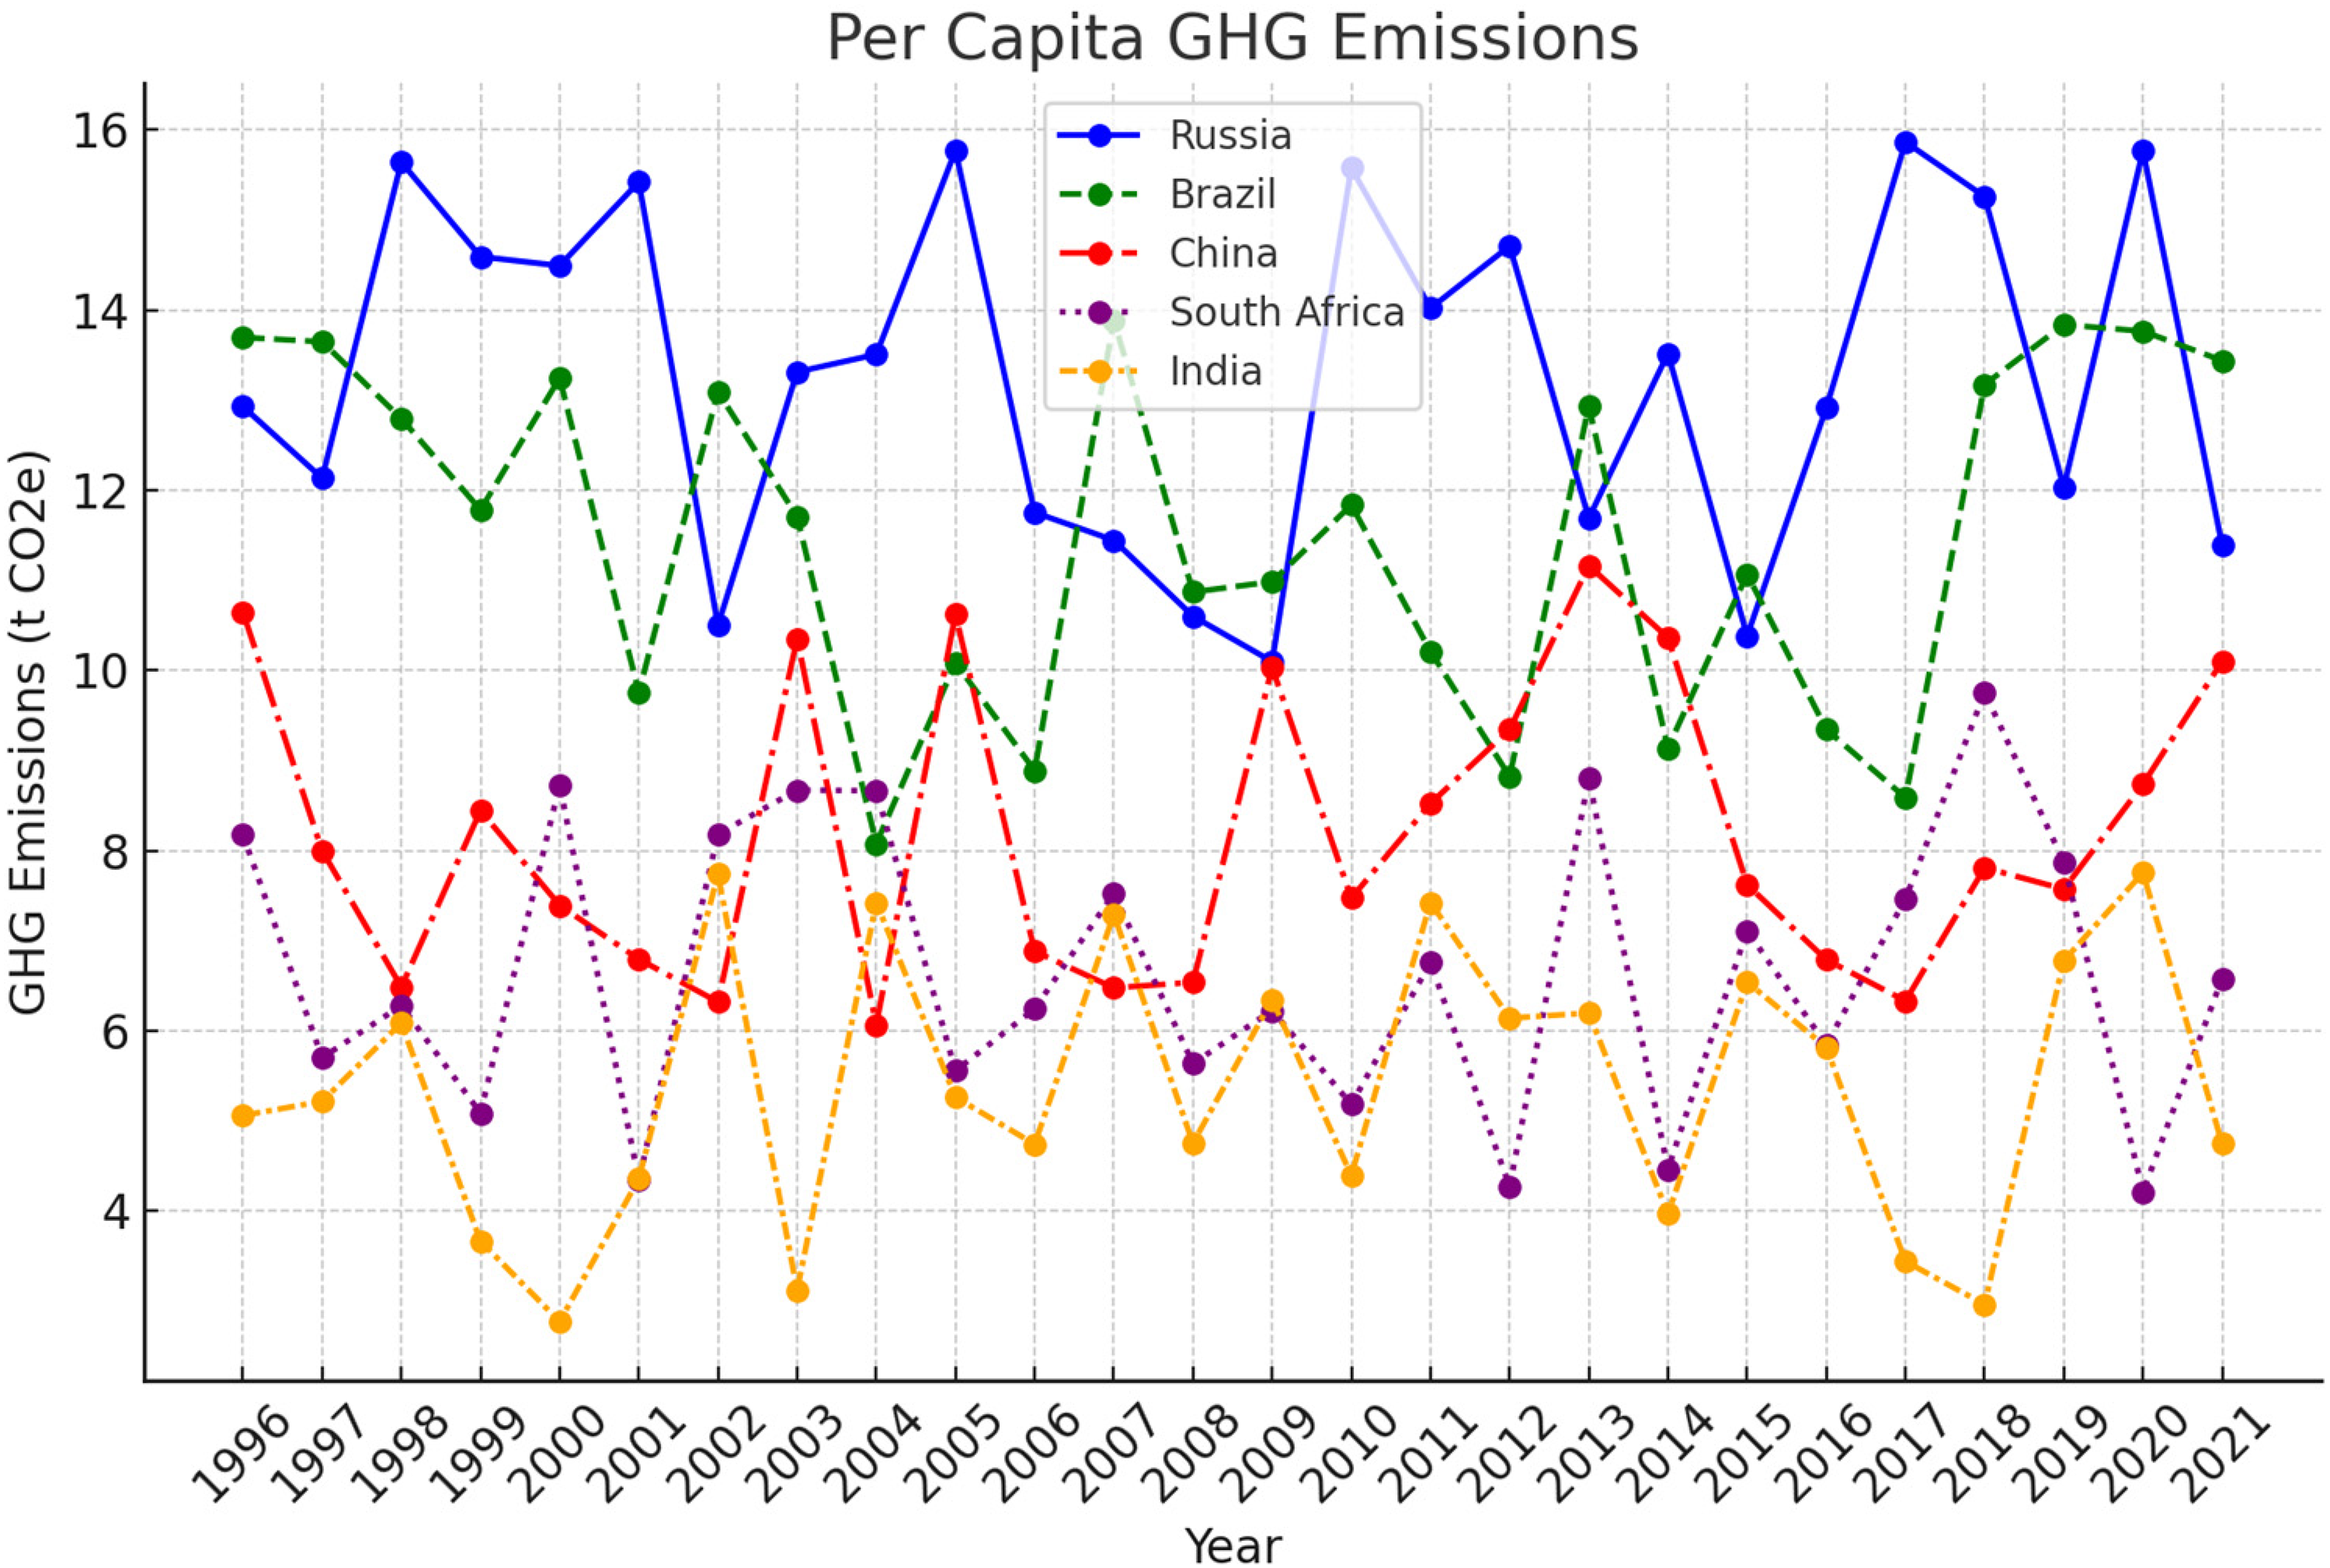
Climate trends in BRICS countries. Source: Author's Allusion (WDI).
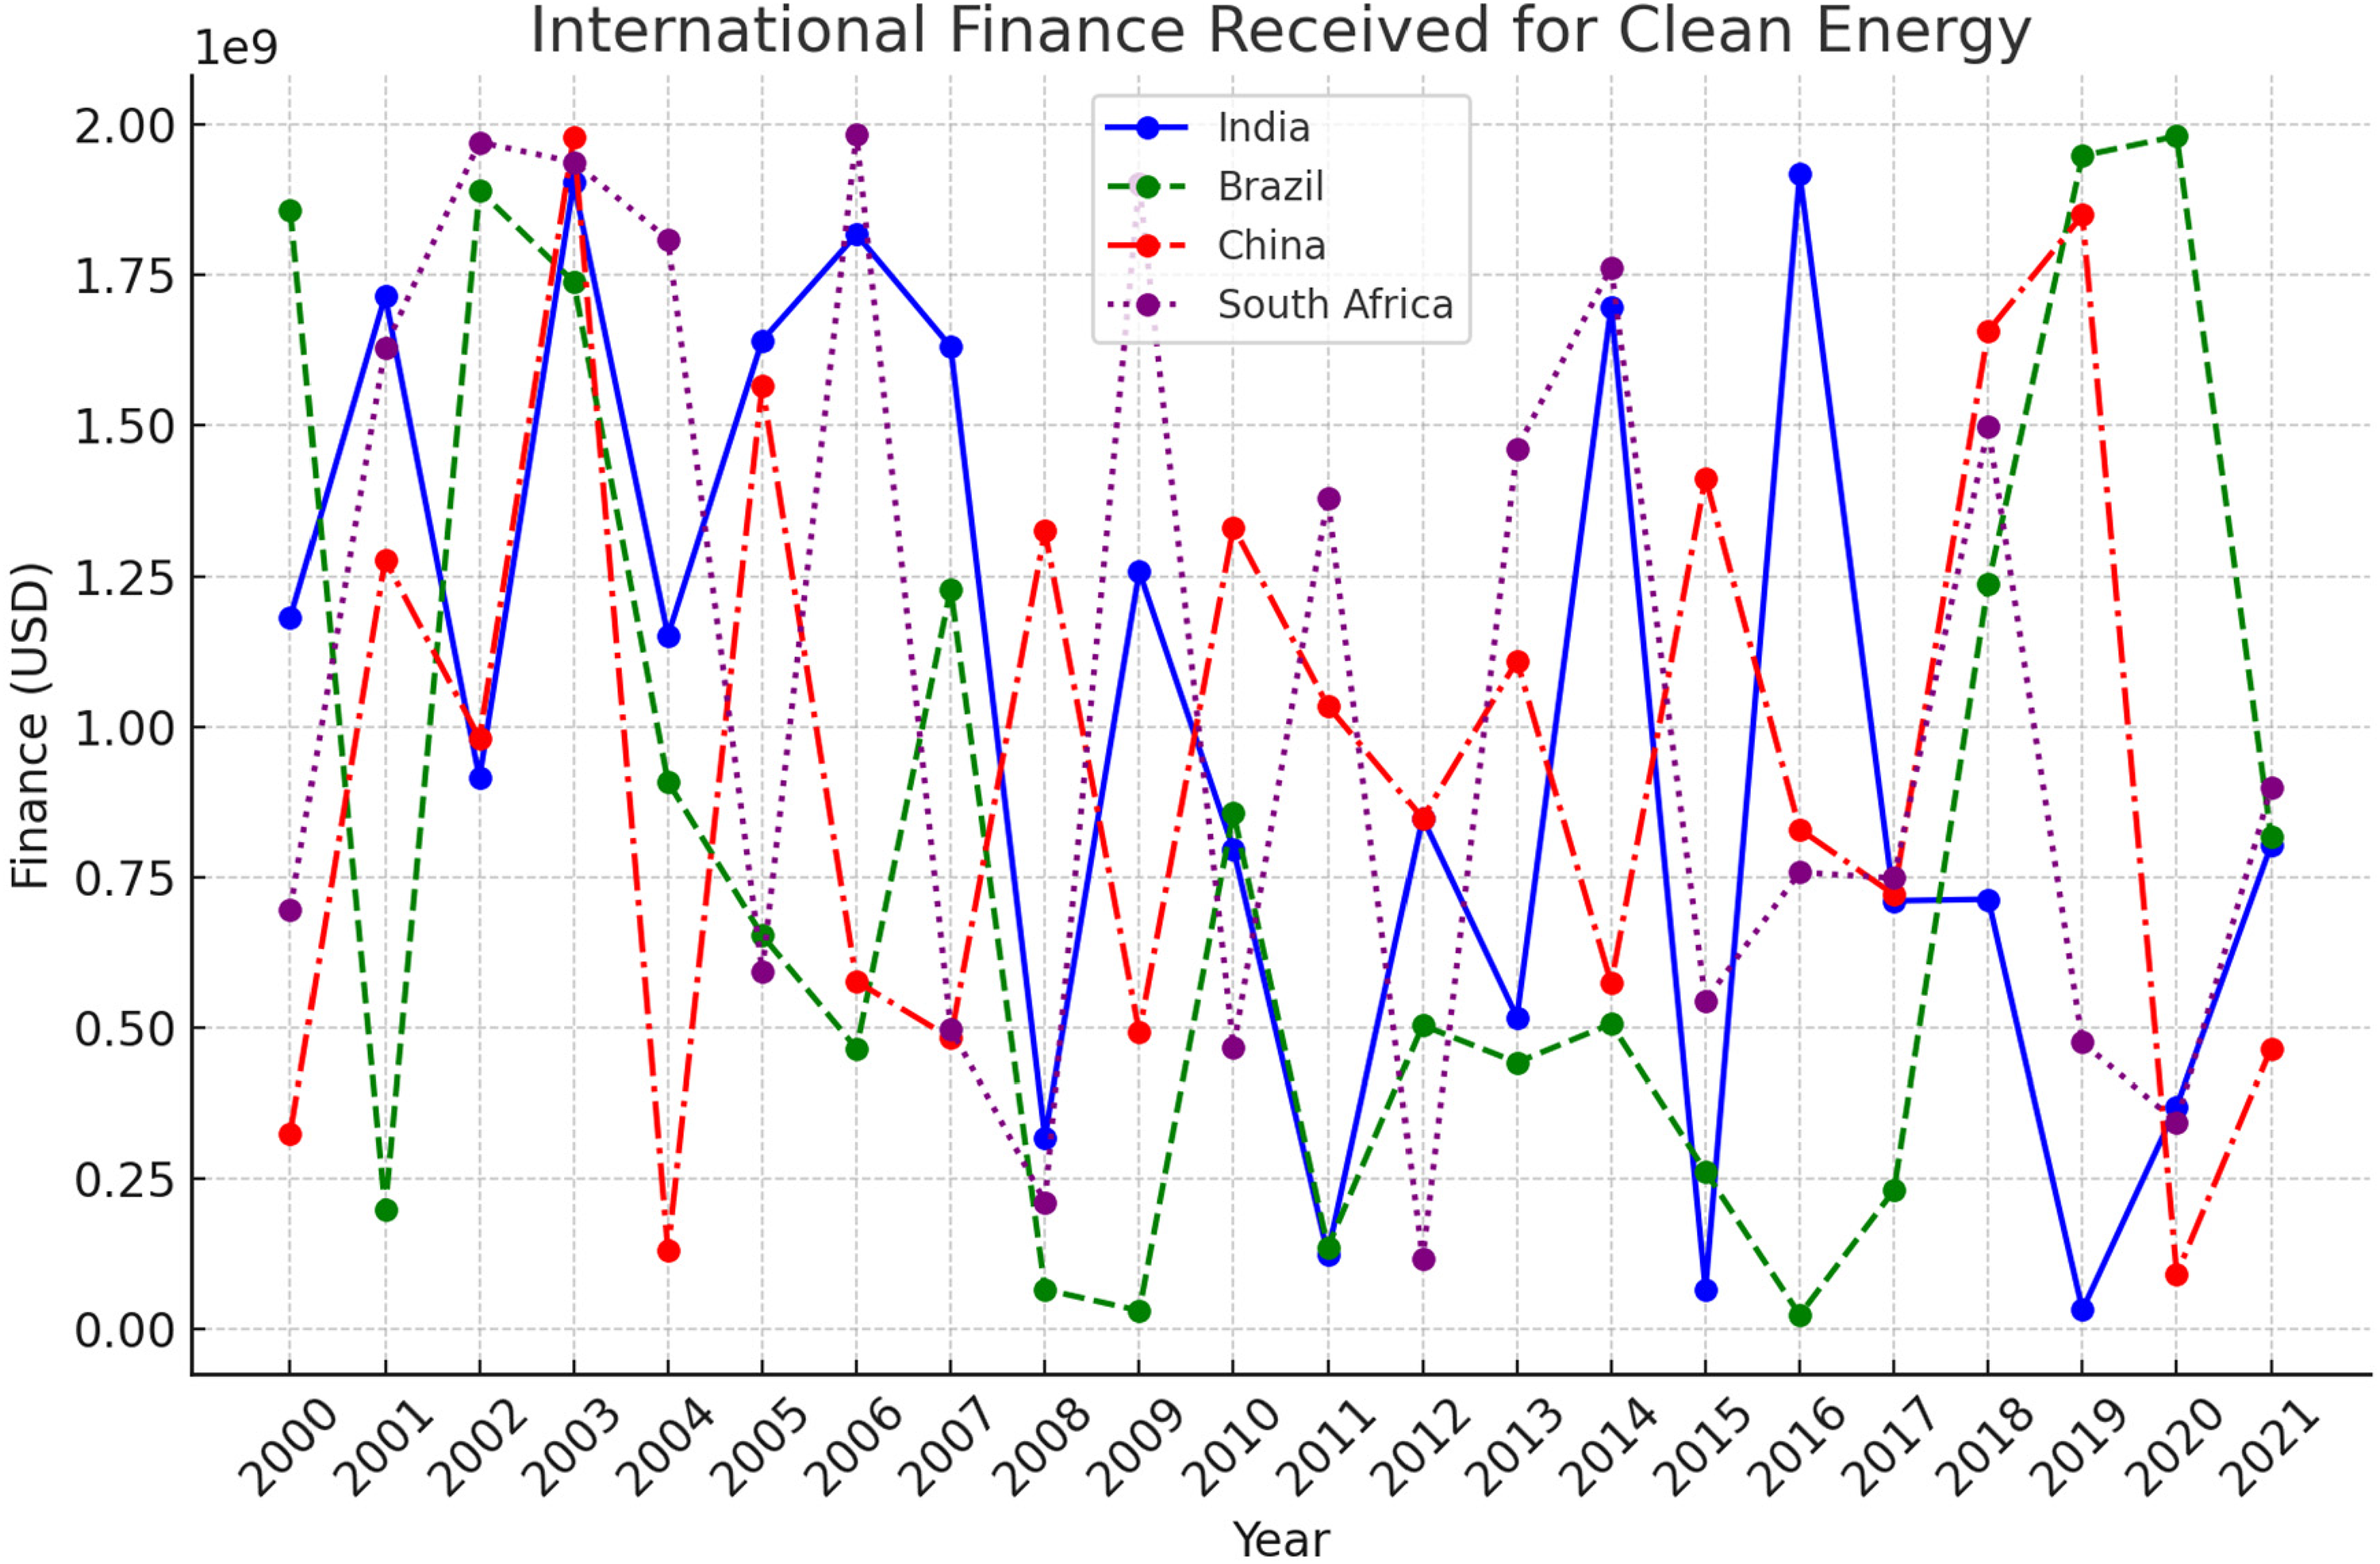
Green Financing trends in BRICS countries. Source: Author's Allusion (WDI).
This study encompasses multiple objectives. The primary aim of this study is to evaluate whether BRICS countries have successfully met the targeted recommendations established at COP26 and COP27. Based on this assessment, this study will formulate policy recommendations for the upcoming COP29 conference, scheduled to be held in Azerbaijan. Second, this research examines how green finance, natural resource utilization, governance standards, and other factors impacted climate change within BRICS countries from 1990 to 2021. Third, this study utilizes a grey forecasting model to predict the trends in future energy production (from renewable and non-renewable energy sources). These projections are important as they directly and indirectly influence climate change dynamics. By integrating this innovative analytical approach into our research framework, we aim to provide more accurate forecasts and deeper insights into the potential impacts of energy-related activities on climate change. Fourth, this study aims to assess the validity of the N-shaped Environmental Kuznets Curve hypothesis in BRICS countries. Last, the present study comprises two primary analyses: basic and additional analyses. For the basic analysis, we employ panel econometric techniques, including panel autoregressive distributed lag (ARDL), fully modified ordinary least squares (FMOLS), dynamic ordinary least squares (DOLS), and cross-sectional Im, Pesaran, and Shin (IPS) methods. These methods enable a comprehensive examination of the relationships between variables across time and individual entities within the panel data framework. In contrast, this study utilizes cross-sectional autoregressive distributed lag (CS-ARDL) and grey forecasting analysis for the additional analysis. These approaches offer distinct advantages in capturing the dynamics of complex systems, particularly in forecasting future trends and understanding causal relationships.
The article’s subsequent section offers a background of the study, including the main achievements of COP26-27 and an extensive literature review, followed by section three, which details the study's methodologies. Section four presents empirical results and discussion, while section five encompasses a thorough analysis, conclusion, and formulation of policy recommendations.
Progress from COP26 to COP27: key achievements and developments
COP26, initially planned for 2020 in Glasgow, was postponed to 2021 due to the global COVID-19 pandemic. Its primary objective was to secure and enhance countries’ promises to reduce GHG emissions by 2030. The conference emphasized discussions on strategies for mitigating the impacts of climate change and increasing financial support for climate programs, with a particular focus on assisting developing countries. Additionally, the COP26 agenda aimed to encourage all parties, including BRICS countries, to share specific policies, measures, and actions toward climate goals, emphasizing the need for explaining existing goals and initiating concrete actions. At the 15th BRICS Summit, leaders from Brazil, Russia, India, China, and South Africa collectively resolved to expedite low-carbon initiatives and enhance resilience to climate change, bolstering efforts in the multilateral arena and reinforcing unity and collaboration to address the challenges of global warming. 9 During this summit, leaders of BRICS countries underscored the importance of addressing climate change issues, which was made feasible by the heightened focus on these matters in COP26.
The completion of the COP26 meeting was deemed unsatisfactory due to a significant lack of important progress. The primary obstacle was the insufficient climate action from wealthier countries, which bear the primary responsibility for elevated emissions. This failure posed a significant challenge to limiting global warming to 1.5°C by 2030. Moreover, there was a notable shortfall in adequately addressing the allocation of funds to support less developed countries grappling with the adverse impacts of climate change. 12 While COP26 featured extensive debates and recommendations, the intricate details of these discussions exceed the scope of this study.
In their study, Wang et al.8,13–18 analyzed many aspects of COP26 and substantiated the indispensability of green funding and social responsibilities for implementing COP26 inside a nation. Dwivedi et al. 19 conducted a study examining the nexus between COP26 and climate change policy, with a particular emphasis on the impact of digital technology. Their findings demonstrated that COP26 served as a potent international endeavor, significantly contributing to advancing policies geared toward environmental preservation. Dogan et al. 20 emphasized the COP26 aims as a supplementary iteration of the Kyoto Protocol and characterized them as explicit guidelines for nations. Additionally, Allam et al. 21 conducted an in-depth analysis of factors influencing the attainment of COP26 decarbonization goals. Their findings offer compelling evidence for the importance of the “Green New Deals” approach, which integrates social protection measures with an expedited drive toward sustainability. Mao et al. 22 examined the critical relationship between resource management, environmental sustainability, and economic growth at COP27 and found that resource rents, economic expansion, and capital creation increase emissions. Gu et al. 7 investigated the impact of natural resource exploitation and environmental policy on green financing in OECD countries in the context of COP27 objectives. The findings suggested that natural resource exploitation and the composite risk index have adverse effects on green financing, while factors like GDP per unit of energy use and environmental regulations positively influence it. Furthermore, Wang et al.8,13–18 examined the impact of the COP26 objectives on carbon emissions in the United States throughout the period spanning from 2013 to 2020. The findings indicated that the objectives set out by COP26 had a discernible effect on the ecological condition of most states inside the United States. The study conducted by Medranda-Morales et al. 23 examined the COP26 effects on Ecuador's digital media landscape. The acceleration of digital media as a component of sustainable development may be achieved by implementing the COP26 aims.
Comprising Brazil, Russia, India, China, and South Africa, these nations have been instrumental in global climate governance, actively engaging in multilateral efforts to combat climate change. As major economies and industrialized countries, they wield significant influence in shaping environmental policies and addressing the challenges posed by climate change. To summarize the above discussion, previous research has not examined the correlation between climatic, economic, and governance factors under the COP26 and COP27 goals. Hence, the current study aims to fill this specific gap in the current body of research.
Comprehensive review on climate change, green financing, natural resource extraction, and institutional efficiency
The current literature shows no agreement on how climate change, green finance, natural resource extraction, and institutional effectiveness interrelate. Some researchers argue that rising climate change is associated with increased CO2 emissions. Recent research underscores the vital role of green finance in advancing environmental sustainability and economic growth. 13 Meo and Abd Karim 24 discovered a negative correlation between green finance and carbon emissions. Numerous studies have investigated various facets of green finance, including its relationship with technological innovation, globalization, economic and financial development, renewable and fossil fuel energy consumption, energy prices, and industrialization. These variables have been widely employed in the past decade to analyze green financing.15,25,26
Furthermore, many researchers have introduced additional variables to explore the link between climate change and green finance. For example, Akomea-Frimpong et al. 27 and Wang et al. 14 revealed that interest rates, religion, risk factors, social inclusion, social justice, and banking regulations significantly influence green financing, directly and indirectly impacting climate change. In Reference 28 study, several pivotal factors were pinpointed in promoting green funding and combating climate change. These factors encompass renewable energy consumption, population size, foreign direct investment (FDI), carbon dioxide emissions, inflation rate, grants for technical co-operation, domestic credit to the private sector, and investments in research and development. Green finance has a negative impact on environmental degradation in G7 and E7 countries. 16 Furthermore, Ang and Fredriksson 29 conducted studies investigating the impact of institutional quality on climate change. However, Olabi and Abdelkareem 30 examined renewable energy consumption as a determinant of climate change.
Several academic research have used different econometric approaches to examine the relationship between climate change and other controllable factors. For instance, Warsame et al. 31 examined the effects of climate change on agricultural production in Somalia from 1985 to 2016. They utilized the ARDL bounds testing technique for long-run cointegration analysis and Granger causality for short-run causal relationships. Additionally, Ceesay and Ndiaye 32 investigated the impact of climate change on food security, economic development, population growth, and the agricultural sector using data from 1971 to 2020. Their study applied various econometric approaches, including vector autoregressive analysis, Granger causality analysis, ARDL, and error correction analysis. Khan et al. 33 utilized different statistical methods, such as Pesaran's cross-sectional dependency test, the modified Wald test for heteroskedasticity, and Wooldridge's test for autocorrelation. They incorporated a fixed effect model into OLS regression analysis. Likewise, Li et al. 34 employed innovative techniques, utilizing wavelet power spectrum and Wavelet Coherence methods. In the most recent research by Ahmad et al., 2 they applied the Mean Group class estimate method. Khan et al. 33 utilized the Johansen cointegration technique, while Lee and Moumbark 35 employed GMM estimation to analyze climate change issues. However, our study differs from the previous research by adopting distinct econometric methodologies. The Johansen cointegration test was excluded from this investigation because it assumes that variables must be integrated into the first difference when examining unit roots. However, the GMM estimator has specific assumptions tailored for panels with short periods and substantial data. Traditional panel cointegration approaches fail to address cross-sectional dependencies in the error term, resulting in suboptimal results. Hence, we utilize advanced second-generation panel econometric methods, including CS-ARDL, FMOLS, DOLS, and the Westerlund cointegration technique, focusing on up-to-date datasets to support our comprehensive analysis. In light of these factors, we must address a fundamental question: Can the combination of green financing, natural resource extraction, and institutional quality collectively impact climate change in BRICS countries, contributing to the achievement of sustainable development and growth?
In conclusion, this discourse highlights the urgency of establishing a comprehensive policy framework tailored to the needs of BRICS countries, which would significantly facilitate their pursuit of COP26 and COP27 objectives. The study's primary focus is examining the ramifications of natural resource exploitation, renewable energy consumption, green financing, and institutional quality on climate change from 1996 to 2021. This research addresses many critical gaps: first, it evaluates the attainment of COP26 and COP27 targets by BRICS countries, allowing for informed policy recommendations for COP29. Second, it broadens the scope by considering the often-overlooked interactions between natural resource extraction, renewable energy utilization, and green financing in shaping climate change in BRICS countries. Third, it rigorously tests the applicability of the Environmental Kuznets Curve hypothesis within the BRICS context. Fourth, it leverages advanced second-generation panel econometric techniques, such as Panel ARDL, FMOLS, DOLS, and IPS cointegration. Fifth, it pioneers exploring the combined effects of the selected independent variables, shedding new light on their synergistic impacts. Sixth, it utilizes the most up-to-date data, enhancing the precision and relevance of the analysis. Finally, it uses additional analysis by employing CS-ARDL and the grey forecasting model to assess future trends.
Methodology
Comprehensive research has been executed on the factors contributing to the increase in the emission of GHG by using time series and panel data analysis in different fields. Previous studies’ most commonly used variables are economic growth, renewable energy consumption, government effectiveness, green finance, and natural resource rent. These variables can potentially influence the control and transformation of CO2 emissions and facilitate the transition from fossil fuel energy to clean energy consumption in various production sectors. In this study, we have utilized all the mentioned variables in the case of BRICS countries for 1996–2021.
The data for greenhouse gas emissions, renewable energy consumption, growth rate, patent (as a proxy for green finance), renewable energy consumption, and natural resource rent were sourced from the World Bank. Meanwhile, the data about government effectiveness was acquired from the International Country Risk Guide (ICRG). Consequently, the mathematical model takes the following form.

GHGE, which stands for greenhouse gas emissions, is measured in kilotons of CO2 equivalent, reflecting the total emissions contributing to climate change. GDPG is acknowledged as a significant driver of these emissions. The study also considers GF, which represents patent applicant data by residents of countries, utilized here as an indicator of green finance. NRR, or natural resource rent, is another crucial factor in this analysis. Additionally, the model includes GEF, denoting government effectiveness in environmental management. Lastly, REC represents clean energy con
The final panel data econometric model becomes as follows.

Based on the theoretical framework and hypothesis, the possibility of sigh is as
The same is the case for the N-shaped environmental Kuznets cure as
The role of government in controlling GHG emissions is pivotal in addressing climate change and environmental sustainability.
39
Governments worldwide are crucial in implementing policies, regulations, and initiatives to mitigate and reduce emissions. Therefore, the expected sign of GEF is negative
Similarly, the sign of green finance is also expected to be negative, that is,
The relationship between natural resource rent and GHG emissions is influenced by various factors, including the type of natural resources involved, the extraction and utilization processes, and the policies in place. The extraction and burning of fossil fuels, such as coal, oil, and natural gas, are major contributors to GHG emissions.
2
Countries or regions heavily reliant on fossil fuel extraction may experience a significant correlation between natural resource rent (income derived from the extraction of natural resources) and GHG emissions. Furthermore, some natural resources are associated with carbon-intensive industries. For example, certain mining and manufacturing processes can contribute to GHG emissions. The extent of emissions depends on the technology and practices employed in resource extraction and processing. Natural resource rent is not limited to energy resources.
7
Agriculture, forestry, and other land-use activities also generate income.
42
Land-use modifications, such as deforestation or the transformation of natural ecosystems, can release stored carbon and contribute to GHG emissions; hence, by keeping in view the above points, the sign of NRR is expected to be negative, that is,
Estimation techniques
In cointegration analysis, assessing cross-sectional dependency and slope heterogeneity among the variables of interest is crucial. To evaluate cross-sectional dependency, Pesaran's test from 2004 is employed. Additionally, a slope heterogeneity function is used for this purpose.


Panel unit root tests
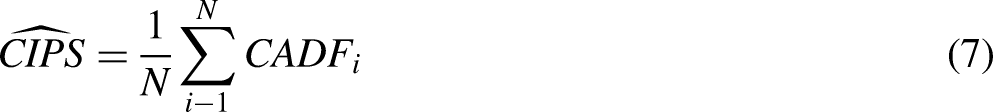
The first stage in this study is to determine whether the data is stationary. These tests are important as they help determine if the relevant variables are integrated into order one, denoted as I(1). When combined in this order, variables exhibit a unit root and are non-stationary. Once it is established that the variables are integrated at I(1), the next step is to estimate the long-run relationship among the selected variables. For this purpose, a panel unit test is employed, that is, IPS (CIPS).


Cointegration techniques
Different studies in the literature have applied various cointegration methods to analyze the relation among GHG emissions, economic growth (linear and cubic form), green finance, renewable energy, natural resource rent, and government efficiency. In this investigation, we employed the widely recognized panel ARDL bound test of cointegration, as introduced by Pesaran et al. 43
The ARDL model is a widely used econometric model for examining the presence of cointegration among time series and panel variables. It is beneficial when dealing with small samples or mixed-order integration among variables. The ARDL model is an extension of the Engle–Granger two-step cointegration procedure. It allows for the inclusion of lagged levels and differences in the variables in the model. The model used in this study is also employed by Wang 44 to investigate environmental sustainability in BRICS countries.
Here is the general form of an ARDL (p, q) model

GHGE represents the controlled variable, and Xt represents the set of all control variables. Δ denotes the first difference operator. However, p and q are the lag lengths chosen based on AIC. α0 and γ0 are the intercept terms. Similarly, αi and βj are the coefficients on the lagged differences in the dependent and independent variables, respectively. εt is the error term. The ARDL model allows for both short-run dynamics (captured by the lagged differences) and long-run equilibrium relationships (charged by the lagged levels) between the variables. The ARDL model can be estimated using standard regression techniques, and then tests for cointegration and the presence of a long-run relationship can be conducted. When using the ARDL model, ensuring that these variables are integrated in the same or mixed order is essential. The ARDL model provides a flexible framework for examining short- and long-term relationships between non-stationary time series variables.
The bounds test is often employed with the ARDL model. In this context, we would test the joint significance of the coefficients on the lagged levels of both variables to determine if there is evidence of cointegration. If the estimated coefficient on the lagged dependent variable in the co-integrating relationship significantly differs from zero, it suggests a long-run relationship. The null hypothesis is that no cointegration exists among the set of variables. In this study, we used the F-test Pesaran et al. 43 presented to check whether long cointegration exists. Suppose the F-statistic, calculated at a specified significance level, falls beyond the established critical bounds. In that case, a decisive conclusion can be reached regarding cointegration, even without knowledge of the regressors’ integration order. Rejection of the null hypothesis occurs when the computed F-test statistic surpasses the upper bound, indicating evidence against the absence of cointegration. Conversely, if the F-statistic is below the lower bound, there is insufficient support to reject the null hypothesis. When the F-statistic is within the range of the lower and upper bounds, it is not possible to make clear and certain conclusions. This analytical framework aligns with the cointegration analysis methodology proposed by Pesaran et al. 43 This study applied FMOLS and DOLS to check the validity and robustness of the results.
FMOLS estimation technique
An essential question arises regarding the choice of employing FMOLS techniques in this study. There is evidence that FMOLS proves particularly beneficial in addressing endogeneity concerns and non-stationary data. 45 Its application allows the study to mitigate potential biases in the estimation process, thereby enhancing the reliability and accuracy of the results. By incorporating FMOLS, the analysis becomes more robust as it effectively tackles common econometric challenges. These methods are valuable tools in econometrics for analyzing long-run relationships among variables in panel datasets. The use of FMOLS in panel cointegration estimation has been proposed by Pedroni. 46 The same technique has been employed by Ahmad et al. 2
The pooled FMOLS technique as a modification of standardized OLS is the following:

The dynamic ordinary least square (DOLS) estimation technique
Initially designed for time series analysis, Kao and Chiang
47
extended the DOLS estimator to panel data analysis. The DOLS estimation technique provides a robust and dependable method for analyzing intricate relationships within time series data.
48
This renders it an invaluable tool for investigating factors influencing carbon emissions, adopting renewable energy, technological innovations, and initiatives aimed at sustainable development, all geared toward achieving carbon neutrality objectives. The same technique has been employed by Gu et al.
7

Choice of lag length (q)
The number of lags (q) is typically determined using information criteria or other model selection techniques. The appropriate lag length depends on the specific dataset and research context.
Advantages of DOLS estimation
Based on Monte Carlo simulations, Kao and Chiang concluded that the DOLS estimator performs better in finite samples than standard OLS and FMOLS estimators. DOLS is favored for unbiased estimation. DOLS is also advantageous in addressing endogeneity in the model. The technique achieves this by incorporating lead and lagged differences of the repressors, which helps suppress endogenous feedback effects.
Robust correction of endogeneity
The DOLS method provides a robust correction for endogeneity in the explanatory variables. This correction helps ensure that the estimated coefficients are not biased due to endogenous relationships among the variables. In summary, the passage discusses how the DOLS estimation technique is applied to panel data analysis, its regression equation, and its advantages, including its ability to handle endogeneity and provide unbiased estimation. It highlights the value of DOLS in econometric analysis, especially when dealing with co-integrated variables in panel datasets.
Other factors enhancing analytical precision
Since other variables can significantly contribute to GHG emissions and cause environmental damage. To enhance the authenticity and significance of our model, we have incorporated additional variables and re-estimated the model using the CS-ARDL technique. The CS-ARDL model is a robust tool in applied econometrics, particularly suited for analyzing relationships among variables in panel data contexts. It provides flexibility by accommodating both short-term dynamics and long-term equilibrium considerations, effectively addressing challenges associated with cross-sectional heterogeneity. Furthermore, we utilized advanced forecasting techniques such as the Grey model GM(1,1) and Discrete Grey Model DGM(1,1) to predict energy production from fossil fuel and renewable sources.
Concept of Grey forecasting model
The excessive utilization of fuel, coal, and other natural resources for energy production by BRICS countries highlights the urgency of investigating and forecasting future resource consumption, as it directly impacts climate change. Sustaining continuous high levels of natural resource consumption is unsustainable in the long term. There is an imperative to regulate the use of fossil fuels and other substances in energy production within BRICS countries and globally to mitigate environmental degradation.
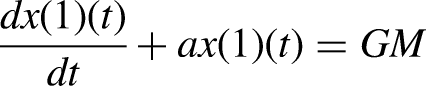
Researchers and government officials employ forecasting techniques to anticipate future values in short- and long-term scenarios. While diverse forecasting methodologies are utilized in the literature, Grey models, introduced by Deng Julong in the 1980s, have garnered increased attention in recent years. Scholars have explored different aspects of these basic Grey models, increasing their popularity in forecasting applications. The equation for GM(1,1) is expressed as:
Various researchers have introduced novel modifications to the quality of grey terms to enhance model accuracy. Examples include GM (1,N,τ) by Qian and Sui, 50 DGM(1,1,m) by Ye et al., 51 FAGM (1,1,D) by Wu et al., 52 and RDGM (1,1) by Wu et al. However, each model has its limitations. In this article, we implement the model proposed by Fan et al., 53 which incorporates an adaptive variable weight cumulative optimization approach, DGM (1,1), yielding superior simulation and prediction accuracy compared to traditional models. The DGM (1,1) model experienced further enhancement by Luo et al., 49 incorporating additional features such as trigonometric functions and time trend terms, making it suitable for analyzing panel series data with periodicity and trends. Recently, Raheem et al. and Javed et al. utilized this model for forecasting energy consumption in G20 countries and greenhouse gas emissions in four industries in China and India, respectively. In this study, we employ the improved versions of GM (1,1) and DGM (1,1).
Data description
This study employs annual data covering 1996 to 2021, encompassing BRICS countries. The data used in this research are sourced from various data collection and provider resources. The study focuses on several key variables affecting greenhouse gas emissions. This variable represents GHG emissions from the entire spectrum of available fossil fuel emissions sources. The variable Patent applications is measured by the number of patent applications by residents of the countries. However, the variable REC represents renewable energy consumption from the entire spectrum of available renewable energy sources. Another variable is the natural resource rent, measured by the sum of all rents incurred by all natural resources. Moreover, the variable government effectiveness measures a government's efficiency and effectiveness in executing policy regulations. It evaluates the implementation quality and the commitment to uphold these policies impartially, avoiding political biases or influences. This data is obtained from the International Country Risk Guide (ICRG). The final variable included in the study is the economic growth (both linear and cubic form), which is the author's own calculation. These specific variables are selected for the model based on factors highlighted during the COP26 and COP27 conferences. Given that this study focuses on assessing these targets, it is imperative to emphasize factors relevant to these conferences.
The study utilizes data from the World development Indicators for variables related to renewable energy consumption, economic growth, patent applications, natural resource rents, and greenhouse gas emissions. Additionally, the data for government quality has been sourced from the World Governance Indicators. This comprehensive dataset spanning several decades and encompassing diverse BRICS countries allows for an in-depth analysis of the relationships and impacts of these variables on each other, particularly regarding GHG emissions and their determinants, environmental implications, and governance aspects. For further analysis, additional data were collected from the US Energy Information Administration (2021), including variables such as energy produced from fuel (measured in quad Btu), energy production from total renewables (measured in quad Btu), and energy production from coal (measured in quad Btu).
Empirical results
The primary purpose of this study is to investigate the association among economic and non-economic variables such as climate change, green financing, cubic form of economic growth, natural resource rent, renewable energy consumption, and government effectiveness. In the first stage, we applied a cross-sectional dependence test (CD) to check for the cross-sectional dependence among the variables under consideration. The results of the CD test are presented in Table 1. All the variables are correlated at a 1% significance level, as Pesaran 54 indicated in Table 1. However, the level of correlation is raging from 0.330 to 0.729. The slop heterogeneity we have implied by Pesaran. 54 The result is also indicated in Table 1, which rejects the Null hypothesis of slope homogeneity at a 1% significance level.
Cross-sectional dependence and slope homogeneity.
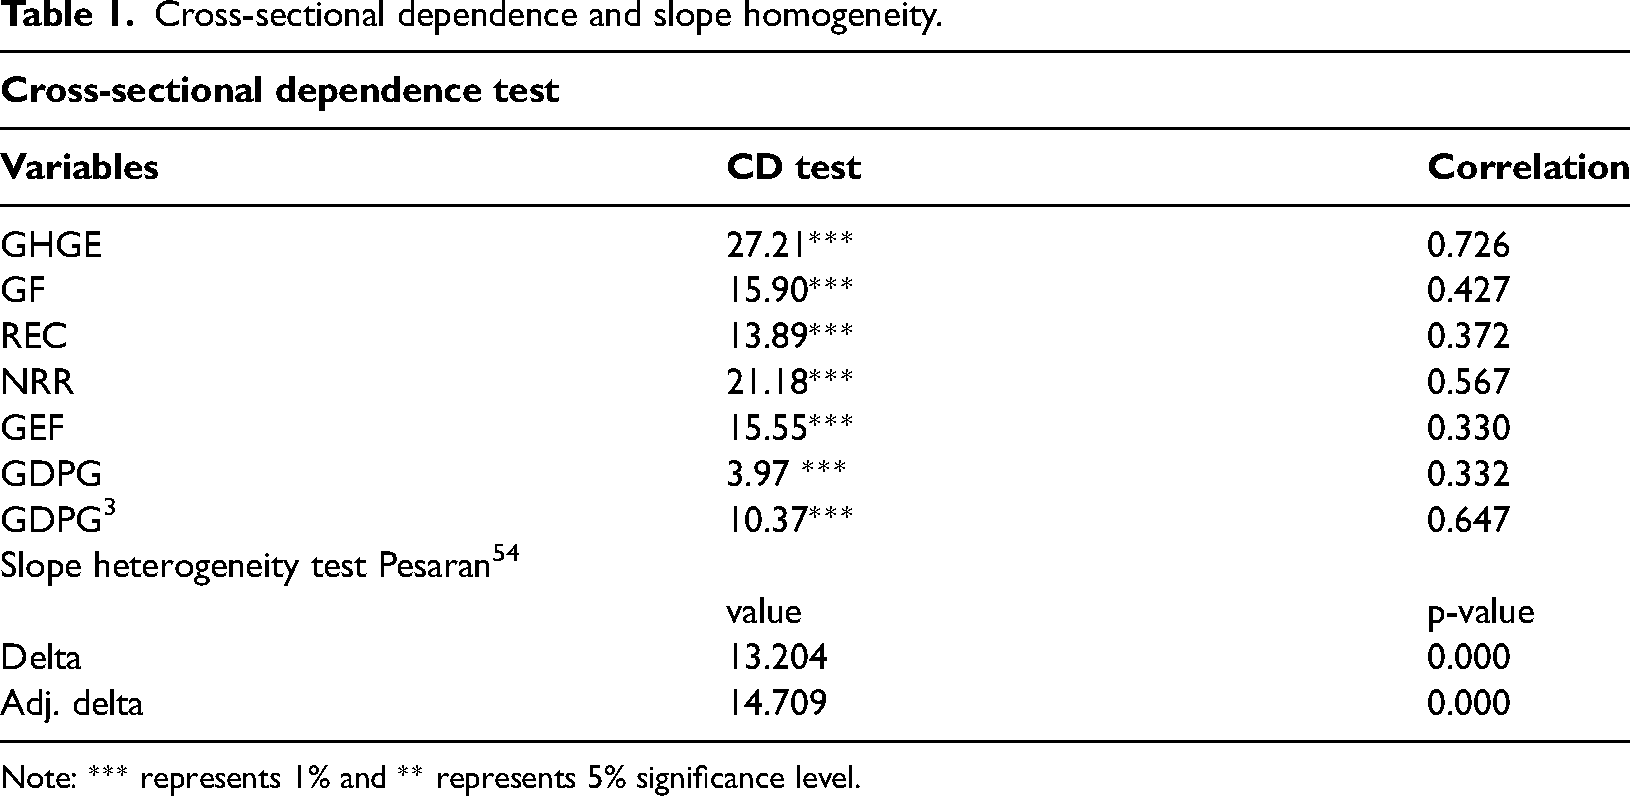
Note: *** represents 1% and ** represents 5% significance level.
The second step in the panel data analysis is to test for the order of integration. For this purpose, this study applied the CIPS test of the unit root presented by Pesaran (2007). This test is considered more effective in the panel data analysis because it incorporates the cross-sectional dependency among the variables. The results of the CIPS test are indicated in Table 2, which shows a mixed order of integration. The results of CIPS indicate that GHGE, GF, REC, and growth rate are stationary at 10% and 5% of significance, respectively. In comparison, the NRR, GEF, and GDPG3 become stationary after taking the first difference at the 1% significance level. Since the variables under consideration exhibit a mixed order of integration, we can proceed with ARDL-bound cointegration testing.
CIPS unit root results.
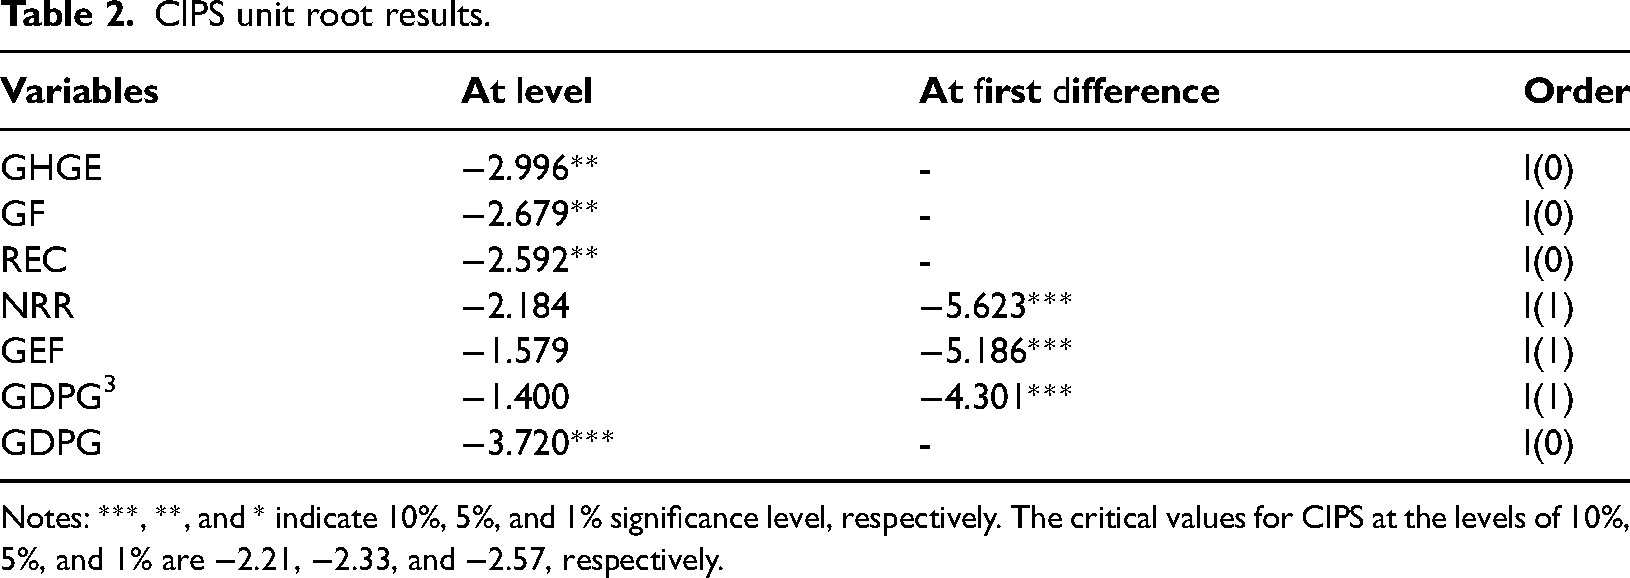
Notes: ***, **, and * indicate 10%, 5%, and 1% significance level, respectively. The critical values for CIPS at the levels of 10%, 5%, and 1% are −2.21, −2.33, and −2.57, respectively.
To investigate the long-term relationships between the variables in question by employing the cointegration test developed by Pesaran et al. 43 This approach is specifically chosen for its robustness in analyzing stable and enduring linkages among variables over extended periods. In Table 3, the values of the F-test lie above the critical importance of bounds; therefore, this is a sign of cointegration in the long run. Now, we can estimate short-run and long-run coefficients using the ARDL model.
Wald test.
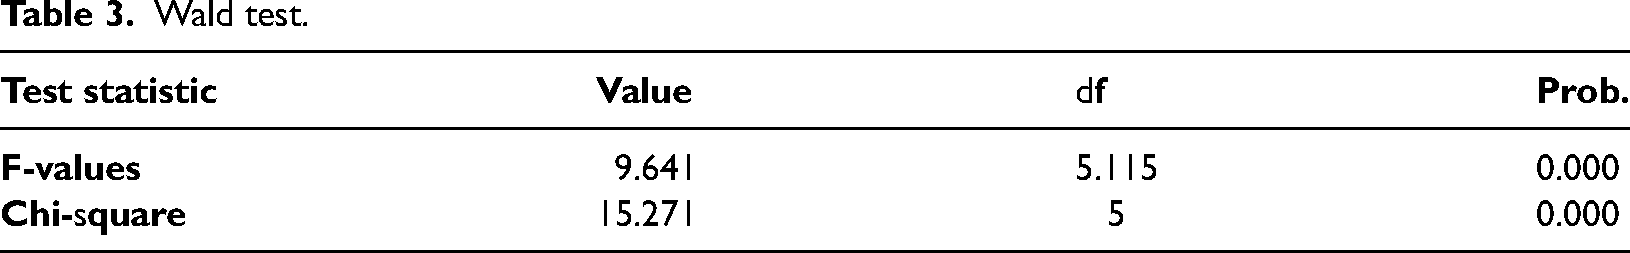
Table 4 comprises the results of ARDL for the cointegration of the variables of interest. The ARDL analysis corroborates our hypothesis regarding the significant impact of renewable energy consumption, economic growth (its cubic form), green finance, and government quality on our study's focus. However, it reveals that natural resource rents do not have a significant effect, deviating from our initial expectations. The results of the ARDL model suggest that an increase in growth rate will raise greenhouse gas emissions by 0.07% and more than 1% in the long and short run. In the short term, the observed increase of over 1% is mainly due to the escalated fossil fuel consumption that accompanies initial growth phases, resulting in increased pollution, as the Kuznets curve hypothesis indicates. Over the long term, however, this trend is expected to reverse, aligning with the N-shaped environmental curve hypothesis, suggesting a gradual pollution decline as economic growth matures. Our analysis of the BRICS countries also confirms the N-shaped environmental curve hypothesis, as shown in Table 4. The value of GDPG3 is significant in the long run at a 1% level. The computed values are 0.46 and 0.41 in the long and short run, but in the short run, it show insignificance. The findings of this study align closely with those of Agozie et al., 55 providing further evidence for the presence of the N-shaped Environmental Kuznets Curve (EKC) in BRICS countries.
ARDL estimation.
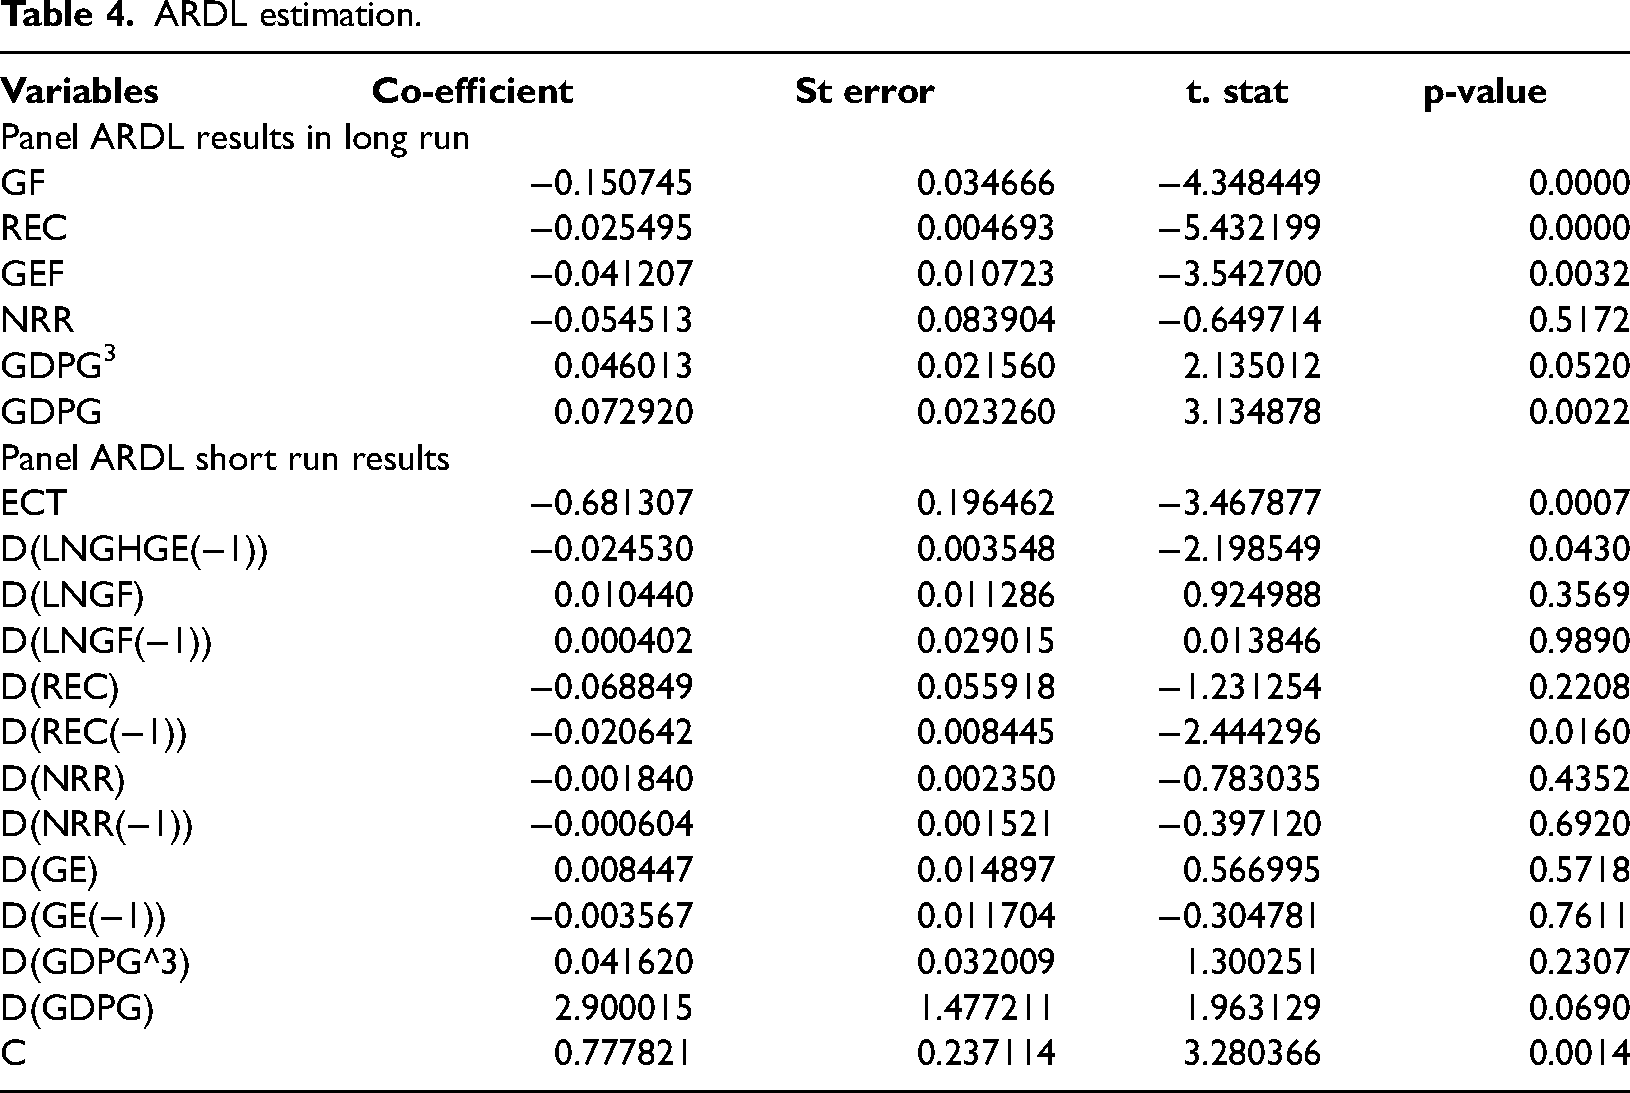
The impact of all other independent variables is according to expectations except natural resource rent, which is negative but insignificant in the long and short run, indicating that natural resource rent has no direct impact on climate change. All the variables exhibit negative signs, so they are negatively correlated with GHG emissions, meaning that any enhancement in these variables will reduce the CO2 emissions. Green financing, government effectiveness, and renewable energy consumption values are significant at 1% in the long run but insignificant in the short run as their variables have little or no impact. The three variables above take the values −0.15, −0.03, and −0.04 in the long run. The effect of green finance is 15% more than the other two variables, as reducing greenhouse gas emissions plays a crucial role. The other two variables will change the climate by 3% and 4%, respectively. The findings of this study closely align with those of Rasoulinezhad and Taghizadeh-Hesary 56 and Wang et al., 57 offering additional evidence for the existence of the N-shaped Environmental Kuznets Curve (EKC) in BRICS countries. The short-run adjusted term ECM has a value of −0.68, meaning that the short-run disturbances converge toward the long run at a speed of 68%.
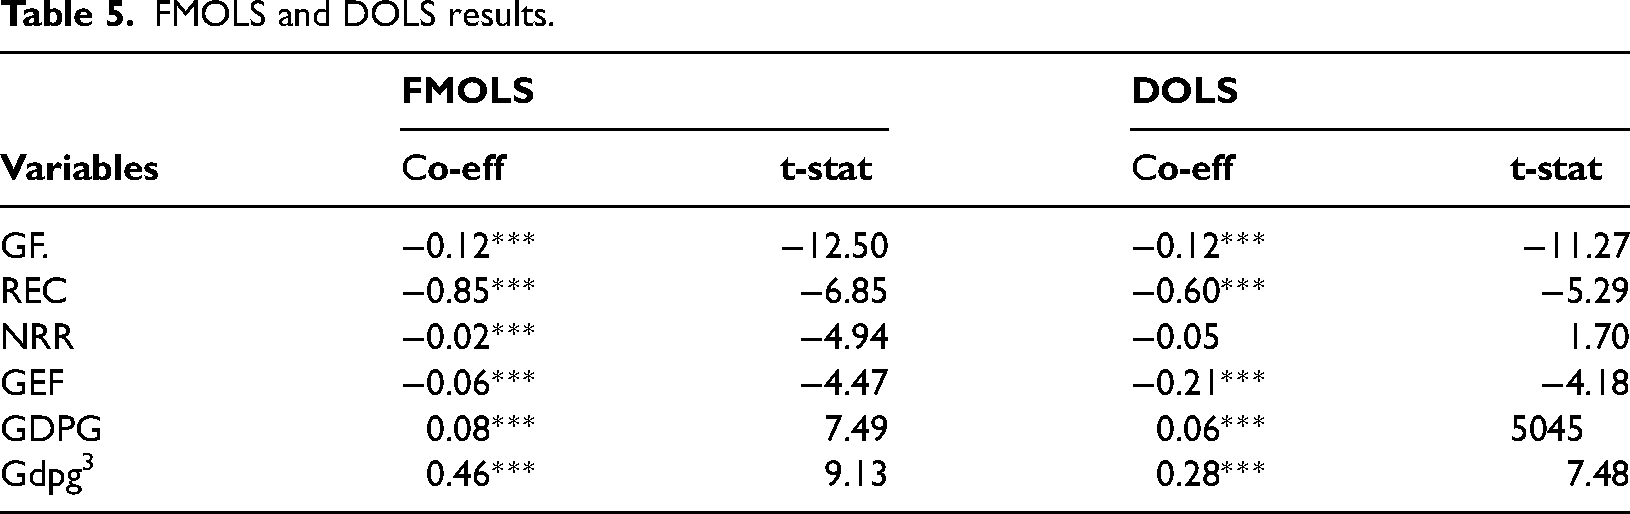
To check robustness, we have applied both FMOLS and DOLS methods to confirm their findings in the long run and to compare the results with those obtained through panel ARDL. Here are some key points related to using FMOLS and DOLS in the study.
The study recognizes heterogeneity among the individuals or countries being analyzed. This heterogeneity can manifest in differences in means and individual responses to short-term disturbances from the co-integrating equilibrium. FMOLS addresses these issues by incorporating individual-specific intercepts into the regression model. This approach allows for the consideration of country-specific characteristics and differences. The researchers have developed finite sample properties for OLS, DOLS, and FMOLS to ensure the reliability of their estimations and results.
In short, the results of the present study diverge from previous research in several key aspects. Firstly, while past studies have typically centered on traditional measures of environmental degradation, our study uniquely focuses on the COP (26 and 27) targets, which prioritize addressing climate change. Additionally, our research specifically targets BRICS countries, a selection made for reasons detailed in the article. Most notably, our findings highlight the significance of green financing, a pivotal factor emphasized in COP26 and COP27 recommendations, in addressing climate change within BRICS countries.
The results of FMOLS and DOLS are indicated in Table 5. It shows a similar significant level to ARDL except for NRR, as according to FMOLS, it is significant at a 1% significance level. However, DOLS rejected that as there is no relationship between natural resource rent and climate change. Although there are differences in the co-efficient values of the ARDL bound test and that of FMOLS and DOLS, the tests support our hypothesis and confirm the robustness of our model.
FMOLS and DOLS results.
Outcomes of grey forecasting model
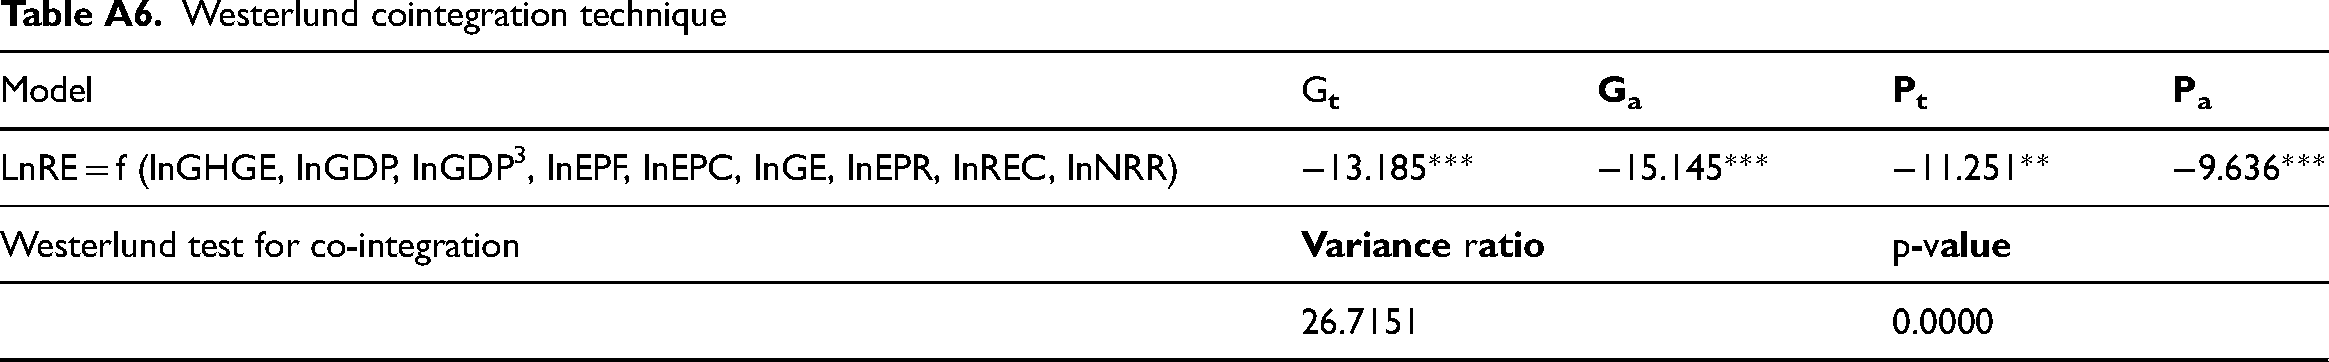
In our study, we have employed the enhanced versions of GM (1,1) and DGM (1,1) models for forecasting fuel and renewable energy sources utilized in energy production. In this current study, our forecasting extends over eight years, encompassing 2021 to 2029. The forecasting models indicate that fuel consumption in energy production will remain relatively constant in Brazil. In contrast, the utilization of renewable sources is projected to exhibit a faster increasing trend. This trend suggests that the use of renewables will surpass that of fossil fuels, potentially reducing GHG emissions. In the case of China and India, both the consumption of fuel and renewable energy sources used in energy production is projected to increase gradually. However, there are notable differences in the scenarios of Russia and South Africa. The forecasting indicates that fuel consumption will follow a decreasing trend in the future, while the consumption of renewable energy sources for energy production will gradually rise. In summary, it can be observed that Brazil, Russia, and South Africa are demonstrating commendable efforts in curbing GHG emissions by transitioning toward renewable energy sources in energy production. Conversely, China and India are projected to continue relying on fuel consumption for energy production in the future, despite both countries striving to transition from fossil fuels to renewables. The results of the GM (1,1), DGM (1,1), and CS-ARDL models are provided in Appendix 1 (Tables A1–A6) for reference.
Discussion
The present study aims to empirically investigate the impact of green finance, quality of governance, natural resource rent, growth rate, cubic form of growth rate, and renewable energy consumption on climate change. According to the results of all three techniques implied in the study, green finance positively impacts climate change, meaning that an increase in financing for renewable energy leads to increased energy efficiency, and industries may produce goods and services with fewer emissions per unit. Positive spillovers can result in adopting cleaner and more sustainable practices across various sectors. Moreover, spillovers in developing and disseminating technologies aimed at climate change adaptation, such as resilient infrastructure or drought-resistant crops, can indirectly contribute to reducing emissions by addressing the root causes of vulnerability. 58
Government effectiveness can play an important role in controlling greenhouse gas emissions. The results of our study suggest government quality is negatively related to GHG emissions, indicating that effective governments can develop and implement comprehensive regulatory frameworks that set emission standards for industries, vehicles, and other sources. These regulations may include limits on emissions of specific gases, fuel efficiency standards, and other measures. 59 Furthermore, governments can stimulate the development and adoption of cleaner technologies through research funding, grants, and incentives. 60 This can include technologies for energy efficiency, carbon capture and storage, and sustainable transportation. Governments can also raise awareness about climate change and the importance of reducing emissions. Public support is crucial for the success of climate policies, and informed citizens are more likely to demand and support sustainable practices. 61 In summary, effective governance is essential for developing, implementing, and enforcing policies that control greenhouse gas emissions. It requires a combination of regulatory measures, incentives, international collaboration, public engagement, and investment in clean technologies.
Another important variable included in this research study is renewable energy consumption. The results of our study confirmed the inverse association between climate change and renewable energy consumption. Renewable energy consumption plays a significant role in controlling GHG emissions, primarily because renewable sources produce energy with lower or negligible emissions compared to traditional fossil fuels. Moreover, the widespread adoption of renewable energy contributes significantly to controlling greenhouse gas emissions by providing a cleaner and more sustainable alternative to conventional fossil fuels. 62 The ongoing transition to renewables is a key strategy in global efforts to address climate change and achieve a low-carbon, resilient energy future.
All three estimation techniques confirmed a positive link between growth rate and climate change. At the intimal stage, any economy damages the environment by producing more fossil gases. As it is clear from the theoretical and empirical literature, the relationship between economic growth rate and GHG emissions is complex and depends on various factors, including the energy mix, technological advancements, and policy measures in place. 63 Here are some ways in which the growth rate can influence the control of greenhouse gas emissions. The ideal scenario for controlling GHG emissions is achieving a decoupling of economic growth from emissions growth. This means that emissions do not increase at the same rate or even decrease as the economy expands. Green growth involves adopting sustainable practices, renewable energy sources, and energy-efficient technologies to ensure economic development without a corresponding increase in emissions. 64 Secondly, higher economic growth can lead to increased investment in research and development of clean technologies. As economies grow, there is often greater capacity to invest in and adopt innovative technologies that contributing to emission reductions. 65 In short, it is crucial to recognize that the link between economic growth and emissions is complex. Economic expansion can result in higher emissions but also opens avenues for sustainable development and emission reduction initiatives. Balancing economic growth with environmental sustainability necessitates a holistic strategy encompassing government policies, technological advancements, and shifts in consumer behavior. Our study confirmed the environmental N-shaped hypothesis for the selected countries. The coefficient of the cubic growth rate's form shows a positive, albeit minimal, association in the long run. This suggests that the relationship turns positive once an economy reaches a certain development stage, as per the N-shaped Curve model. 34
The final variable we have included in our study is natural resource rent. We hypothesized that it would be negatively collected with the greenhouse gas emission. However, the results of the two models (ARDL and DOLS) are against our hypothesis, as there is no direct relation between the two variables. The outcomes provided by FMOLS reveal a negative association between climate change and natural resource rent.
Conclusion, policy recommendations, and limitation of the study
The study critically examines the adherence to COP26 and COP27 climate targets, segmenting the analysis into three-dimensional aspects—theoretical, empirical, and future forecasting. Theoretically, it evaluates the set targets and their attainment, revealing that climate change is still rising in China, Brazil, and South Africa, except for an increase in green financing, which Brazil lacks. Empirically, the study analyzes the influence of green finance, natural resource rent, economic growth (cubic form), and renewable energy consumption on climate change from 1995 to 2021. Utilizing the CIPS test for unit root, which indicates mixed integration orders, the study employs panel ARDL for analysis and FMOLS and DOLS for robustness. Results from these econometric techniques show that green financing, renewable energy consumption, natural resource rents, and government effectiveness significantly reduce climate change, whereas economic growth and its cubic form exacerbate it. The study also validates the environmental N-shaped hypothesis in the selected countries, offering a nuanced understanding of the multifaceted impacts of climate change. According to the results of a grey forecasting model, Brazil, Russia, and South Africa are making commendable efforts to reduce GHG emissions by transitioning to renewable energy sources for energy production. However, China and India are projected to continue fuel consumption for energy production in the future despite their efforts to shift from fossil fuels to renewables.
Policy implications
This study underscores the urgent need to advance green finance, especially in slower-progressing countries like Brazil. Key strategies include offering tax incentives for eco-friendly investments, launching green bonds, and supporting green venture capital funds. Additionally, boosting renewable energy use is vital. This can be achieved by increasing subsidies and incentives for renewable projects, funding research in renewable technologies, and introducing tax credits or feed-in tariffs to encourage renewable energy production. The study also advocates for stricter control over natural resource use, such as setting extraction limits, promoting sustainable practices, and taxing non-renewable resource use. Furthermore, raising public awareness and participation in environmental conservation is crucial and achievable through educational drives and community initiatives. Lastly, it is essential to rigorously evaluate these policies and adjust them as needed to ensure they effectively meet their goals.
Limitations and future recommendations
This research makes significant and novel contributions to the literature by examining the objectives outlined in COP26 and COP27 and exploring the interplay between green financing and climate change. However, it faces certain constraints, including limited access to localized data and the challenges of conducting field research. Future studies should delve into the relationship at provincial and city levels to yield more precise insights for policy decision-making in BRICS countries. This approach can enhance the granularity and accuracy of the findings, offering more targeted recommendations for policymakers. Our study explored the COP26 and COP27 targets from a theoretical perspective. Future research could employ these targets as dummy variables in econometric analyses, providing a more empirical and quantitative understanding of their impacts and effectiveness.
Footnotes
Declaration of conflicting interests
The authors declared no potential conflicts of interest with respect to the research, authorship, and/or publication of this article.
Funding
The authors received no financial support for the research, authorship, and/or publication of this article.
Notes
Appendix 1
Westerlund cointegration technique
| Model | G |
|
|
|
|---|---|---|---|---|
| LnRE = f (lnGHGE, lnGDP, lnGDP3, lnEPF, lnEPC, lnGE, lnEPR, lnREC, lnNRR) | −13.185*** | −15.145*** | −11.251** | −9.636*** |
| Westerlund test for co-integration | p |
|||
|---|---|---|---|---|
| 26.7151 | 0.0000 | |||