
Abstract
Considering data conversion practices in empirical research, this research investigates the role of data conversion on prediction results in the United States (USA), where yearly and monthly data on energy-related carbon dioxide (CO2) emissions and source-based energy consumption is available, which makes the USA an appropriate case for empirical analysis. In this context, this study considers CO2 emissions as the dependent variable, uses source-based energy use indicators as the explanatory drivers, and performs cointegration regression (CR) approaches on monthly datasets between 1989/1 and 2023/12, which consist of monthly original series (MOS), monthly converted series by quadratic-average-approach (MCSQA), and monthly converted series by quadratic-average-sum (MCSQS). The empirical results reveal that (i) data conversion increases R2 values and improves the goodness of fit criteria of the prediction models, where training and testing results are above 96%; (ii) data conversion causes a change in the coefficients of the explanatory variables. While the direction of the variables changes from MOS to MCSQA and MCSQS, it is the same across between MCSQA and MCSQS, but coefficients and p-values slightly differentiate; (iii) dynamic OLS approach has the highest prediction performance among approaches applied; (iv) the importance of source-based energy use indicators on CO2 emissions differentiate. Overall, the study empirically demonstrates the increasing but varying impact of data conversion on prediction results. Accordingly, the study discusses to benefit of the use of converted data series in empirical predictions, where policymakers can benefit from increasing the impact of data conversion on prediction capacity and prevent incorrect prediction results.
Introduction
Climate change, which is a comprehensive term to represent various environmental problems including air pollution and temperature increases, has become one of the most important issues that the world has been facing in recent years.1,2 In line with this negative progressing trend, countries and societies have become much more concerned about environmental degradation in recent years. Accordingly, solo efforts of the countries as well as collaborative efforts among countries and international initiatives have been developing day by day. As a result of these developing efforts, research on environmental degradation from different perspectives has been increasing as well.
Following the leading study of Grossman and Krueger, 3 previous studies focused on mainly economy-related factors in examining environmental progress (e.g. Pao et al., 4 Magazzino et al., 5 and Rahman et al. 6 ). On the other hand, compatible with the study of Kraft and Kraft, 7 later studies have dealt much more with energy use for the impact on the environment (e.g. Sharif et al. 8 and Kartal 9 ). Thus, today's research has been mainly considering the role of energy use on environmental degradation by considering combinations of energy sub-types in the research.
The current literature is highly rich in terms of the investigation of the impact of energy use on the environment. There are countless research on this aspect. While some of these have used original datasets at different frequencies (e.g. monthly dataset by Sharif et al. 8 and Ulussever et al. 10 ; yearly dataset by Kartal et al. 11 ), some others have preferred to work with converted data series originated from the original (e.g. yearly) data into a selected one (monthly converted dataset by Sharif et al. 12 ; quarterly converted dataset by Adebayo and Kirikkaleli, 13 Meng et al., 14 and Xu et al. 15 ). While either original or converted datasets have been used in these studies, based on the best knowledge, there has not been any study that investigates the role of data conversion on the prediction results. This point issues a literature gap and this gap can be researched empirically to determine the impact of data conversion on the prediction results.
Considering the literature gap defined, this study aims to search for the answers to the research question of “determining whether data conversion has an impact on the prediction results or not.” For this purpose, a country, that must have both low-frequency (i.e. original) and high-frequency (i.e. converted) datasets at different time intervals, can be an appropriate sample. From this point of view, the USA has come to the fore because it has both yearly and monthly datasets. 16 For this reason, the USA is evaluated as one of the most appropriate cases to investigate answers to the research question. Thus, it is possible to uncover the impact of data conversion on the prediction results or not by focusing on the USA case.
The USA is the leading economy in the world in terms of its economic size. 17 While the USA has sustained its pioneering position among the countries, it has been causing a high amount of CO2 emissions, which takes place among the top five CO2-emitting countries and consumes a high amount of energy. 18 Accordingly, the USA has been facing environmental problems resulting from high energy use. Figure 1 demonstrates the progress of both CO2 emissions and energy use at disaggregated levels across the years.
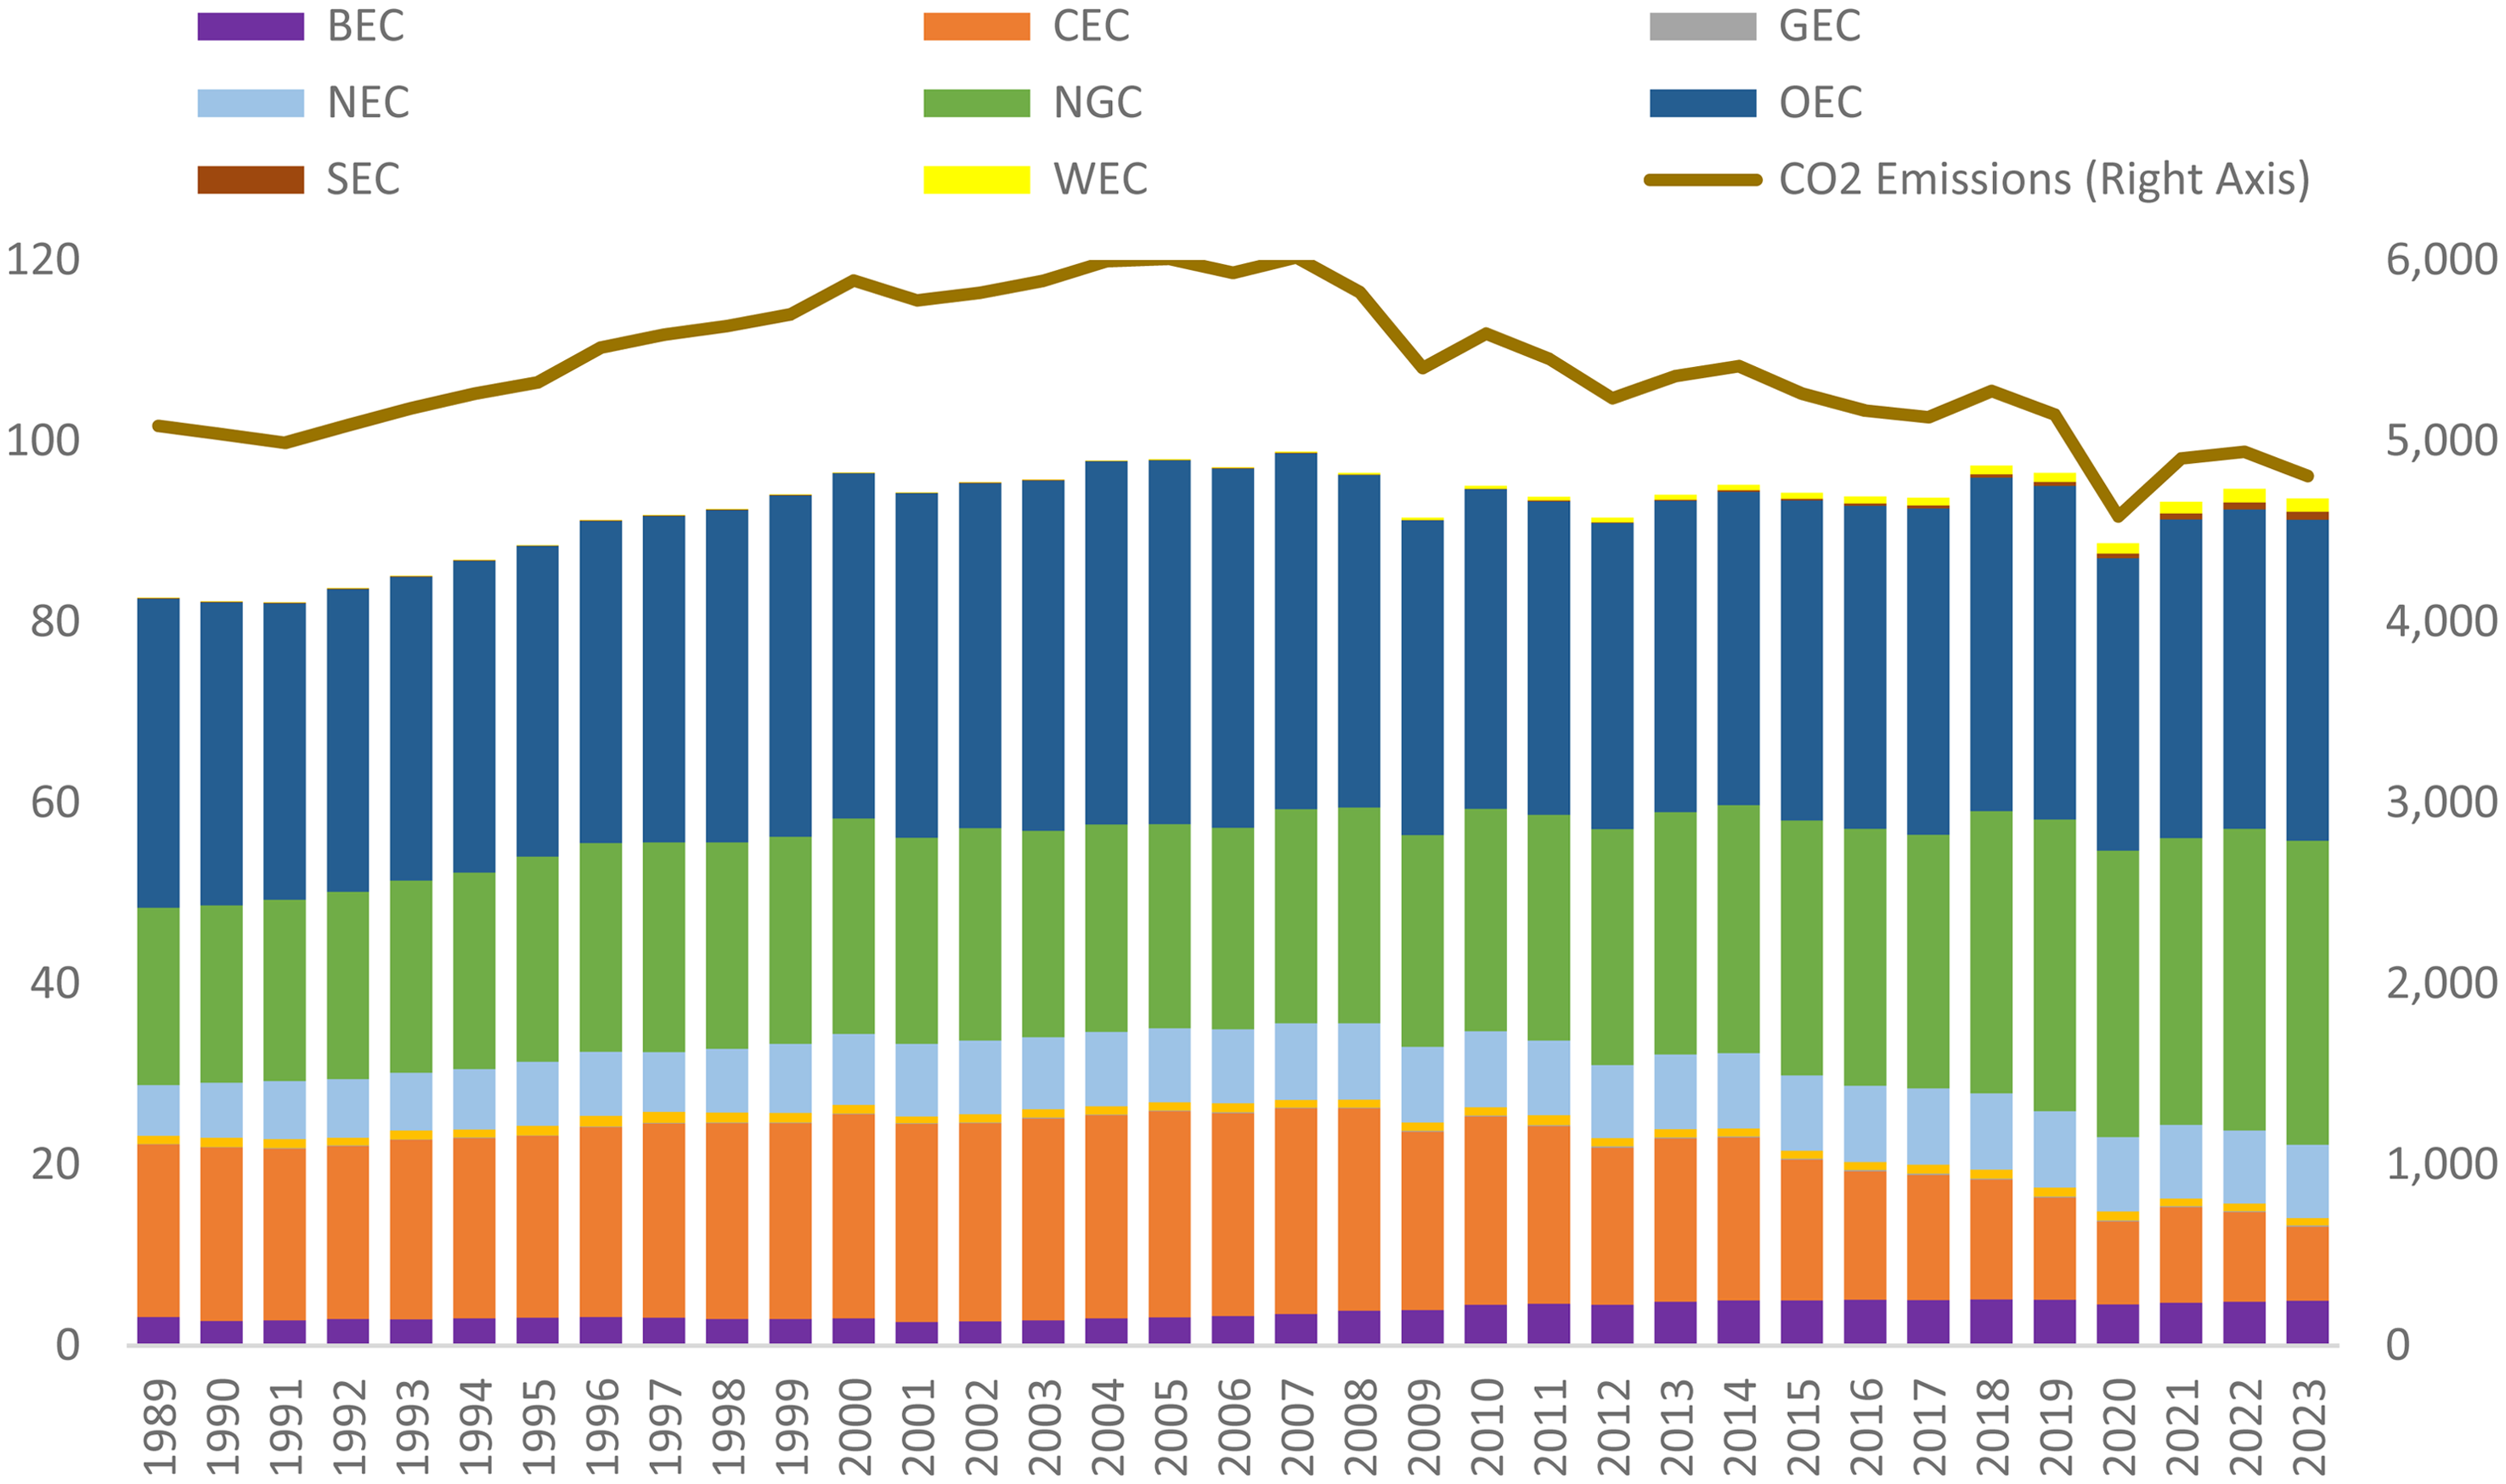
The progress of energy-related CO2 emissions and energy use.
As demonstrated, from the point of CO2 emissions, the USA has a relatively horizontal trend between 1989 and 2023. Although there was an increasing trend until 2005, there has been a slightly decreasing trend since then. Also, from the point of their share in the total energy mix, there has been a constant increase in BEC, GEC, NEC, NGC, SEC, and WEC across the recent years, whereas there has been a decreasing trend in CEC and OEC as well as a horizontal trend in HEC. In summary, there has been a huge amount of CO2 emissions and energy use in the USA case.
In line with the research gap as well as the appropriate position of the USA case for empirical analysis, the study investigates the role of data conversion on the prediction results. In doing so, the study benefits from the USA case by considering the USA's energy-related CO2 emissions and source-based energy use data, using both original and converted datasets at the same time, and applying CR approaches as performing much better. In this context, the study uses totally three different datasets (i.e. MOS, MCSQA, and MCSQS) for the same environmental and energy indicators and applies a total of three CR approaches (i.e. CCR, DOLS, and FMOLS). As a result, the study defines that data conversion increases R2 and goodness of fit criteria of the prediction models. Also, data conversion causes a change in the coefficients of the explanatory variables. Besides, the DOLS approach has the highest prediction performance among CR approaches. Moreover, the importance of source-based energy use on CO2 emissions varies. Thus, the study empirically reveals the increasing impact on the prediction capacity of the models, whereas the impact differentiates. In this way, the study obtains clear answers to the research question.
Following up a comprehensive approach, this research provides various novelties to the literature. First, according to the best knowledge, this research is the first kind of its type, which investigates the impact of data conversion in terms of its impacts on prediction results. Second, the study uses a total of three different unique datasets to uncover answers to the research question by focusing on the USA case as an appropriate case. Third, the study applies three CR approaches as types of econometric approaches because such approaches perform better than others due to being derived from economic theories. With these points, the study comprehensively and empirically searches for the answers to the research question.
The study goes on the theoretical framework in the “Theoretical framework and literature review” section; methods in the “Methods” section; empirical results in the “Empirical results” section; conclusion, discussion, policies, and future research in the “Conclusion, discussion, policy endeavors, and future research” section.
Theoretical framework and literature review
Theoretical underpinning and mechanism
The relationship between energy use and environmental degradation is mainly based on both energy-led growth and energy growth hypotheses, proposed by Kraft and Kraft 7 and Nachane et al., 19 in order. The relationship is also related to the fundamental environmental economic hypothesis as the environmental Kuznets curve (EKC) proposed by Grossman and Krueger. 3 These hypotheses mainly imply some critical points about the relationship between energy use and the environment as (i) energy use is highly required for ensuring sustainable economic growth; (ii) the amount of energy used increases as economies grow; and (iii) the environmental problems increase as economies grow and further energy is used unless they are handled in an eco-friendly manner. Hence, by considering these hypotheses (i.e. energy-led growth hypotheses; energy growth hypotheses; EKC hypotheses), it can be stated that energy use, economic growth structure, and environmental problems are highly interrelated with each other. For this reason, dealing with energy use is a critical issue in terms of both economic growth structure and environmental problems as well.
Since energy use is a critical factor for economic growth, there is a significant impact of energy use on environmental degradation. As economic growth is achieved and further energy is used for this purpose, there will be an increase in environmental degradation, which results from much more fossil fuel-based energy use. Hence, a direct impact mechanism between energy use and environmental degradation exists.
Taking theoretical underpinning structured by Kraft and Kraft, 7 Nachane et al., 19 and Grossman and Krueger 3 into account as well as the direct impact mechanism of energy use on environmental degradation, a large body of research (e.g. Bilgili et al., 20 Li et al., 21 and Wang et al.22–24) has been prepared to uncover the relationship between energy use and environmental degradation and different results have been obtained in these studies as well. The literature is quite from this point of view.
Review of the empirical literature
In the contemporary literature, a large set of research has focused on the relationship between energy use and the environment from different perspectives. On the one hand, the literature can be classified based on energy types. In this context, a part of them have focused on fossil fuel energy use (e.g. Ulussever et al. 2 ), whereas much newer ones have dealt with clean energy use (e.g. Sharif et al. 8 ). On the other hand, the literature can be classified also according to the data type used. Some studies have used total energy use (i.e. aggregated level) data (e.g. Kartal 25 ), whereas others have preferred much more detailed (i.e. disaggregated level) data (e.g. Bilgili, 26 Kuşkaya and Bilgili, 27 Magazzino et al., 28 Zhen et al., 29 and Kuşkaya et al. 30 ). Moreover, recent studies have begun to apply different data conversion approaches to original datasets by relying on various purposes, such as increasing the number of observations, making data appropriate for certain econometric approaches, and ensuring consistency between various data intervals into a single one. Thus, some studies have worked with original datasets at different frequencies, whereas others have transformed data into different frequencies. Hence, there has been a growing literature on the converted data use and Table 1 presents a summary of the recent research.
A summary of data conversion approaches applied, data types used, and econometric approaches performed.
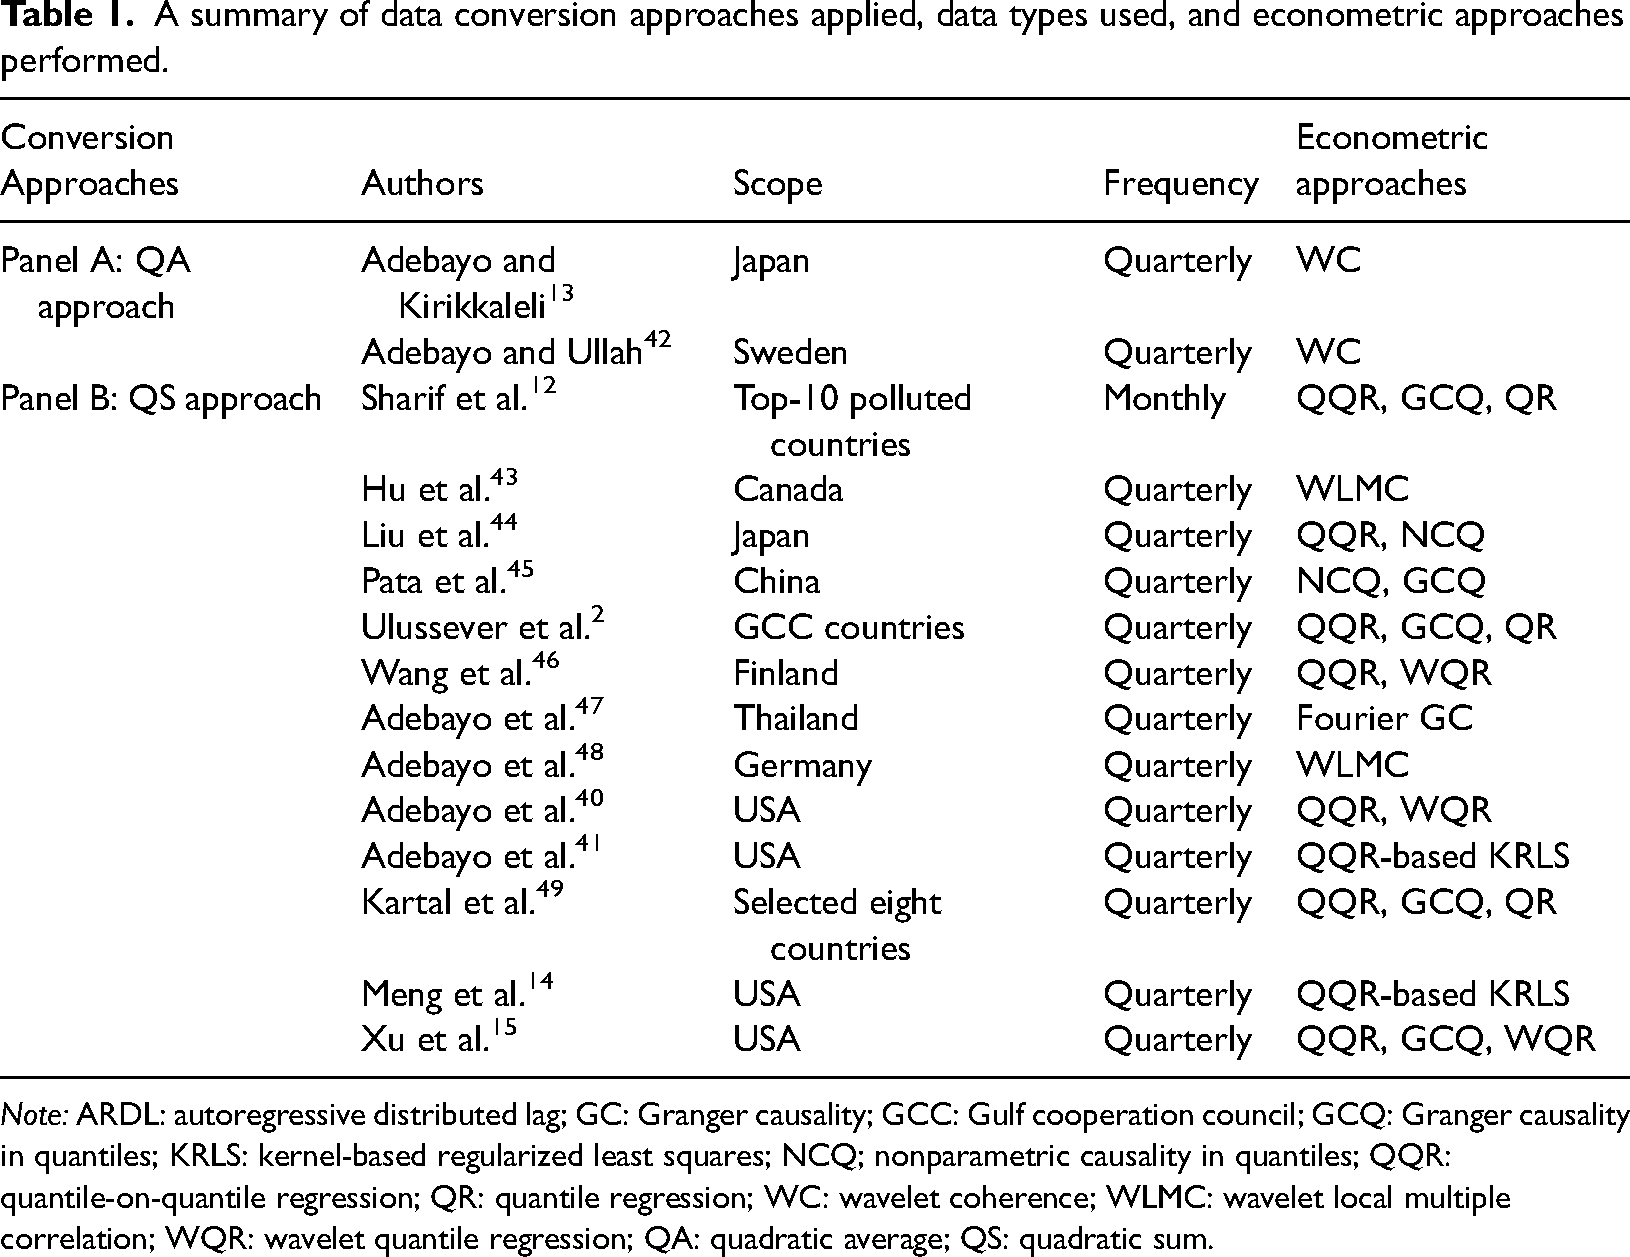
Note: ARDL: autoregressive distributed lag; GC: Granger causality; GCC: Gulf cooperation council; GCQ: Granger causality in quantiles; KRLS: kernel-based regularized least squares; NCQ; nonparametric causality in quantiles; QQR: quantile-on-quantile regression; QR: quantile regression; WC: wavelet coherence; WLMC: wavelet local multiple correlation; WQR: wavelet quantile regression; QA: quadratic average; QS: quadratic sum.
According to Table 1, the literature includes various studies that have applied data conversion approaches to convert data into different frequencies in examining the relationship between energy use and environmental degradation. Mainly both QS and QA approaches have been used by scholars for data conversion. On the other hand, a variety of econometric approaches have been applied to converted datasets to predict the relationship between energy use and environmental degradation.
Evaluation of the literature
In the literature, there are various studies that have dealt with the relationship between energy use and environmental degradation. The studies have mainly shown that energy use has an important impact on environmental degradation and the impact of energy use on the environment has differentiated based on energy types considered, scope of the studies, time intervals used, and econometric approaches applied for empirical investigation.
On the other hand, among all, some of these studies have used converted data, which is summarized in Table 1, for empirical analyses. When they are considered all together, some common points can be seen. First, the studies have generally used either the QA approach or the QS approach for data conversion. Such a data conversion has various purposes, such as increasing the number of observations, making data appropriate for certain econometric approaches, and ensuring consistency between various data intervals into a single one. Second, the studies have mainly used a data conversion approach to convert yearly data into quarterly data (there is an example of monthly conversion as well). Third, the studies have mostly applied time series econometric models on the converted datasets for empirical analysis. Hence, they have stated various conclusions depending on the scope.
The present studies have applied data conversion approaches and performed various econometric approaches (mainly time series ones) on converted data for empirical analysis. The use of converted data enables researchers to investigate different sides of energy economics and environmental sustainability by increasing the number of observations (required by various econometric models), making data appropriate for certain econometric approaches (ensuring normality, nonlinearity, and stationarity), and ensuring consistency between various data intervals into a single one to provide use of various indicators at the same data frequency. However, based on the best knowledge, no study has been analyzed to determine the impact of data conversion on prediction results, which is also important in terms of energy economics and environmental degradation. So, this point presents a literature gap.
In line with the literature gap defined, the study focuses on the USA case, which has both yearly and monthly datasets. Thus, it is possible to make an empirical examination of the impact of data conversion on the prediction results by first converting the yearly dataset into a monthly dataset and then using both original monthly and converted monthly datasets in the empirical analyses. Within the context of empirical analysis, the study uses three datasets (i.e. MOS, MCSQA, and MCSQS), which include both original monthly and converted monthly datasets, applies CR approaches as consistent with the current literature because CR approaches are types of econometric approaches and such approaches perform better than others due to being derived from economic theories. Hence, the study fills in this gap by presenting empirical answers to the research question (i.e. determining whether data conversion has an impact on the prediction results or not).
Methods
Data
To empirically investigate the role of data conversion on prediction results, the study focuses on the USA case. That is why the USA publishes the data on energy-related CO2 emissions and source-based energy use for both annual and monthly frequencies. 16 This data availability enables researchers to uncover the impact of data conversion by using both original data series and transformed data series comparatively.
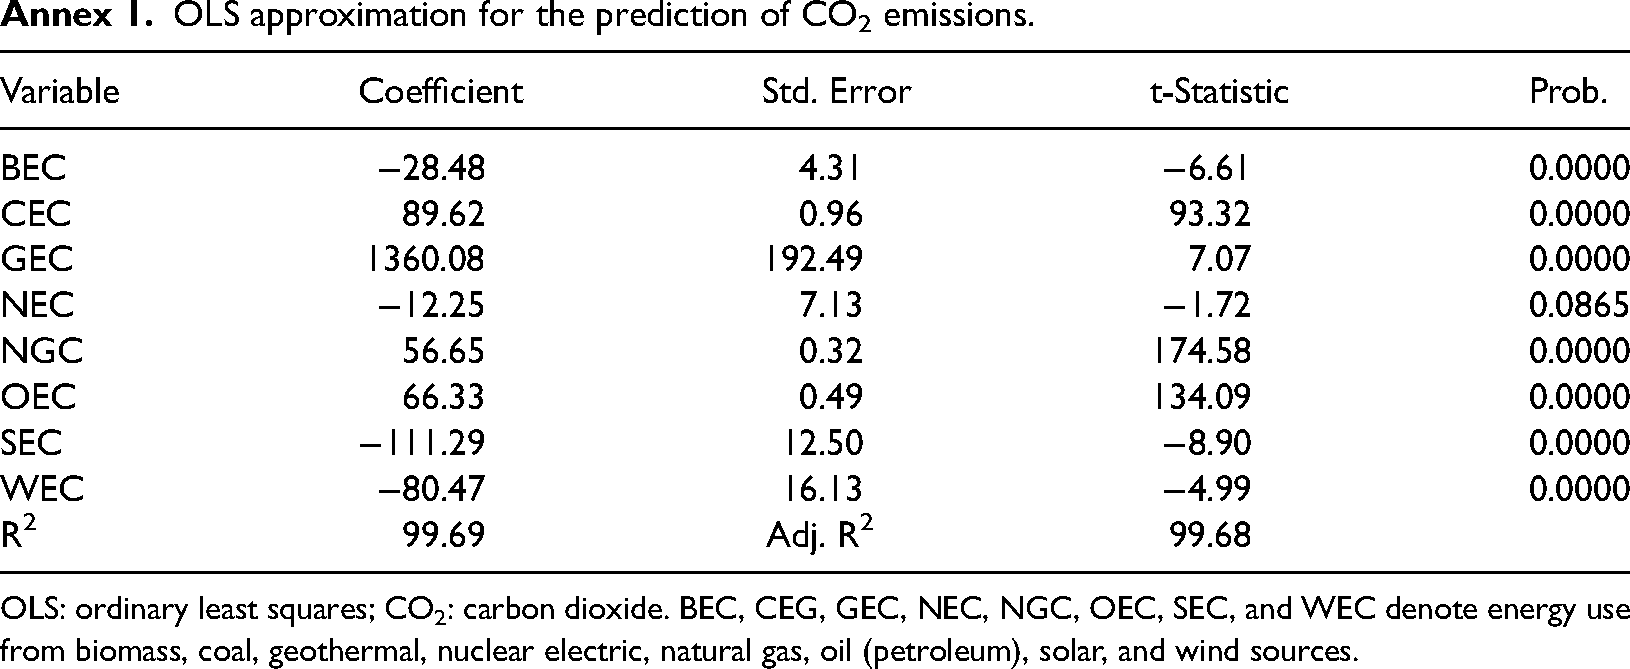
Although data for some energy use types goes further back, the study aims to include all energy types in the analysis because the use of source-based energy consumption data is critical to make a robust prediction due to related CO2 emissions with the energy use as approximated in Annex 1. According to basic approximation, by considering source-based energy consumption indicators, the study predicts 99.69% variations in CO2 emissions.
Wind energy use data starts from 1982, solar energy use data starts from 1984, and some data on solar and wind energy use are lacking across various times between 1985 and 1988. Based on these causes, the study uses a dataset between 1989/1 and 2023/12, which is obtained from EIA 16 as the most recent available data. Hence, the overall dataset includes 420 monthly observations, which constitutes the original data series (i.e. MOS).
Also, to uncover the impact of data conversion, the study considers yearly data between 1989 and 2023 and transforms this yearly data series into a monthly data series. In this context, the study applies both QA and QS approaches, which is consistent with the current literature as shown in Table 1, where most of the studies have applied these approaches for data conversion. Also, the use of quadratic approaches in data conversion provides the best-converted series than other data conversion approaches.31–33 These are the causes why the study considers QA and QS approaches. Thus, the study obtains two different monthly converted data series (i.e. MCSQA and MCSQS) by converting yearly datasets into monthly datasets through the performance of QA and QS approaches in EViews software.
Following up the above-explained process, the study obtains and uses three data series (i.e. MOS, MCSQA, and MCSQS) in the analysis, which is demonstrated in Annexes 2 to 4.
Furthermore, the data series are divided into both training and testing samples. In this context, 80% of the data series (i.e. the first 336 observations) is used as a training dataset, which is between 1989/1 and 2016/12. Also, the remaining 20% of the data series (i.e. the last 84 observations) is used as a testing dataset, which is between 2017/1 and 2023/12. Thus, through using not only original and converted monthly datasets, but also using both training and testing samples, this study obtains reliable results in the investigation of the impact of data conversion on the prediction results by making a robust analysis.
Variables
By relying on the explained theoretical framework and examined empirical literature, this study comprehensively examines the data conversion impact on the relationship between energy-related CO2 emissions and source-based energy use. In this context, the study considers all available energy use types in the prediction process because they are complete reasons for energy-related CO2 emissions.
Table 2 shows the details of the variables.
Details of the variables.
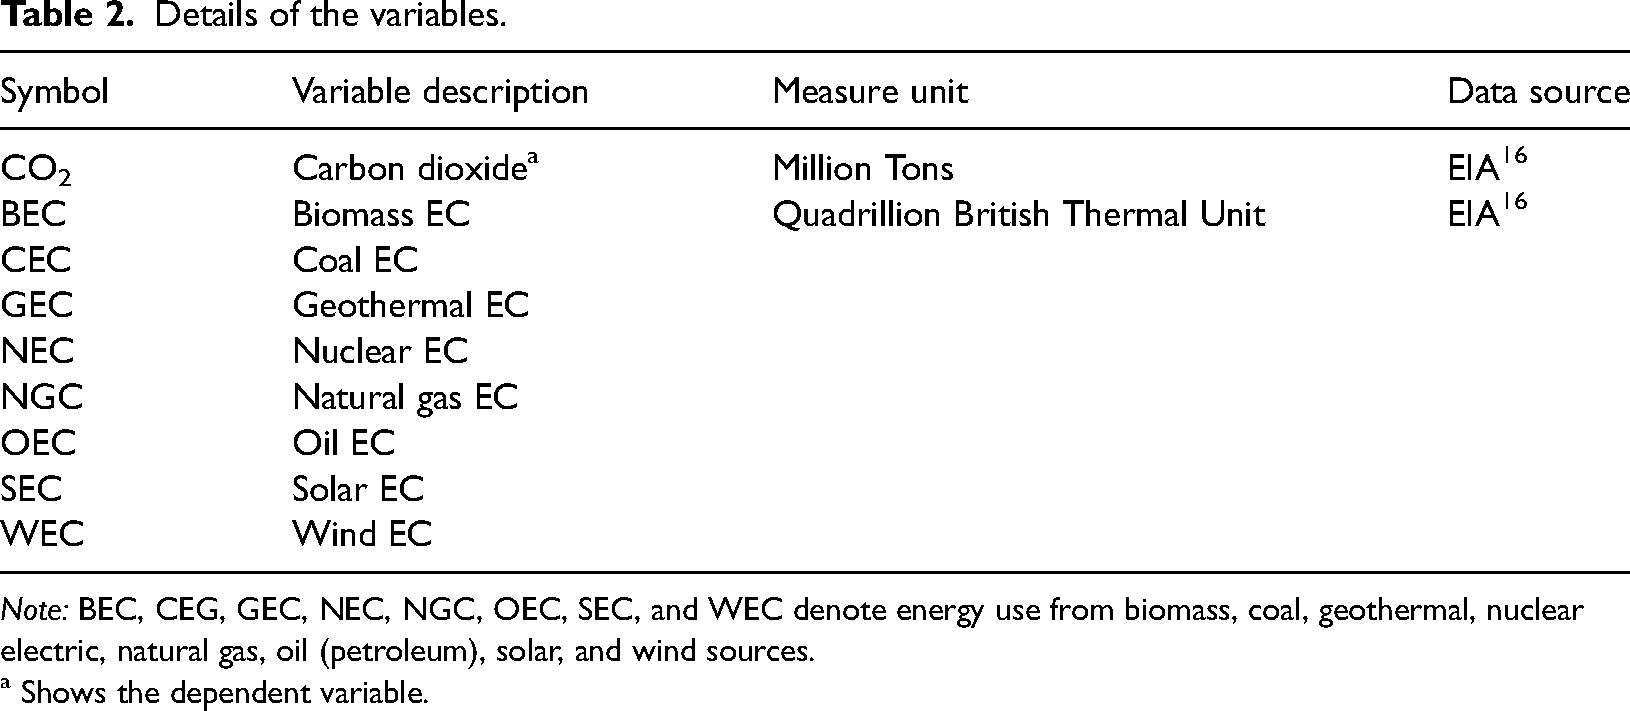
Note: BEC, CEG, GEC, NEC, NGC, OEC, SEC, and WEC denote energy use from biomass, coal, geothermal, nuclear electric, natural gas, oil (petroleum), solar, and wind sources.
a Shows the dependent variable.
Methodological process
In line with the aim of the study, a comprehensive methodological process is used in the prediction, which Figure 2 shows in detail.
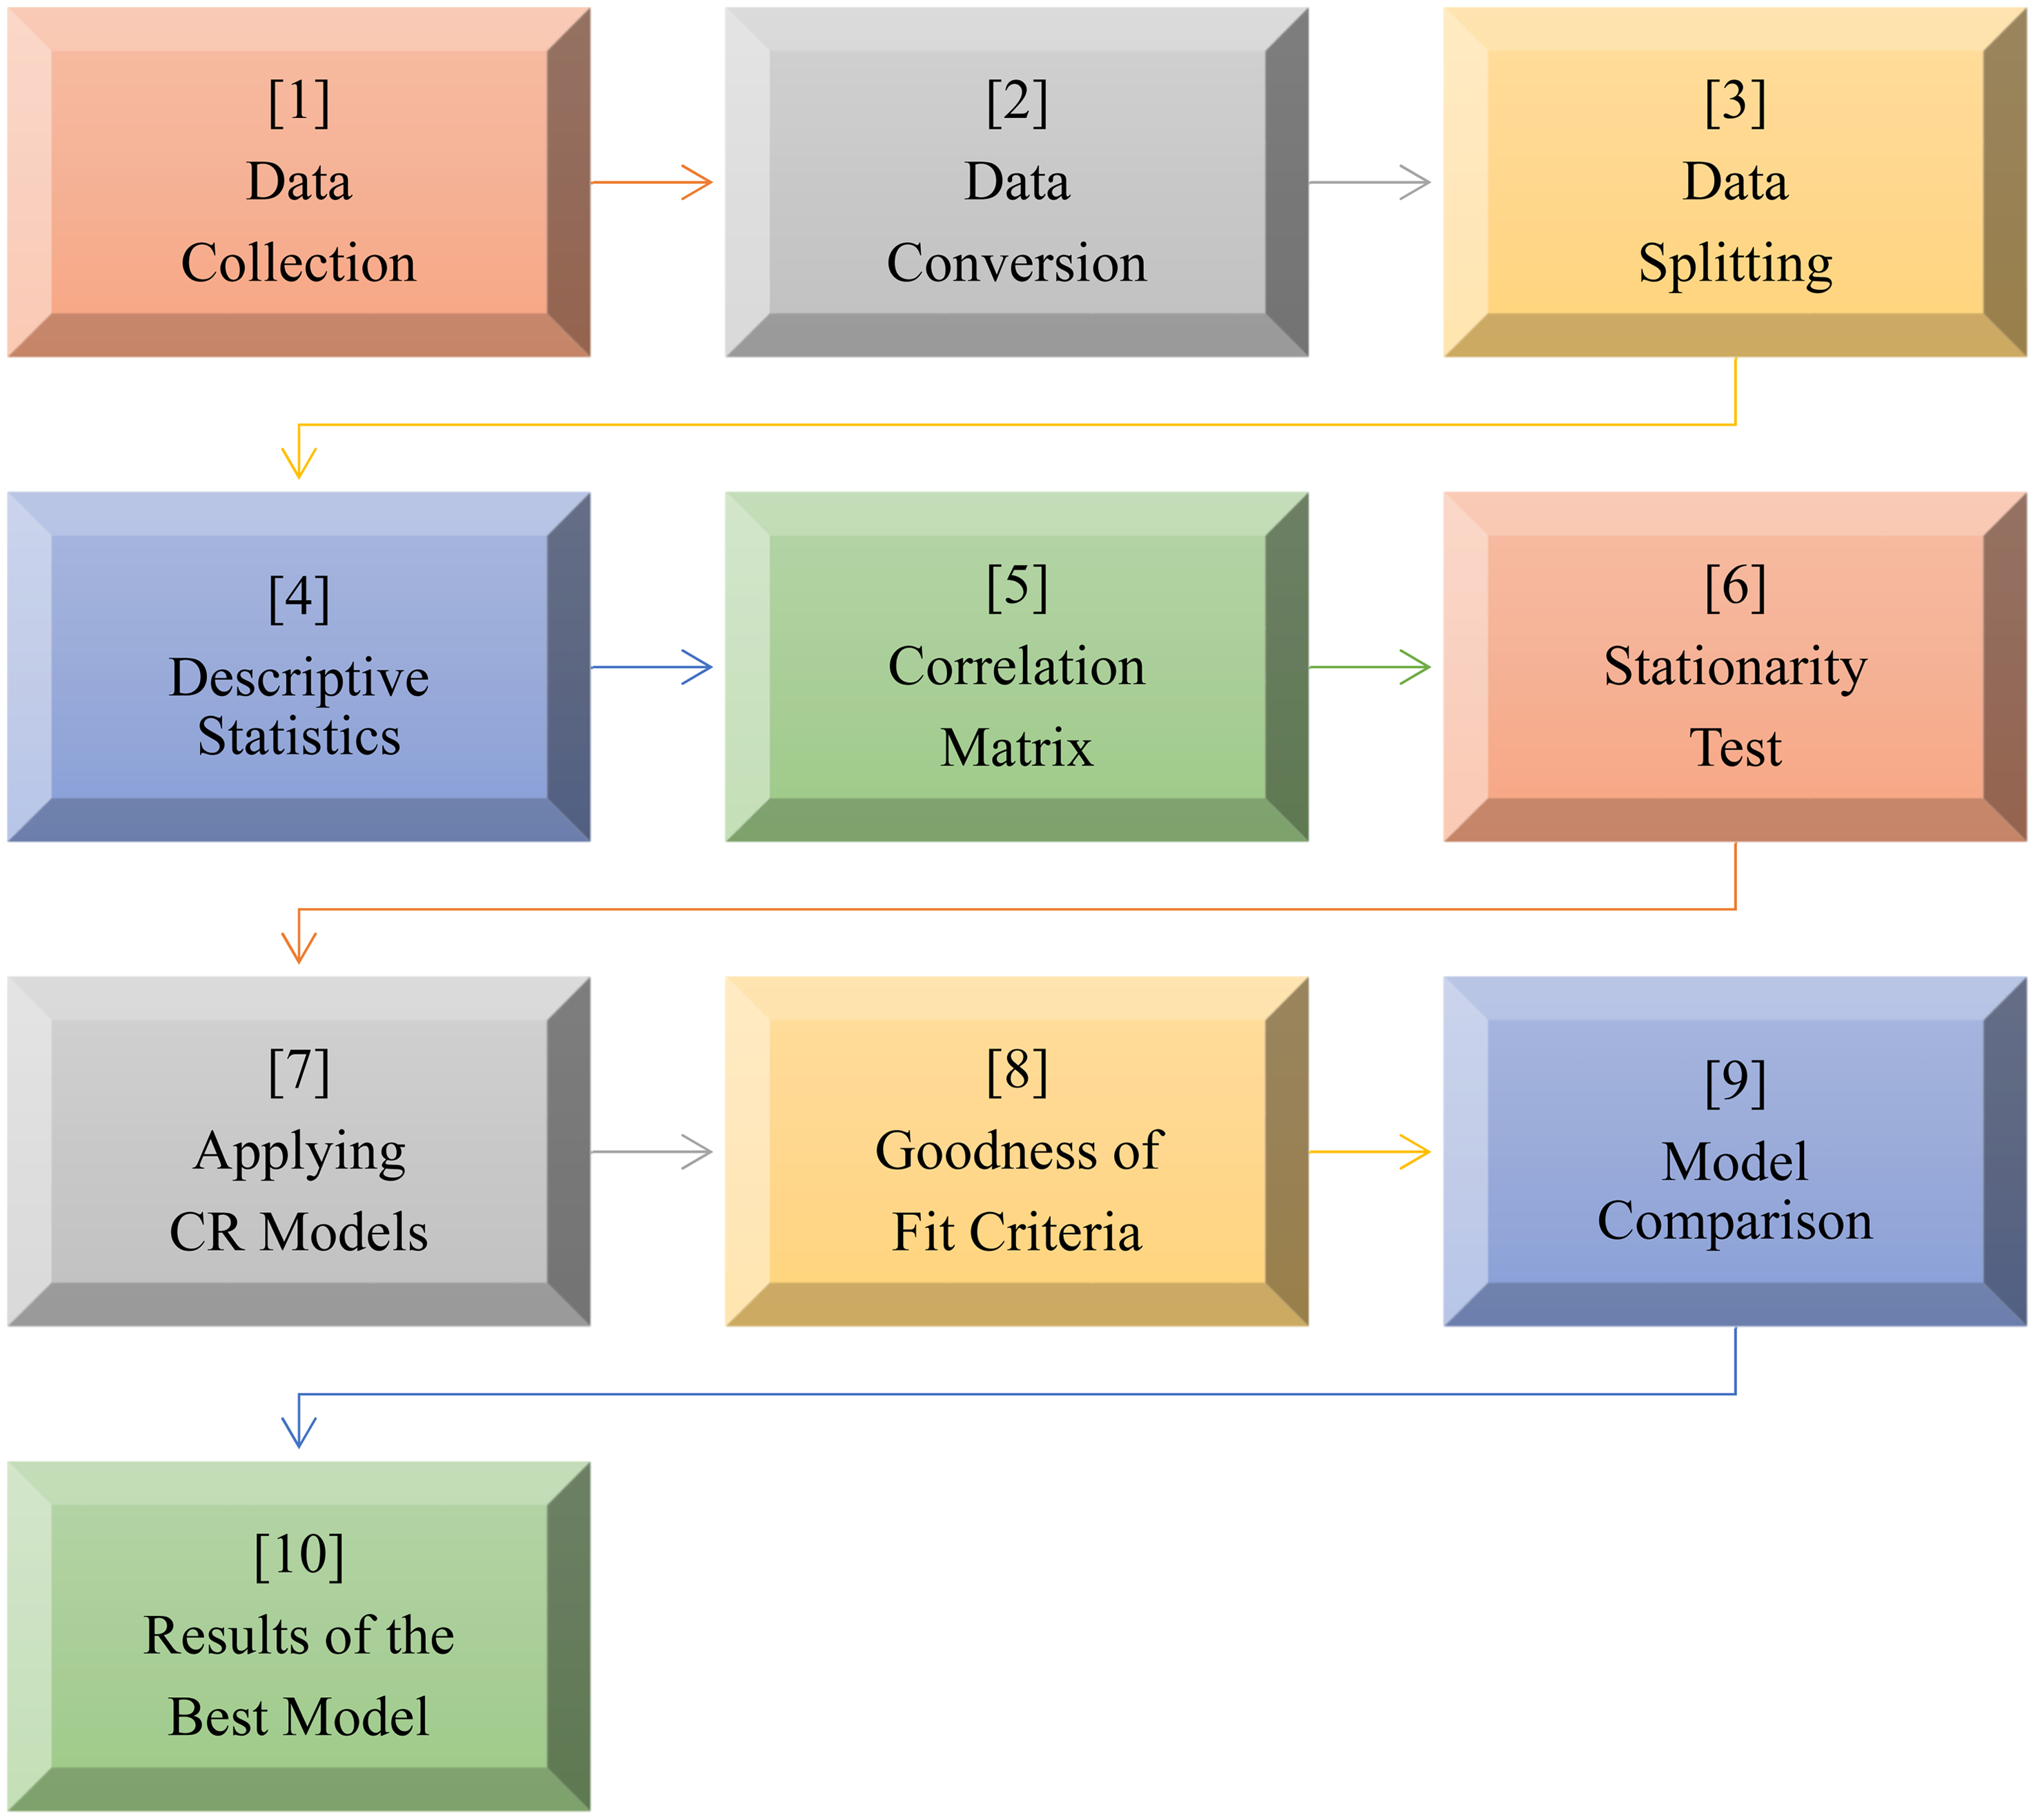
Methodological process.
In the first step, original data series are collected from the source of EIA. 16 In the second step, monthly converted series are obtained by performing QA and QS approaches. In the third step, all collected data series (i.e. MOS, MCSQA, and MCSQS) are split into both training and testing samples.
Following the obtaining of datasets, in Steps 4–6, preliminary statistics of the variables including descriptive statistics, correlation matrix, and stationarity test are analyzed.
Across Steps 7–10, to predict the energy-related CO2 emissions by using source-based energy use indicators under the investigation of data conversion impact, the CR approaches are applied (i.e. CCR, DOLS, and FMOLS), goodness of fit statistics are examined, the CR approaches are compared, and the results of the best approach are interpreted in detail. Further details about the methods applied can be obtained from the original studies (for CCR 34 ; for DOLS 35 ; and for FMOLS 36 ).
For empirical prediction, CR approaches, which are types of econometric approaches, are used because such approaches perform better than others due to being derived from economic theories. It is clear that these methods have some limitations, such as working stationary variables at I(1). Hence, these methods are selected based on data characteristics. Accordingly, this point has been put in the limitations subsection of the study, where future research can consider this point in designing new studies.
Prediction model
FMOLS technique, which is a residual-based test, provides efficient results for the variables.
36
Moreover, FMOLS is considered a reliable estimate when the sample size is small and eliminates the problems of endogeneity and serial correlation among the variables. DOLS provides better results than FMOLS and eliminates correlation among regressors.
35
By using source-based energy use data as well as performing CR approaches as the fundamental prediction approaches (i.e. CCR by Park
34
; DOLS by Stock and Watson
35
; FMOLS by Hansen and Phillips
36
), this investigation considers equation (1) to predict CO2 emissions: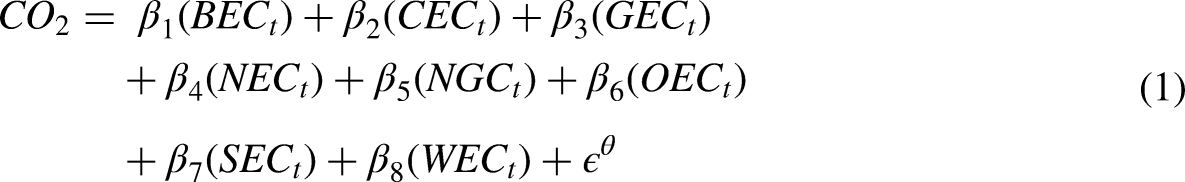
Goodness of fit criteria
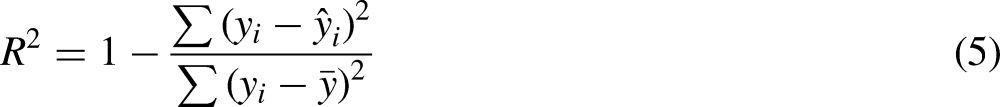
In examination of the data conversion impact on the prediction results, the study considers a set of goodness of fit criteria that includes R2, root mean squared error (RMSE), mean absolute error (MAE), and mean absolute percentage error (MAPE). The higher (lower) values of R2 (RMSE, MAE, and MAPE) imply that the prediction approaches have a higher success in predicting dependent variables by using independent variables as well as the difference between actual and predicted values of the dependent variables is quite low. Accordingly, it can be stated that an approach, that has higher (lower) values of R2 (RMSE, MAE, and MAPE), is better than others.
R2 is used as an indicator to measure the changes in the dependent variable that are explained by independent variables in the approach. Also, RMSE, MAE, and MAPE are the diagnostic indicators that reflect the accuracy of the approach. All these goodness of fit criteria are computed by using the following equations37,38:


Empirical results
Descriptive statistics
After the collection and preparation of the original monthly dataset and converted monthly data sets, the empirical process goes on with the examination of fundamental statistics. So, the study first examines the descriptive statistics of the variables in the datasets to understand their basic characteristics. In this context, Table 3 presents the descriptive statistics.
Descriptive statistics.
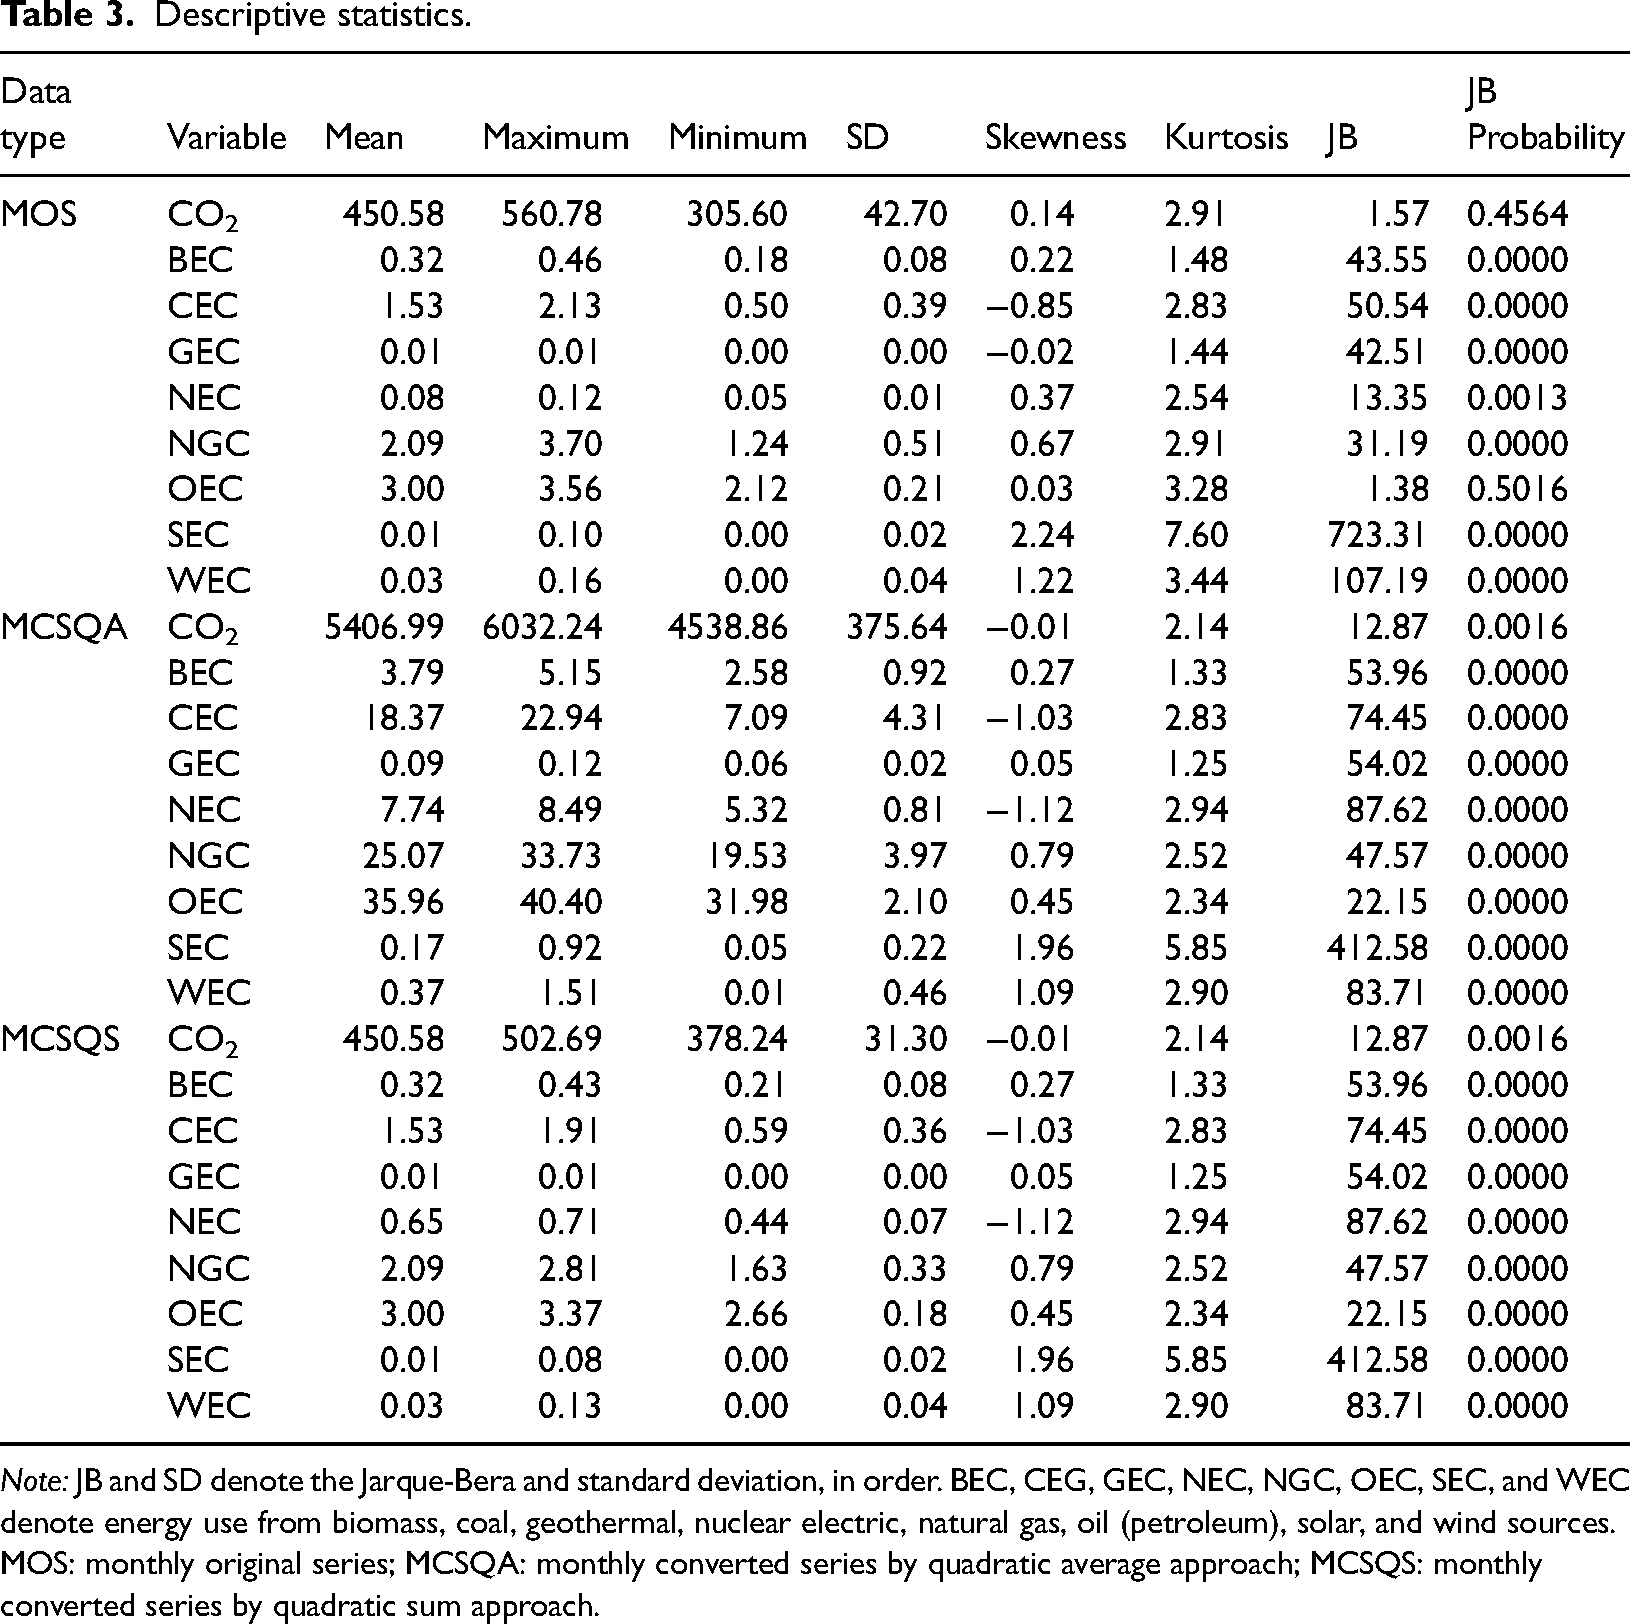
Note: JB and SD denote the Jarque-Bera and standard deviation, in order. BEC, CEG, GEC, NEC, NGC, OEC, SEC, and WEC denote energy use from biomass, coal, geothermal, nuclear electric, natural gas, oil (petroleum), solar, and wind sources. MOS: monthly original series; MCSQA: monthly converted series by quadratic average approach; MCSQS: monthly converted series by quadratic sum approach.
In MOS, all variables except for CO2 and OEC have a nonnormal distribution. Similarly, all variables in both MOSQA and MOSQS are not normally distributed. In all three datasets, CO2 has the highest value followed by OEC, NGC, and CEC. Also, CO2 and NGC have the highest variations among all variables, in order. While the minimum and maximum values of variables are near to each other in MOS and MOSQS datasets, the values in MOSQA differ highly from those. Hence, it can be stated that there are significant variations in the variables and most of the variables are not normally distributed.
Correlation matrix
Table 4 shows the correlation coefficients between the variables.
Correlation matrix.
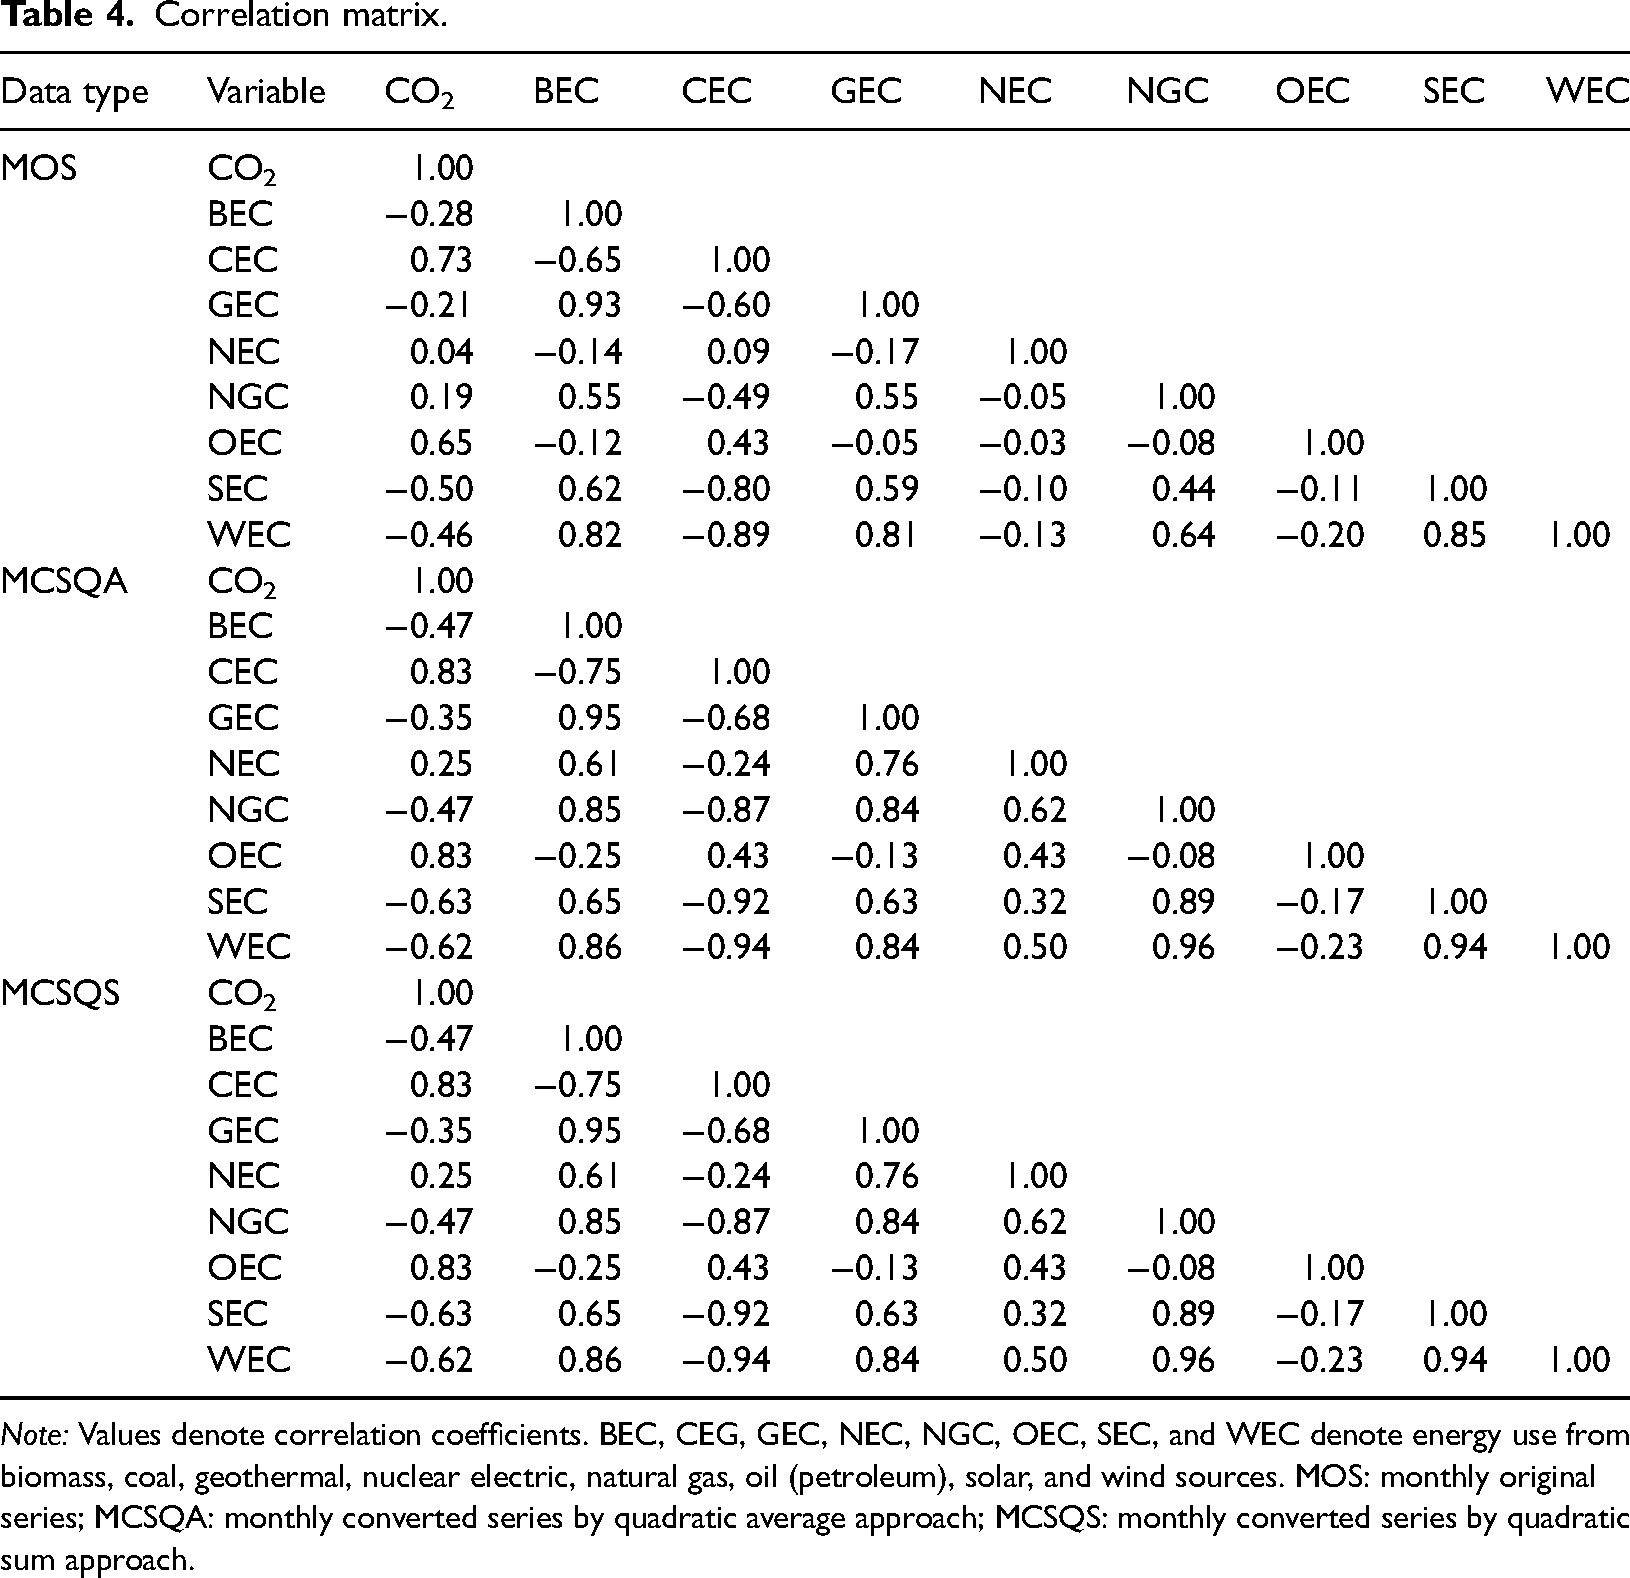
Note: Values denote correlation coefficients. BEC, CEG, GEC, NEC, NGC, OEC, SEC, and WEC denote energy use from biomass, coal, geothermal, nuclear electric, natural gas, oil (petroleum), solar, and wind sources. MOS: monthly original series; MCSQA: monthly converted series by quadratic average approach; MCSQS: monthly converted series by quadratic sum approach.
In MOS, CO2 is negatively correlated with BEC, GEC, SEC, and WEC, whereas other variables are positively correlated. Among all, some variables have a higher correlation (e.g. CEC: 0.73; OEC: 0.65) and some others have a lower correlation (NEC: 0.04; NGC: 0.19). In MCSQA and MCSQS, CO2 is negatively correlated with BEC, GEC, NGC, SEC, and WEC, whereas other variables are positively correlated. Among all, some variables have a higher correlation (e.g. CEC: 0.83; OEC: 0.83) and some others have a lower correlation (e.g. NEC: 0.25; GEC: 0.25). Hence, it can be stated that the variables have a mixed condition, where they have both higher and lower correlations with CO2.
Stationarity test
Table 5 demonstrates the stationarity test results.
Stationarity test results.
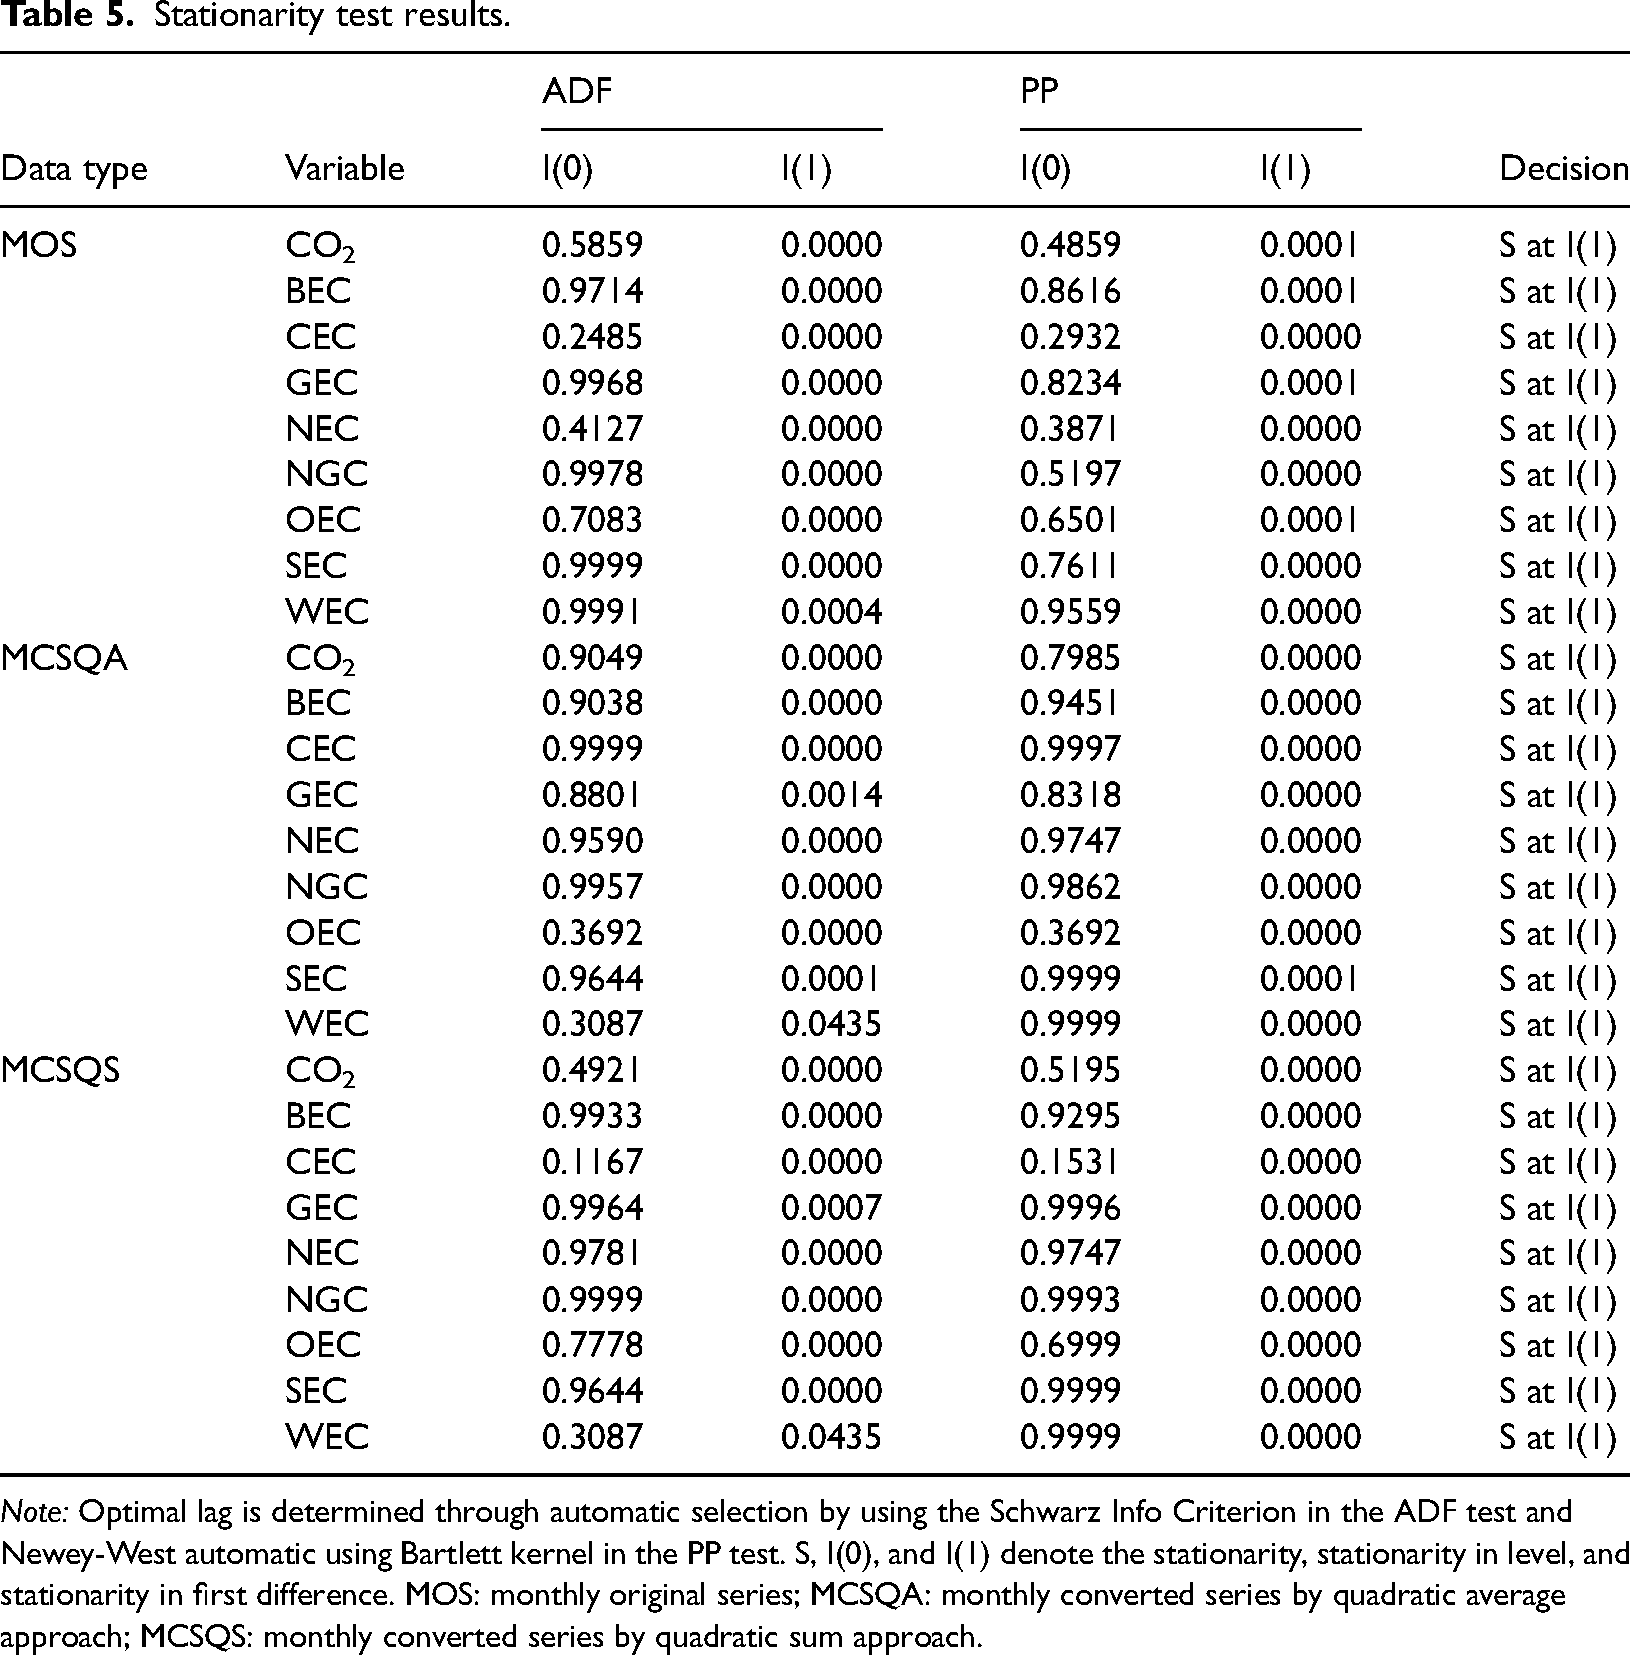
Note: Optimal lag is determined through automatic selection by using the Schwarz Info Criterion in the ADF test and Newey-West automatic using Bartlett kernel in the PP test. S, I(0), and I(1) denote the stationarity, stationarity in level, and stationarity in first difference. MOS: monthly original series; MCSQA: monthly converted series by quadratic average approach; MCSQS: monthly converted series by quadratic sum approach.
Based on both ADF and PP test results, all variables have a unit root that they are stationary at the I(1) level.
In the case of the overall evaluation of the fundamental statistics (i.e. descriptive statistics, correlations, and stationarity condition of the variables), it is much more appropriate to apply econometric approaches that consider nonstationary at I(0). Hence, considering data characteristics, the study performs CR approaches (i.e. CCR, DOLS, and FMOLS) on the datasets for applying a comprehensive empirical analysis.
Comparison of the prediction results by CR approaches
Followingly, the study performs the CR approaches. Table 6 reports RMSE, MAE, MAPE, and R2 statistics of CR results for the datasets in a comparative way.
Comparison of the prediction approaches.
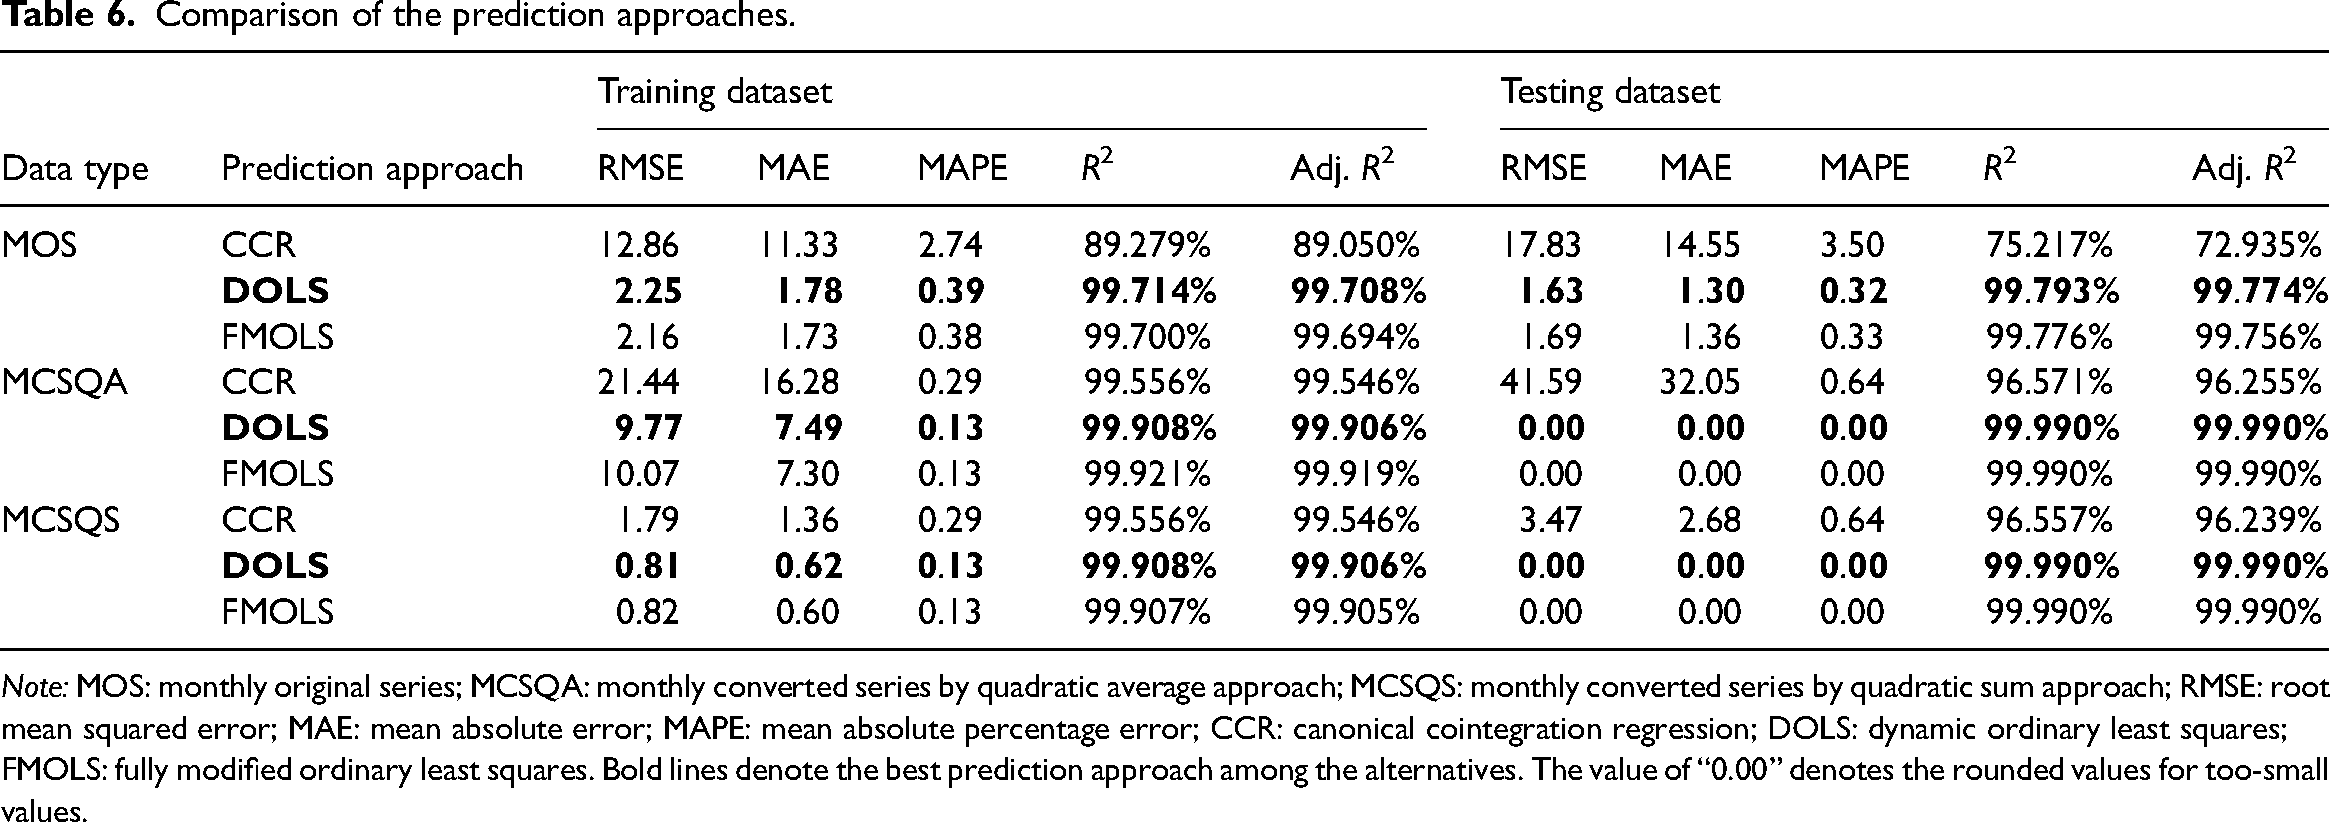
Note: MOS: monthly original series; MCSQA: monthly converted series by quadratic average approach; MCSQS: monthly converted series by quadratic sum approach; RMSE: root mean squared error; MAE: mean absolute error; MAPE: mean absolute percentage error; CCR: canonical cointegration regression; DOLS: dynamic ordinary least squares; FMOLS: fully modified ordinary least squares. Bold lines denote the best prediction approach among the alternatives. The value of “0.00” denotes the rounded values for too-small values.
According to Table 6, the R2 values of the prediction models across the training dataset and testing dataset are quite similar and near each other. Also, there is a high level of consistency between training dataset results and testing dataset results. Besides, the results between the training dataset and testing dataset are above 70%, which is higher than the acceptable limit. Hence, it can be stated that CR approaches are successful in predicting CO2 emissions by using source-based energy use indicators.
From the point of view of data conversion impact, data conversion improves goodness of fit criteria (i.e. RMSE, MAE, and MAPE) because the values on these parameters are generally smaller in MCSQA and MCSQS with regard to MOS. Similarly, data conversion increases the R2 values of the prediction models. Besides, with regard to the QA approach, the QS approach has a much more powerful and beneficial impact in terms of gathering better prediction results.
Results of the best prediction approach
Among all CR approaches applied, the DOLS approach has the highest prediction performance across MOS, MCSQA, and MCSQS. Through defining that the DOLS approach is the best approach among the alternatives applied, Table 7 presents the prediction results for three datasets.
Prediction results of the DOLS approach.
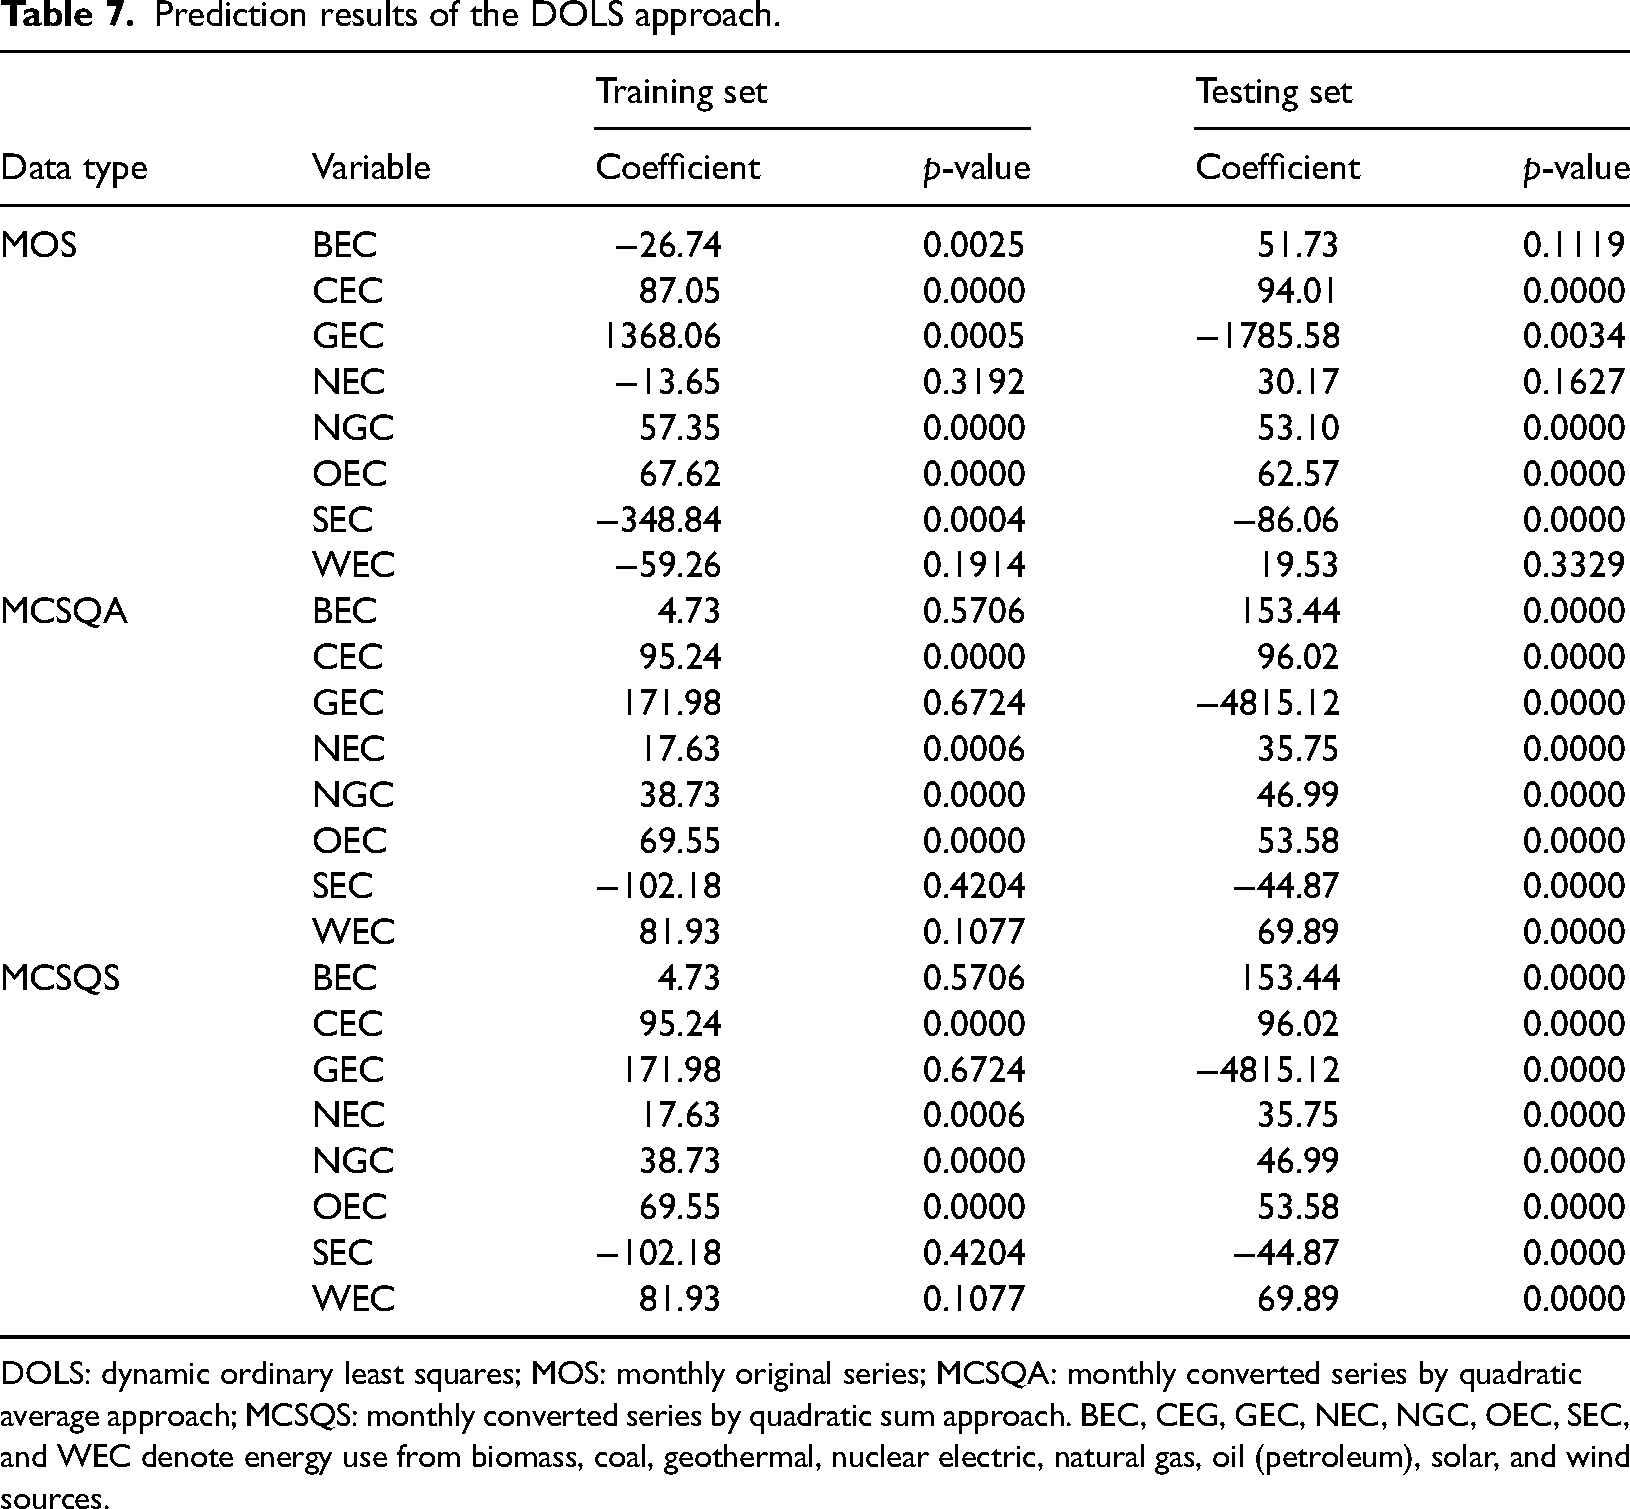
DOLS: dynamic ordinary least squares; MOS: monthly original series; MCSQA: monthly converted series by quadratic average approach; MCSQS: monthly converted series by quadratic sum approach. BEC, CEG, GEC, NEC, NGC, OEC, SEC, and WEC denote energy use from biomass, coal, geothermal, nuclear electric, natural gas, oil (petroleum), solar, and wind sources.
In MOS, all variables except for BEC, NEC, and WEC have a statistically significant impact on CO2 emissions. Also, GEC and SEC have a decreasing impact, whereas the remaining variables have an increasing one. Moreover, the GEC (SEC) has the highest increasing (decreasing) impact on CO2 emissions. In MOS, the constructed prediction model can predict 99.77% variations in CO2 emissions through consideration of source-based energy use indicators.
In MCSQA and MCSQS, all variables have a statistically significant impact on CO2 emissions. Also, GEC and SEC have a decreasing impact, whereas the remaining variables have an increasing one. Moreover, the GEC (SEC) has the highest increasing (decreasing) impact on CO2 emissions. Using either MCSQA or MCSQS, the constructed prediction model can predict 99.99% variations in CO2 emissions through consideration of source-based energy use indicators.
Among all datasets, the prediction performance of converted datasets (i.e. MCSQA and MCSQS) is higher than the original dataset (i.e. MOS). While the difference between the original and converted datasets is lower in the testing dataset, it increases a bit in the testing dataset.
Overall, the results reveal that data conversion increases R2 values and improves the goodness of fit criteria of the prediction models, while data conversion causes a change in the coefficients of the explanatory variables. Hence, the study empirically reveals the increasing impact on the prediction capacity of the models, but the varying impact of the data conversion on the prediction results.
The DOLS results show that both GEC and SEC have a certain declining impact on CO2 emissions, whereas other source-based energy use indicators do not help combat emissions in the USA. This is an important point that policymakers should consider in trying to achieve the sustainable development goal (SDG) SDG-13 by benefitting from SDG-7 because the empirical results demonstrate that all types of clean energy do not help ensure carbon neutrality, instead only some of them are beneficial.
Conclusion, discussion, policy endeavors, and future research
Conclusion
In light of SDGs, which aim to make economies sustainable, as well as the increasing importance of climate change at the global level and developing awareness concerning environmental degradation, this study uncovers the role of data conversion, which is a recent and common practice, on prediction results. Accordingly, the study focuses on an important point in the empirical analysis, which has not been the case until now based on the best knowledge, although various conversion practices have been applied.
Compatible with the literature gap defined, this study focuses on the USA case for the empirical analysis because it is an appropriate case for such analysis because the USA publishes both monthly and yearly data for energy-related emissions and source-based energy use data. Hence, it is possible to use the original (i.e. monthly) dataset as well as the converted dataset from the yearly to monthly one by applying conversion approaches. Accordingly, within the empirical examination, the study considers CO2 emissions as the most commonly used environmental degradation indicator, includes the most possible source-based energy use indicators, uses originally monthly and converted monthly datasets between 1989/1 and 2023/12, and applies CR approaches.
Through a comprehensive empirical process, the study defines that data conversion increases R2 values and improves the goodness of fit criteria of the prediction models; data conversion causes a change in the coefficients of the explanatory variables; the DOLS approach has the highest prediction performance among CR approaches; the importance of source-based energy use on CO2 emissions varies.
Based on empirical results, the study specifically determines that some renewable energy (i.e. solar and geothermal) types have a certainly declining impact on CO2 emissions in the USA, whereas other types of clean energy are not beneficial in this respect. 39 While the results obtained are compatible with the literature (e.g. Kuşkaya, 1 Magazzino et al., 5 Adebayo et al., 40 and Adebayo et al. 41 ), the results of this research extend the current knowledge by investigating the impact of data conversion on the prediction results.
Discussion and policy endeavors
By benefitting from the USA case, the study defines the increasing impact of data conversion on prediction results. Accordingly, this research argues various policy endeavors.
Firstly, the study argues that converted data series should be included in empirical predictions for the achievement of SDG 7 and 13 to benefit from increasing impact on prediction capacity so that incorrect prediction can be prevented. Such an approach enables policymakers to benefit from the increasing impact of data conversion on prediction capacity. In this way, policymakers can have the opportunity to benefit from this specialty of data conversion in developing further environmental policies based on energy use indicators.
Secondly, compatible with the results of the study, it is logical to be helpful in data conversion for policymakers across various countries, where there is no high-frequency data in these countries, and data conversion is a necessity to apply certain types of econometric analysis to make predictions. Thus, from this point of view, the results of the study are highly generalizable for other countries in light of the current literature, where data conversion approaches have been frequently applied in various studies.
Thirdly, the empirical results demonstrate that geothermal and solar energy uses are certainly beneficial in declining CO2 emissions in the USA. This determination implies that the USA should rely further on these types of energy use in the energy mix because other types of clean energy do not contribute to the decarbonization of the energy mix in the USA. The most probable cause of these findings may be that other clean energy sources do not have economies of scale, which prevents the efficiency of these sources.
Fourthly, some other clean energy types including solar and nuclear are not effective in curbing CO2 emissions. The potential cause of this may be a displacing impact, where the allocation of sources to specific clean energy sources may cause a displacement of other clean energy sources. Hence, the inefficiency of such clean energy sources may be seen. In this context, policymakers should enhance the generation and use of effective clean energy sources (i.e. geothermal and solar energy) in the total energy mix, while they should make further analysis about the source allocation among clean energy sources to prevent possible displacement. Accordingly, policymakers should re-evaluate these types of clean energy use by making them either efficient or re-optimized so that they can help decline CO2 emissions.
By considering the policy endeavors discussed, the USA can benefit from further optimization of the energy mix under the impact of data conversion on the prediction results. Hence, the USA can make further policy development based on better prediction results. Overall, the USA can benefit from these points in enhancing various SDGs, especially SDG-7 (clean energy) and SDG-13 (climate action).
The results of the study are not only important for the USA, but also they can be beneficial for other countries under the leading position of the USA in the world because many countries have followed the path of the USA. Accordingly, because all countries have been aiming to ensure SDG-13, which is related to slowing down climate change by limiting global warming, the data conversion practices can help develop countries, especially those, who are low-income countries, in obtaining high-frequency data. In this way, while they do not have to bear to cost of producing high-frequency data, they can have also the opportunity to benefit from using high-frequency data in empirical modeling. Hence, they can make further analysis and have much better options to put their environmental policies based on energy use indicators. On the other hand, such data conversion approaches and their benefits can be used in other environmental and energy-related areas so that both SDG-7 and SDG-13 can be achieved through various actions that are consistent with the sub-targets of these SDGs. Hence, the results of this study may have large application areas in participating in the achievement of SDGs for the USA as well as other countries across the world. Thus, this study may have a much broader societal impact on decarbonization, carbon neutrality, energy, and environmental points in ensuring climate change through succeeding SDGs.
Limitations and future research
In the investigation of data conversion impact on the prediction results, the study has tried to make a very detailed empirical analysis. Although such an approach is followed up, nevertheless, the study has some limitations.
First, due to the data availability, the study examines only the USA case. For this reason, new studies should test the validity of the findings of this research on other countries including both developed and developing, if the appropriate data can be available for them.
Second, the study considers mainly energy-related CO2 emissions and source-based energy use indicators in investigating the impact of data conversion on the prediction results. However, this approach does not consider other potentially effective factors, such as economic growth. So, new studies can include such influential factors in further empirical analyses.
Third, the study makes the empirical investigation by relying on main econometric (i.e. CR) approaches. Therefore, new studies can either perform other time series approaches that are not included in this study or prefer to apply machine learning algorithms as well. In addition, new studies can consider applying Monte Carlo simulation to analyze the issue across various scenarios. Even, new research can compare time series approaches and machine learning approaches.
Fourth, some other points, such as unit root tests with structural breaks and cointegration analyses with structural breaks or regime shifts, can be considered in new studies.
Last, since the study considers only QA and QS approaches in data conversion, new studies can consider other data conversion approaches (e.g. constant, linear, cubic, etc.). In this way, the validity of this research can be checked for other data conversion approaches. By embedding the points mentioned above into new research, the literature on the issue can be enriched further.
Footnotes
Abbreviations
Acknowledgments
Not applicable.
Authors’ contributions
There is one author, who prepared this work. He read and approved the final manuscript.
Author’s note
The authors certify that they have no affiliations with or involvement in any organization or entity with any financial interest (such as honoraria; educational grants; participation in speakers’ bureaus; membership, employment, consultancies, stock ownership, or other equity interest; and expert testimony or patent-licensing arrangements), or non-financial interest (such as personal or professional relationships, affiliations, knowledge, or beliefs) in the subject matter or materials discussed in this article.
Availability of data and materials
Data will be made available on request.
Consent for publication
The authors are willing to permit the Journal to publish the article.
Declaration of conflicting interests
The author(s) declared no potential conflicts of interest with respect to the research, authorship, and/or publication of this article.
Ethics approval and consent to participate
Not applicable.
Funding
The author(s) received no financial support for the research, authorship, and/or publication of this article.
Annexes
OLS approximation for the prediction of CO2 emissions.
| Variable | Coefficient | Std. Error | t-Statistic | Prob. |
|---|---|---|---|---|
| BEC | −28.48 | 4.31 | −6.61 | 0.0000 |
| CEC | 89.62 | 0.96 | 93.32 | 0.0000 |
| GEC | 1360.08 | 192.49 | 7.07 | 0.0000 |
| NEC | −12.25 | 7.13 | −1.72 | 0.0865 |
| NGC | 56.65 | 0.32 | 174.58 | 0.0000 |
| OEC | 66.33 | 0.49 | 134.09 | 0.0000 |
| SEC | −111.29 | 12.50 | −8.90 | 0.0000 |
| WEC | −80.47 | 16.13 | −4.99 | 0.0000 |
| R2 | 99.69 | Adj. R2 | 99.68 |
OLS: ordinary least squares; CO2: carbon dioxide. BEC, CEG, GEC, NEC, NGC, OEC, SEC, and WEC denote energy use from biomass, coal, geothermal, nuclear electric, natural gas, oil (petroleum), solar, and wind sources.
Annex 2. Graphical representation of the variables in monthly original series (MOS) dataset.
Annex 3. Graphical representation of the variables in monthly converted series by quadratic average approach (MCSQA) dataset.
Annex 4. Graphical representation of the variables in monthly converted series by quadratic sum approach (MCSQS) dataset.