
Abstract
This study presents an integrated MTEF (monetary-technical-emission-fuel) analysis for a standalone hybrid renewable energy system implemented in tribal residential schools and hostels in Sankarapuram Zone, Tamil Nadu, India. Using the HOMER Pro Microgrid Analysis Tool, three scenarios were evaluated: normal loading (100% of peak load), step loading (110% of peak load), and full renewable loading. Key findings include cost of energy ranging from $0.185 to $0.279/kWh, annual operating costs of $1466 to $10,448, and CO2 emissions between 7578 to 14,204 kg/year. The study highlights fuel consumption reductions (2895 to 5426 liters/year) and generator operation hours (699 to 2209 h/year). Generator analysis and job creation potential were also discussed, offering a sustainable power solution for tribal education. This work provides a framework for ensuring uninterrupted power in remote tribal areas.
Keywords
Introduction
It is sad to record that almost 20% of the people in the world do not have access to electricity. The main challenge to the contemporary world is to electricity services to rural and distant areas. Since there are technical difficulties to transport power through the extension of grid to extremely distant and tribal areas, only option is off-grid to deliver power to inaccessible areas..1–2 India with a huge population, needs additional energy sources, to meet the escalating load demand.3–4 Majority of load demand is satisfied only by conventional power generation 5 and it generates several problems in electric power transmission and distribution sector like monetary issues, interrupted and unreliable power supply, tariff issues, high losses in transmission network and power stealing.6–10 The power demand in India is expected to go up to three times after two decades. 11 Many rural communities, especially in remote tribal areas, face challenges due to limited infrastructure and access to basic utilities, particularly those who lack access to electricity.12–13 Power generated from renewable energy is a key alternative to reduce the carbon emissions associated with fossil fuel generators. The power from renewable energy sources is ample and limitless to replace the traditional energy sources. Electrification, through the renewable energy system is the most common technique to reduce the level of pollution and facilitate the sustainability of the environment. 14
The reliability of a continuous power supply from standalone renewable energy sources cannot be compared to that of traditional power generation. However, hybrid renewable energy systems provide more efficient solutions. By combining different renewable energy sources, these systems can deliver power in a more sustainable and cost-effective manner.15–19 The research has been going on different technical approaches, to meet the escalating load demand for consistent quality of power supply. 20 Based on the site under consideration, the availability of local renewable energy sources can be utilized effectively, with minimum COE (Cost of Energy) as a significant criterion.21–22 The power deficit in Tamil Nadu State Power Grid is substantial owing to the scarcity of real power generation. As a result, the power shedding, in remote and rural areas has been up to 14 h a day 23 and this highlights the need for uninterrupted power supply in rural and remote areas, through hybrid renewable energy sources. 24 Numerous research efforts have been undertaken to discover the finest hybrid renewable energy system (HRES) combinations. An optimal design of a standalone integration of renewable energy sources (IRES), comprising of MHG/BMG/SPV/WT components, 25 was tried in a rural area named Dewal, located in Chamoli District, Uttarakhand State. This study was focused on COE and NPC, performed by the hybrid optimization model for electric renewables (HOMER). Rajanna and Saini 26 examined IRES, for a group of un-electrified villages, located in Chamarajanagar District in Karnataka State, including MHG/BMG/BGG/SPV/WT, with different zones. The COE and NPC were studied through the optimization process, through GA.
A standalone combination of SPV/HG/WT system was studied, 27 in a remote area named Kadayam village located in Tirunelveli District, in southern Tamil Nadu. The emission quantity, COE and NPC were obtained through HOMER for 250 kW/day, with 12.7 kW as the peak load demand. The sensitivity analysis was also carried out in this work. Upadhyay and Sharmai 28 inspected IRES, in seven remote villages, located in Dhauladevi, Almora District in Uttarakhand State, including MHG/SPV/BGG/BMG combination.
The COE values ranged from 4.6 to 5.91 Indian rupees, under various dispatch strategies and they were optimized by GA, PSO and BBO. Kumar et al. 29 observed rural electrification by On-grid/SPV integrated system, for Jalalabad village located in Ghaziabad District, in Uttar Pradesh.
The Levelized COE and NPC were studied through the optimization process, through HOMER, under four different cases. An off-grid IRES, comprising of SPV/WT/BMG/BGG/HT/FC/ER components, under four combinations, 30 was examined in three villages, located in Kollegal, Chamarajanagar District, Karnataka. COE, OC and NPC were obtained and optimized by GA and HOMER. Sensitivity analysis was also undertaken with a primary load of 724.83 kWh/day and 149. 21 kW peak load. A rural healthcare building is a case study for an off-grid PV, integrated with generator installation, located at Kila Kadayam village, Tirunelveli District in Tamil Nadu. The primary load of 34 kWh/day and 5.9 kW peak was studied and the optimization process was carried out by HOMER. 31
Nesamalar et al. 32 investigated an on-grid and off-grid PV, integrated with generator, for an educational institution named, Kamaraj College of Engineering and Technology, Virudhunagar District, Tamil Nadu, having an average energy demand of 1023 kWh/month. The optimization process was obtained for COE, NPC, and OC through HOMER. An off-grid, integrated with SPV/HFC/HT/ER components, was studied for a research building of an educational institution, named Maulana Azad National Institute of Technology, located at Bhopal, Madhya Pradesh State, for the primary load of 56.52 kWh/day, with 4.4 kW peak. 33
Alsagri et al. (2024) studied an energy recovery system with grid-scale energy storage and found it to be a cost-effective solution. Their results showed a high energy efficiency of 92.15% and an exergy efficiency of 49.66%. The levelized costs were 104.69 €/MWh for heat, 135.20 €/MWh for electricity, and 65.7 €/MWh for storage. These findings suggest that the system could be a viable and economical option for large-scale energy production and storage. 68
Roushenas et al. (2024) explore the use of utility-scale gravitational energy storage to improve the economic viability and stability of renewable energy plants. Their study, focusing on a 100 MW PV farm in Denmark, shows that pairing the plant with 5 MWh storage can reduce annual penalties by 94.5%, achieve a discounted payback period of 10.6 years, and require a capital expenditure of $126.96 million. This approach enhances cost-effectiveness and supports grid stability in renewable energy systems. 69
The combined heat and power (CHP) system achieves an energy efficiency of 56% when off-design impacts are accounted for, compared to 63.61% without such considerations. Additionally, the system's overall exergy efficiency declines from 73.36% at design conditions to approximately 63.55% under off-design scenarios. Economically, the levelized cost of storage (LCOS) for the CHP system is estimated at 114.4 €/MWh under off-design conditions and 106.8 €/MWh under design conditions. 70 The proposed system generates 315 kW power, 137.5 kW cooling, and 1.012 kg/s domestic hot water under design conditions, while capturing 74.88 kg/h CO2, recovering 137.9 kg/h condensate water, and supplying 624.24 kg/h natural gas. Operating with energy and exergy efficiencies of 58.09% and 38.58%, the system's performance is influenced by parameters such as the SOFC temperature, current density, solar radiation, and air velocity. 71
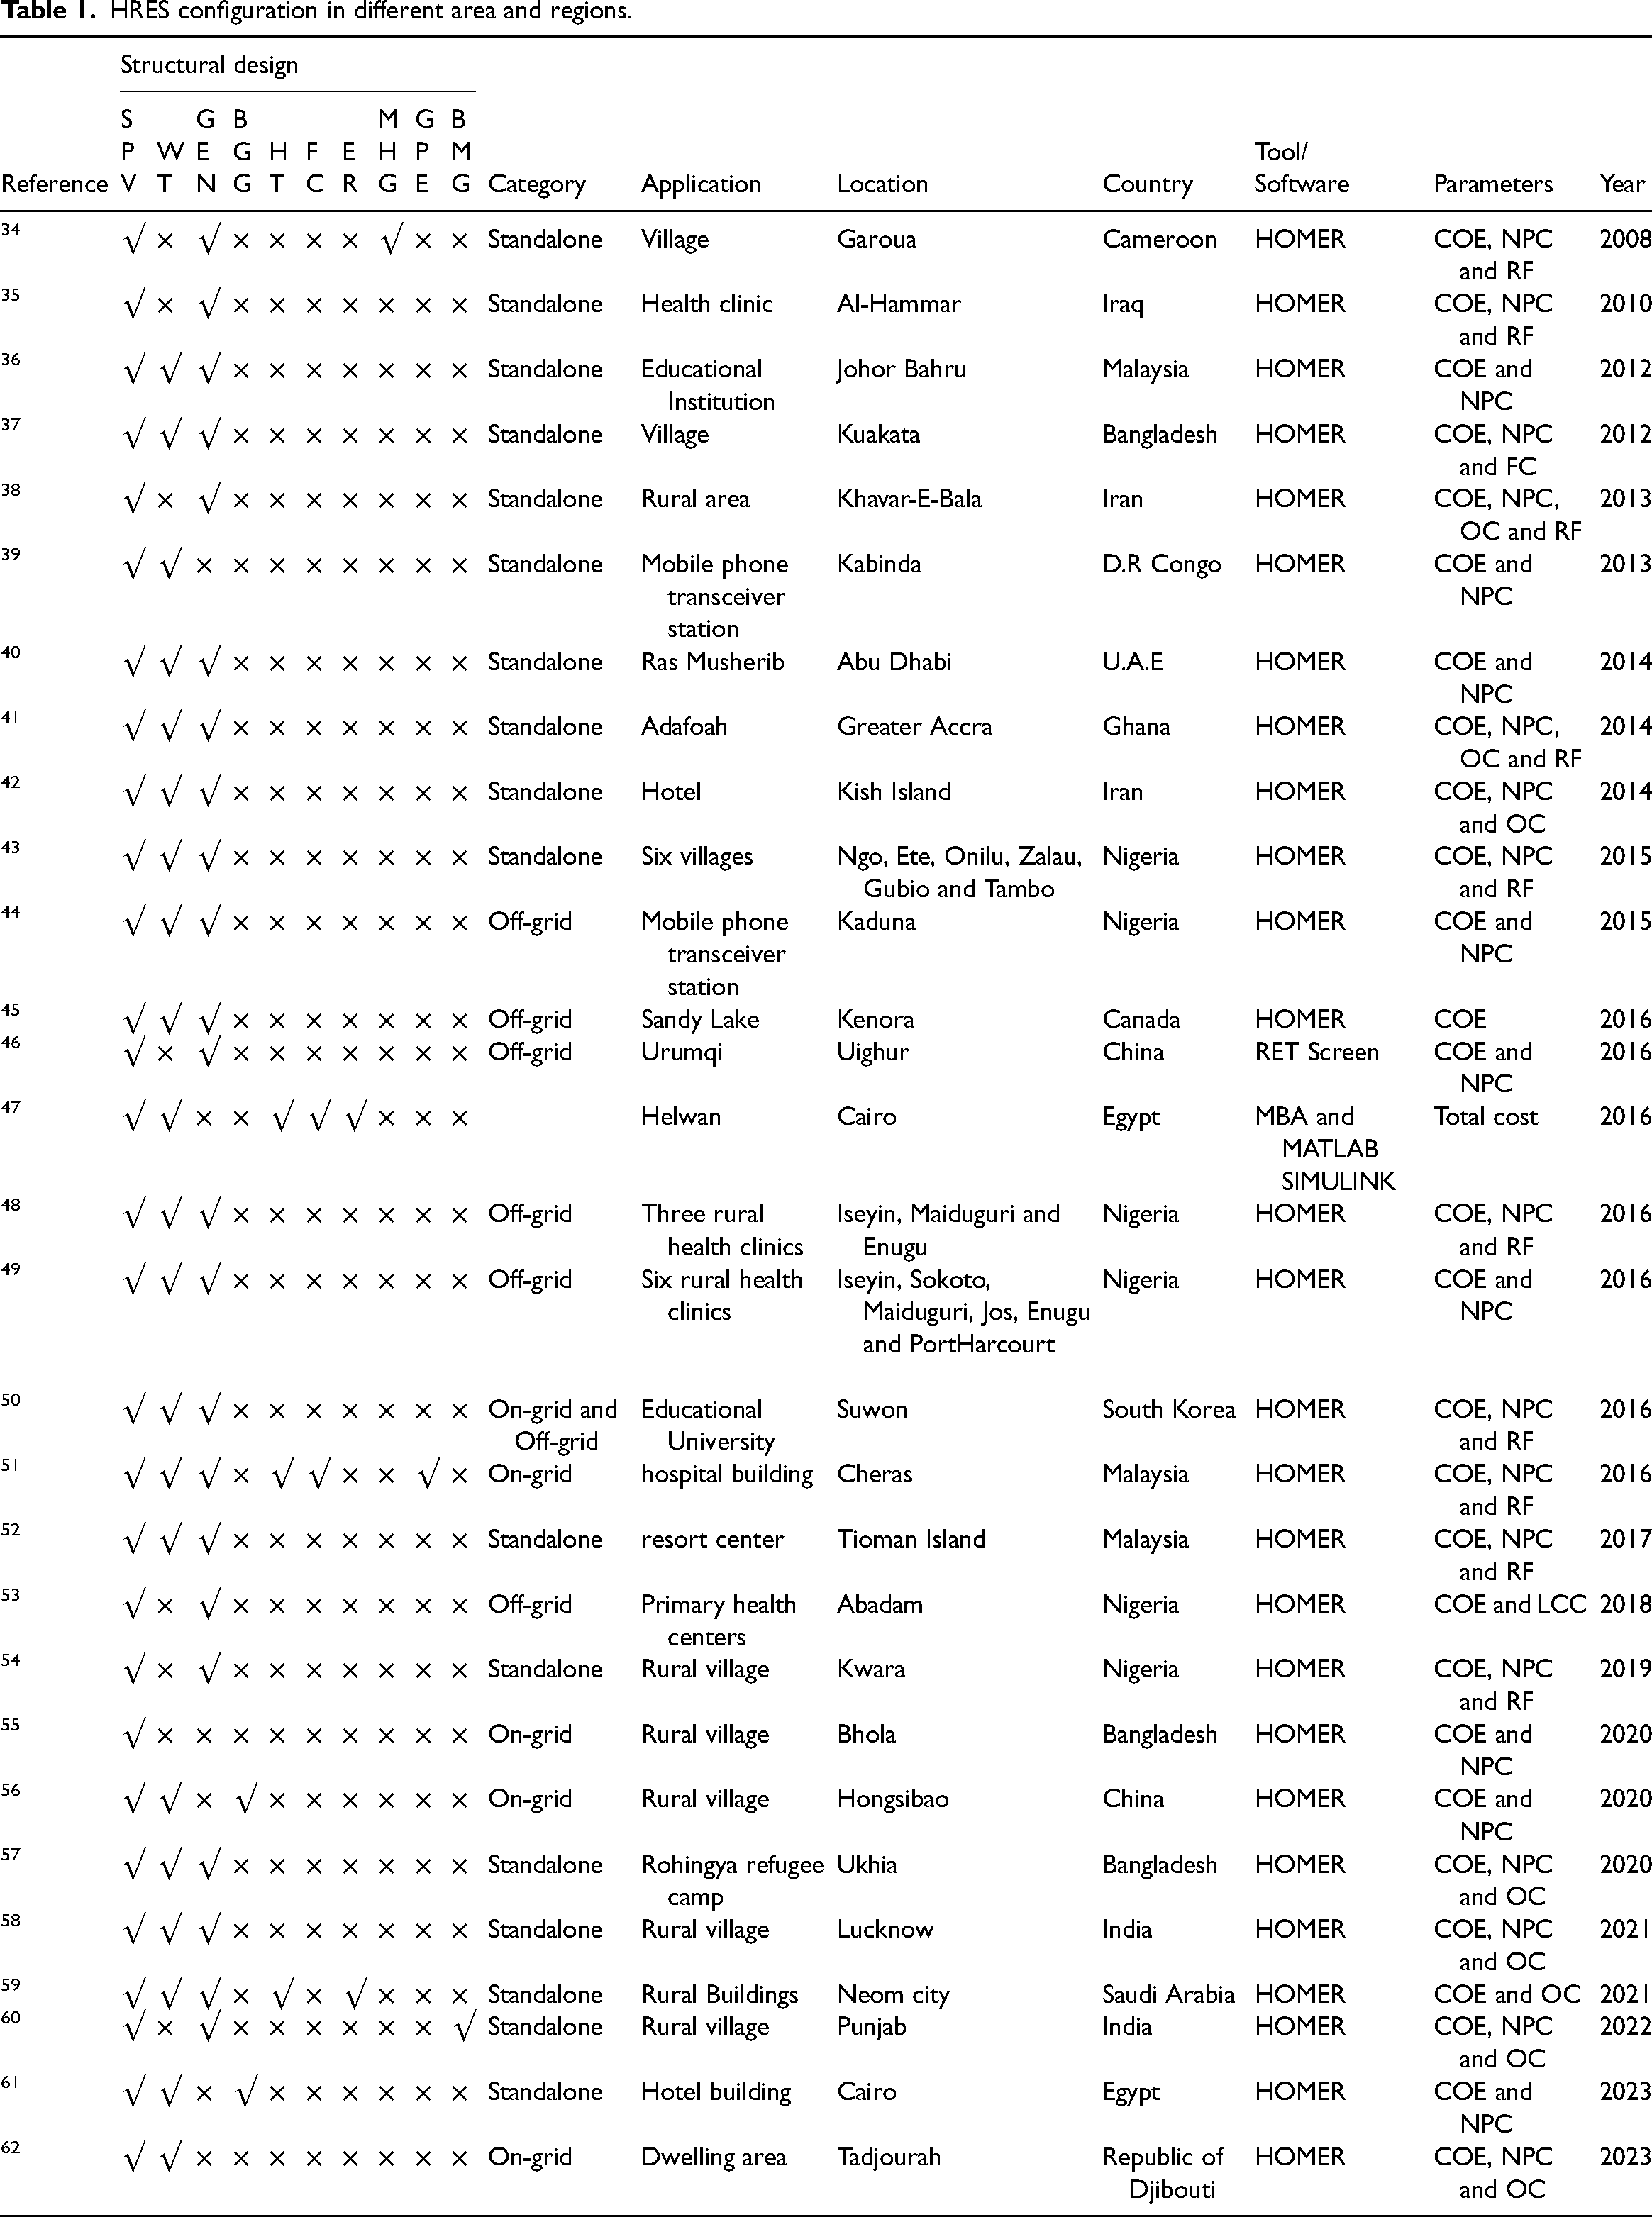
The simulation process was performed with Fuzzy logic and HOMER. Some of the key articles published worldwide, for the sizing and optimization of different HRES systems, indicating the pertinent architecture, application mode, parameters software platform and operational area are, given in the Table 1. The modeling, configurations, optimization methods and planning of HRES systems for off-grid applications were clearly reviewed. 63 It is worth noting that, majority of the researchers designed methods to optimize a variety of HRES configurations for rural and remote households. But, there are no appropriate research case studies towards the electric connectivity in the tribal areas. It is a huge challenge to connect the tribal educational institutions, located nearer tribal areas, with power grid, due to ecological, physical and technical issues. Major problems were traced to the cost and technical analysis. This research gaps was identified from the literature and hence a new standalone integrated HRES model was configured to connect electrically ten tribal residential schools and two hostels in and around Sankarapuram area, Kallakurichi District, Tamil Nadu, India. There are many tools and software to solve the optimal sizing of HRES components, performed with various combinations. 64
HRES configuration in different area and regions.
It can be observed that various feasibility studies were performed on HRES, under different domain, using HOMER. Due to the calculating speed, overall performance and accuracy, it is the best suitable to find optimal sizing of HRES. 65 Hence a comprehensive, best possible monetary, technical, emission and fuel (MTEF) analysis was proposed in this study. The chief aim of this research was to decide the most favorable arrangement for solar photovoltaic (SPV)–wind turbine (WT)–diesel generator (DG)–converter–battery system, to ensure a dependable and stable power supply, for tribal schools and hostels, located in tribal area in Sankarapuram, Tamil Nadu, India.
This work focuses on four specific issues like MTEF, for sizing and optimization of standalone HRES. There are 20 parameters, inspected under three different scenarios and each scenario was observed with four different cases like WPVT, HAPVTCA, VAPVTCA, and TAPVT. Five additional parameters were also analyzed. The details of parameters, associated with criteria, are clearly displayed in Figure 1. The entire study was optimized and simulated by HOMER Pro Micro-grid Analysis tool platform. The novel and key contributions of the proposed study are specified below.
A new standalone hybrid SPV-WT-DG energy system, along with converter and battery arrangement has been designed to feed electricity to ten different Government Tribal Residential (GTR) schools and two GTR hostels, located in and around Sankarapuram, Kallakurichi District, Tamil Nadu. Studies related to optimizing and sizing of HRES were undertaken under three scenarios like normal loading (100% of peak load) as scenario A, step loading (110% of peak load) as scenario B and normal loading with full renewable (100% of renewable energy sources) as scenario C. Each scenario was observed with four different cases like without PV Tracking (WPVT) as Case 1, Horizontal Axis PV Tracking with Continuous Adjustments (HAPVTCA) as Case 2, Vertical Axis PV Tracking with Continuous Adjustments (VAPVTCA) as Case 3 and Two Axis PV Tracking (TAPVT) as Case 4. Additionally, five additional parameters like sensitivity, payback, battery, converter, job creation factor (JCF) and Renewable Energy Fraction (REF) were also analyzed. The various monetary parameters like the Net Present Cost (NPC), COE, Operating Cost (OC), and Fuel Cost (FC) were also analyzed. Various technical parameters like the Energy Production (EP), Excess Electricity (EE), Unmet Electrical Load (UEL), Capacity Shortage (CS), and Generator Quantity (GQ) were studied. In addition, different emission parameters like Carbon-Dioxide (CO2), Carbon Monoxide (CO), Unburned Hydrocarbons (UHs), Particulate Matter (PM), Sulfur Dioxide (SO2), and Nitrogen Oxides (NO
X
) were analyzed both qualitatively and quantitatively. Finally, the fuel analysis like Fuel Consumption (FC), Operating Hours (OH), Specific Fuel Consumption (SFC), Mean Electrical Efficiency (MEE), and Number of Starts (NS) were also studied, based on the HRES scheme, which are not addressed by maximum research works. The impact of step load was analyzed and discussed for the first time. The effect of step load was studied through monetary, technical and emission criteria. Fuel analysis, including the operating hours and mean electrical efficiency, was also analyzed and studied under two scenarios like Scenarios A and B. The generator quantity analysis was also included in this study for the first time. Various parameters, related to the generator quantity like the capacity factor, fuel energy inputs and outputs were discussed briefly, under Scenarios A and B. In this work, the NPC, Fuel prize, COE and OC, related to inflation rate, were used as sensitivity factors. A scope of job creation factor based on the proposed optimal HRES design was also discussed in this study, due to the gap identified in this field of research. The study examined the proposed optimal HRES was verified and found that it is monetarily feasible and technically viable. This study is presented over five sections. Introduction forms the first section. The working plan of HRES design is discussed in section “Working plan for the proposed study.” Section “Methodology” explains the methodology, which includes the study area selection, appraisal of demand and appraisal of source. Mathematical modeling of components associated with the system is presented in section “Proposed MTEF analysis of the HRES.” Results and discussion are provided in section “Results and discussion” and section “Conclusions” concludes this study.
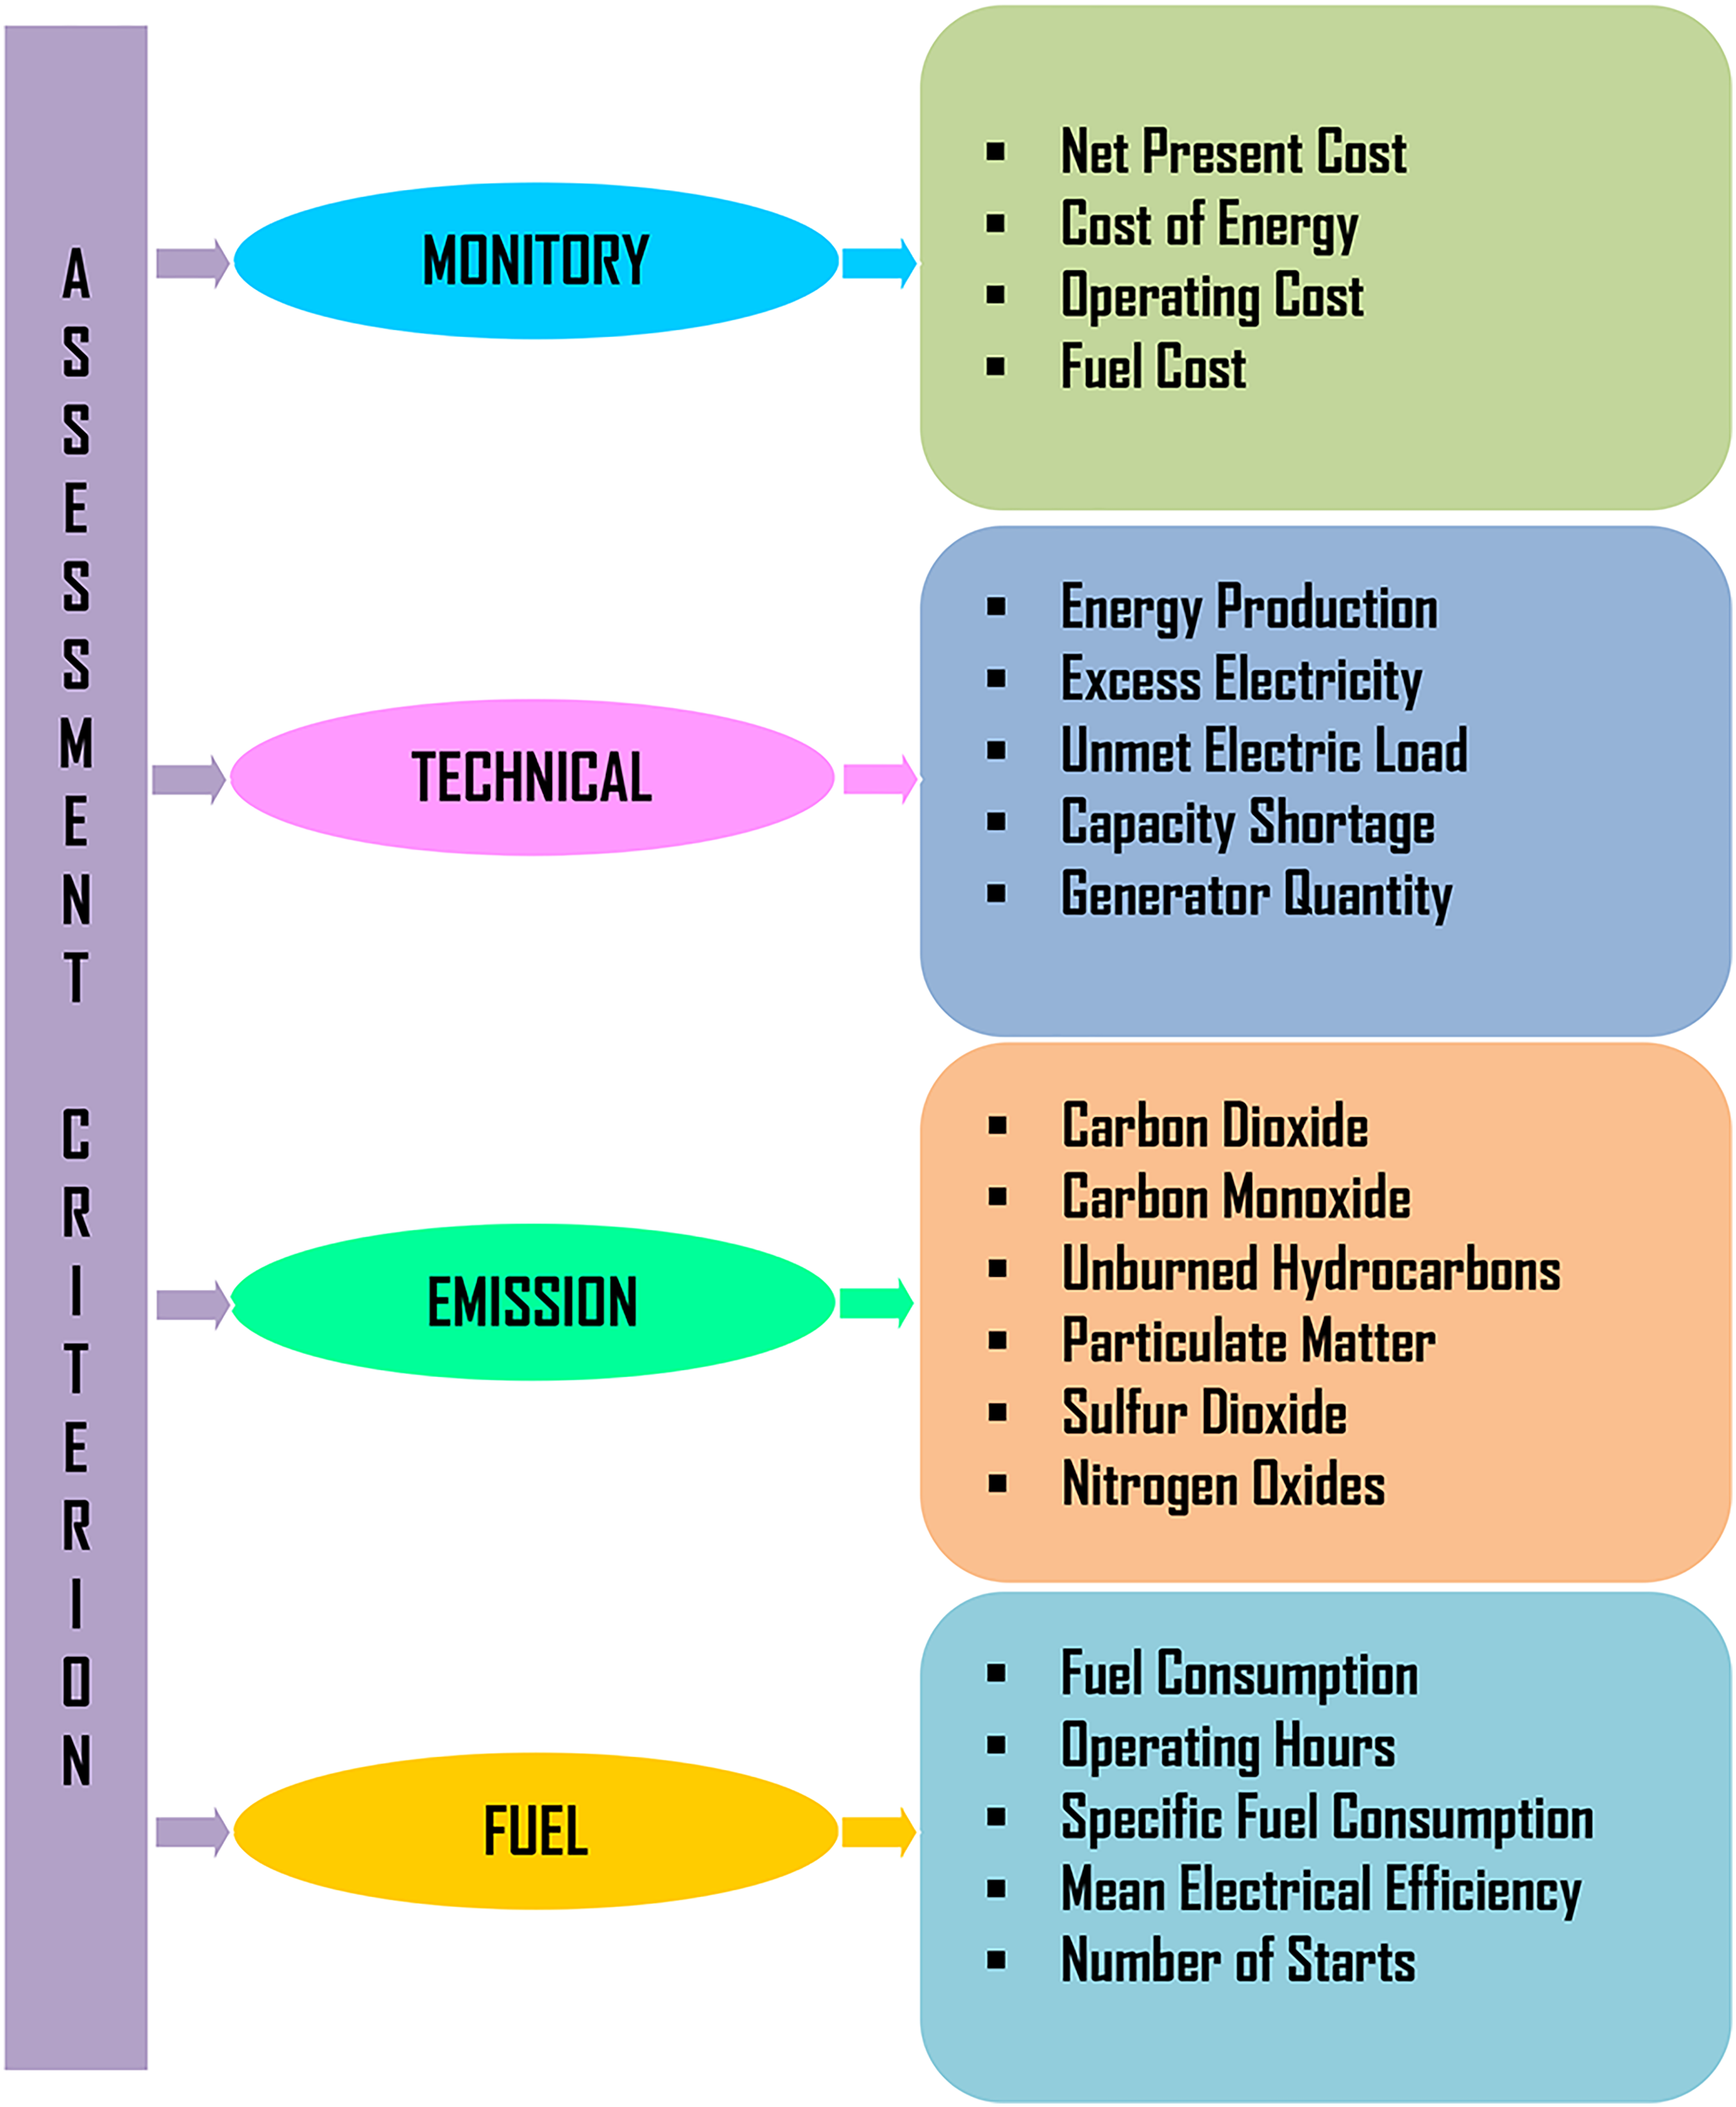
Assessment criterion for the HRES analysis.
Working plan for the proposed study
A detailed MTEF exploration, connected with the technical practicability, was performed in this work, for tribal education institutions and hostels, located in and around rural and remote locations. The layout of working plan towards HRES design is displayed in Figure 2.
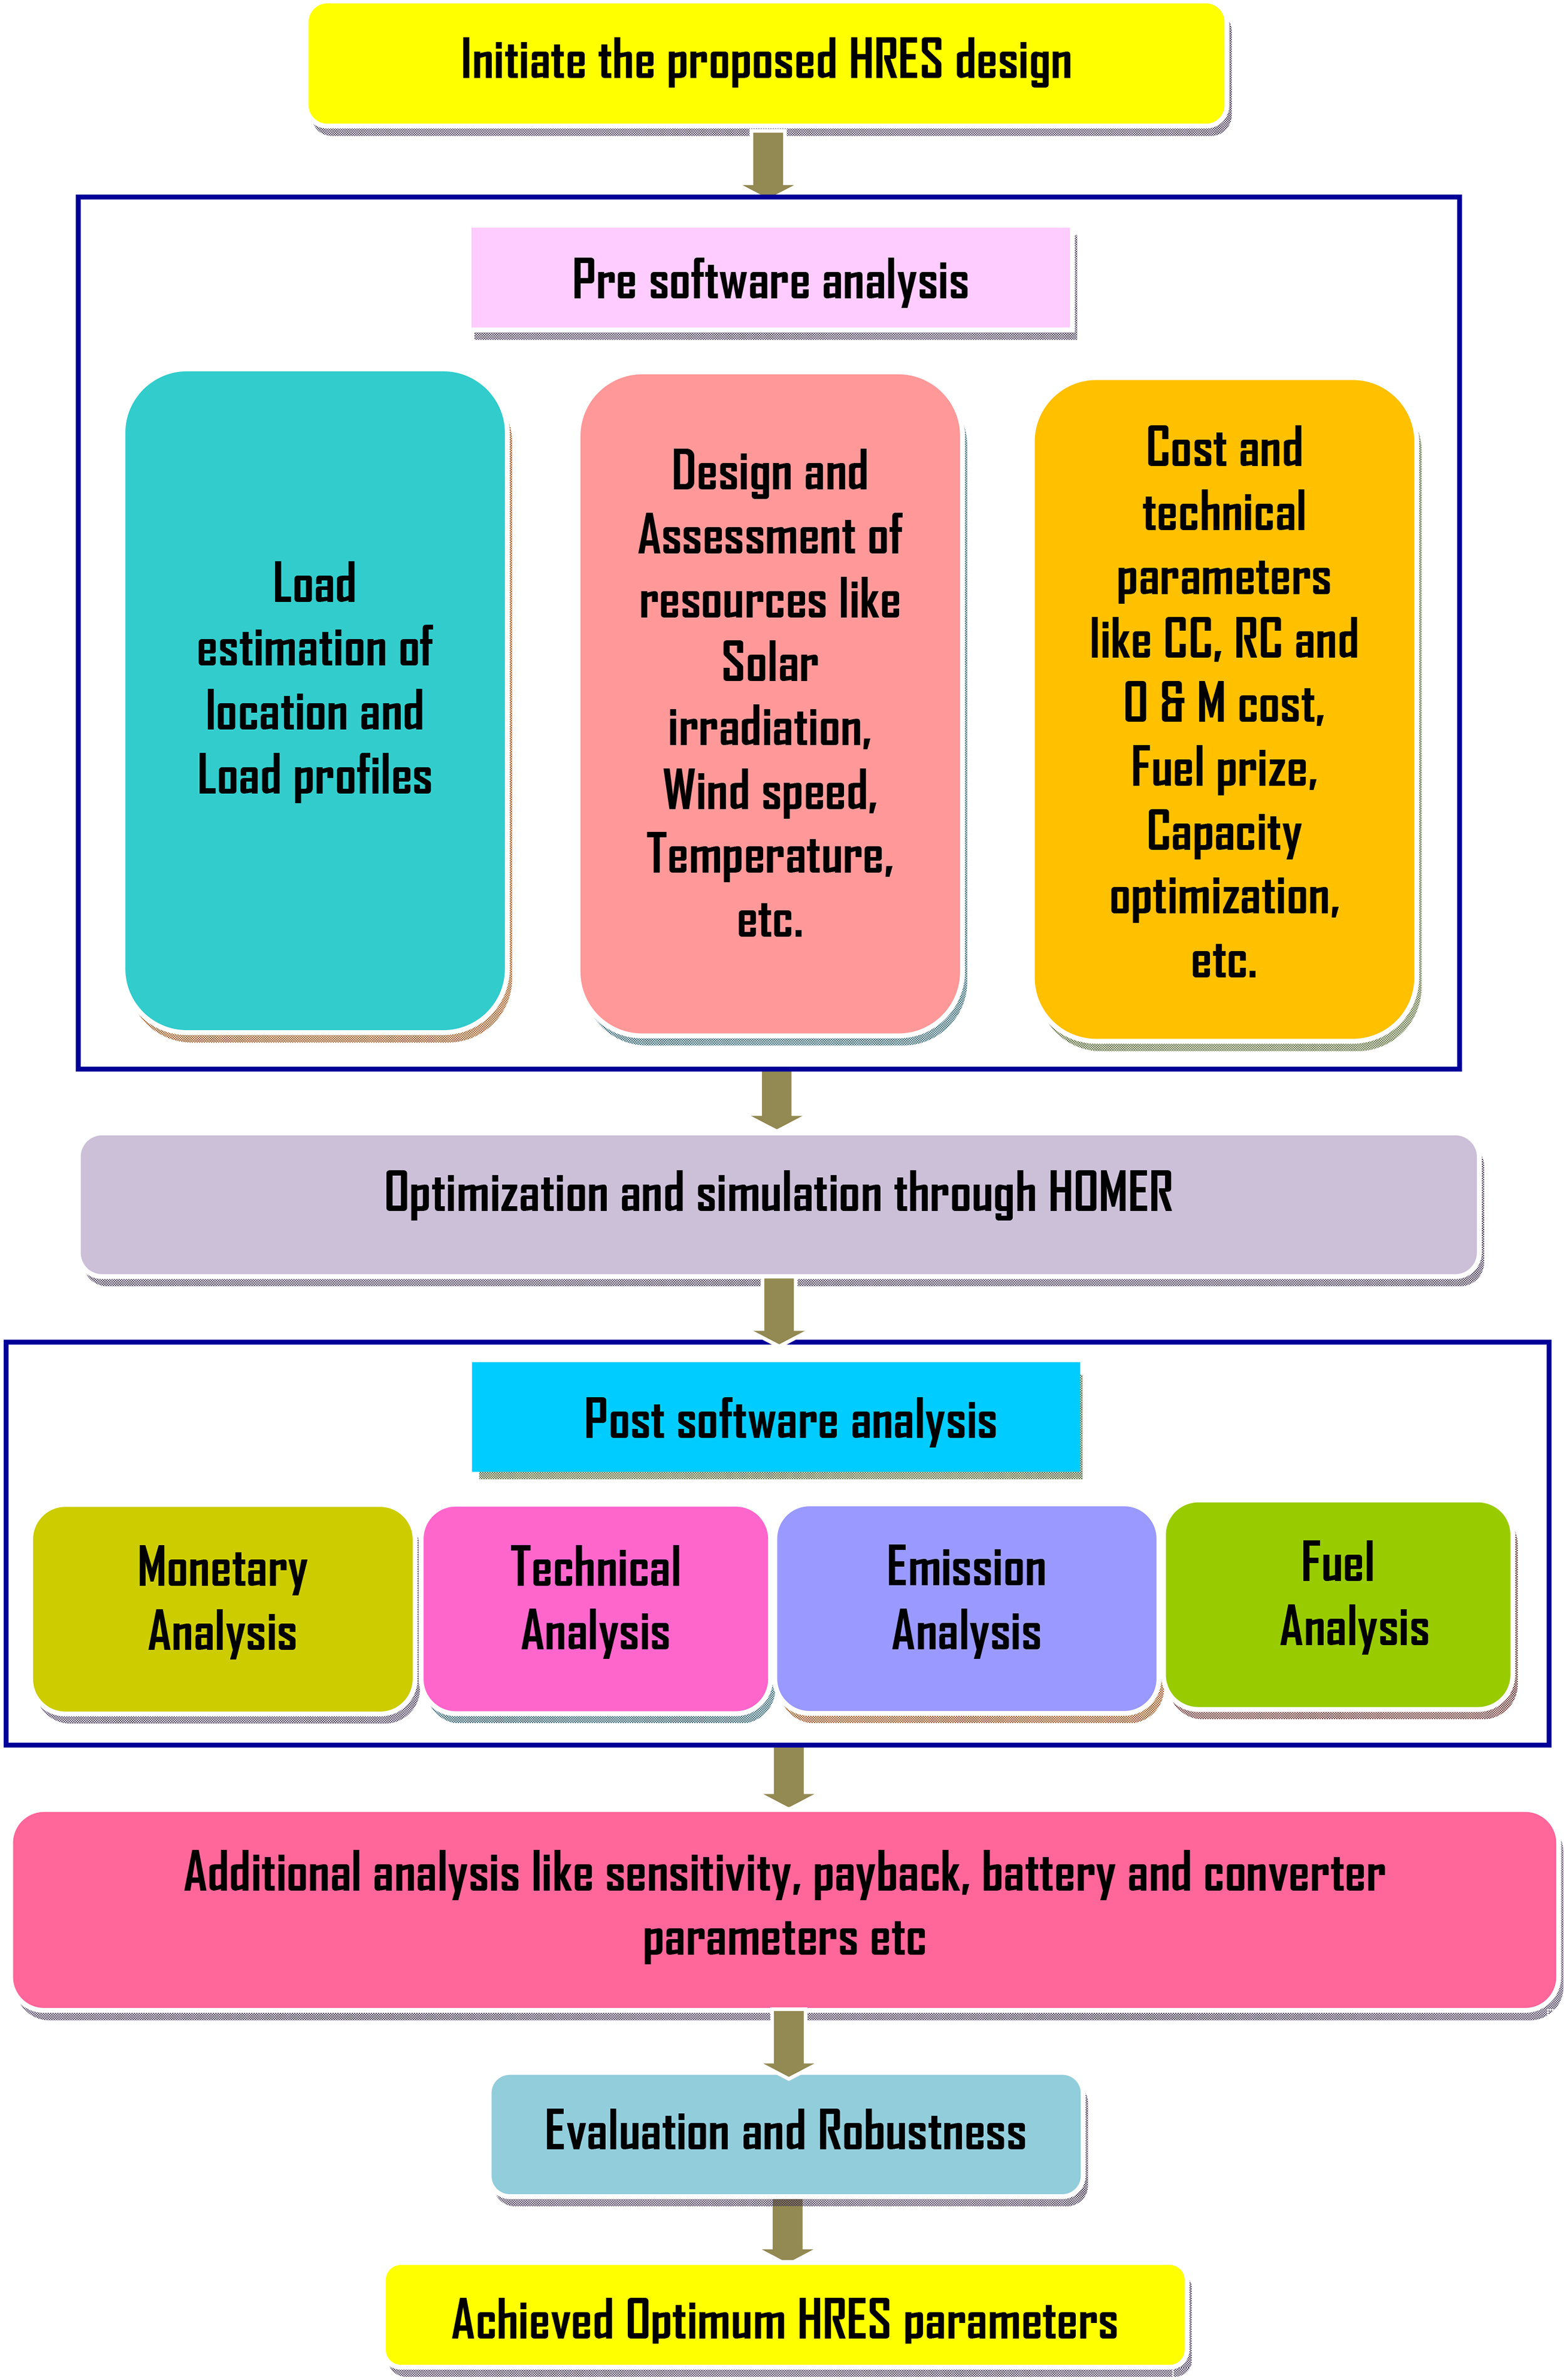
Layout of working plan.
Presoftware study
This study has been presented in three sections. The estimation of real-time load, for the proposed location with meteorological information, and design of load profiles, has been presented in the first section. Design and assessment of resources used in this study, are performed in the second section. Various cost and technical parameters are studied in the third section.
Simulation and optimization
The study is related to the financial, technical and environmental and fuel perspective, by utilizing real time demand of load on accessible renewable resources. The objective of this work was realized by utilizing various criteria based design parameter evaluations. The simulation and optimization process, for various combinations of RES and their associated devices, were obtained by HOMER Pro software.
Post-software study
There were 20 different parameters, examined under four different criteria. Four finance based parameters like NPC, COE, OC, and FC were analyzed in the first category. Five different scientific based parameters like EP, EE, UEL, CS, and GQ were analyzed in the second category. Six environmental-based parameters like CO2, CO, UH, PM, SO2, and SO X were analyzed in the third category. Five fuel based parameters like FC, OH, SFC, MEE, and NS were analyzed in the final category. All these parameters were assessed under three different scenarios, with four different cases like the WPVT, HAPVTCA, VAPVTCA, and TAPVT.
Additional study
Additional parameters were also analyzed in this work. Sensitivity analysis related to NPC, OC and COE, was undertaken under Scenario A. Payback analysis was organized for the categories A and B. The supplementary component parameters like battery and converter were examined under all cases, with loading scenarios. Finally, social analysis like the JCF related to the proposed HRES design, was also discussed.
Assessment and heftiness
The optimized system performs assessment and examines heftiness of the proposed HRES design, based on load profiles and meteorological data. The first appraisal was connected with imperative cost, scientific, environmental and fuel analysis, through inspection. Additionally, the second appraisal was applied for some additional analysis like sensitivity, payback, related component parameters like battery and converter and social. Finally, the comparative study of all parameters, given in the aforesaid appraisals, was evaluated under relevant scenarios and cases and their appropriateness was determined.
Methodology
The entire investigation of study was executed via HOMER Pro Micro-grid Analysis tool environment. The simulation and optimization process of all practicable configurations of systems was designed to search for the least costly system. 66 The social and meteorological profile of the chosen site, load demand estimation and accessibility of renewable energy sources for proposed site, are explained in the subsequent sub-sections.
Social and meteorological information of the chosen site
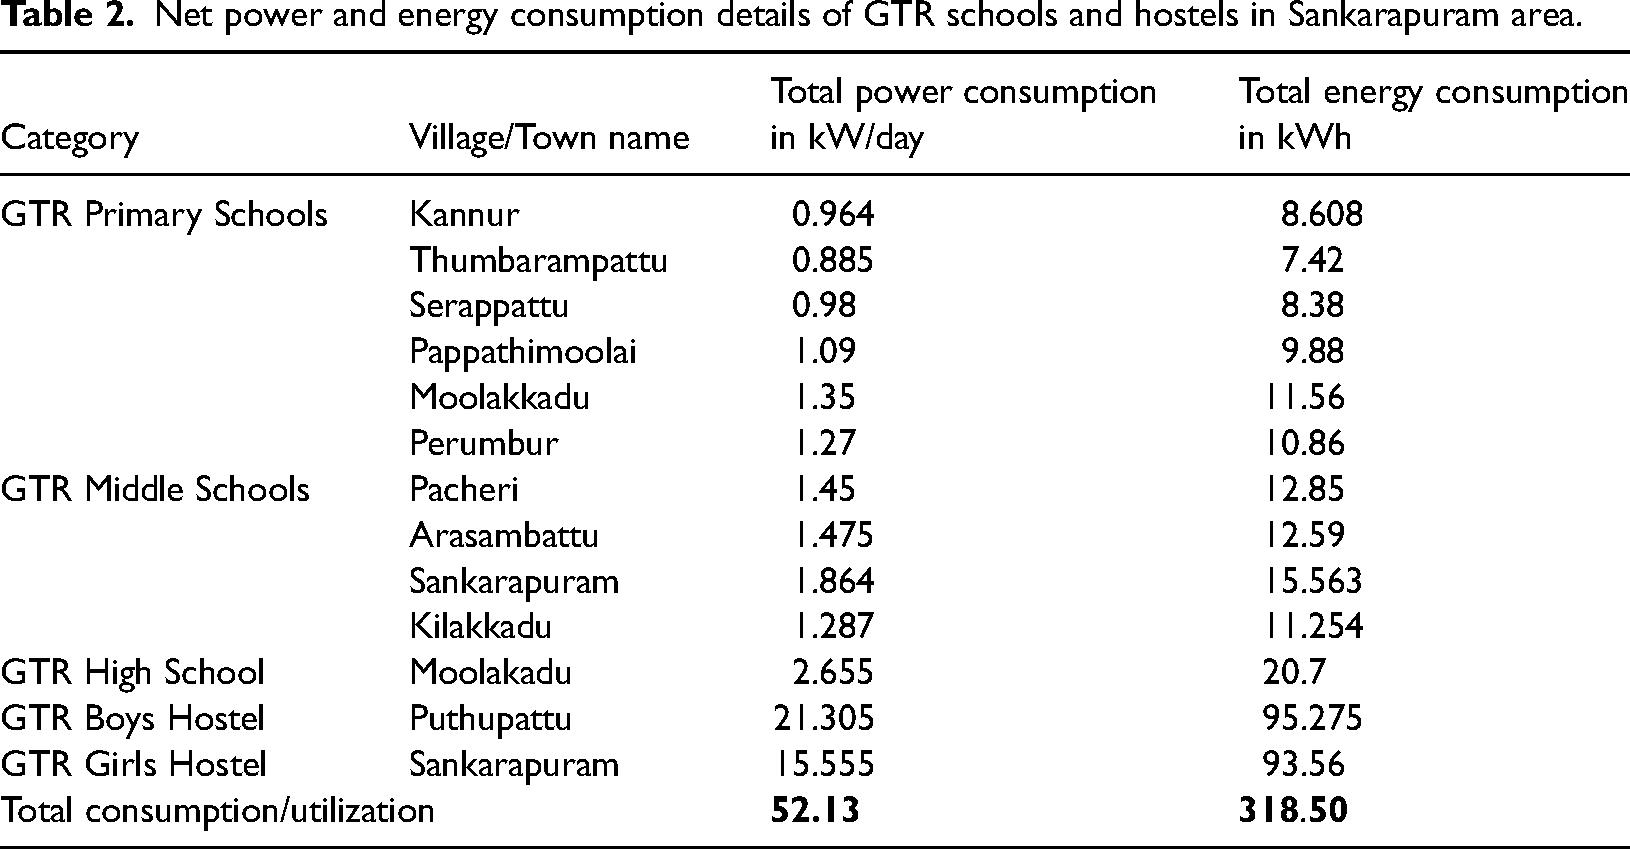
Sankarapuram is a town panchayat, functioning under the municipal administration and water supply department, located in Kallakurichi District, northern Tamil Nadu State at 78° 54ʹ 44. 6″ E longitude and 11° 53ʹ 28.4″ N latitude. The total area of this site is around 11.7 km2, with the elevation of 164 m. The geographical location of the selected site is shown in Figure 3. There are several small villages, located in and around this site and many tribal people live in those villages. A cluster of GTR schools and hostels is situated in this area for giving school education to the tribal students. This study covered six GTR primary schools (Kannur, Thumbarampattu, Serappattu, Pappathimoolai, Moolakkadu, and Perumbur), four GTR middle schools (Pacheri, Arasambattu, Sankarapuram and Kilakkadu), one GTR high school (Moolakkadu), and two GTR hostels (Puthupattu and Sankarapuram).
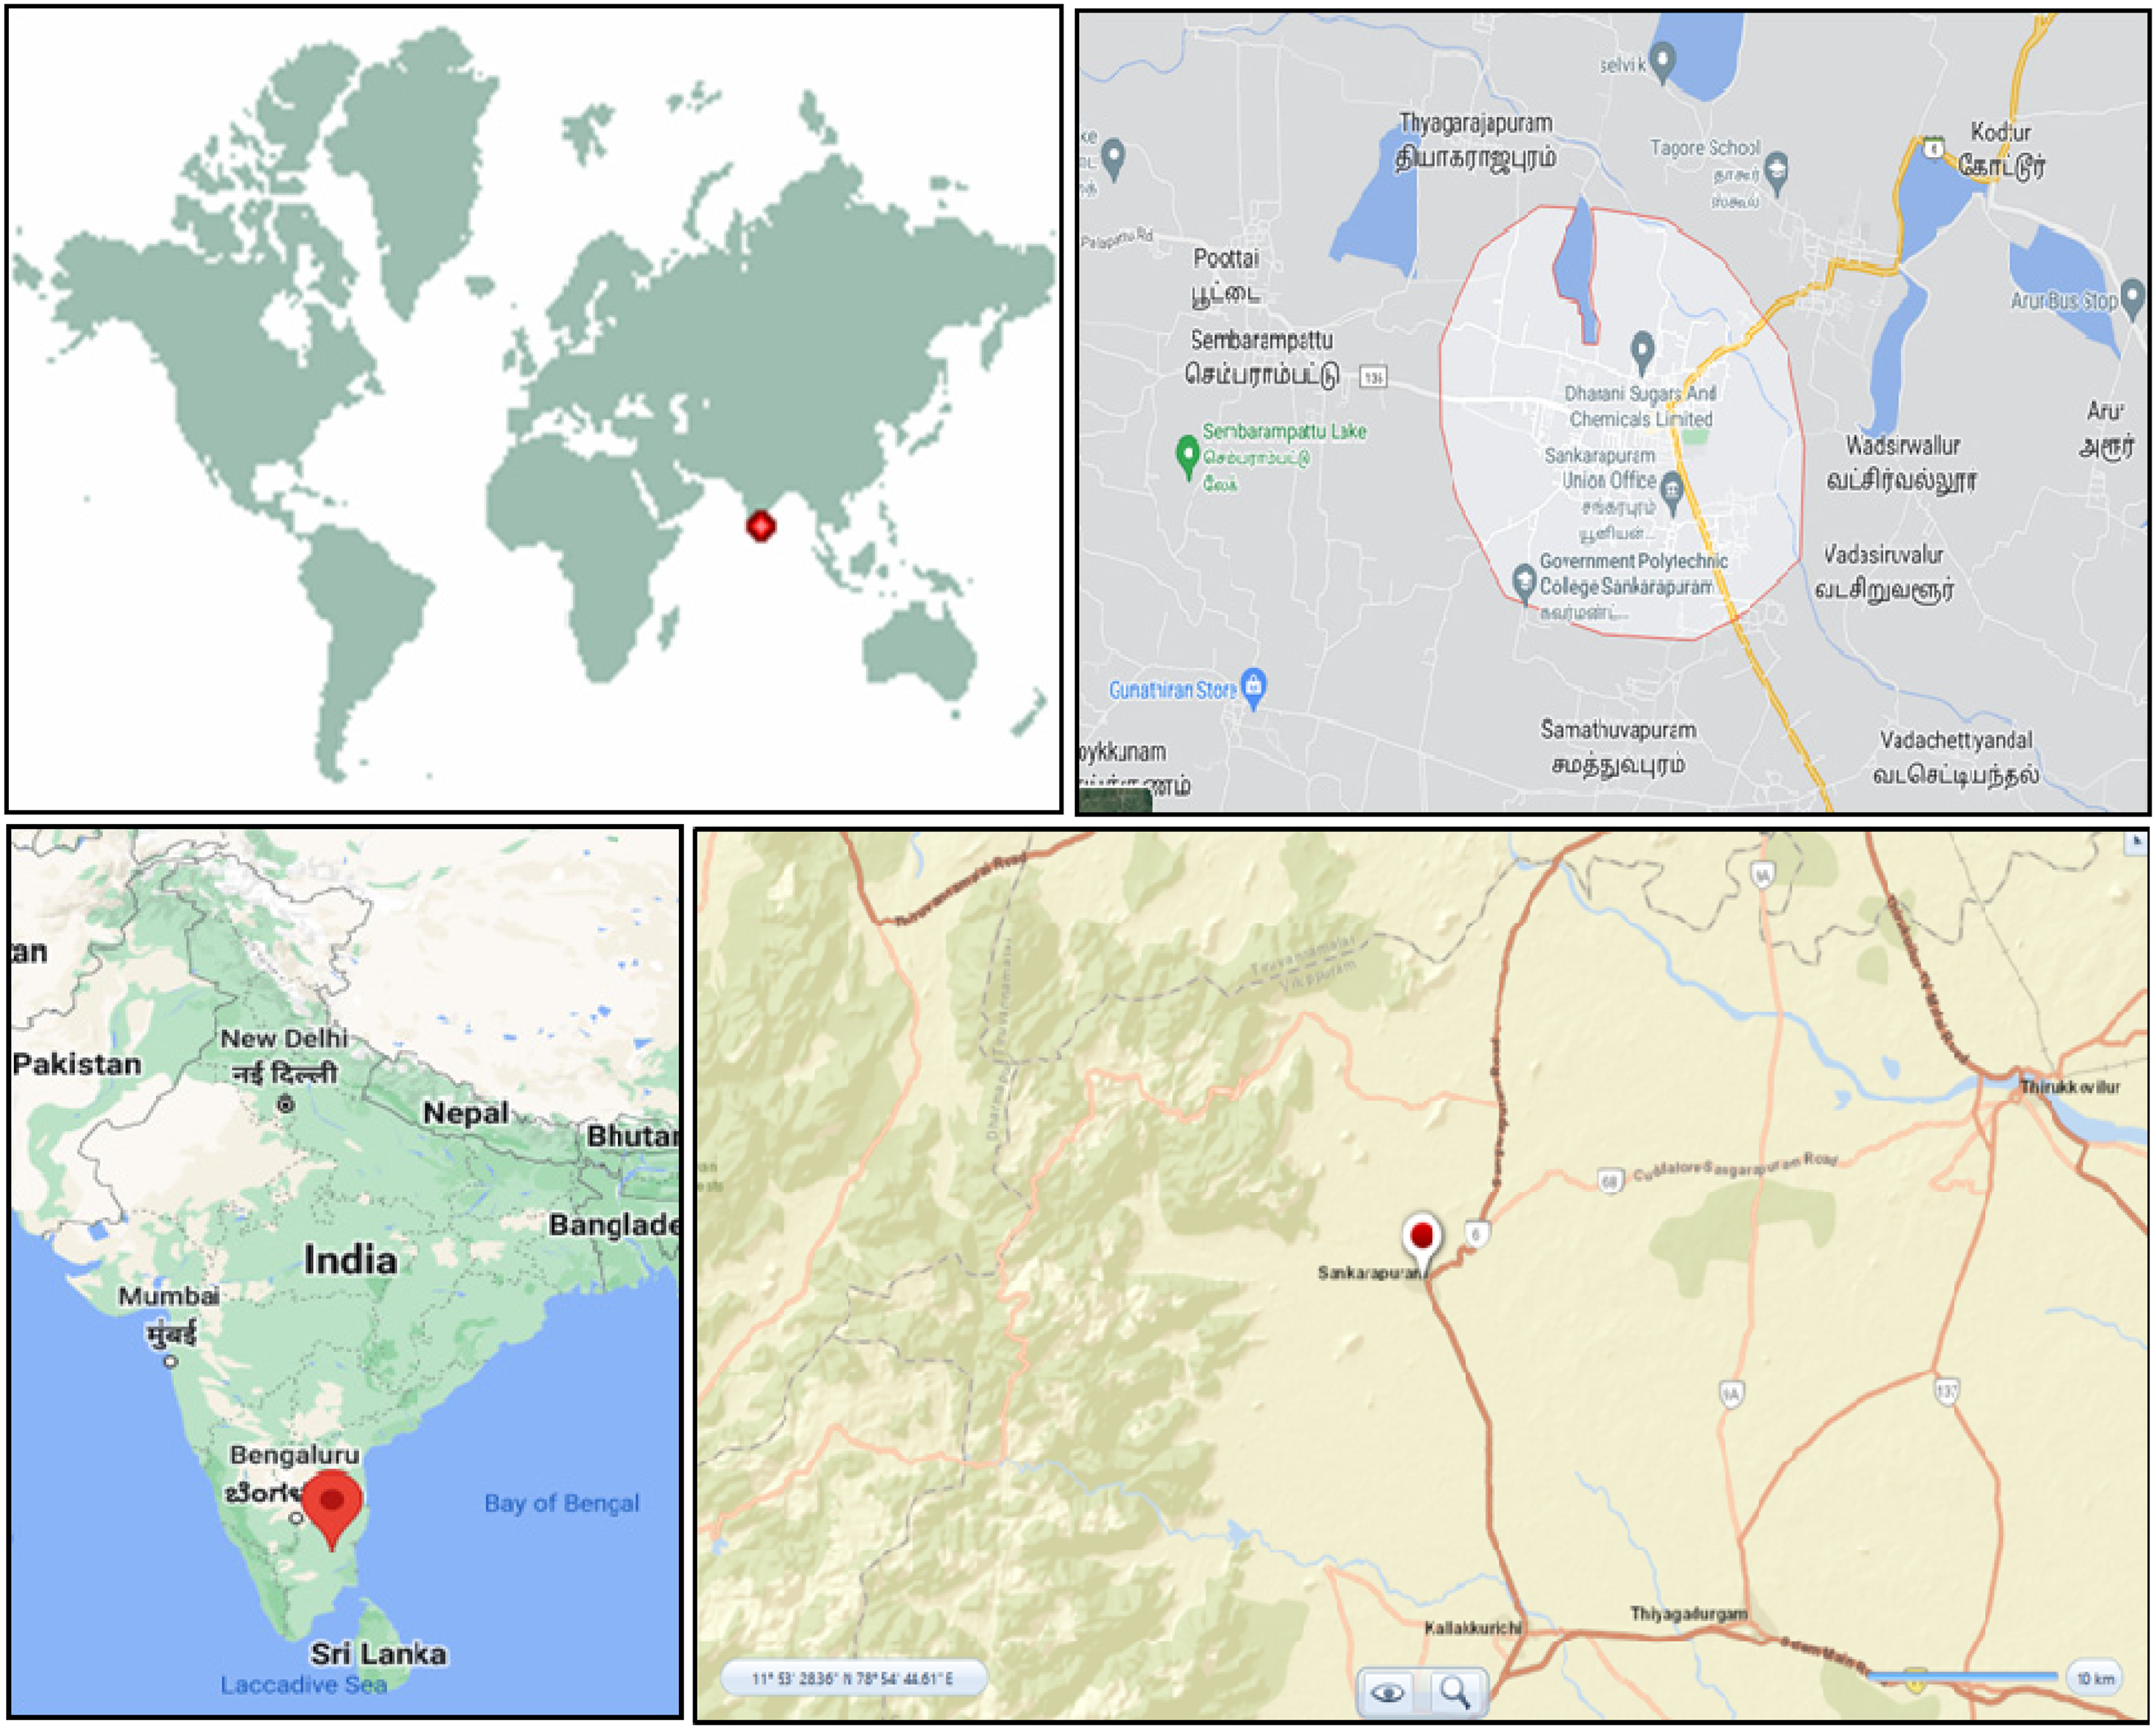
Geographical location of selected site.
Estimation of load demand
In this study, the estimated load demand was sectionalized, under five categories named load demand for GTR primary schools, GTR middle schools, GTR high school, GTR boys’ hostel, and GTR girls’ hostel. Six GTR primary schools located in Kannur, Thumbarampattu, Serappattu, Pappathimoolai, Moolakkadu, and Perumbur, reported the total power of 6.539 kW/day and consumption of 56.708 kWh. Four GTR middle schools located in Pacheri, Arasambattu, Sankarapuram and Kilakkadu, recorded the total power of 6.076 kW/day and consumption of 52.257 kWh. One GTR high school located in Moolakadu registered the total power of 2.655 kW/day and consumption of 20.7 kWh. Finally, two GTR hostels reported the total power of 36.86 kW/day and consumption of 188.835 kWh. The total power and energy consumption of the proposed load study were 52.13 kW/day and 318.5 kWh correspondingly. The total power load consists of light and power loads. The light load is related to fluorescent lamps, CFLs, incandescent lamps, table fans, ceiling fans, radios, computers, printers, LED televisions, cable connection for TV, surveillance cameras while the power load is related to washing machines, heaters, water purifiers, water pumps, mixer grinders and etc are used in schools and hostels. The energy demand for school and hostel is presented in Table 2. The daily load profile and monthly average load profile, based on baseline data, are shown in Figures 4 and 5, respectively.
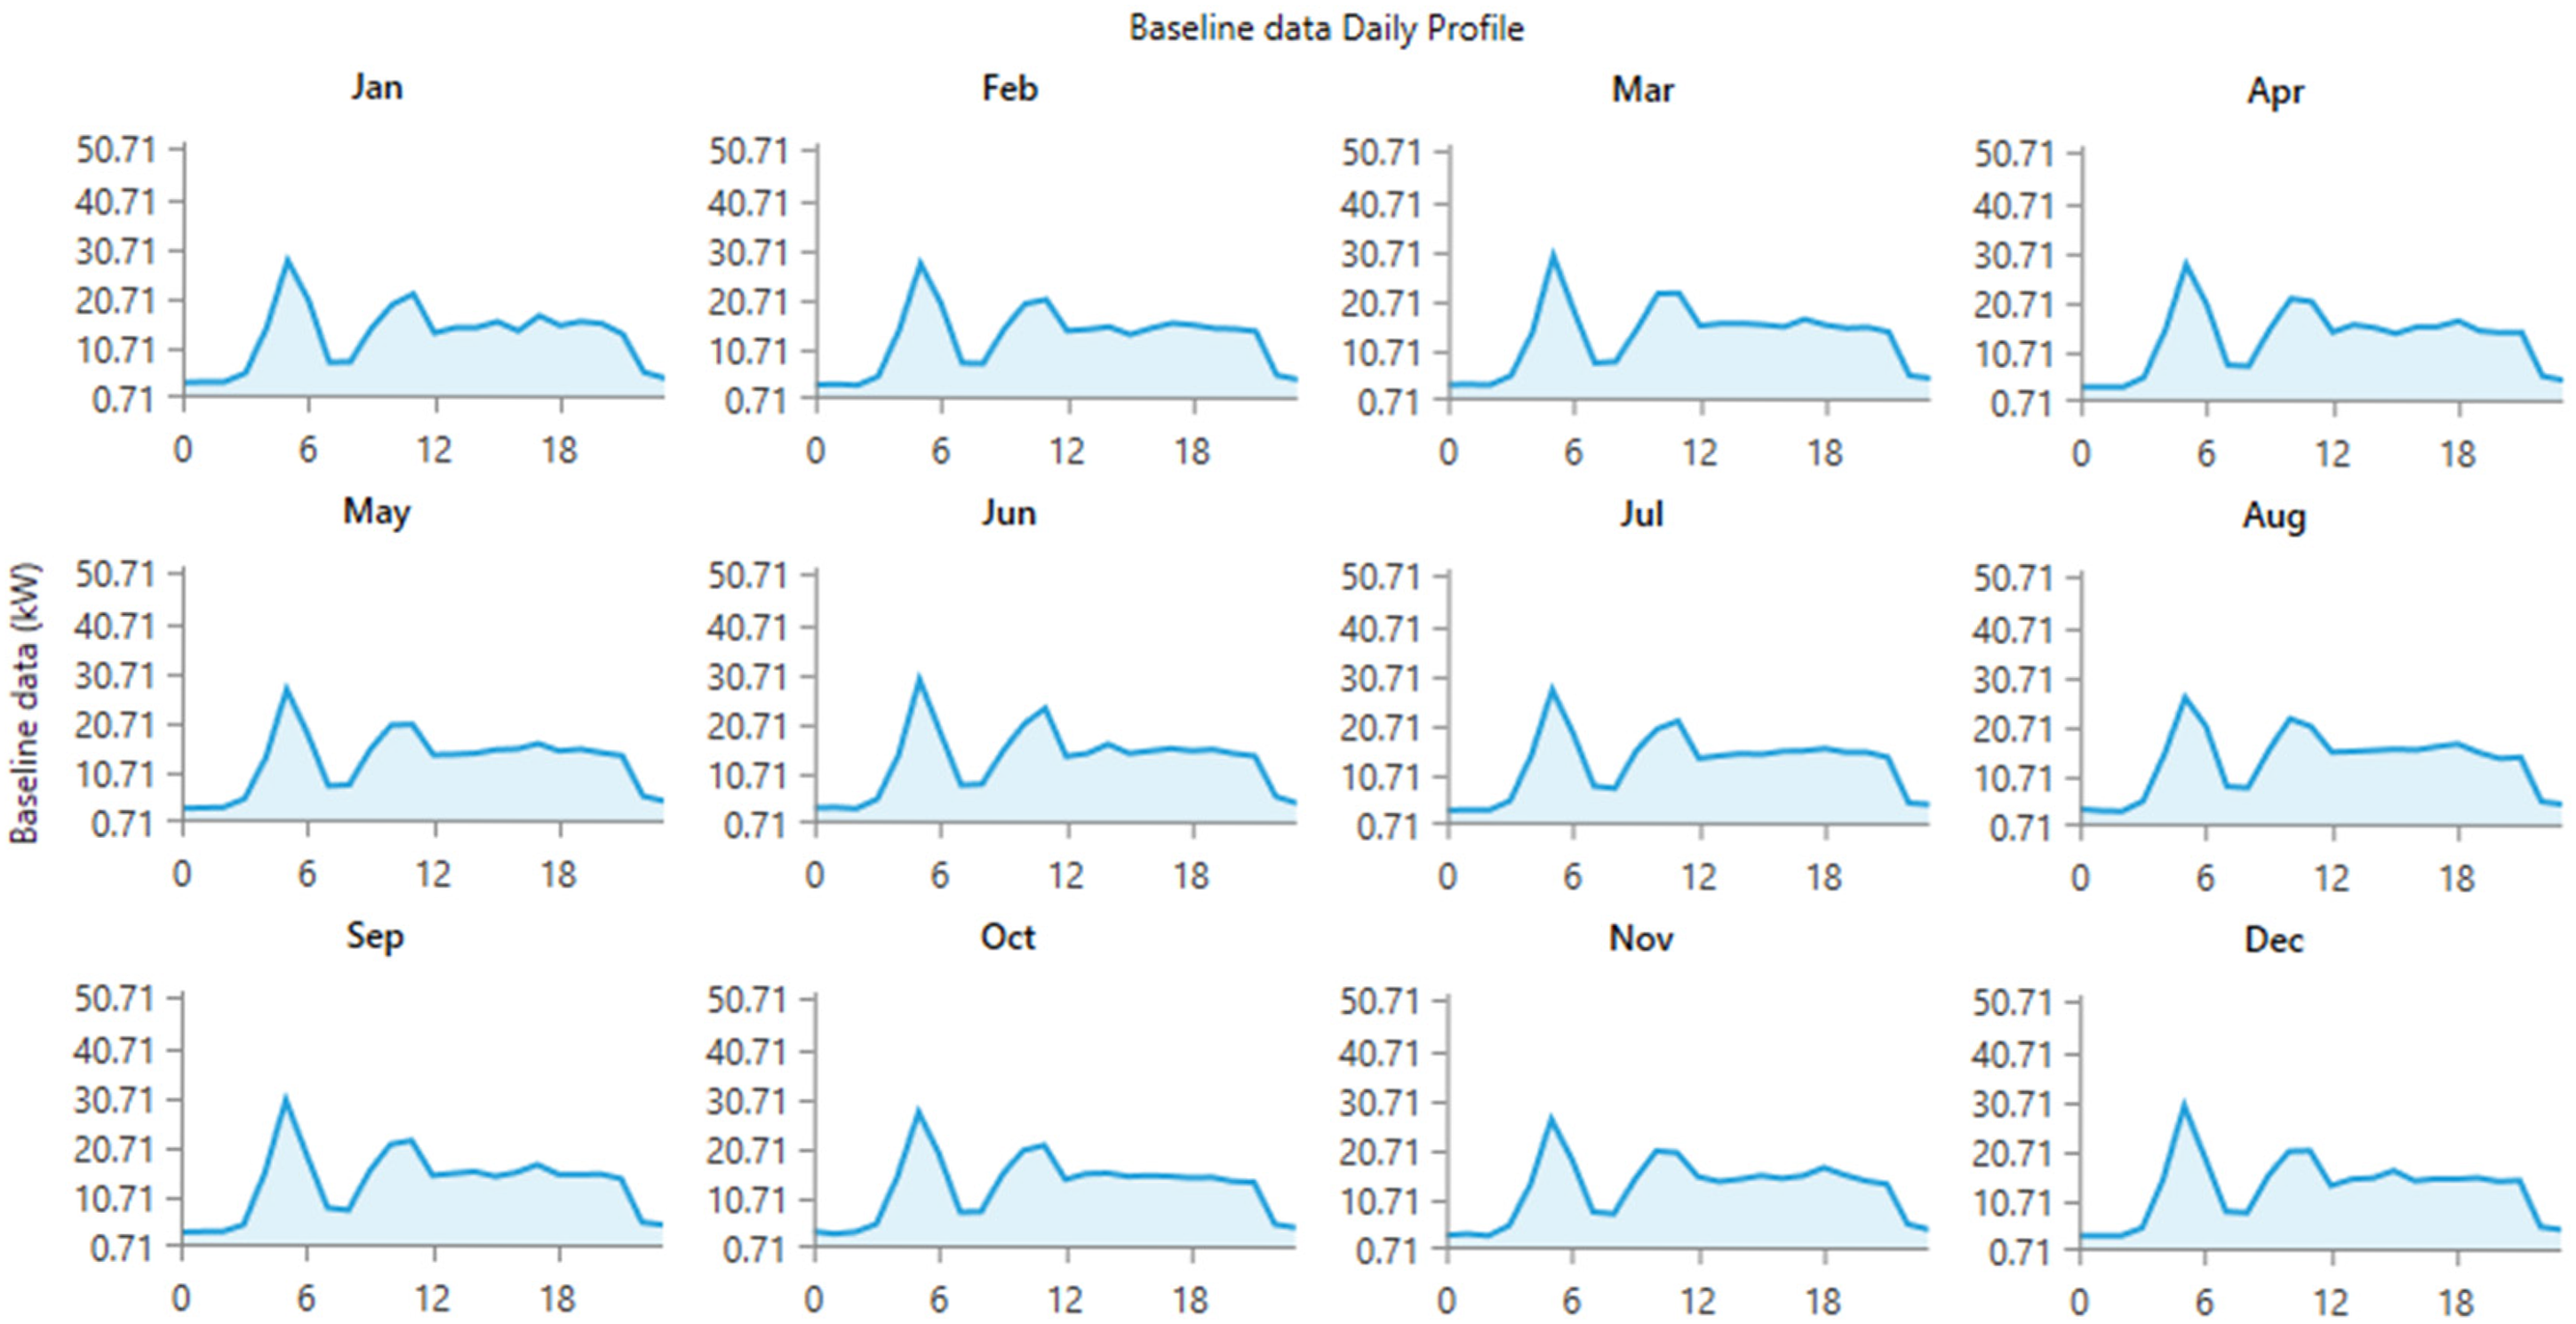
Daily load profile based on baseline data.
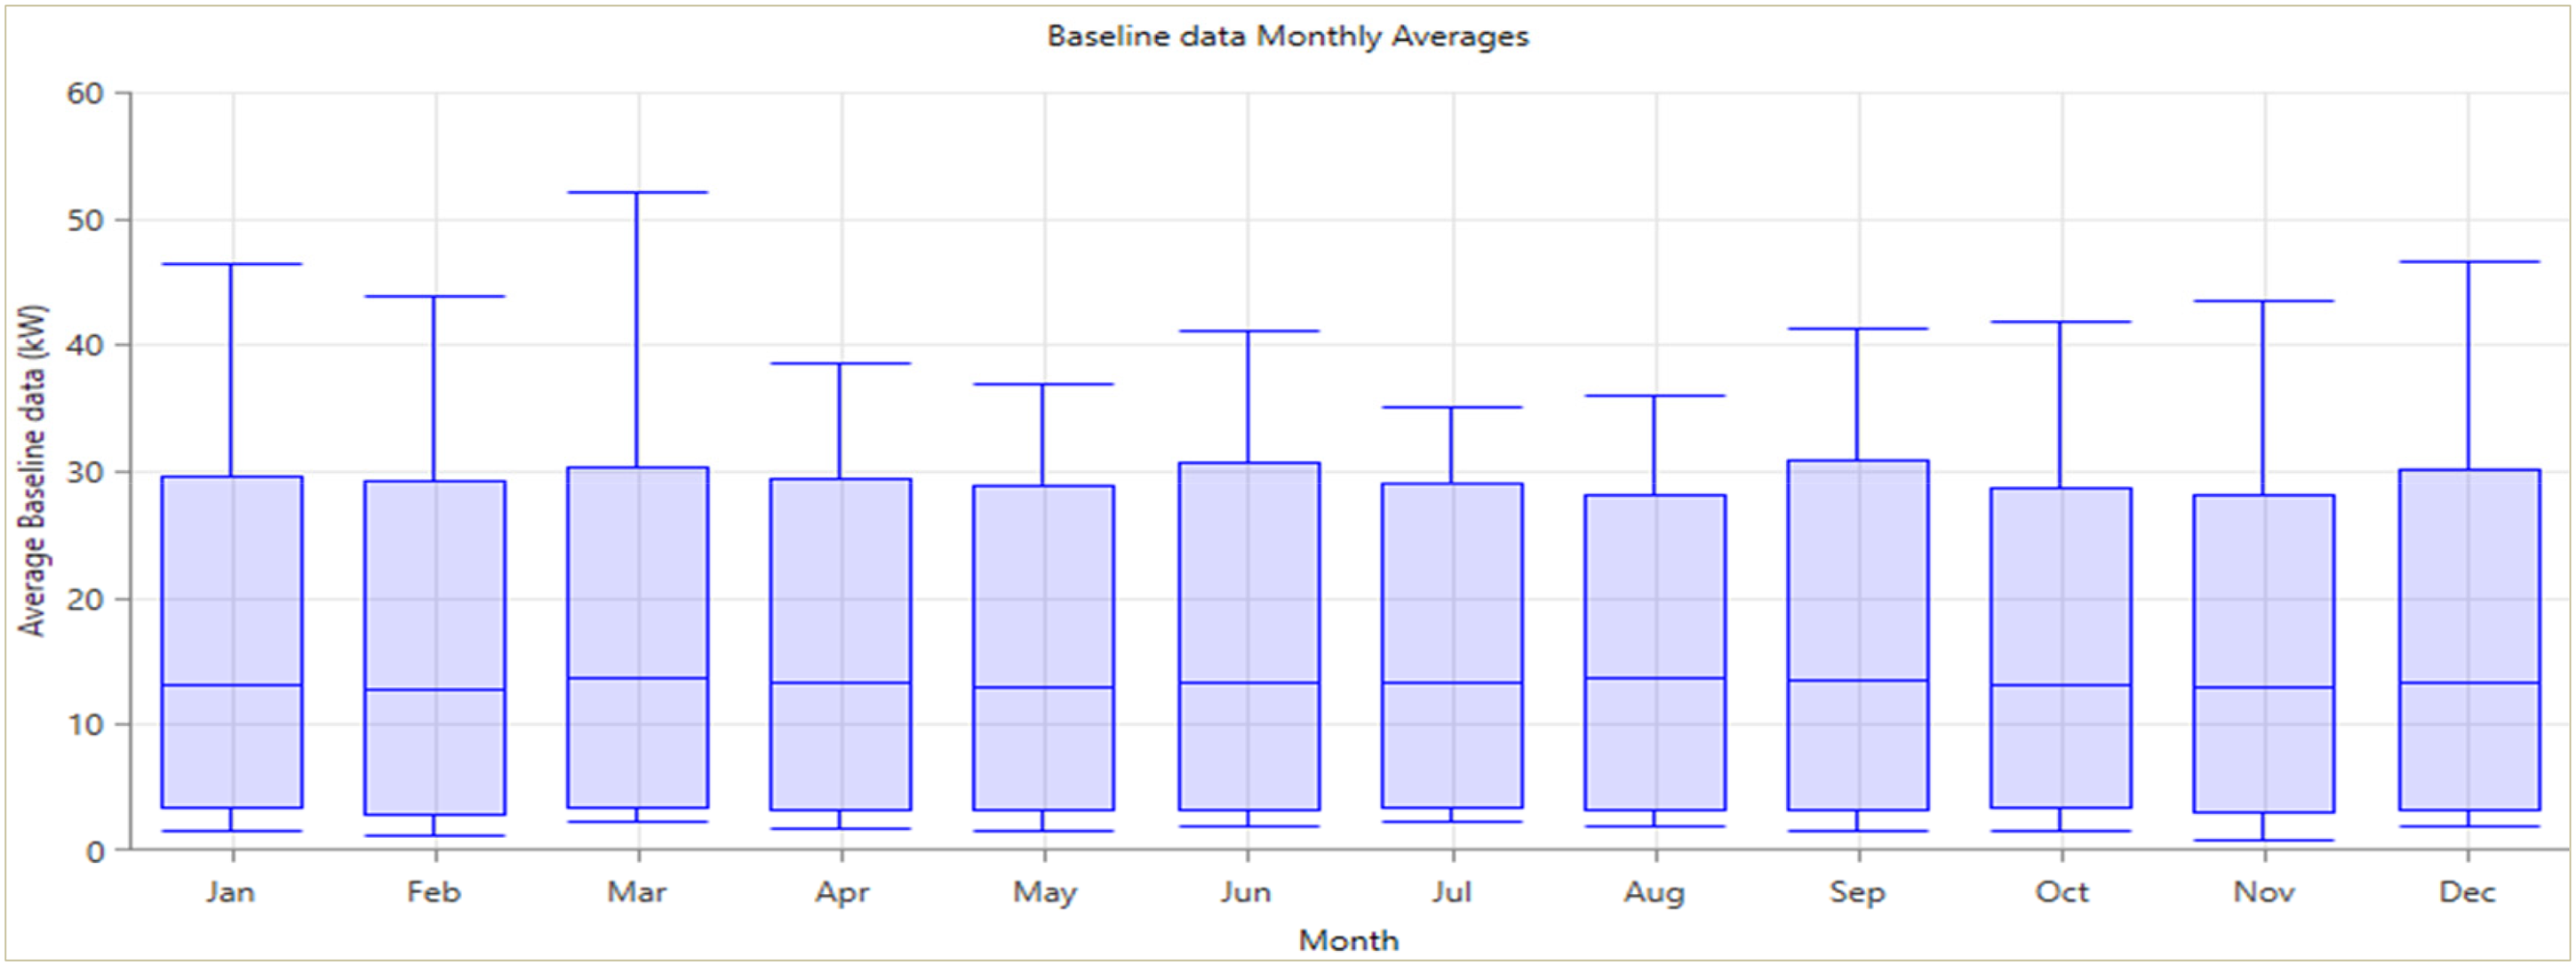
Monthly average load based on baseline data.
Net power and energy consumption details of GTR schools and hostels in Sankarapuram area.
Solar and wind resources
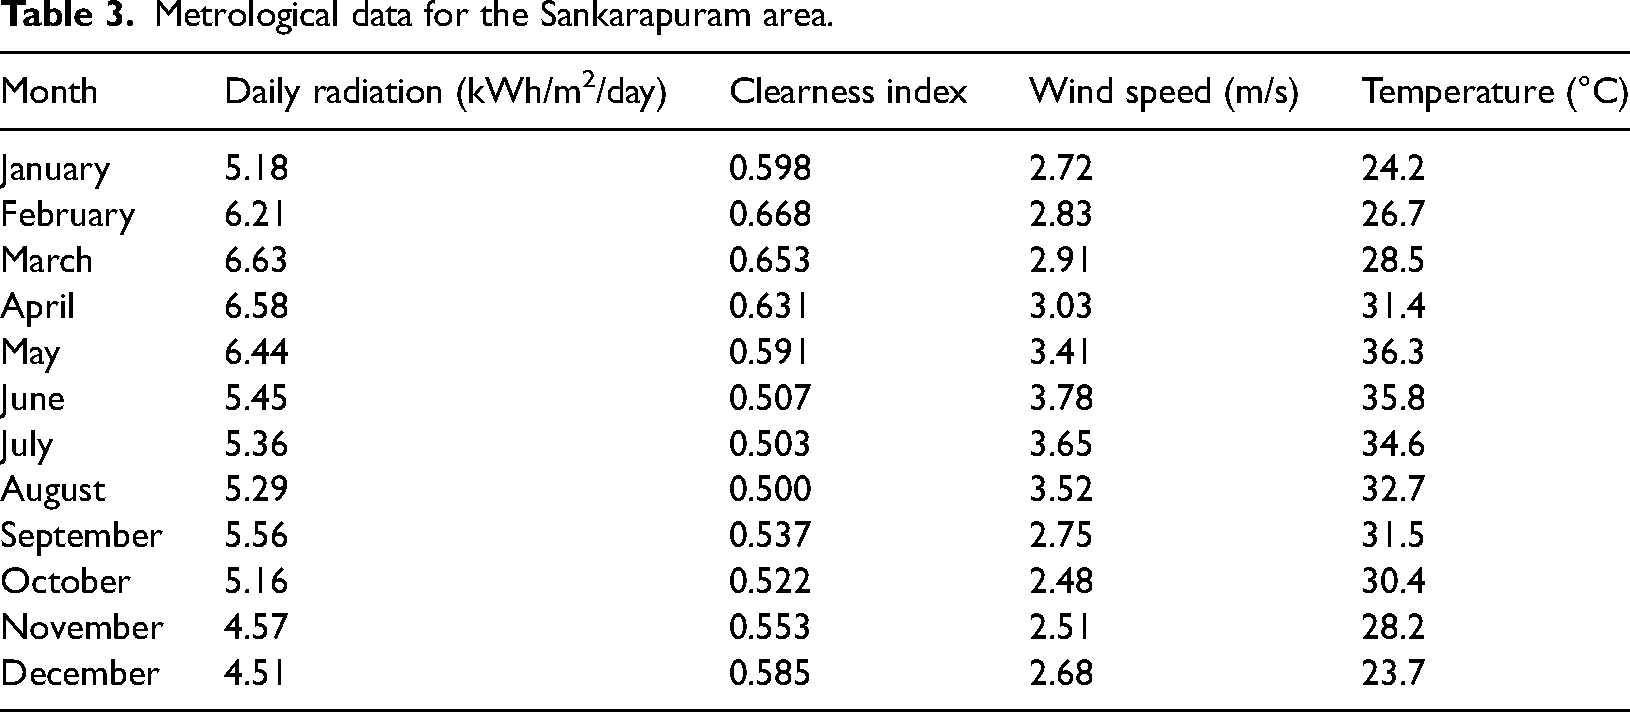
The average solar irradiation is 5.578 kWh/m2/day and the average clearness index is 0.5706 for the area of study. The average wind speed and temperature are 3.022 m/s and 30.33°C respectively. The meteorological data, for solar irradiation and clearness index, were downloaded from National Renewable Energy Lab database and the temperature and wind speed values were downloaded from NASA Surface Meteorology and Solar Energy database, within the HOMER Pro software tool. The details of monthly meteorological parameters are displayed in Table 3.
Metrological data for the Sankarapuram area.
Component assessments
Solar PV (SPV)
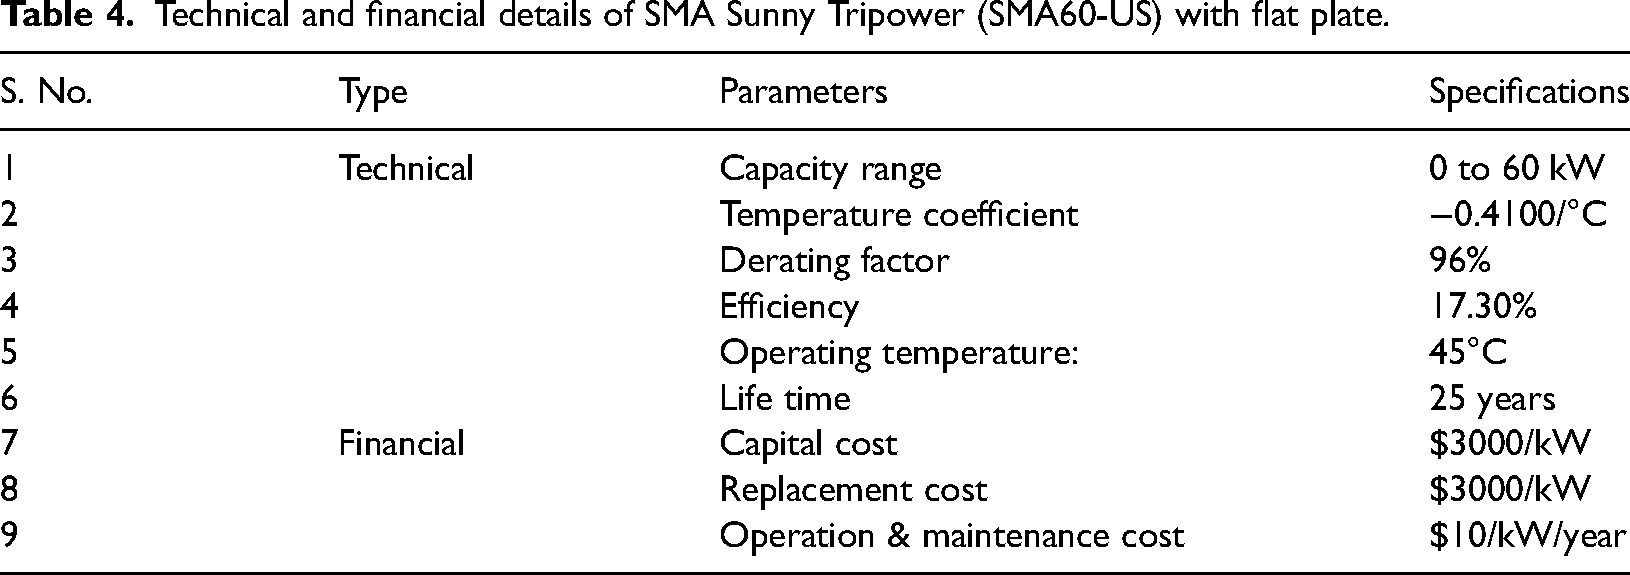
The SMA Sunny Tripower (SMA60) flat plate type Generic PV module, with the capacity ranging from 0 to 60 kW was chosen as the solar PV resource. The detailed technical and financial particulars are given in Table 4. This SPV was modeled on HOMER and the output of the PV array was evaluated by the following equation, in terms of temperature and solar radiation effect.
Technical and financial details of SMA Sunny Tripower (SMA60-US) with flat plate.
Wind turbine (WT)
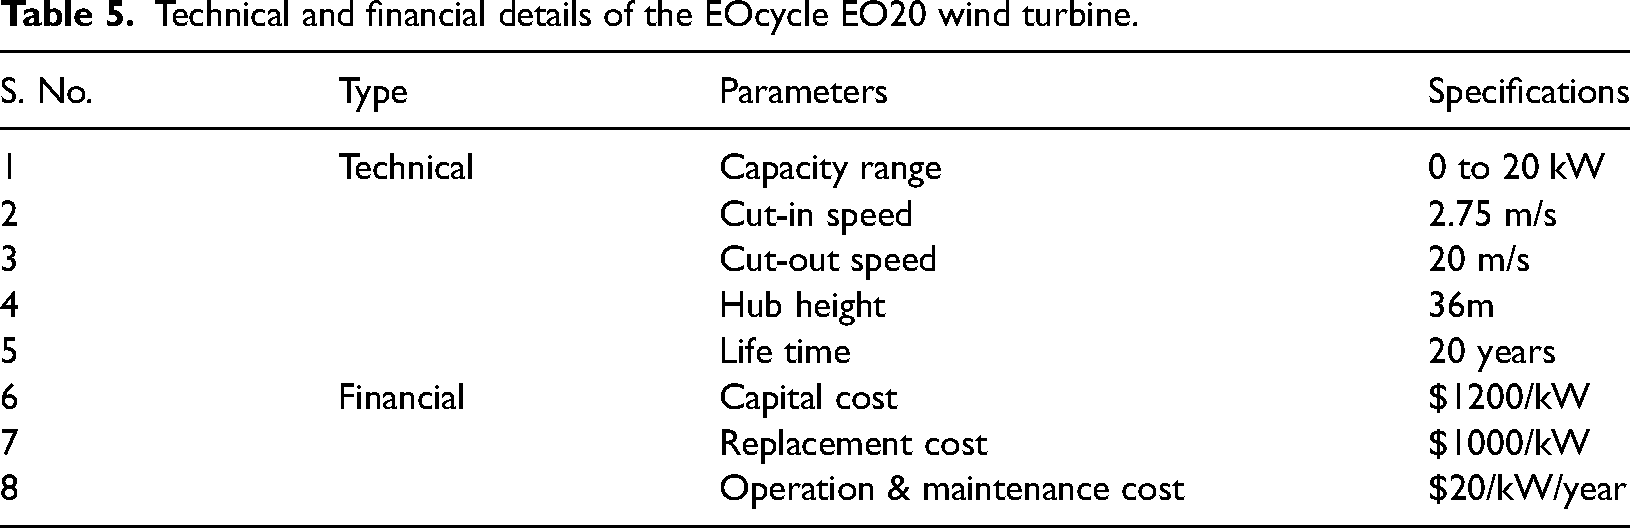
The EOcycle EO20 wind turbine having the capacity ranging from 0 to 20 kW was selected as the wind energy resource (modeled on HOMER). The technical and financial particulars are given in Table 5. The survival wind speed was around 52.8 m/s and the number of blades was 3. The power generated by wind turbine was assessed by the equation given below, in terms of swept area, performance coefficient and air density.
Technical and financial details of the EOcycle EO20 wind turbine.
Diesel generator (DG)
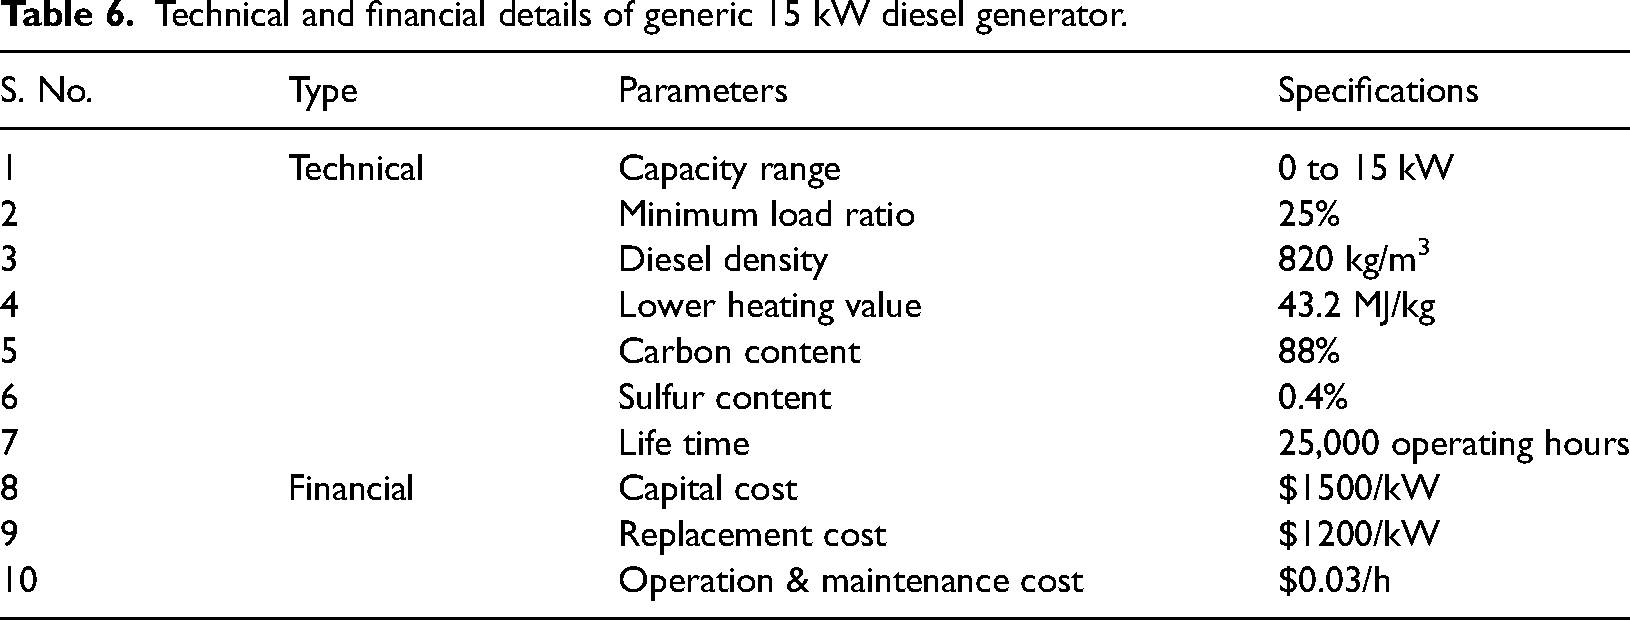
When the peak demand of load was not met by HRES or battery storage, the diesel generator could be used as a supplementary power production resource. The Generic 15 kW diesel generator (modeled on HOMER) was selected as the backup power-generating unit, having the carbon content percentage and density at 88% and 820 kg/m3, respectively, with the minimum load ratio of 25%. The technical and financial particulars are presented in Table 6. The fuel utilization of diesel generator can be formulated as:
Technical and financial details of generic 15 kW diesel generator.
Converter system (CS)
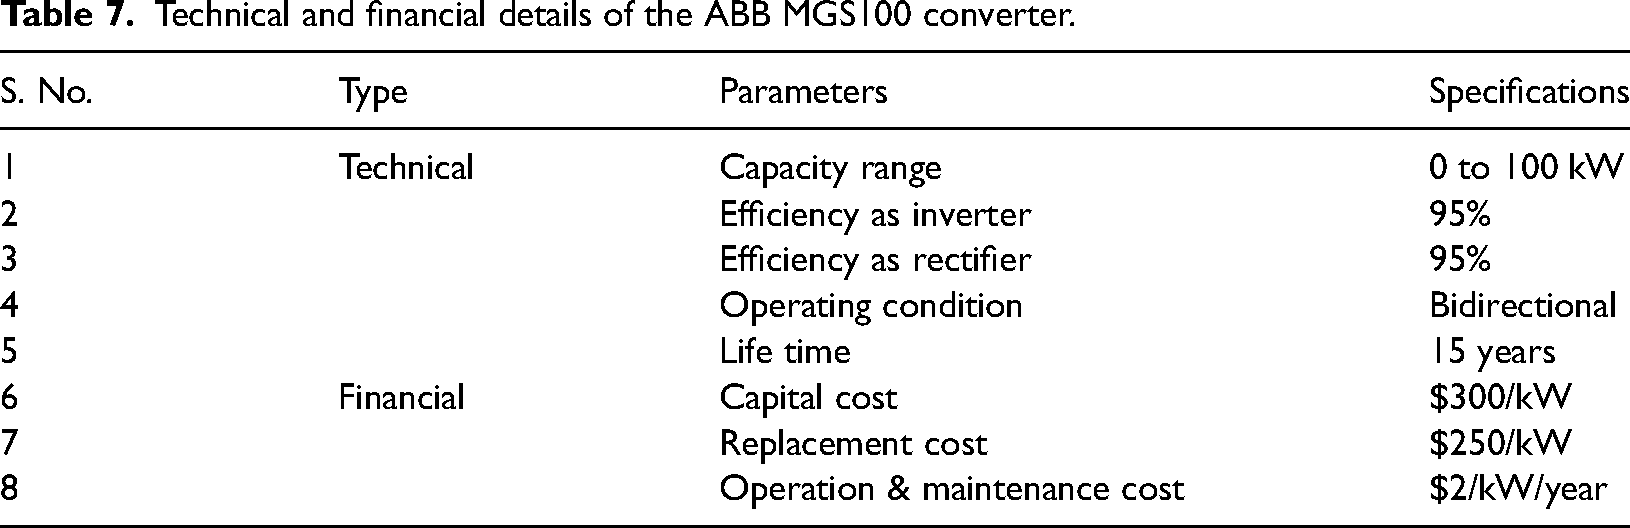
The converter is a necessary source to convert the DC from SPV and battery storage to AC, for meeting electric loads. In this study, ABB MGS 100, with 100 kW of rated capacity was selected as the bi-directional converter source. It was also designed on HOMER and controlled the AC frequency and voltage, with the regulation of DC bus. The scientific and monetary particulars are listed in Table 7.
Technical and financial details of the ABB MGS100 converter.
Energy storage system (ESS)
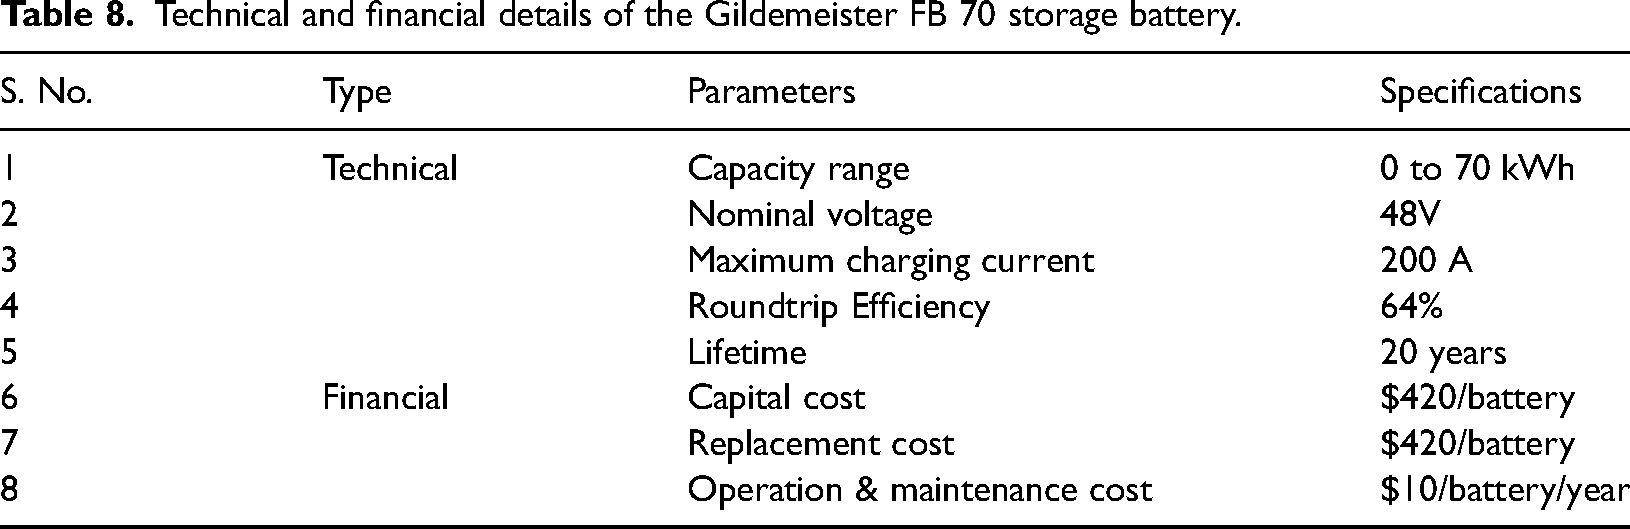
The Gildemeister FB70 vanadium redox flow energy storage device (modeled on HOMER) having the nominal capacity of 70 kWh was chosen for this study. The ampere-hour capacity of this device is 1460 Ah and the lifetime throughout is around 876,000 kWh. The detailed methodical and economic parameters are displayed in Table 8. The obtainable energy capacity, with respect to time t and SOC of the battery, is expressed by the following:

Technical and financial details of the Gildemeister FB 70 storage battery.
Methodology of the work
The methodology employed in this study was conducted using the HOMER Pro Micro-grid Analysis tool. First, the social and meteorological profiles of the selected site, Sankarapuram in Tamil Nadu, were analyzed to assess the renewable energy potential. Load demand was estimated by categorizing it into five segments, including different educational institutions and hostels, which totaled a power demand of 52.13 kW/day and energy consumption of 318.5 kWh. The design and simulation of the proposed HRES were then carried out under various configurations of solar, wind, diesel, and storage systems, with the goal of finding the most cost-effective and technically viable solution. The analysis was conducted under three different loading scenarios: normal load, step load, and full renewable load. The HOMER software was used to optimize the configurations based on several monetary, technical, emission, and fuel-related parameters. Various sensitivity and payback analyses were also incorporated to assess the robustness of the proposed HRES design
Proposed MTEF analysis of the HRES
Configuration of the HRES
The most favorable sizing and design of HRES was performed, along with the related HOMER parameters. There are three loading configurations, which were examined in this work, under four different cases. The aim of this work was to analyze the effect of monetary, technical, emission parameters on different loading conditions and analyze the social parameters, based on this study. These three different configurations were formed under Scenarios A, B and C. The description of these scenarios is given below:
Scenario A: Normal loading (100% of peak load, with the power and energy consumption at 52.13 KW per day and 318.5 kWh, respectively). Scenario B: Step loading (110% of peak load, with the power and energy consumption at 57.34 kW per day and 350.34 kWh, respectively). Scenario C: Normal loading, with full renewable sources (loading under Scenario A with 100% of renewable energy sources).
Each scenario was analyzed, with four different cases, based on the tracking of SPV system, used this study. Generally, the PV panels are naturally fixed at a permanent orientation and designed to track the sun in order to increase the occurrence of the solar irradiation. The description of these cases is presented below, based on the solar tracking system, specified in HOMER.
Devise parameters
There were four domains of analysis, performed by the proposed optimal design of HRES system, through HOMER. Four key parameters like NPC, COE, OC, and FC, were examined in the monetary domain. The technical area was framed with five parameters like the EP, EE, UEL, CS, and GQ. The emission province comprising six parameters like CO2, CO, UH, PM, SO2, and NO X was analyzed. The fuel domain was examined with five parameters like FC, OH, SFC, MEE, and NS. In addition, the sensitivity, payback, battery and converter parameters, JCF, and REF were also considered for this analysis.
Evaluation of decisive factor
The entire optimization process of proposed HRES was performed, with 20 parameters, sectionalized by four different domains and some other secondary parameters. The key parameters are discussed below.
Net present cost (NPC)
The NPC is an imperative monetary parameter, for the economic analysis of the system. It is the summation of capital, replacement, operation and maintenance, fuel and salvage costs of each component. The NPC is also defined as the ratio between total annual cost (in $/year) and capital recovery factor and t is derived as follows:
Here, 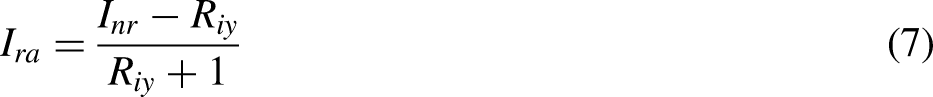
The capital recovery factor is used to compute the yearly current cash flows in years (n) and the real rate of interest (
Cost of energy (COE)
The COE is defined as the ratio between the annualized system cost and the yearly energy consumption and it is expressed by:
The summation of capital cost, yearly operating cost and replacement cost is known as annualized system cost.
Operating cost (OC)
The OC is calculated by the difference between overall annualized costs (
Fuel cost
This input variable is used to calculate the fuel cost of diesel generator. Fuel price is considered as dollars per liter. Normally, this variable is preferred to perform sensitivity analysis, based on future fuel price.
Excess electricity fraction (EEF)
The EEF (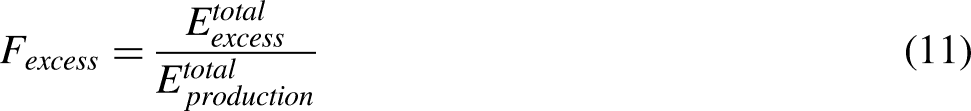
Unmet electric load (UEL)
The UEL is deemed to be the ratio between the non-delivered annual electric load (
Capacity shortage
It is the deficit in capacity that happens between the necessary working capacity and the real working capacity of the system.
Emission pollutants
Generally, emissions originate from the electricity production by generators and thermal energy production by boilers. In this work, the emission was studied by the operation of diesel generator. Six types of pollutants were analyzed in this work—CO2 (nontoxic gas), CO (poisonous gas), UH (hydrocarbons with incomplete combustion), PM (smoke mixture), SO2 (corrosive gas) and NO X (nitrogen compounds).
Specific fuel consumption
The SFC is defined as the ratio between total fuel consumption by a generator in a year (liter/year) and the total electric production by a generator in a year (kWh/year) and it is obtained by: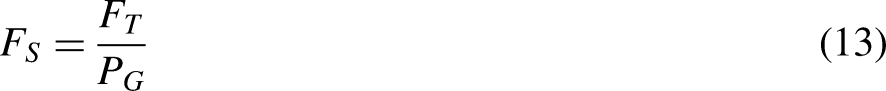
Sensitivity analysis
Sensitivity analysis is based on the usage of sensitivity variable. An input variable can be specified as a sensitive variable, which has multiple specified values. It is a single or two dimensional analysis and normally, sensitivity analysis, through HOMER, is based on two or more dimensions.
Present worth
The distinction between the NPC of the base case system and the present system is called present worth. Monetary saving by the current system, compared to the base case system, is indicated by the positive sign over the lifetime of a project.
Annual worth
The multiplication between present worth and capital recovery factor (shown in equation (8)) is called annual worth.
Internal rate of return (IRR)
IRR is metric, used in financial analysis, to estimate the profitability of potential investments. IRR is a discount rate that makes the net present value of all cash flows equal to zero in a discounted cash flow analysis.
Simple payback
Simple payback is the number of years when money saved after the project will cover the investment. The time of payback is to get well the difference in investment cost between the optimized and reference case systems.
Job creation factor
The JCF is an additional factor to create the workforce, required to operate the hybrid renewable system and it can be calculated by the following expression:
Renewable energy fraction (REF)
The REF means the power quantity generated by RES, contrasted with the entire power received from the system. It can be indicated by HOMER after simulation of every HRES design. It ensures the maximum usage of power from RES.
Results and discussion
The key objective of this study was based on monetary, technical, environmental and fuel analysis and assessed for sizing and optimization of standalone HRES. This section focuses on extensive analysis of various parameters, against four different criteria, under three configurable presented, depicted in Figure 6 and each scenario is explained with four different cases as discussed in section “Configuration of the HRES.” Additionally, four parameters like the sensitivity, payback, energy storage, and converter parameters were also analyzed. The entire study was optimized and simulated by HOMER Pro 3.11.2 Micro-grid Analysis tool platform. Optimal size of HRES sources was obtained, by a combination, which ranged from 50 to 59 kW of SPV, 2 to 5 kW of WT, 10 to 15 kW of DG, 43.1 to 63.2 kW of CS, and 29.7 to 56 kWh of ESS, through different scenarios and cases. The optimized results of all criteria are extensively discussed, in the subsequent sub-sections.
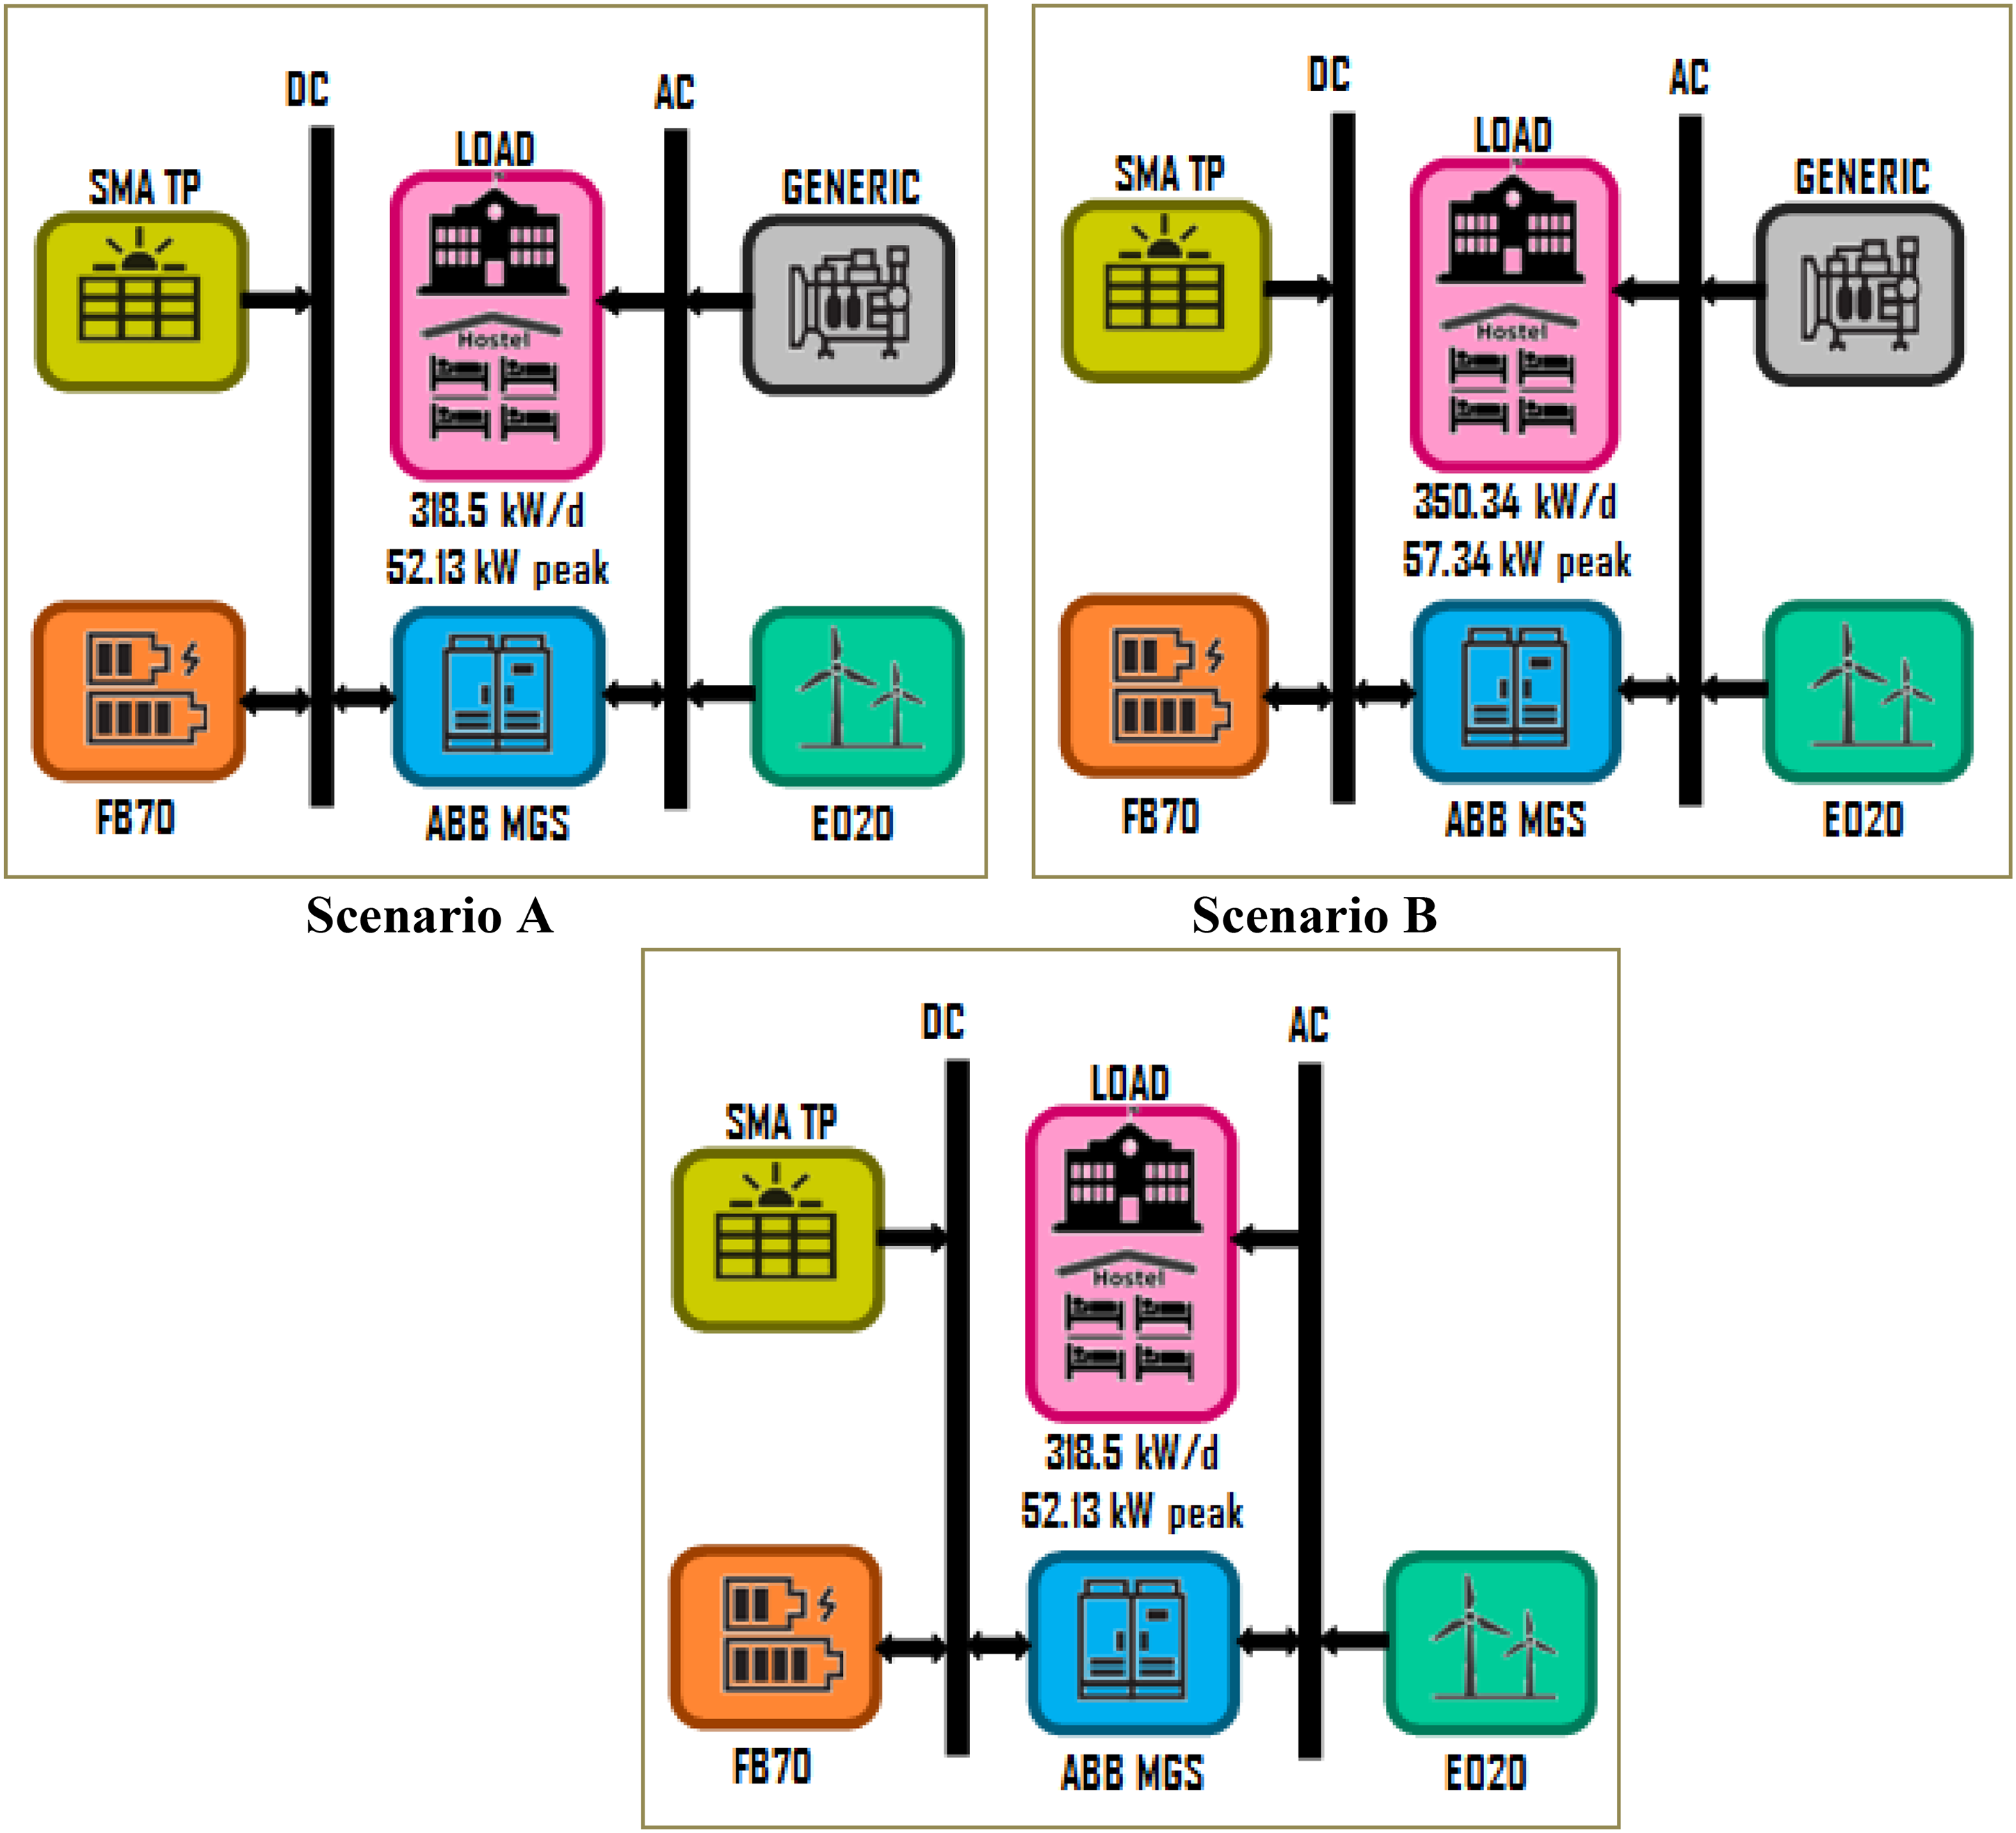
Schematic diagram for all scenarios.
Monetary analysis
The data used in this analysis was collected from Sankarapuram Zone, Tamil Nadu, India, where the study focuses on tribal residential schools and hostels that face challenges related to remote electrification. This location was selected due to the lack of reliable access to the electrical grid, making it an ideal context for evaluating the impact of hybrid renewable energy systems. The data collected includes energy consumption patterns, solar and wind energy generation, and environmental parameters such as temperature and humidity. The following section explains how this data was processed, analyzed, and used to evaluate the performance of the proposed system.
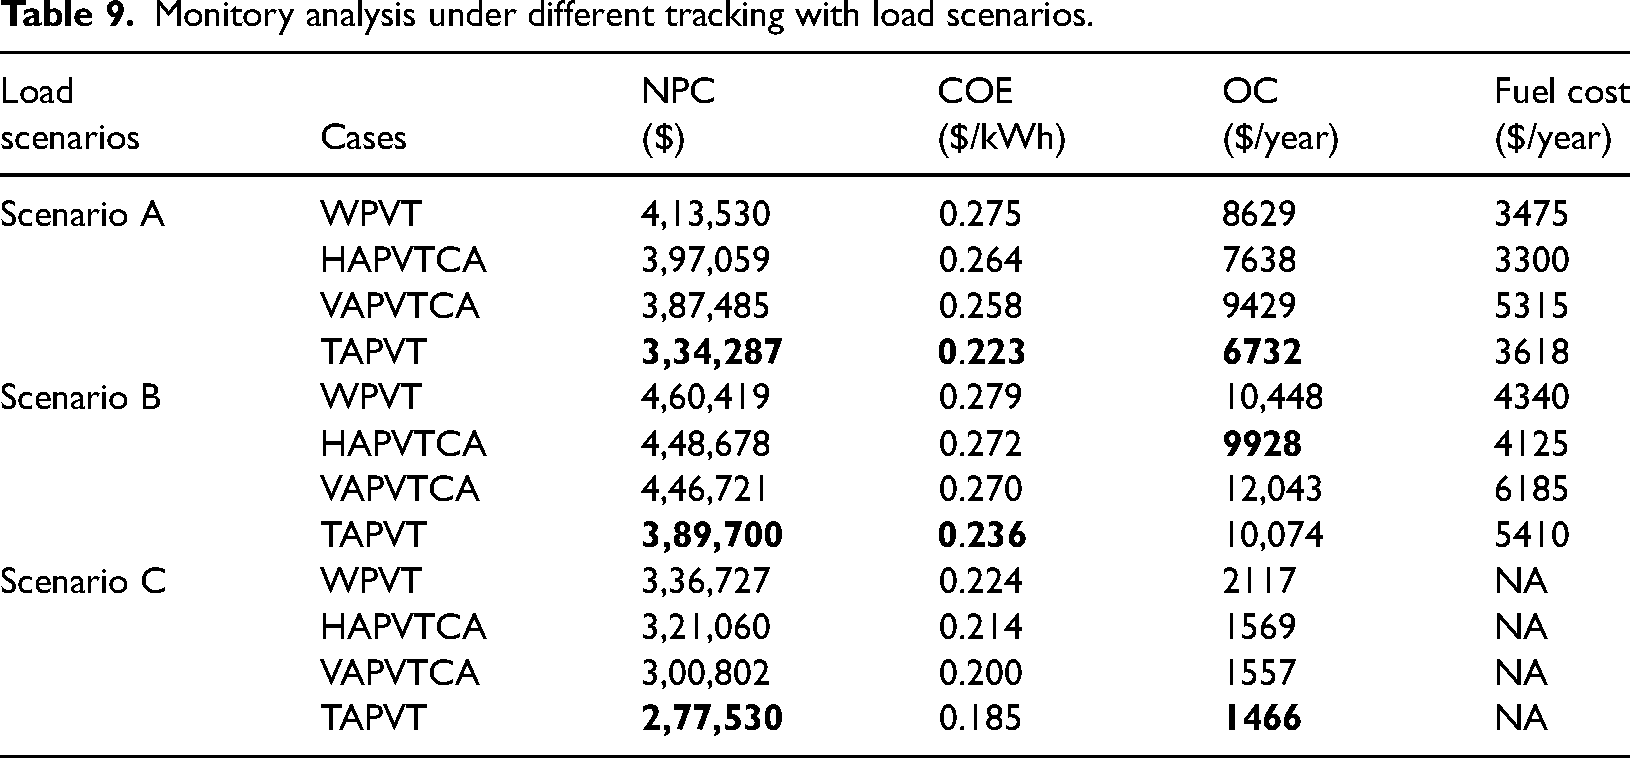
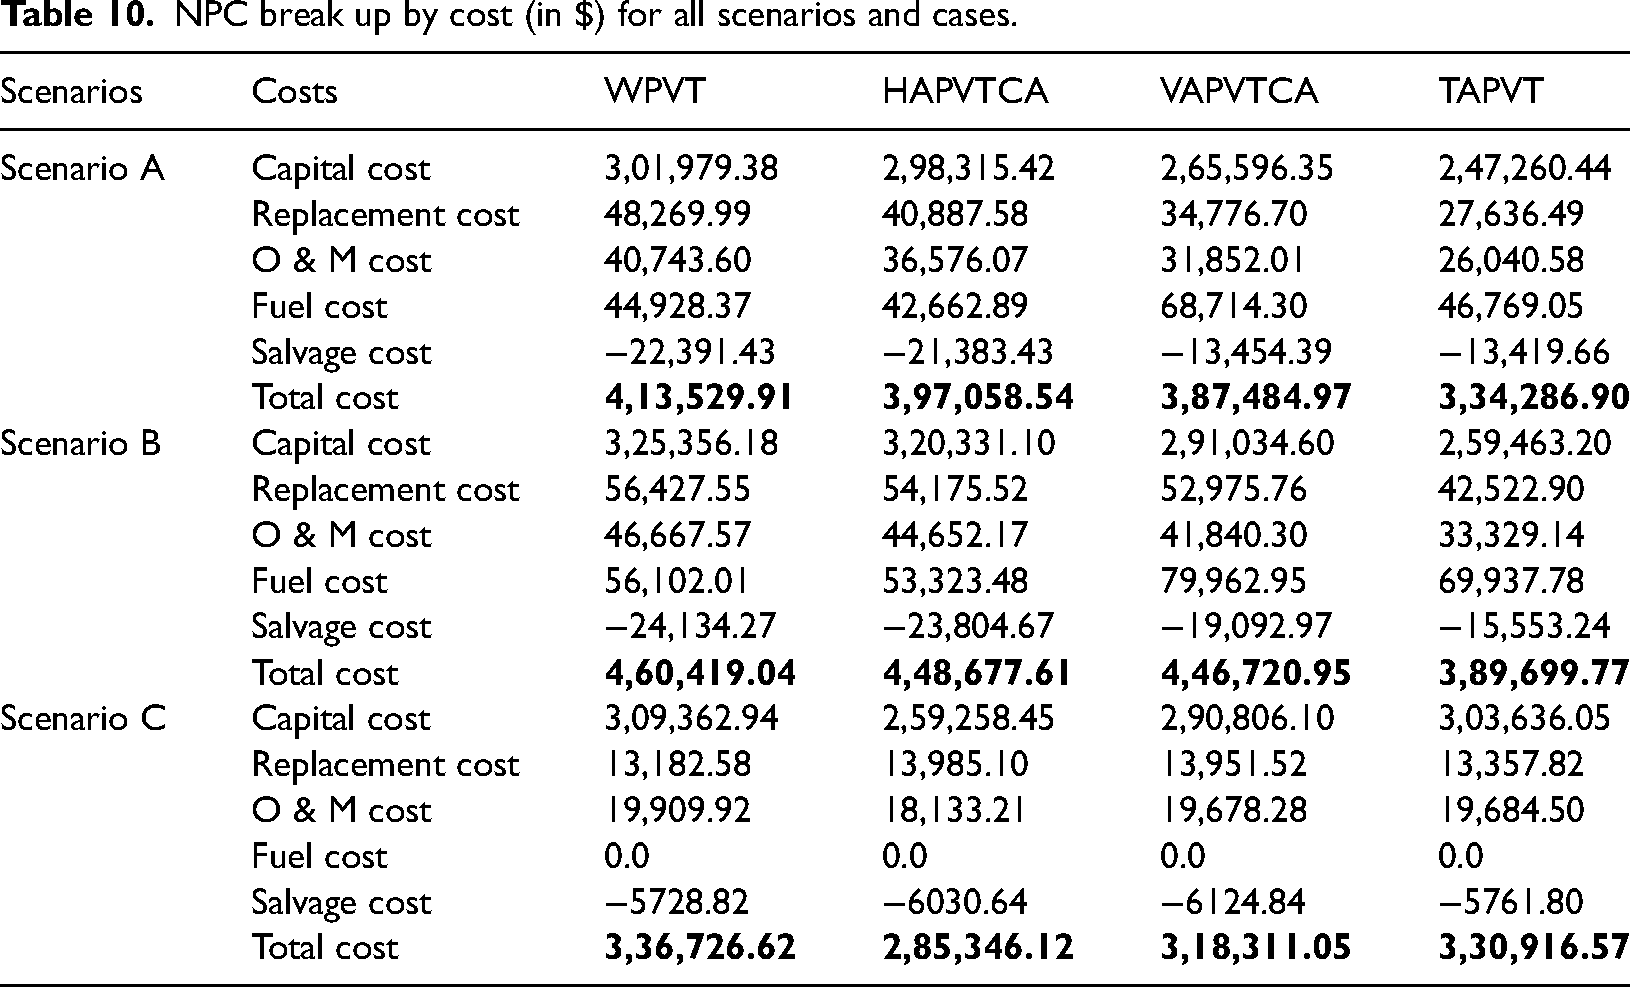
In this study, four major monitory parameters were taken into account like NPC, COE, OC, and FC. The fuel cost was taken as $1.14/L, which is the average Indian price per liter. The minimum and maximum optimized values of NPC were obtained as $413,530 and $334,287 in WPVT and TAPVT, respectively, under scenario A. Also, the corresponding COE values were recorded as $0.275 and $0.223/kWh respectively. The operating cost difference between VAPVTC and TAPVT in this scenario amounted to $2697 per year. The slight increase in the COE from $0.275/kWh in Scenario A to $0.279/kWh in Scenario B reflects the impact of the additional load, which increases the overall demand and reduces system efficiency. This change highlights the importance of optimizing load management to keep costs low and ensure system sustainability. While the cost increase is minimal, it emphasizes how variations in demand affect overall system economics.
Consequently, the least optimized fuel cost was $3300/year, recorded from the HAPVTCA. Moreover, the difference between highest and least fuel cost was obtained as $2015/year from VAPVTCA and HAPVTCA, respectively, and 37.91% of fuel cost reduction between was achieved.
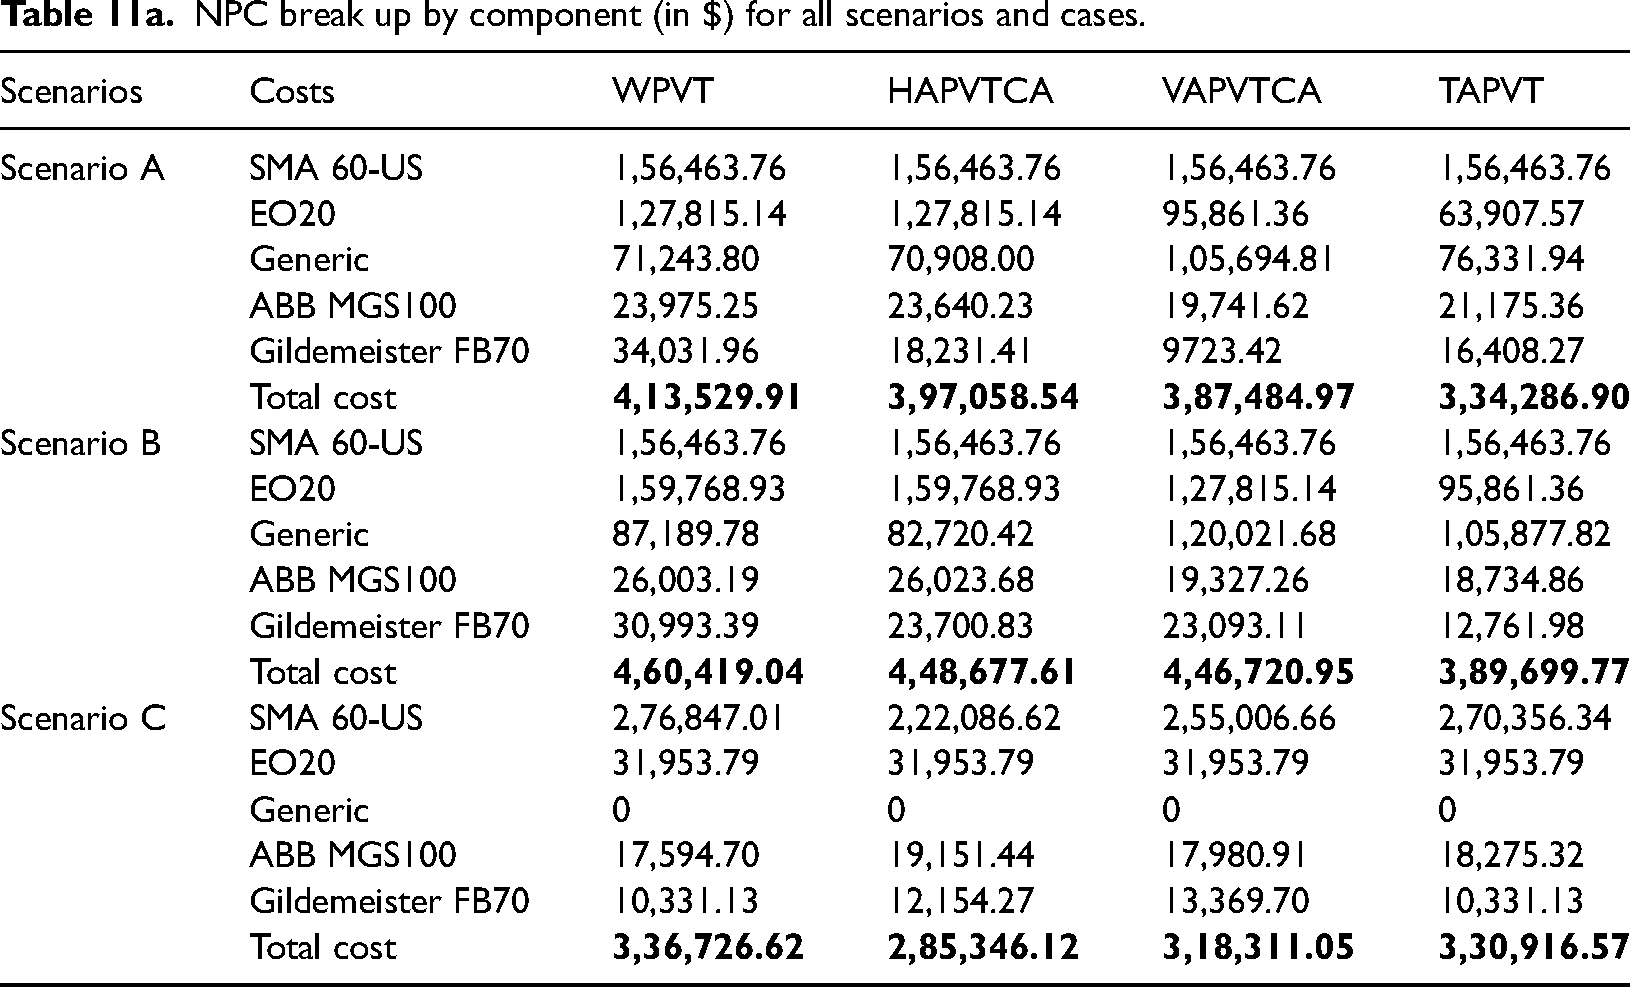
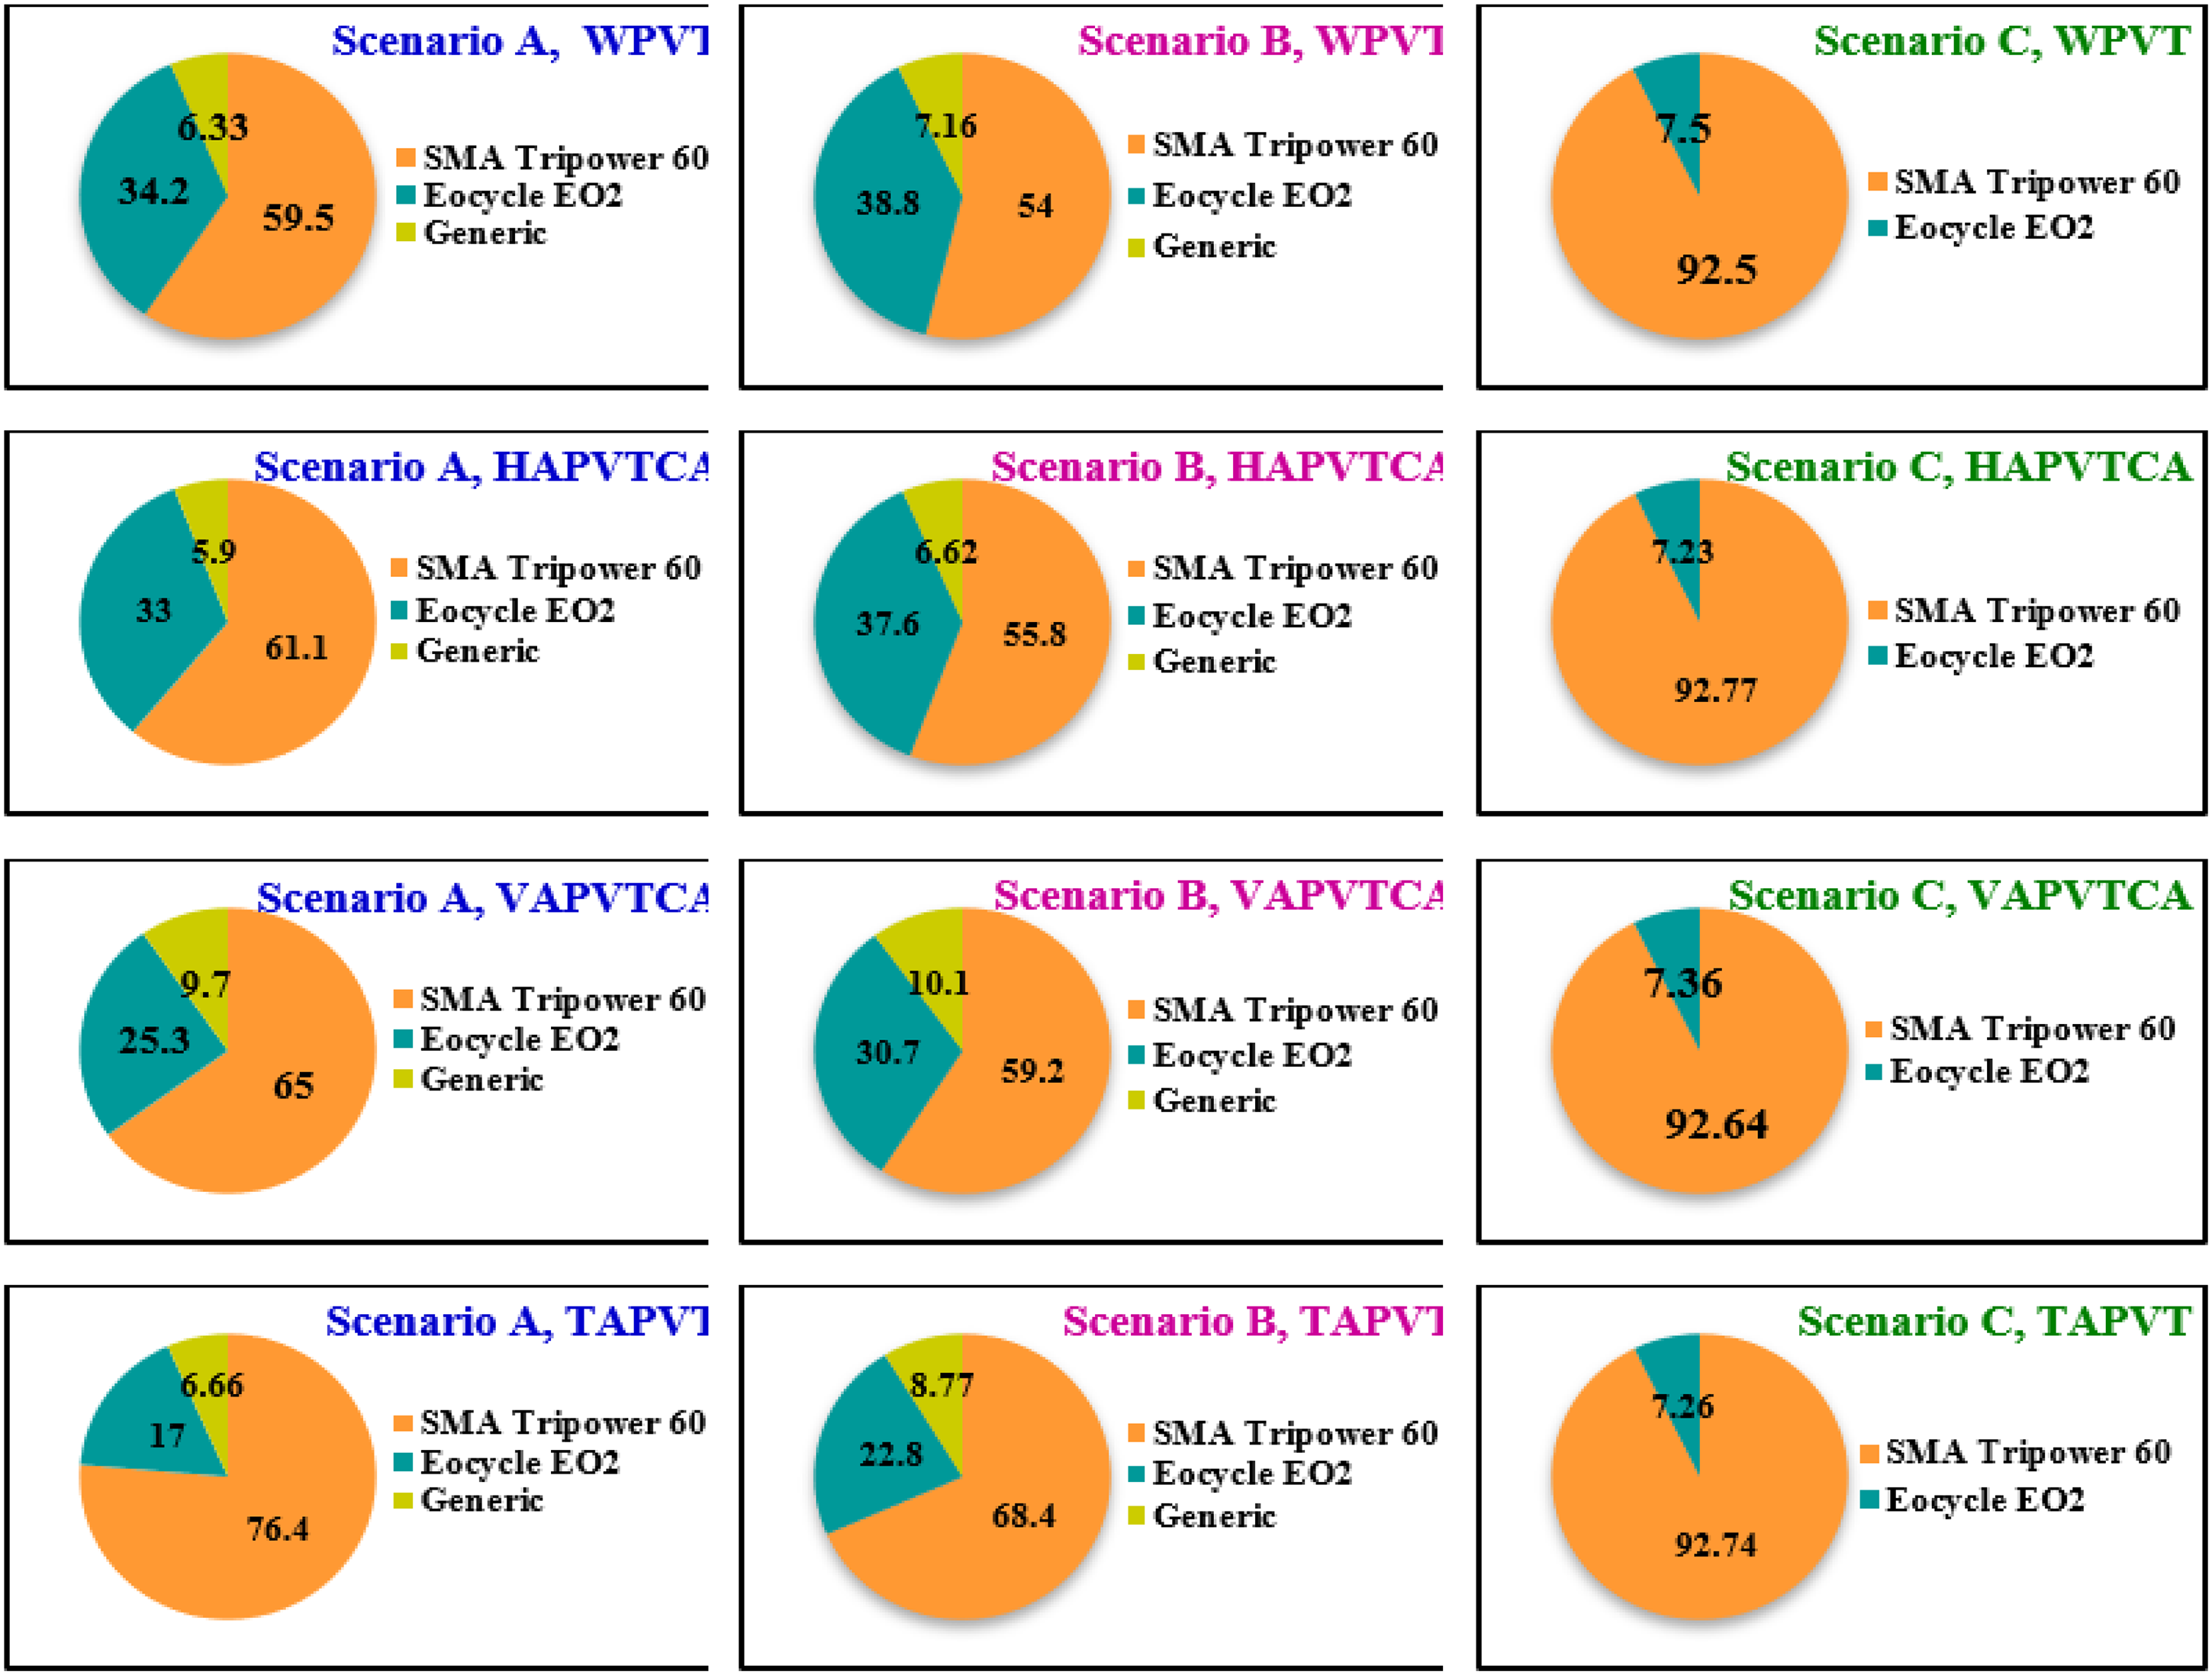
In scenario B, the least NPC of $389,700 was obtained from TAPVT compared with the highest of $460,419, recorded from WPVT and there was 15.36% of reduction of NPC in TAPVT against WPVT. The corresponding COE was obtained as $0.236 and $0.279/kWh from TAPVT and WPVT respectively. The minimum optimized yearly OC and FC were $9928 and $4125 respectively, from HAPVTCA. The difference between OC and FC were recorded as $2115 and $2060/year against VAPVTCA. The percentage differences of reduction in OC, recorded by HAPVTCA, were 1.44%, 4.97%, and 17.56% against TAPVT, WPVT and VAPVTCA, respectively. Also in FC, the percentage reduction was in the order of 4.95%, 23.75%, and 33.63% against WPVT, TAPVT, and VAPVTCA, respectively. The NPC difference of $59,197 was obtained between WPVT and TAPVT, respectively, under scenario C. The COE was recorded by WPVT and TAPVT at 0.224$/kWh and 0.185 $/kWh. The lowest and highest values of OC were recorded as $1466/year and $2117/year, respectively. The percentage differences of reduction in OC, recorded by TAPVT were 5.84%, 6.56%, and 30.75% against VAPVTCA, HAPVTCA, and WPVT, respectively. The detailed monetary study values are displayed in Table 9. The NPC break-up costs, for all scenarios and cases are depicted in Table 10. The component wise NPC break up costs is also displayed in Table 11a, under all scenarios and in all cases and summary of outcomes from all scenarios in Table 11b. The percentage wise NPC break-up cost of components, used in this study, is depicted in Figure 7.
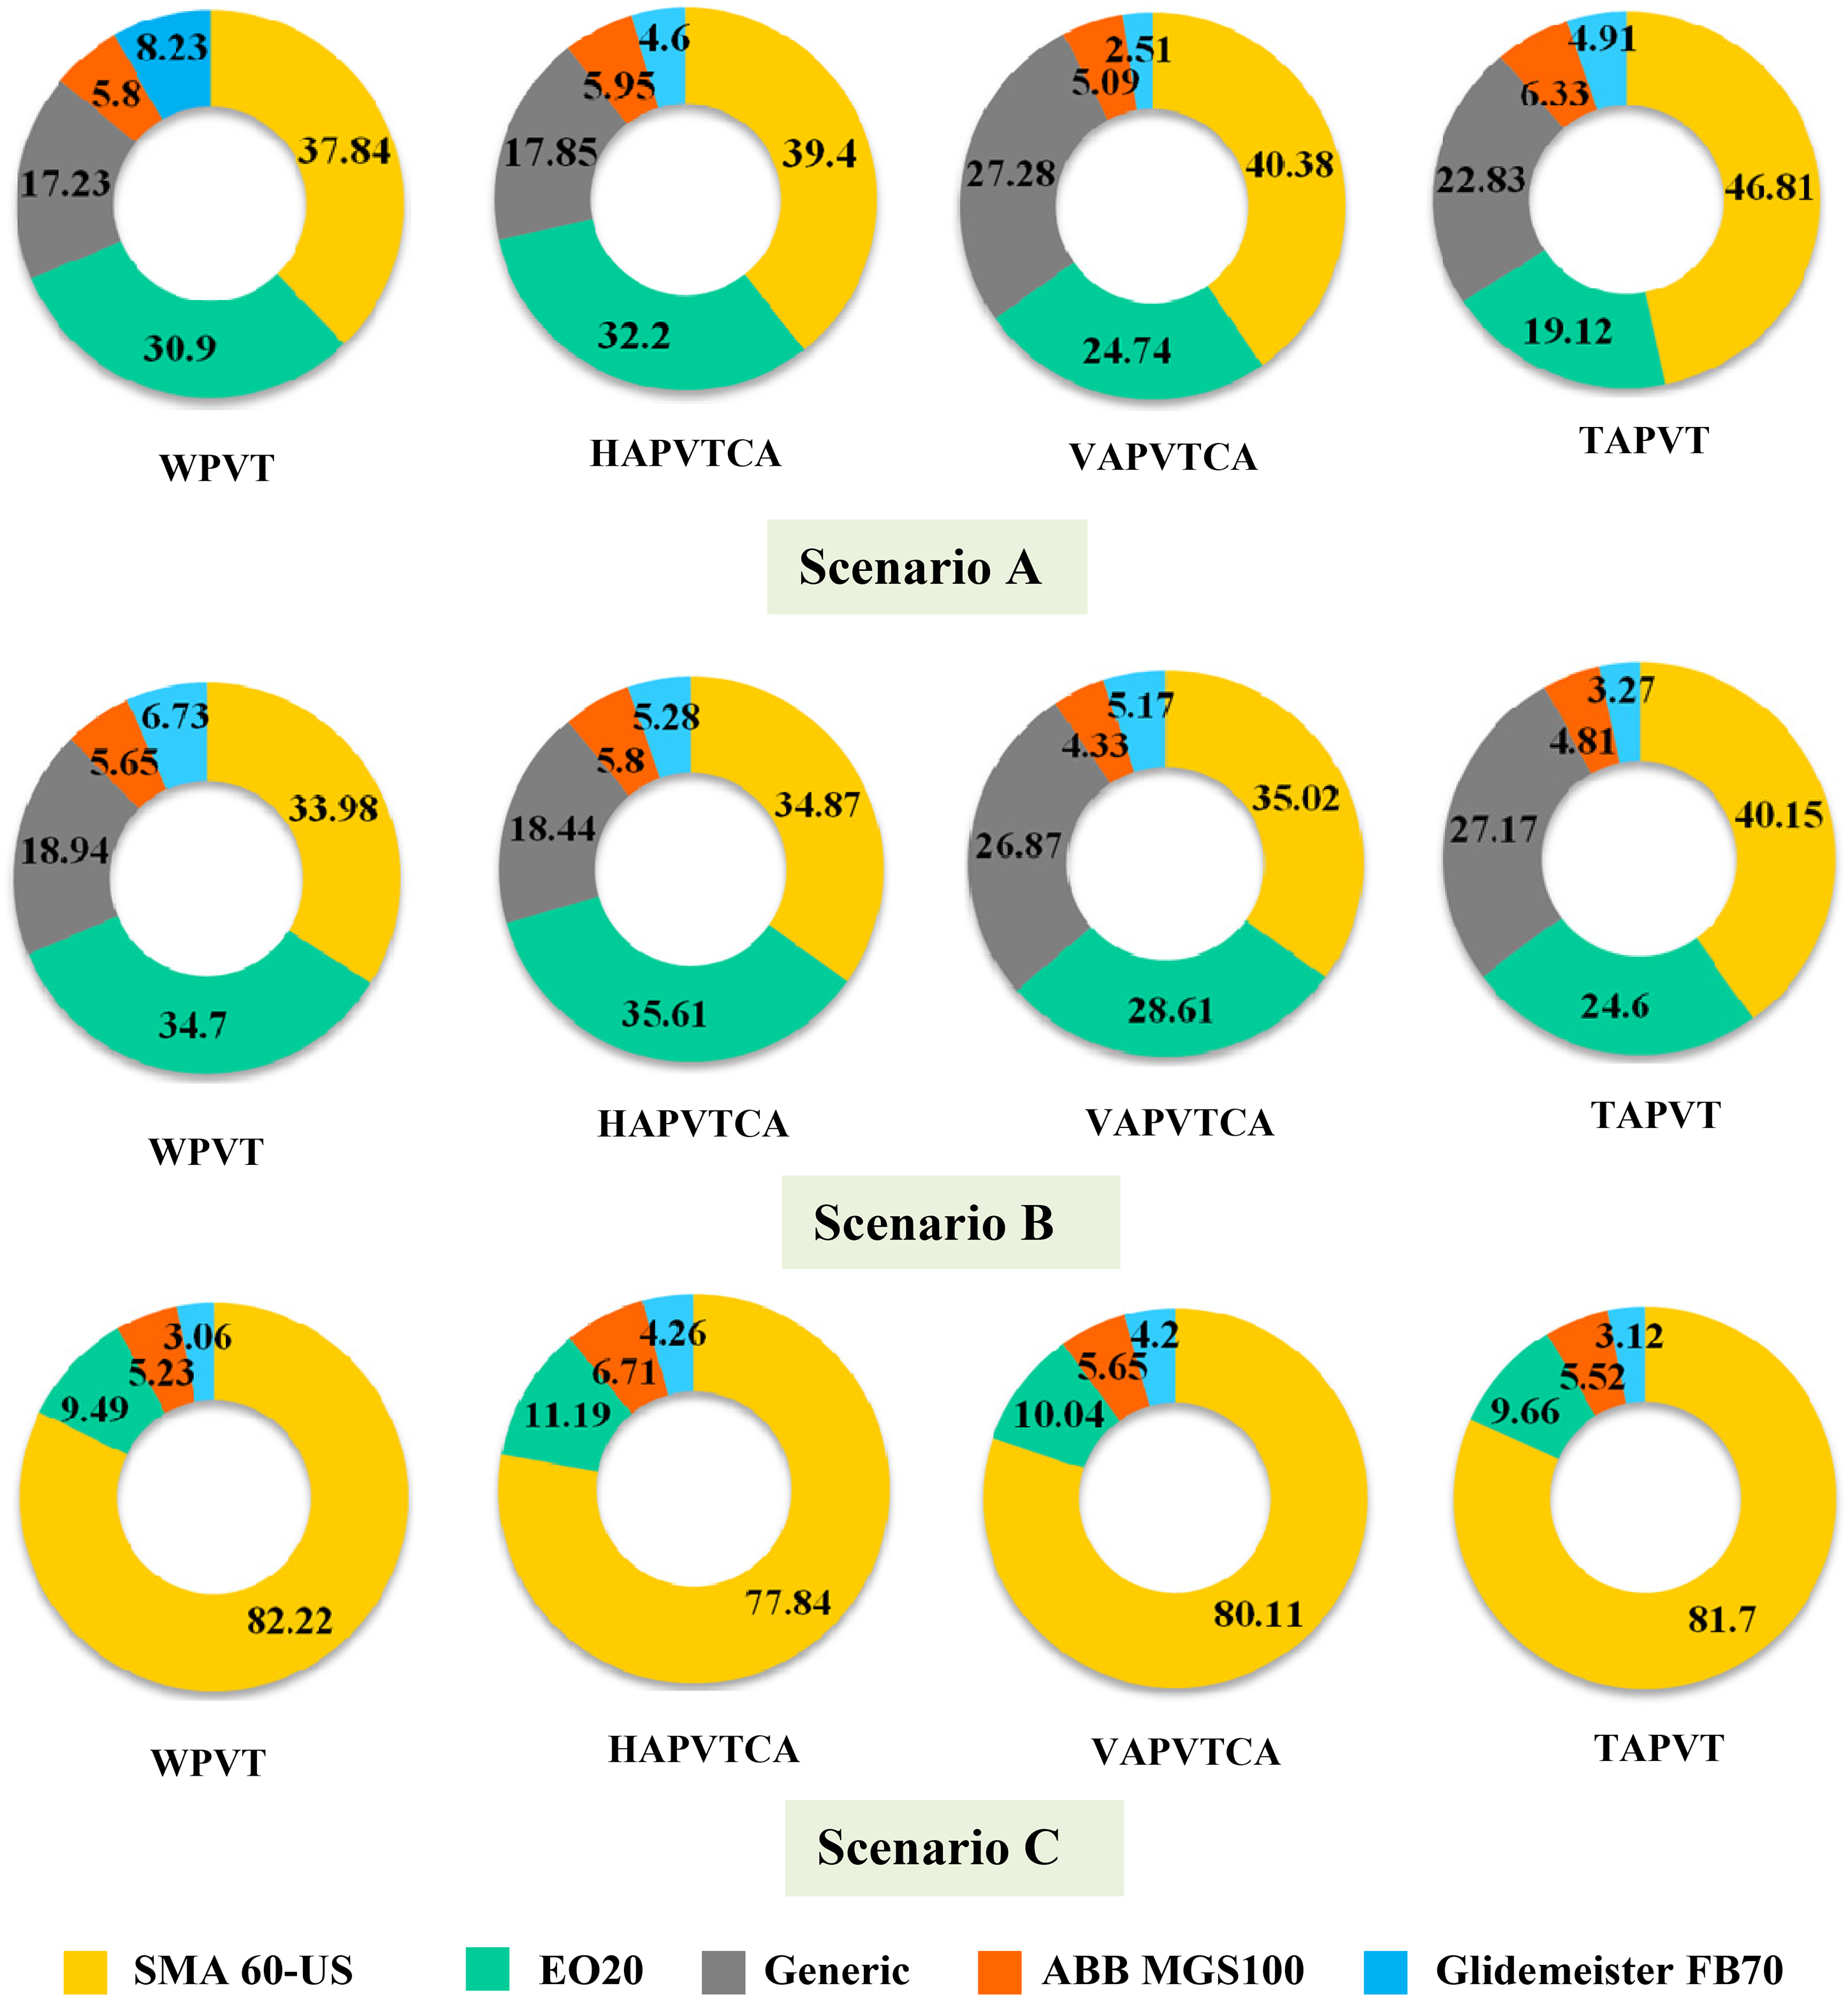
Percentage of NPC break-up cost of component for all scenarios and cases.
Monitory analysis under different tracking with load scenarios.
NPC break up by cost (in $) for all scenarios and cases.
NPC break up by component (in $) for all scenarios and cases.
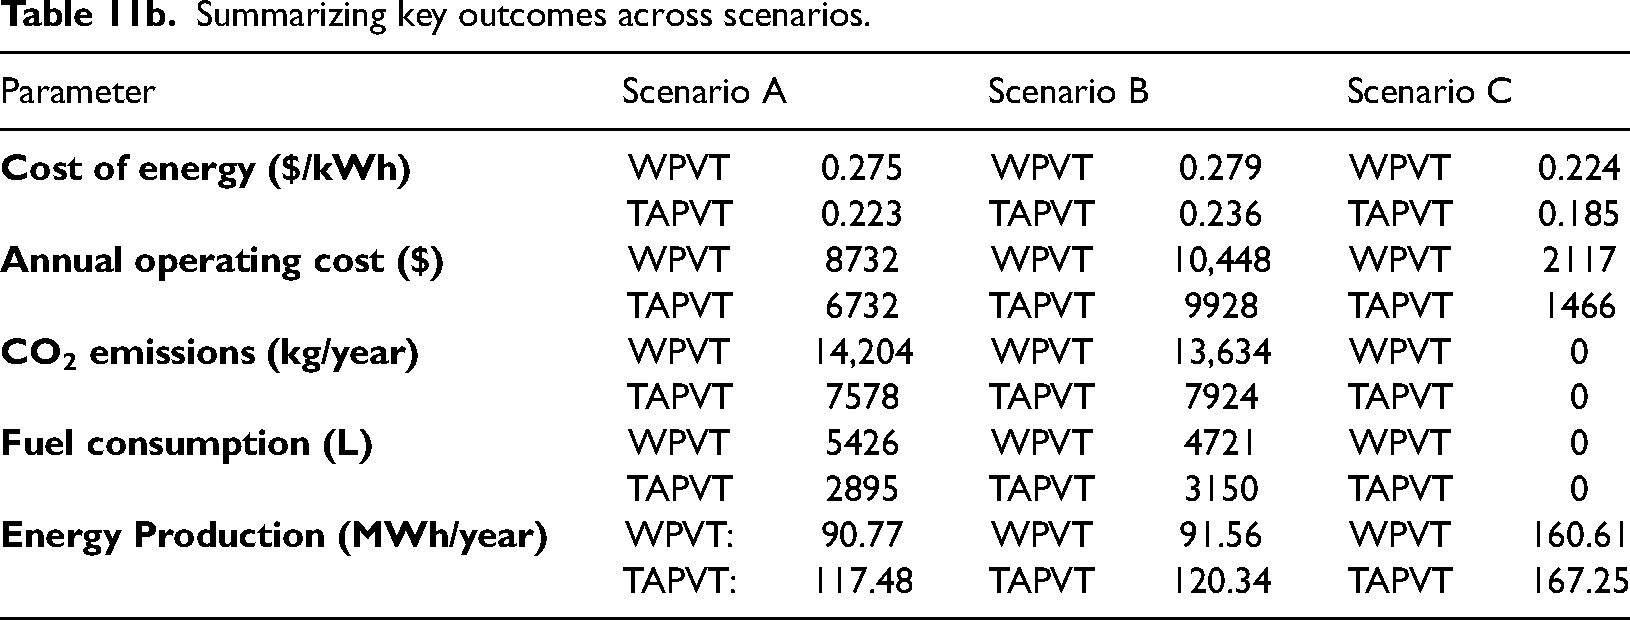
Summarizing key outcomes across scenarios.
The proposed standalone HRES offers several advantages over grid-connected systems, particularly in remote areas with limited or no grid access. While grid systems are reliable in urban areas, they are often uneconomical for rural and tribal regions due to high transmission costs. In contrast, the HRES provides independent and reliable power, eliminating the need for costly grid infrastructure and offering long-term cost-effectiveness. Compared to other off-grid solutions like solar-diesel hybrids or wind-solar setups, the HRES delivers better reliability and efficiency by reducing fuel consumption, minimizing emissions, and lowering operating costs. For tribal schools and hostels with unreliable grid access, the HRES ensures a consistent, eco-friendly power supply, supporting educational activities, local development, and job creation.
Technical analysis
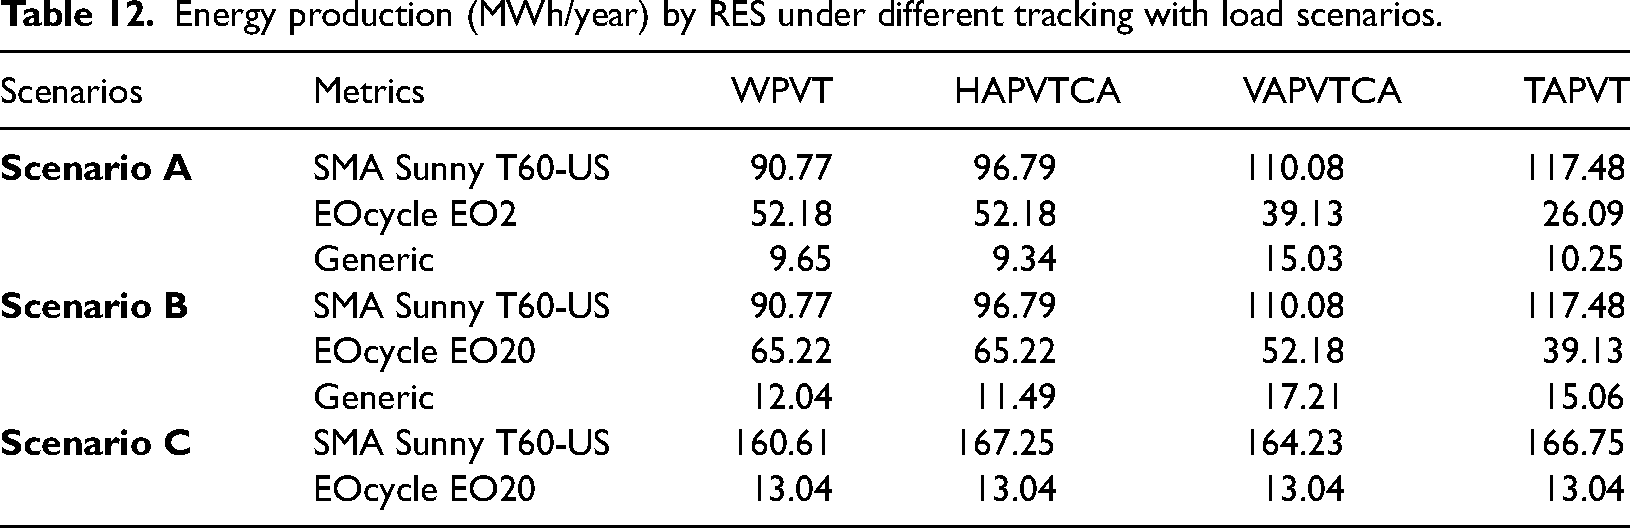
Five different parameters like EP, EE, UEL, CS, and GQ were analyzed in this study. The energy production, contributed by solar PV, plays a majority role. In scenario A, the maximum and minimum production of energy was reported as 117.48 MW and 90.77 MWh/year, obtained by TAPVT and WPVT, respectively, with the percentage difference being 22.73% between them. The major contribution of wind energy was around 52.18 MWh/year, through both WPVT and HAPVTCA. The VAPVTCA reported the least production as 26.09 MWh/year. Energy, produced by the diesel generator was 15.03 MWh/year, the highest in VAPVTCA and the lowest at 9.34 MWh/year in HAPVTCA respectively with the percentage EP difference being 37.85%. In scenario B, the status of energy production by solar PV was the same as scenario A and there was some appreciable rise in wind and diesel energy sources.
The minimum EP, reported in wind energy source, was 39.13 MWh/year in TAPVT. Both WPVT and HAPVTCA recorded their maximum and equal values as 65.22 MWh/day. The diesel energy source, contributed its minimum and maximum values as 11.49 and 17.21 MWh/year, respectively, through HAPVTCA and VAPVTCA, with the percentage EP difference being 33.23%. Renewable energy contributions were available only in Scenario C. The lower and upper EP levels were reported in WPVT and HAPVTCA at 160.61 and 167.25 MWh/year respectively, with the percentage difference in solar PV being 3.97% between them. Wind energy contribution was constant for all cases and it was recorded at 13.04 MWh/year. Monthly average EPs, for scenarios A and C, are depicted in Figures 8 and 9, respectively. The detailed energy production particulars by RES, are given in Table 12, against all scenarios and cases. Percentage of production, contributed by HRES, resources, is depicted in Figure 10.
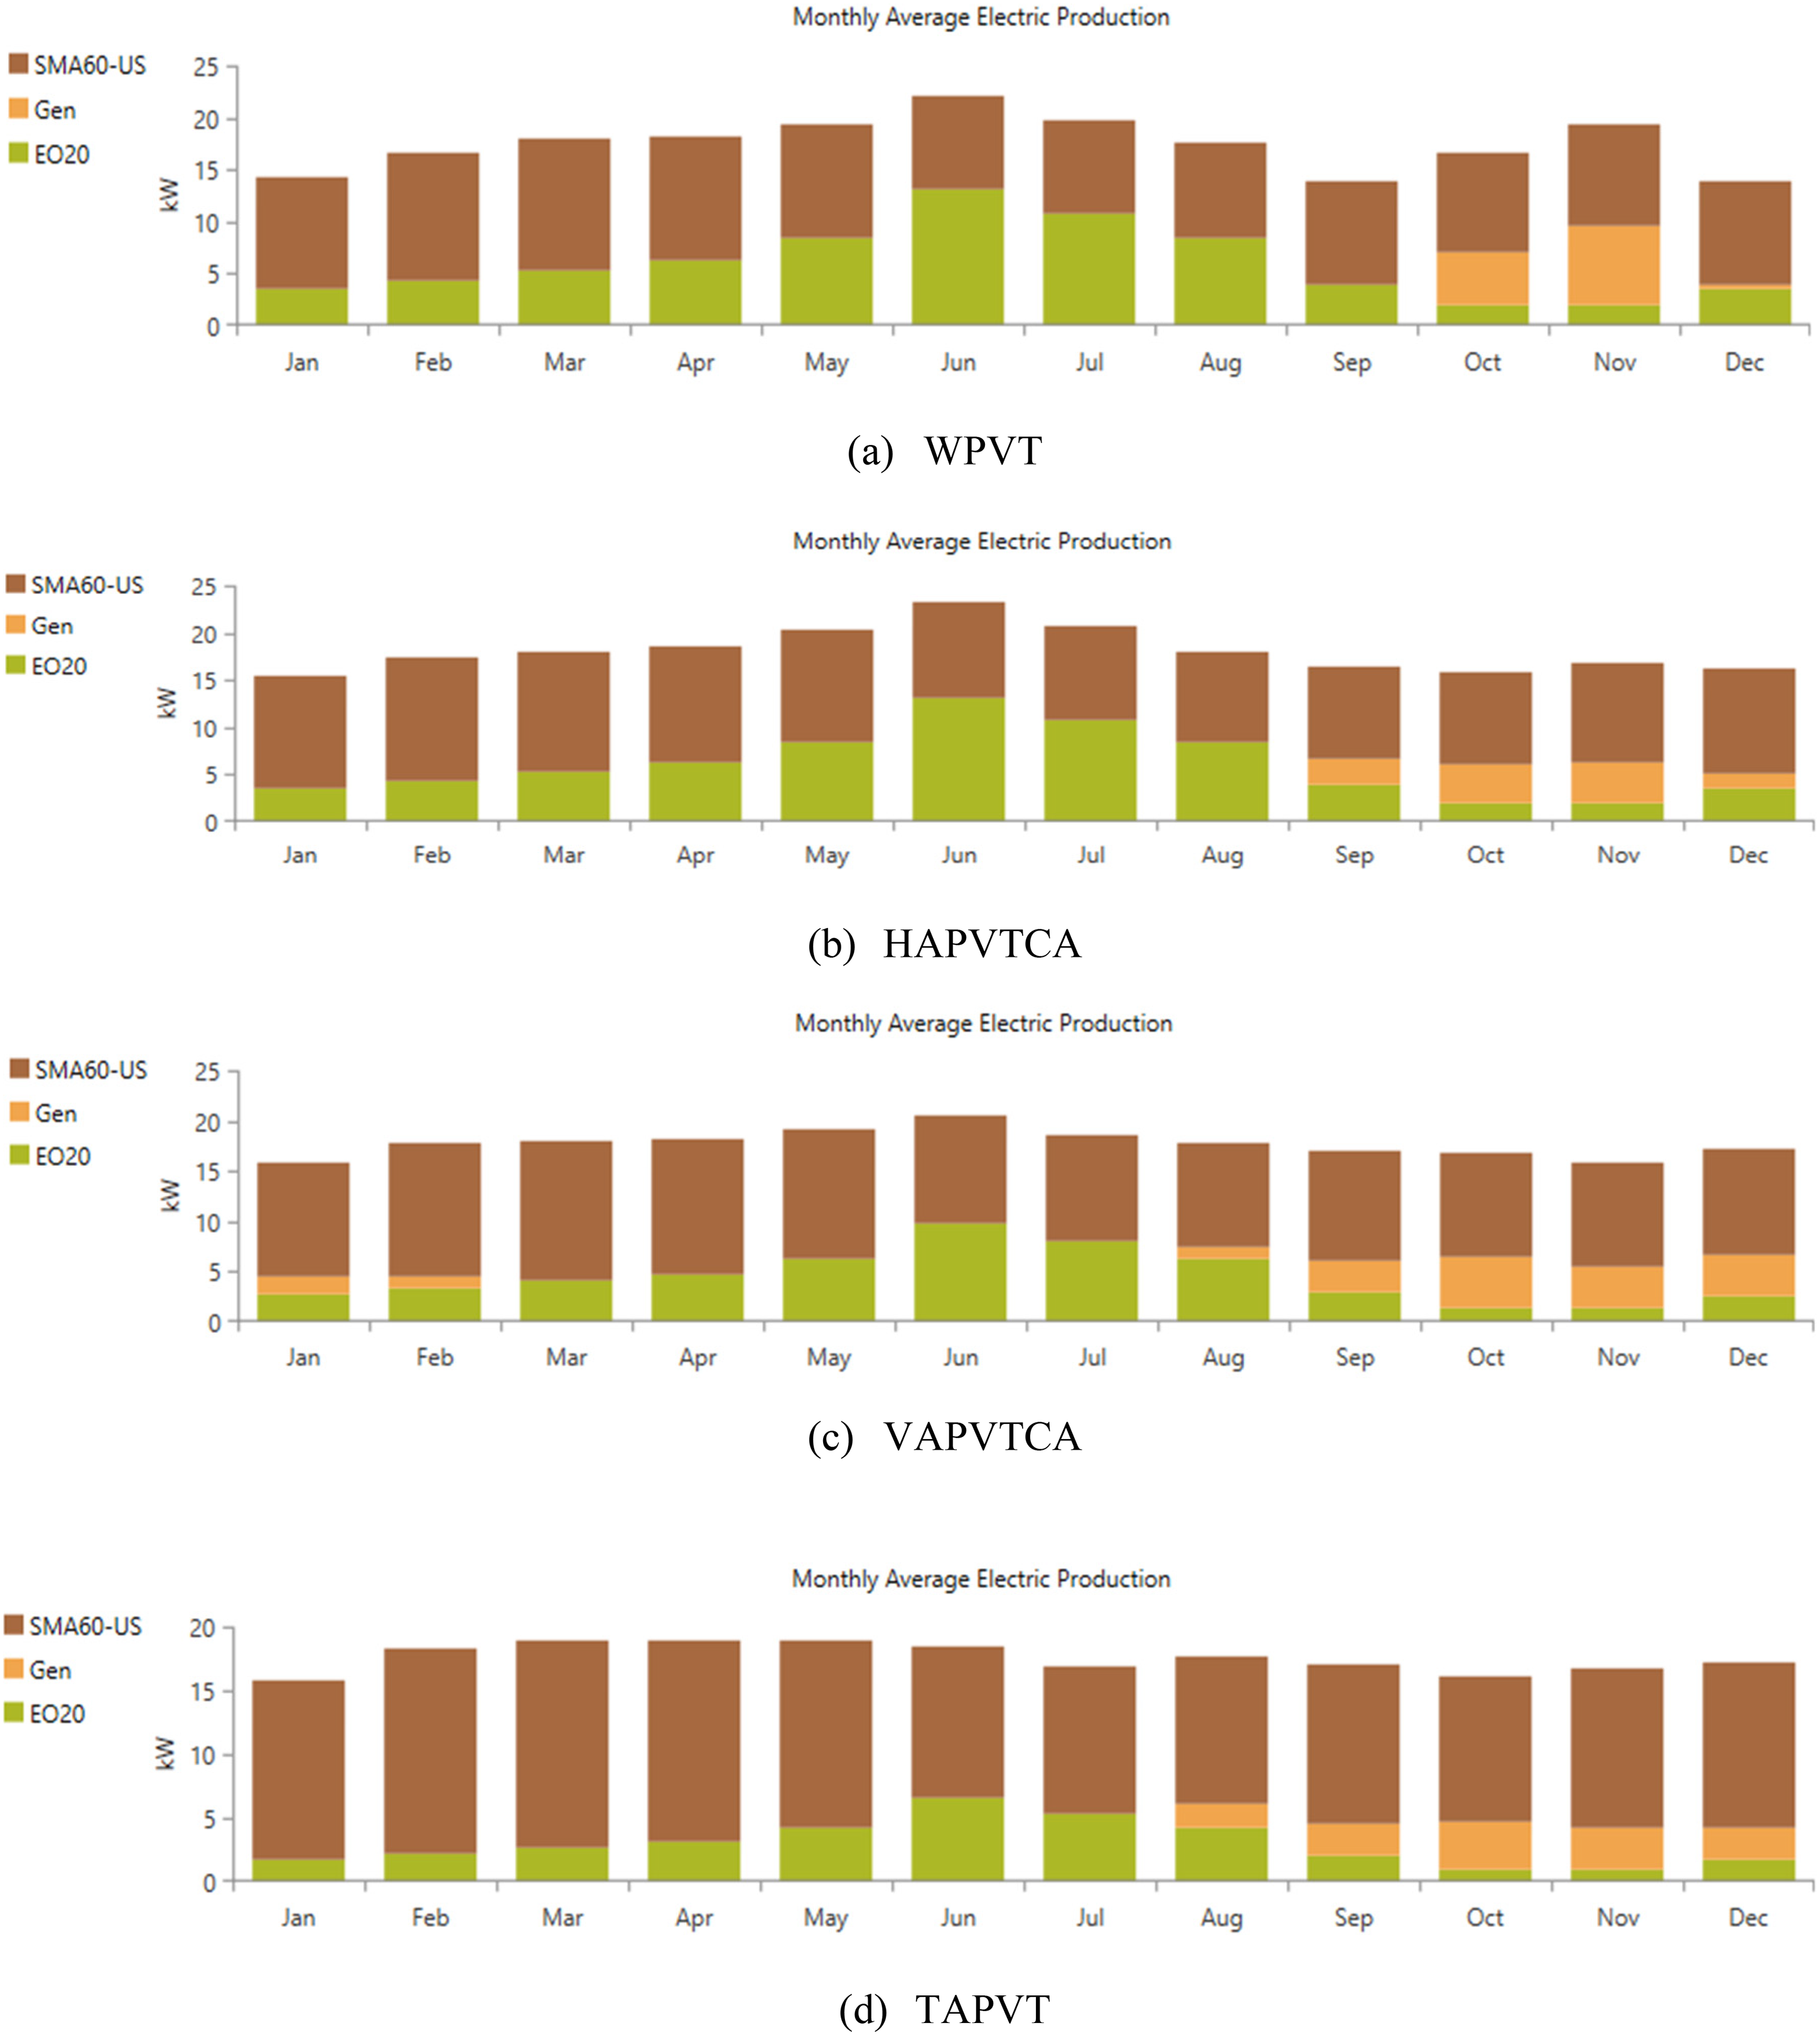
Monthly average electric production for scenario A.
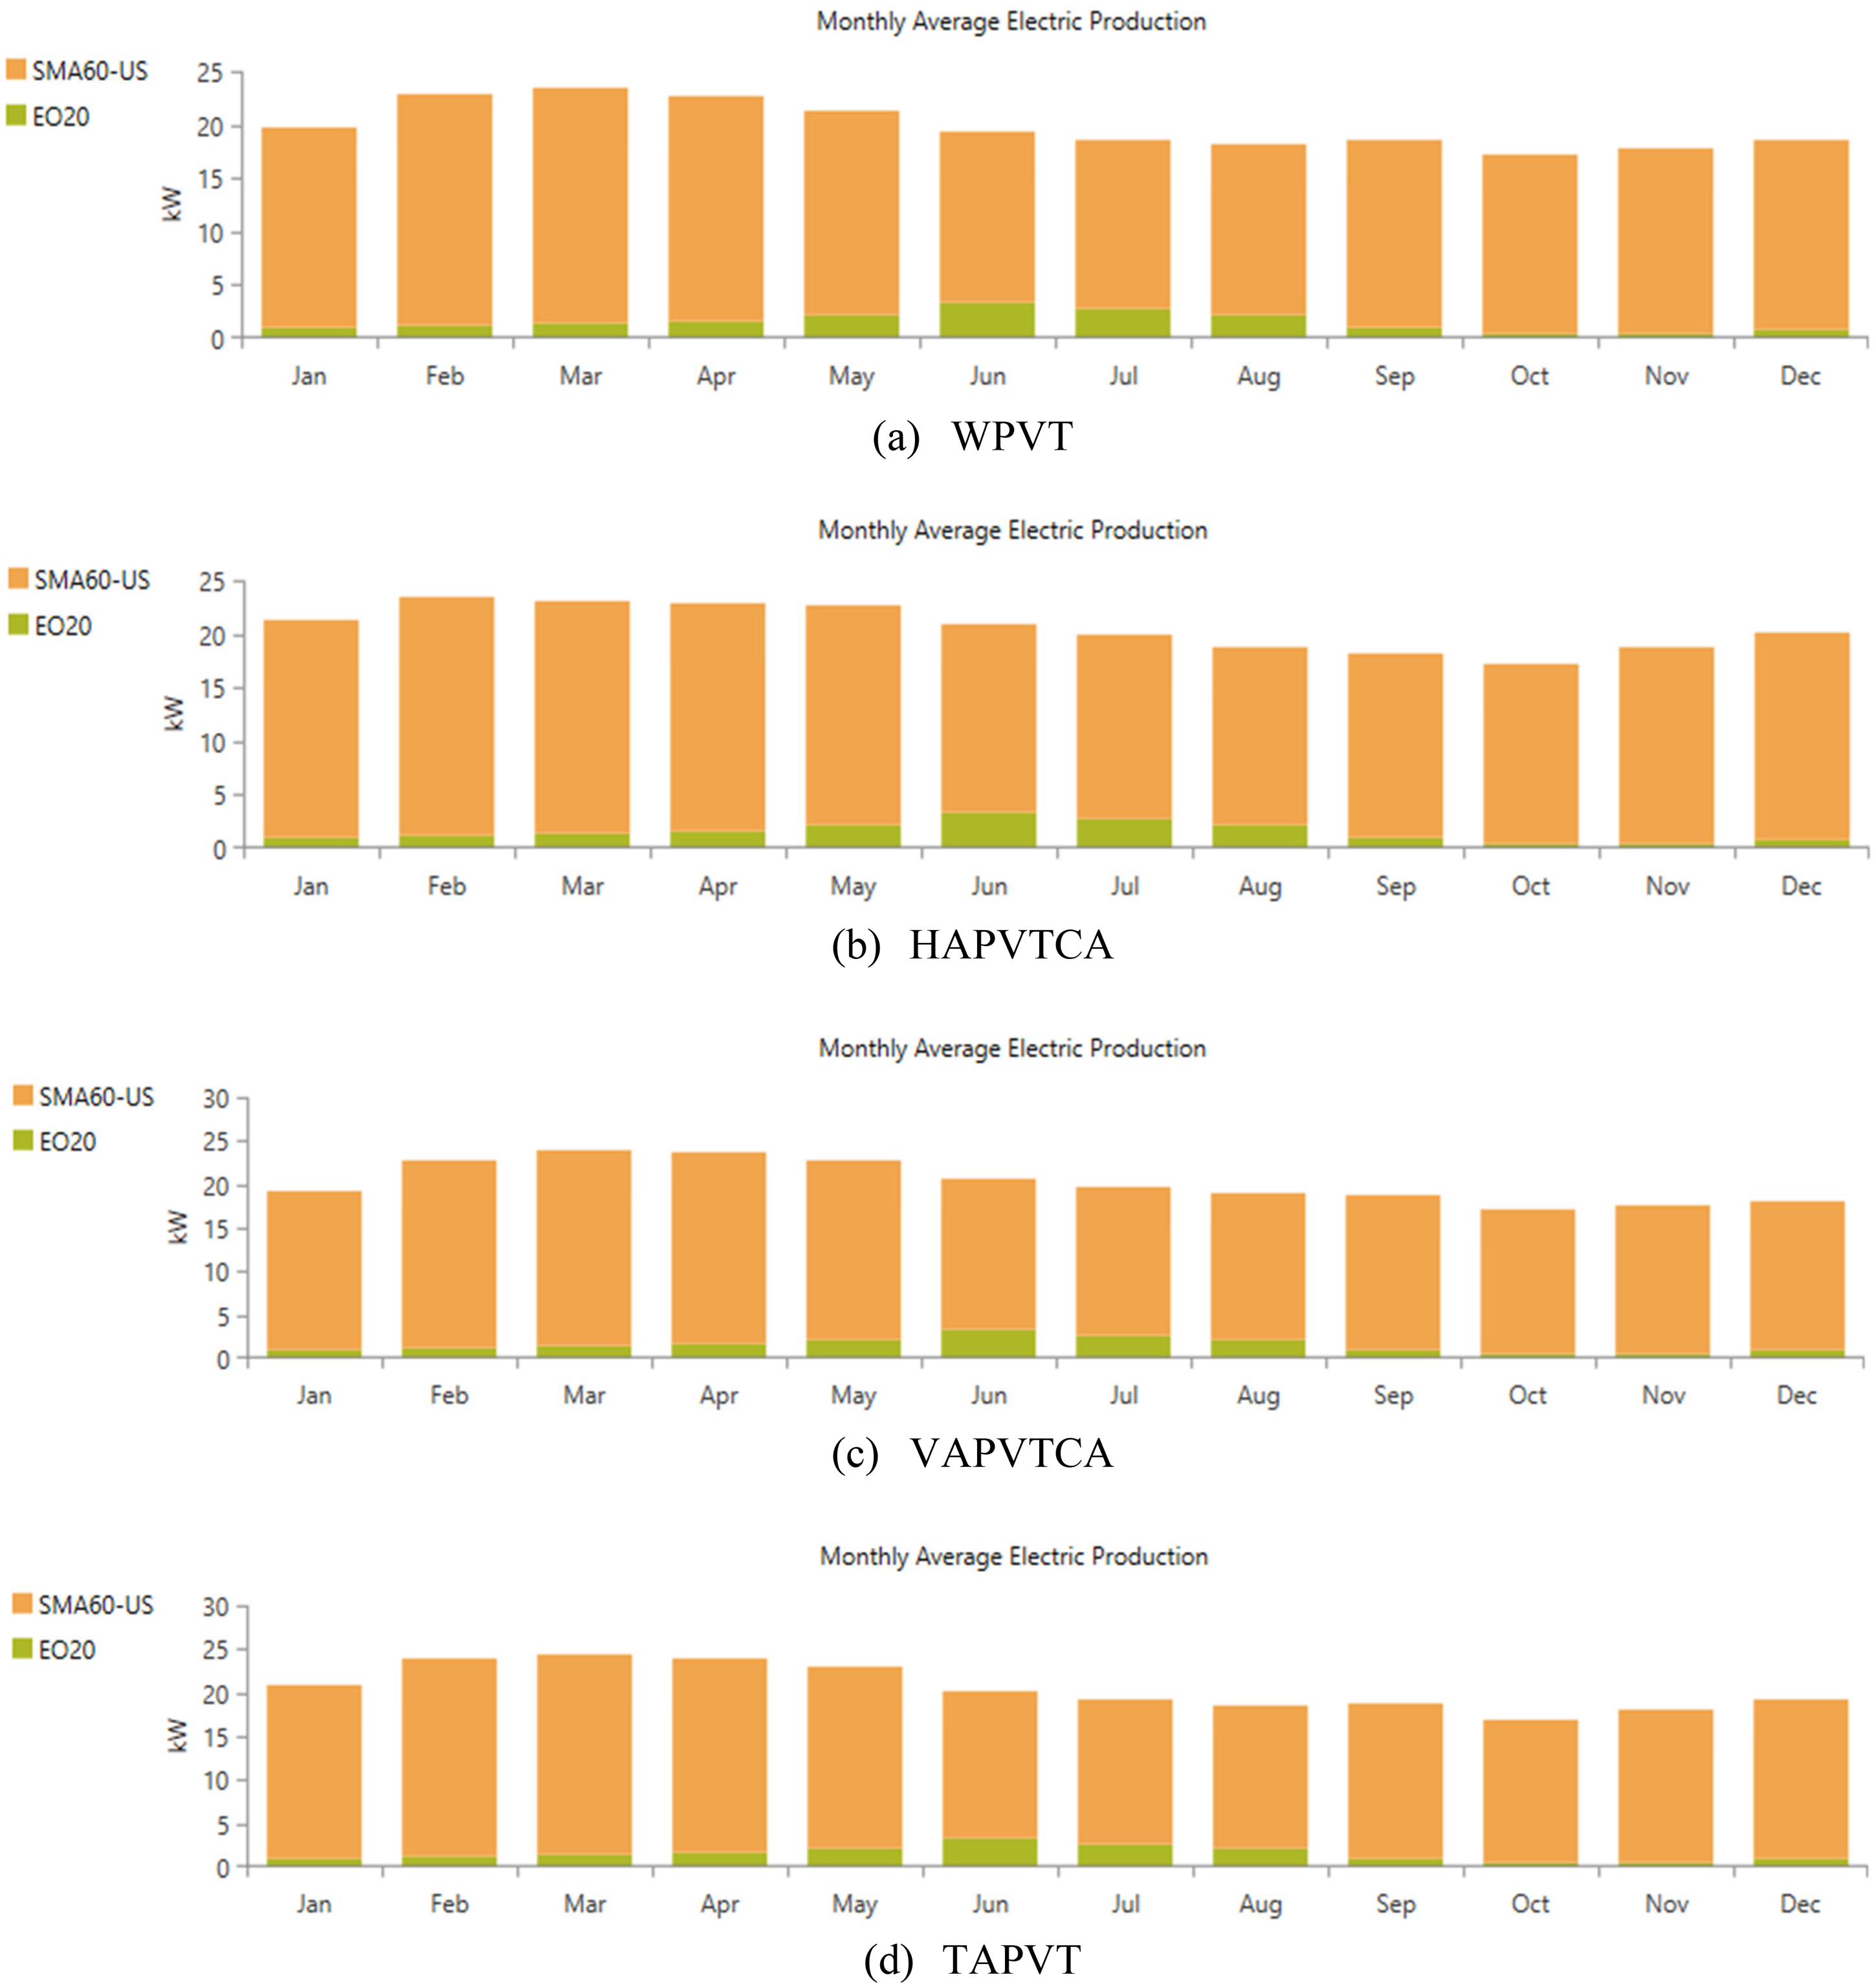
Monthly average electric production for scenario C.
Percentage of production contributed by the HRES resource.
Energy production (MWh/year) by RES under different tracking with load scenarios.
The EE (Q1), UEL (Q2), and CS (Q3) are called electrical quantity parameters. In scenario A, the minimum value of Q1, in TAPVT, was 5.91 MWh/year and the outcome was between 5.91 and 12.44 MWh/year. Its minimum optimal values were 8.83 and 20.79 MWh/year, by WPVT, under scenarios A and B, respectively. The quantity Q2 reached its minimum and maximum values at 0.023 and 0.069 MWh/year, through HAPVTCA and VTCA, respectively under scenario A. It attained the minimum yearly energy optimal values at 0.043 and 0.012 via WPVT and HAPVTCA, respectively, under scenarios A and B.
Under scenario A, Q3 recorded its maximum quantity of 0.11 MWh/year through VTCA and minimum quantity of 0.036 through HAPVTCA. The other yearly MWh values were recorded as 0.085 and 0.067, through VAPVTCA and TAPVT, respectively. It recorded its minimum optimal quantity at 0.054 MWh/year by WPVT, under scenario B. The least outcome of 0.047 MWh/year was reported by HAPVTCA and TAPVT, under Scenario C. Percentage levels of all electrical quantities are shown in Table 13. The recorded quantity parameter values are given graphically in Figure 11, for all scenarios, with their cases.
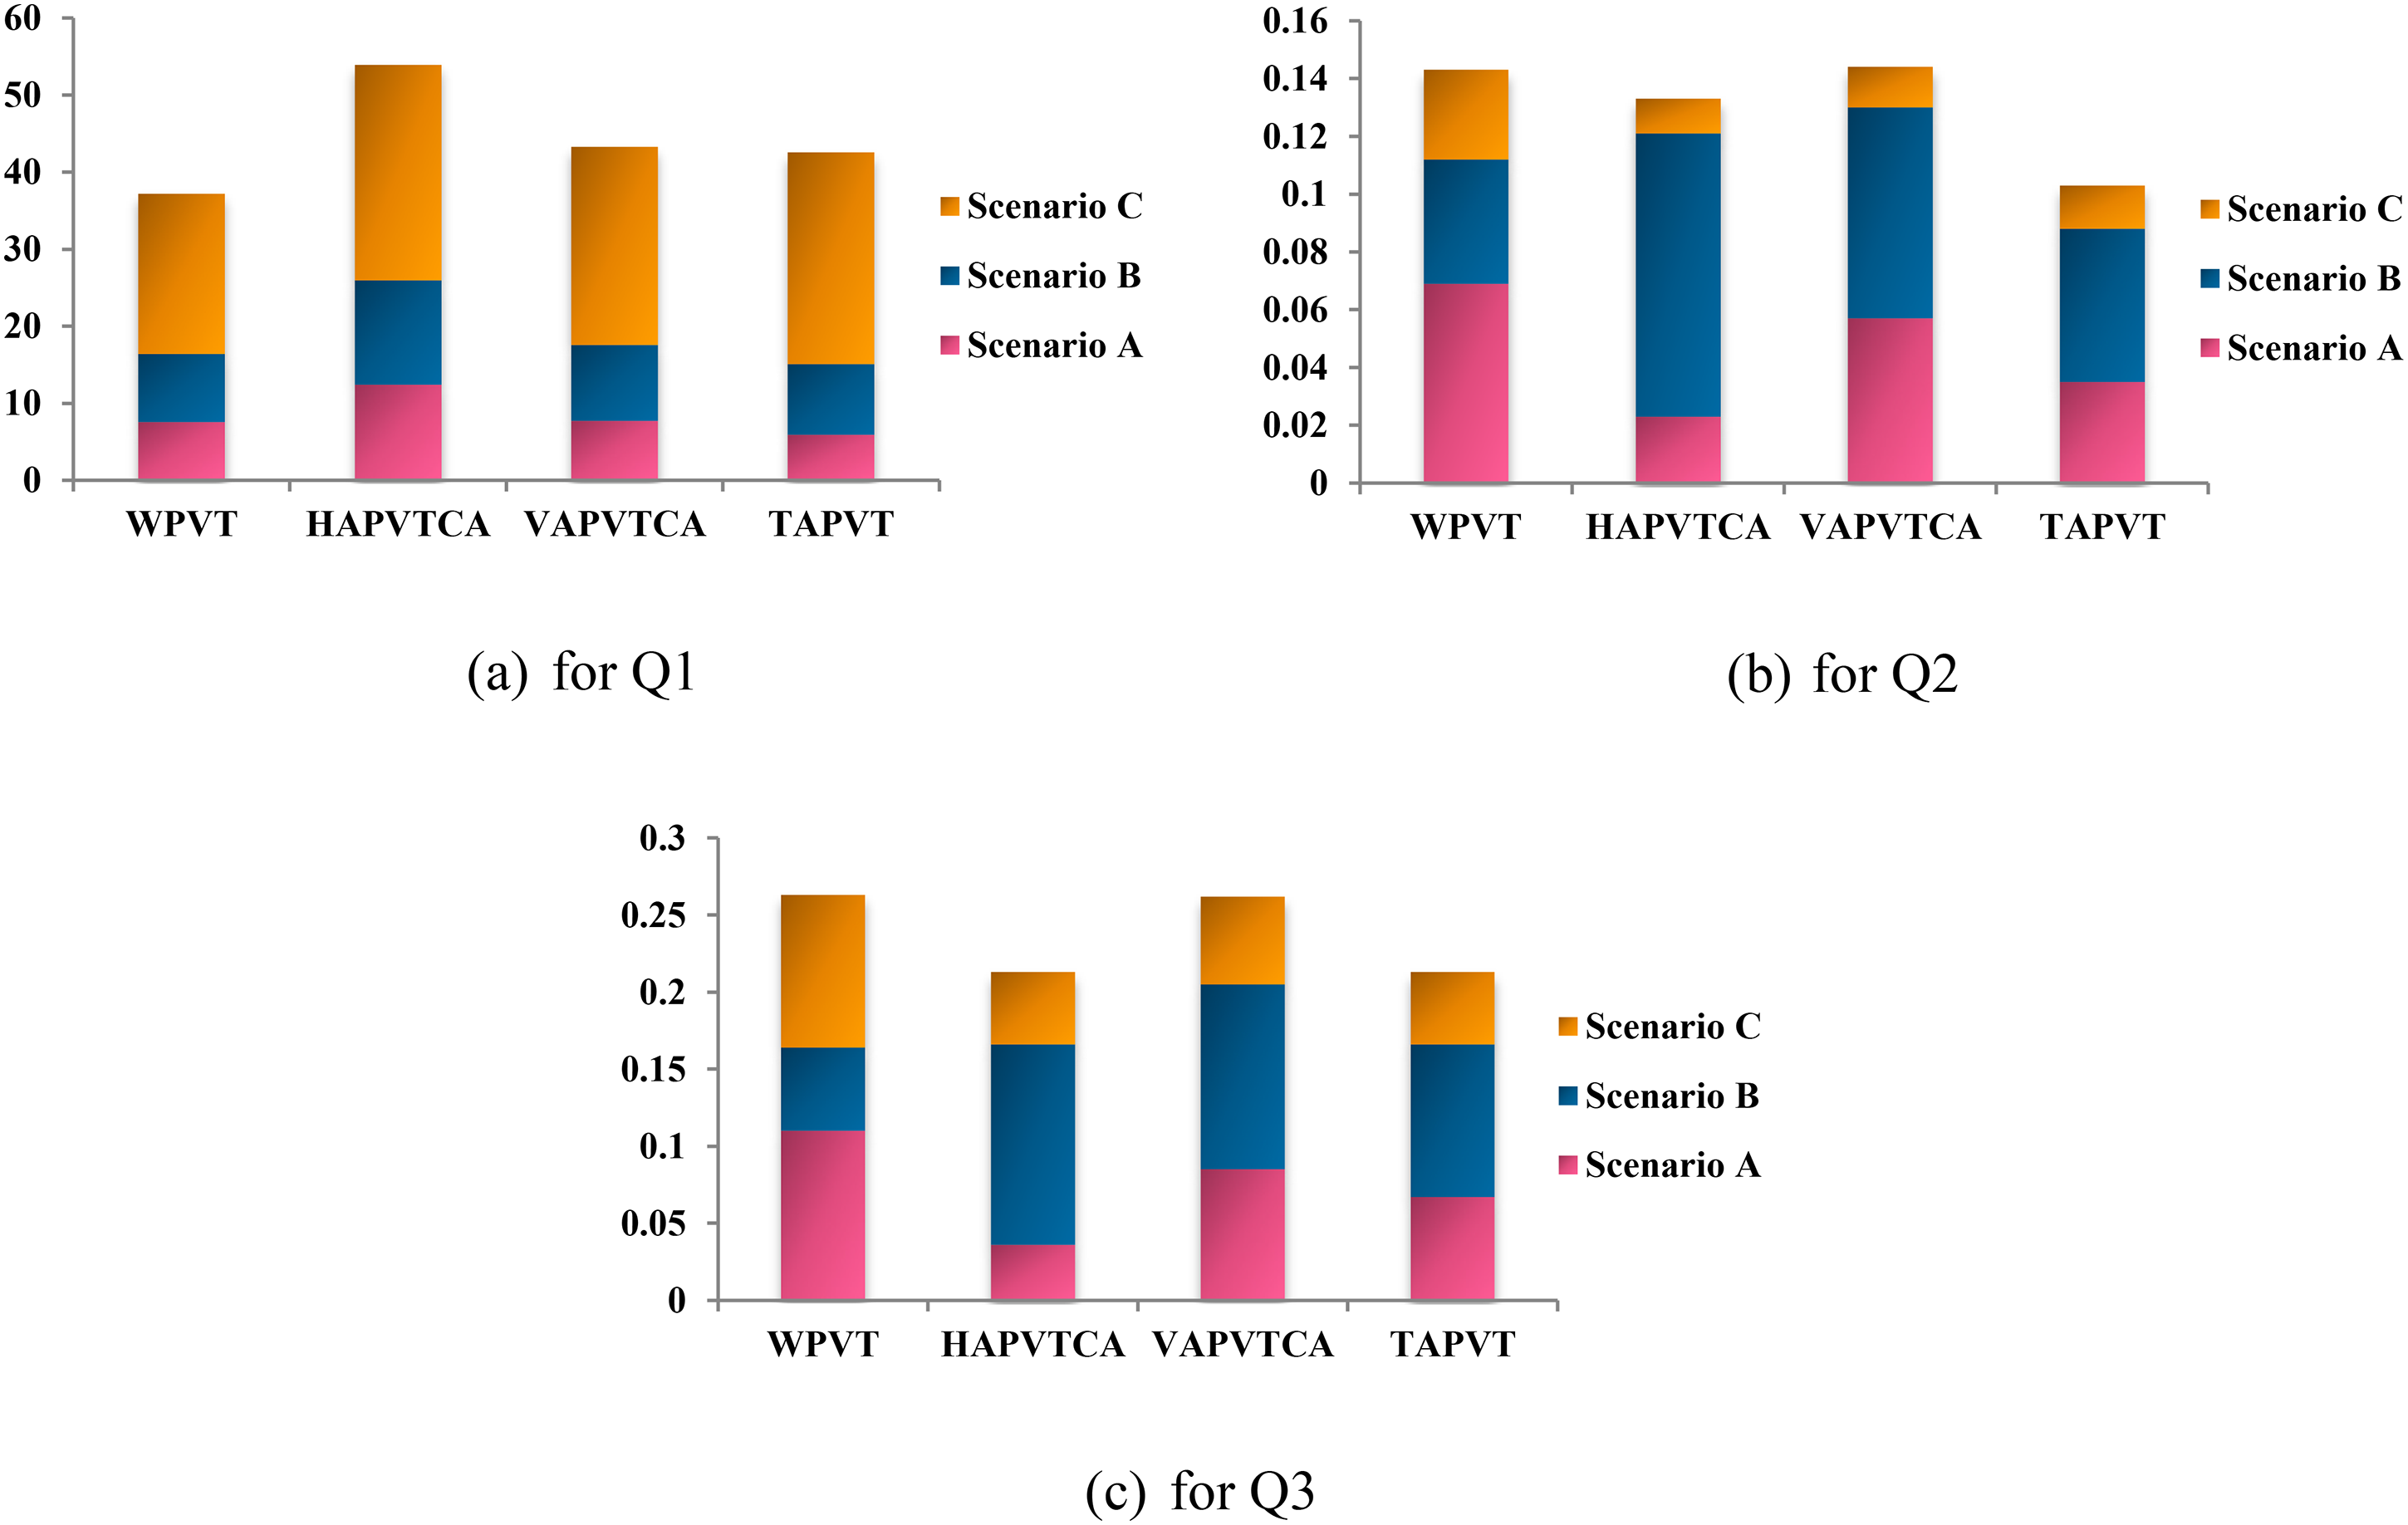
Electrical quantity (in MWh/year) parameter values for all cases.
Percentage of electrical quantity (%) under different tracking and different load scenarios.
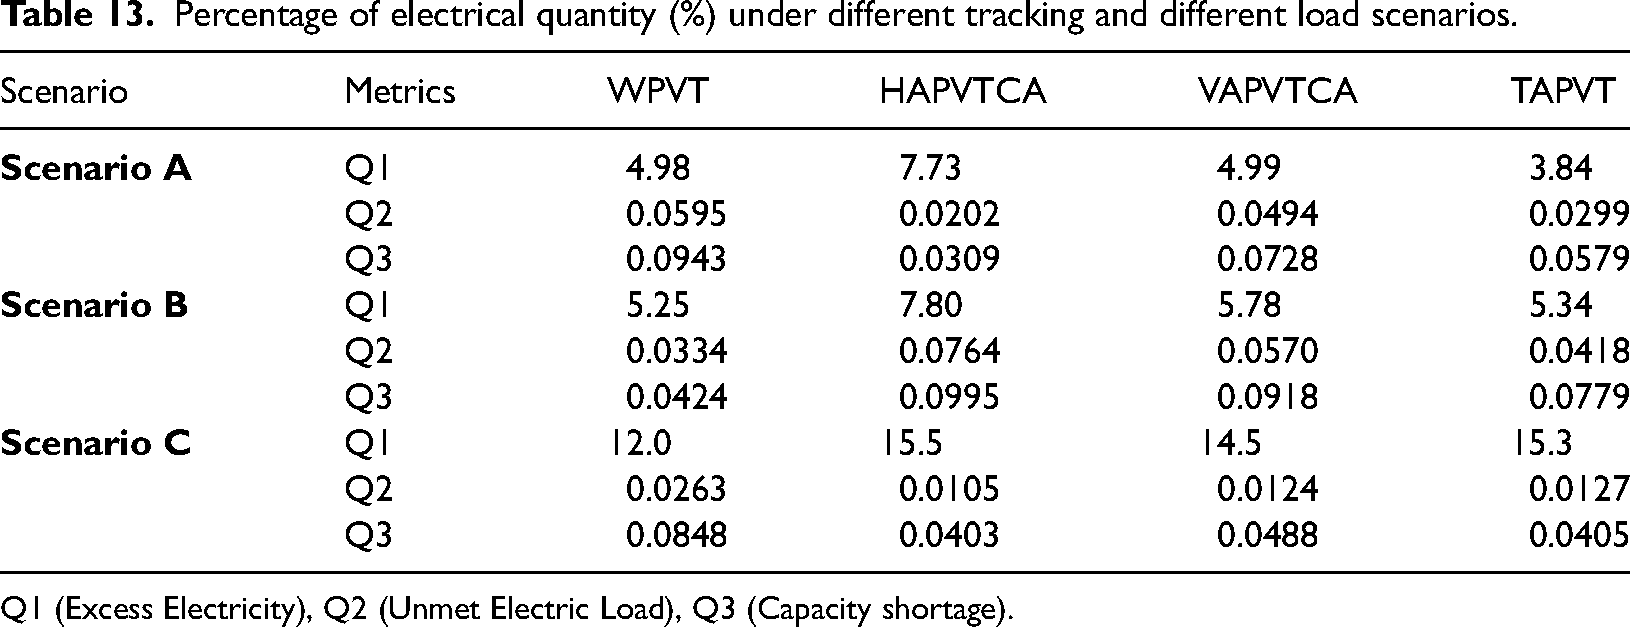
Q1 (Excess Electricity), Q2 (Unmet Electric Load), Q3 (Capacity shortage).
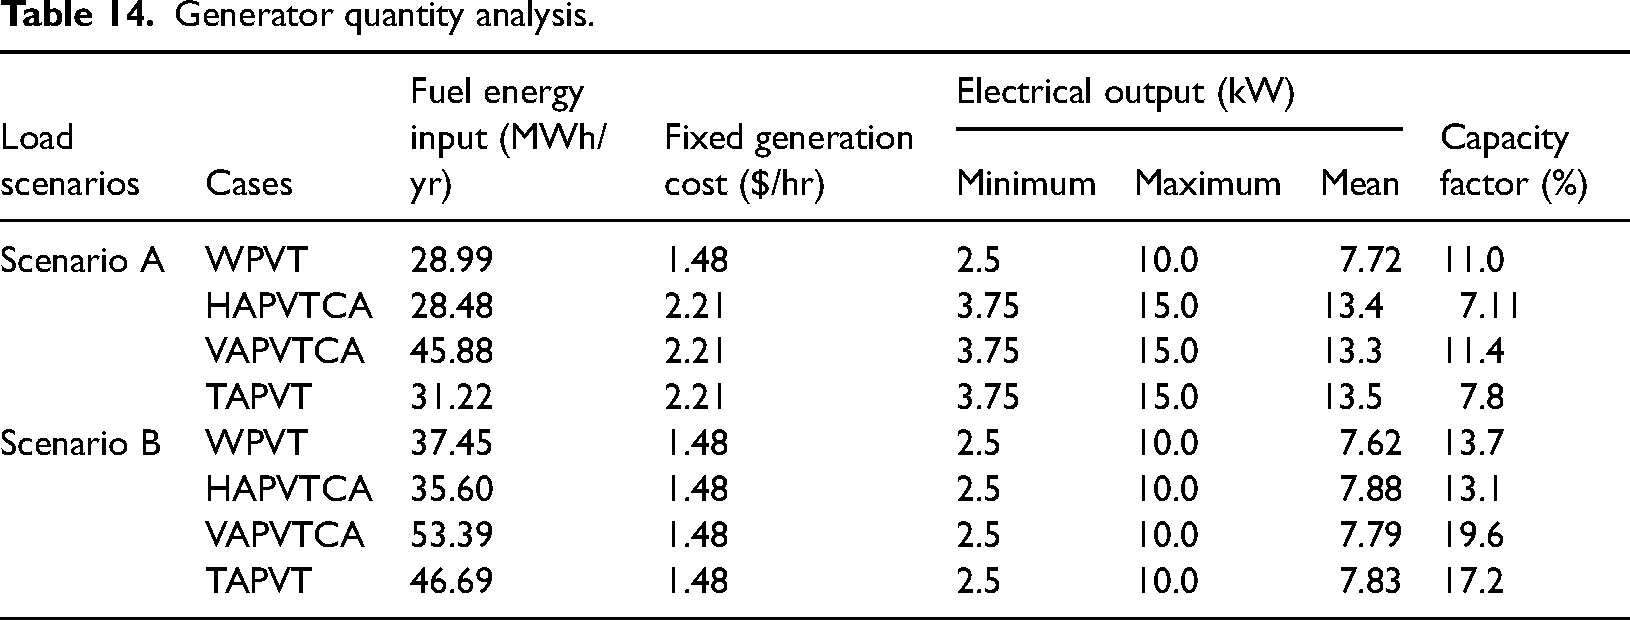
There are no articles which analyzed the GQ and it was considered in this study for the first time. In GQ analysis, the fuel energy input, fixed generation cost, electrical outputs and capacity factor were the considerable parameters. The marginal and fixed generation costs were reported at 0.311 and 1.48$/kWh respectively. The minimum optimal findings of yearly fuel energy input were 28.48 and 35.6 MWh/year, under scenario A and B, respectively, through HAPVTCA. The percentage differences between minimum and maximum input of fuel energy were reported as 37.92% and 33.32%, under scenarios A and B, respectively. The minimum capacity factors were 7.11% and 13.1%, respectively, reported by HAPVTCA, under both scenarios. Mean electrical outputs were obtained by WPVT, at 7.72 and 7.62 kW, in scenarios A and B, respectively. The detailed GQ parameters are depicted in Table 14.
Generator quantity analysis.
Emission analysis
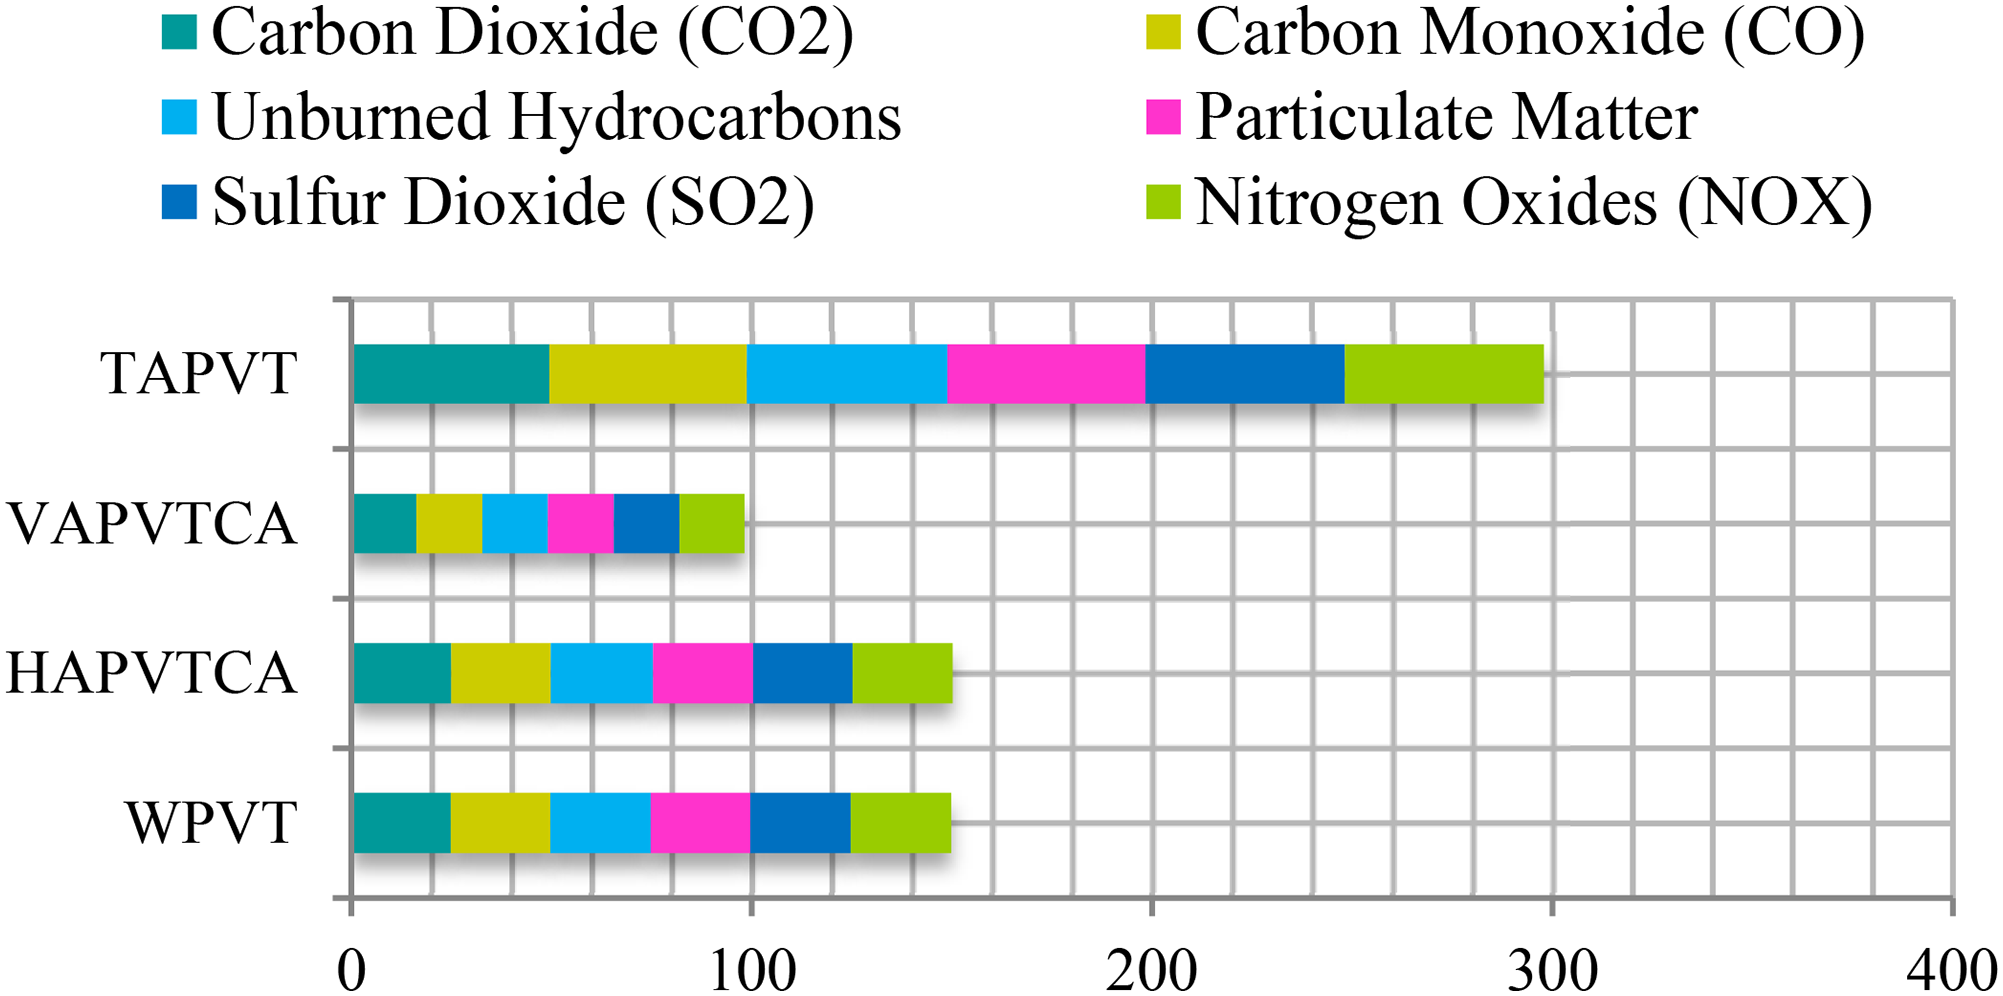
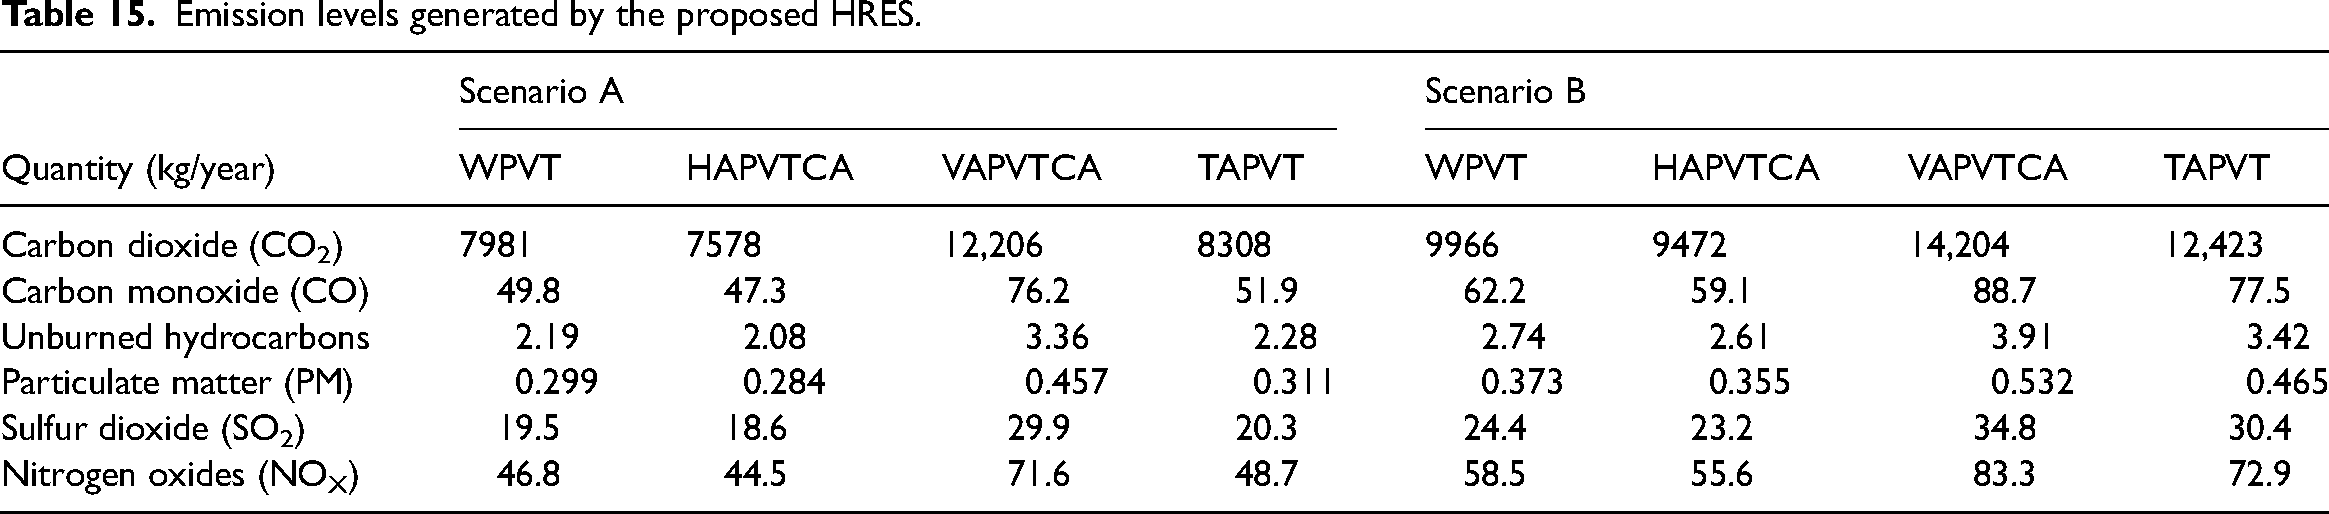
In this section, six different emission parameters like CO2, CO, UHC, PM, SO2, and NO X , were considered in this study. The minimum and maximum outcomes for all emission parameters were reported by HAPVTCA and VAPVTCA, respectively, under both scenarios. The green house nontoxic gas like CO2, recorded 19.99% of more emission as minimum and 14.06% of more emissions as maximum under scenario B compared with scenario A. The poisonous (CO) emission reported its minimum and maximum at 11.8 and 12.5 kg/year, under scenarios A and B respectively. In UHC, the minimum of outcomes were recorded as 2.08 and 2.61 kg/year, under from scenarios A and B, respectively.
The PM is recorded its minimum emission level of 0.284 under scenario A and 0.355 under scenario B. The minimum difference of corrosive gas emissions (SO2) was recorded as 4.6 kg/year, under scenarios A and B. In addition, percentage levels of NO X recorded its minimum at 19.96% and maximum at 14.04% more emissions, under scenarios A and B. The detailed emission levels, obtained by HRES, are shown in Table 15. The percentage rise of emission levels from all cases under scenario B against Scenario A, are depicted in Figure 12.
Rise of emission (in %) under scenario B against scenario A.
Emission levels generated by the proposed HRES.
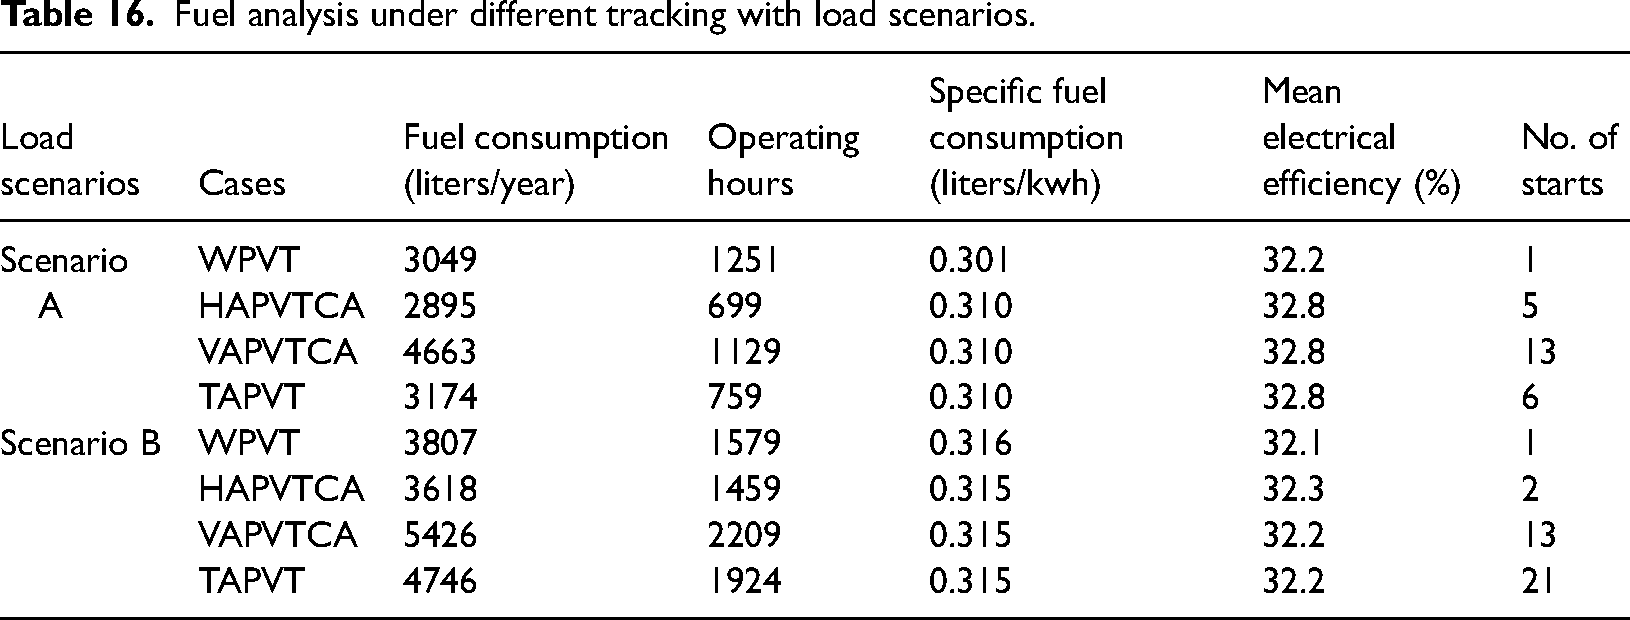
Fuel analysis
The important fuel parameters like FC, OH, SFC, MEE, and NS, are studied in this section. The percentage of FC was around 37.91%, achieved by HAPVTCA against VAPVTCA, under scenario A. The reduction rates of HAPVTVA against WPVT and TAPVT were reported as 5.05% and 8.79%, respectively. Under scenario B, 33.32% of the fuel utilization, was reported by HAPVTCA against VAPVTCA. The reduction rates of HAPVTVA against WPVT and TAPVT were reported as 5.05% and 8.79%, respectively.
The OH reported 699 and 1459 h/year by HAPVTCA, under Scenarios A and B respectively. The SFL values ranged from 0.301 to 0.310 L/kWh, under scenario A and from 0.315 to 0.316 L/kWh under scenario B. Similarly, the MEE ranged from 32.1 to 32.8%. The NS for generator reported 1 as minimum by WPVT under both scenarios and 21 as maximum by TAPVT under scenario B. The outcomes of fuel parameters are given in Table 16. From these findings, HAPVTCA was found to have the dominant solutions against all remaining cases.
Fuel analysis under different tracking with load scenarios.
Additional analysis
The sensitivity analysis was undertaken for the optimized HRES under scenario A. Fuel price and the percentage inflation rate were considered as major sensitivity input parameters, relating to the cost parameters like total NPC, OC and COE. The range of fuel price was from 1.14$/L (average Indian price of diesel) to 1.5$/L, while the percentage inflation rate was from 2.0 to 5.0. The NPC and OC prices escalated with the rise in inflation rate and the lowest optimized outcomes of COE were obtained from maximized expected inflation rate. NPC and OC were affected by the increasing of expected inflation rate. Percentage reductions in NPC and OC were 5.69% and 2.23% respectively, obtained from the nominal fuel rate with the least inflation rate. The results of sensitivity analysis, related to NPC, OC, and COE, are depicted in Figure 13 and the FC, NPC, and OC, superimposed with COE for WPVT, are given in Figure 14.
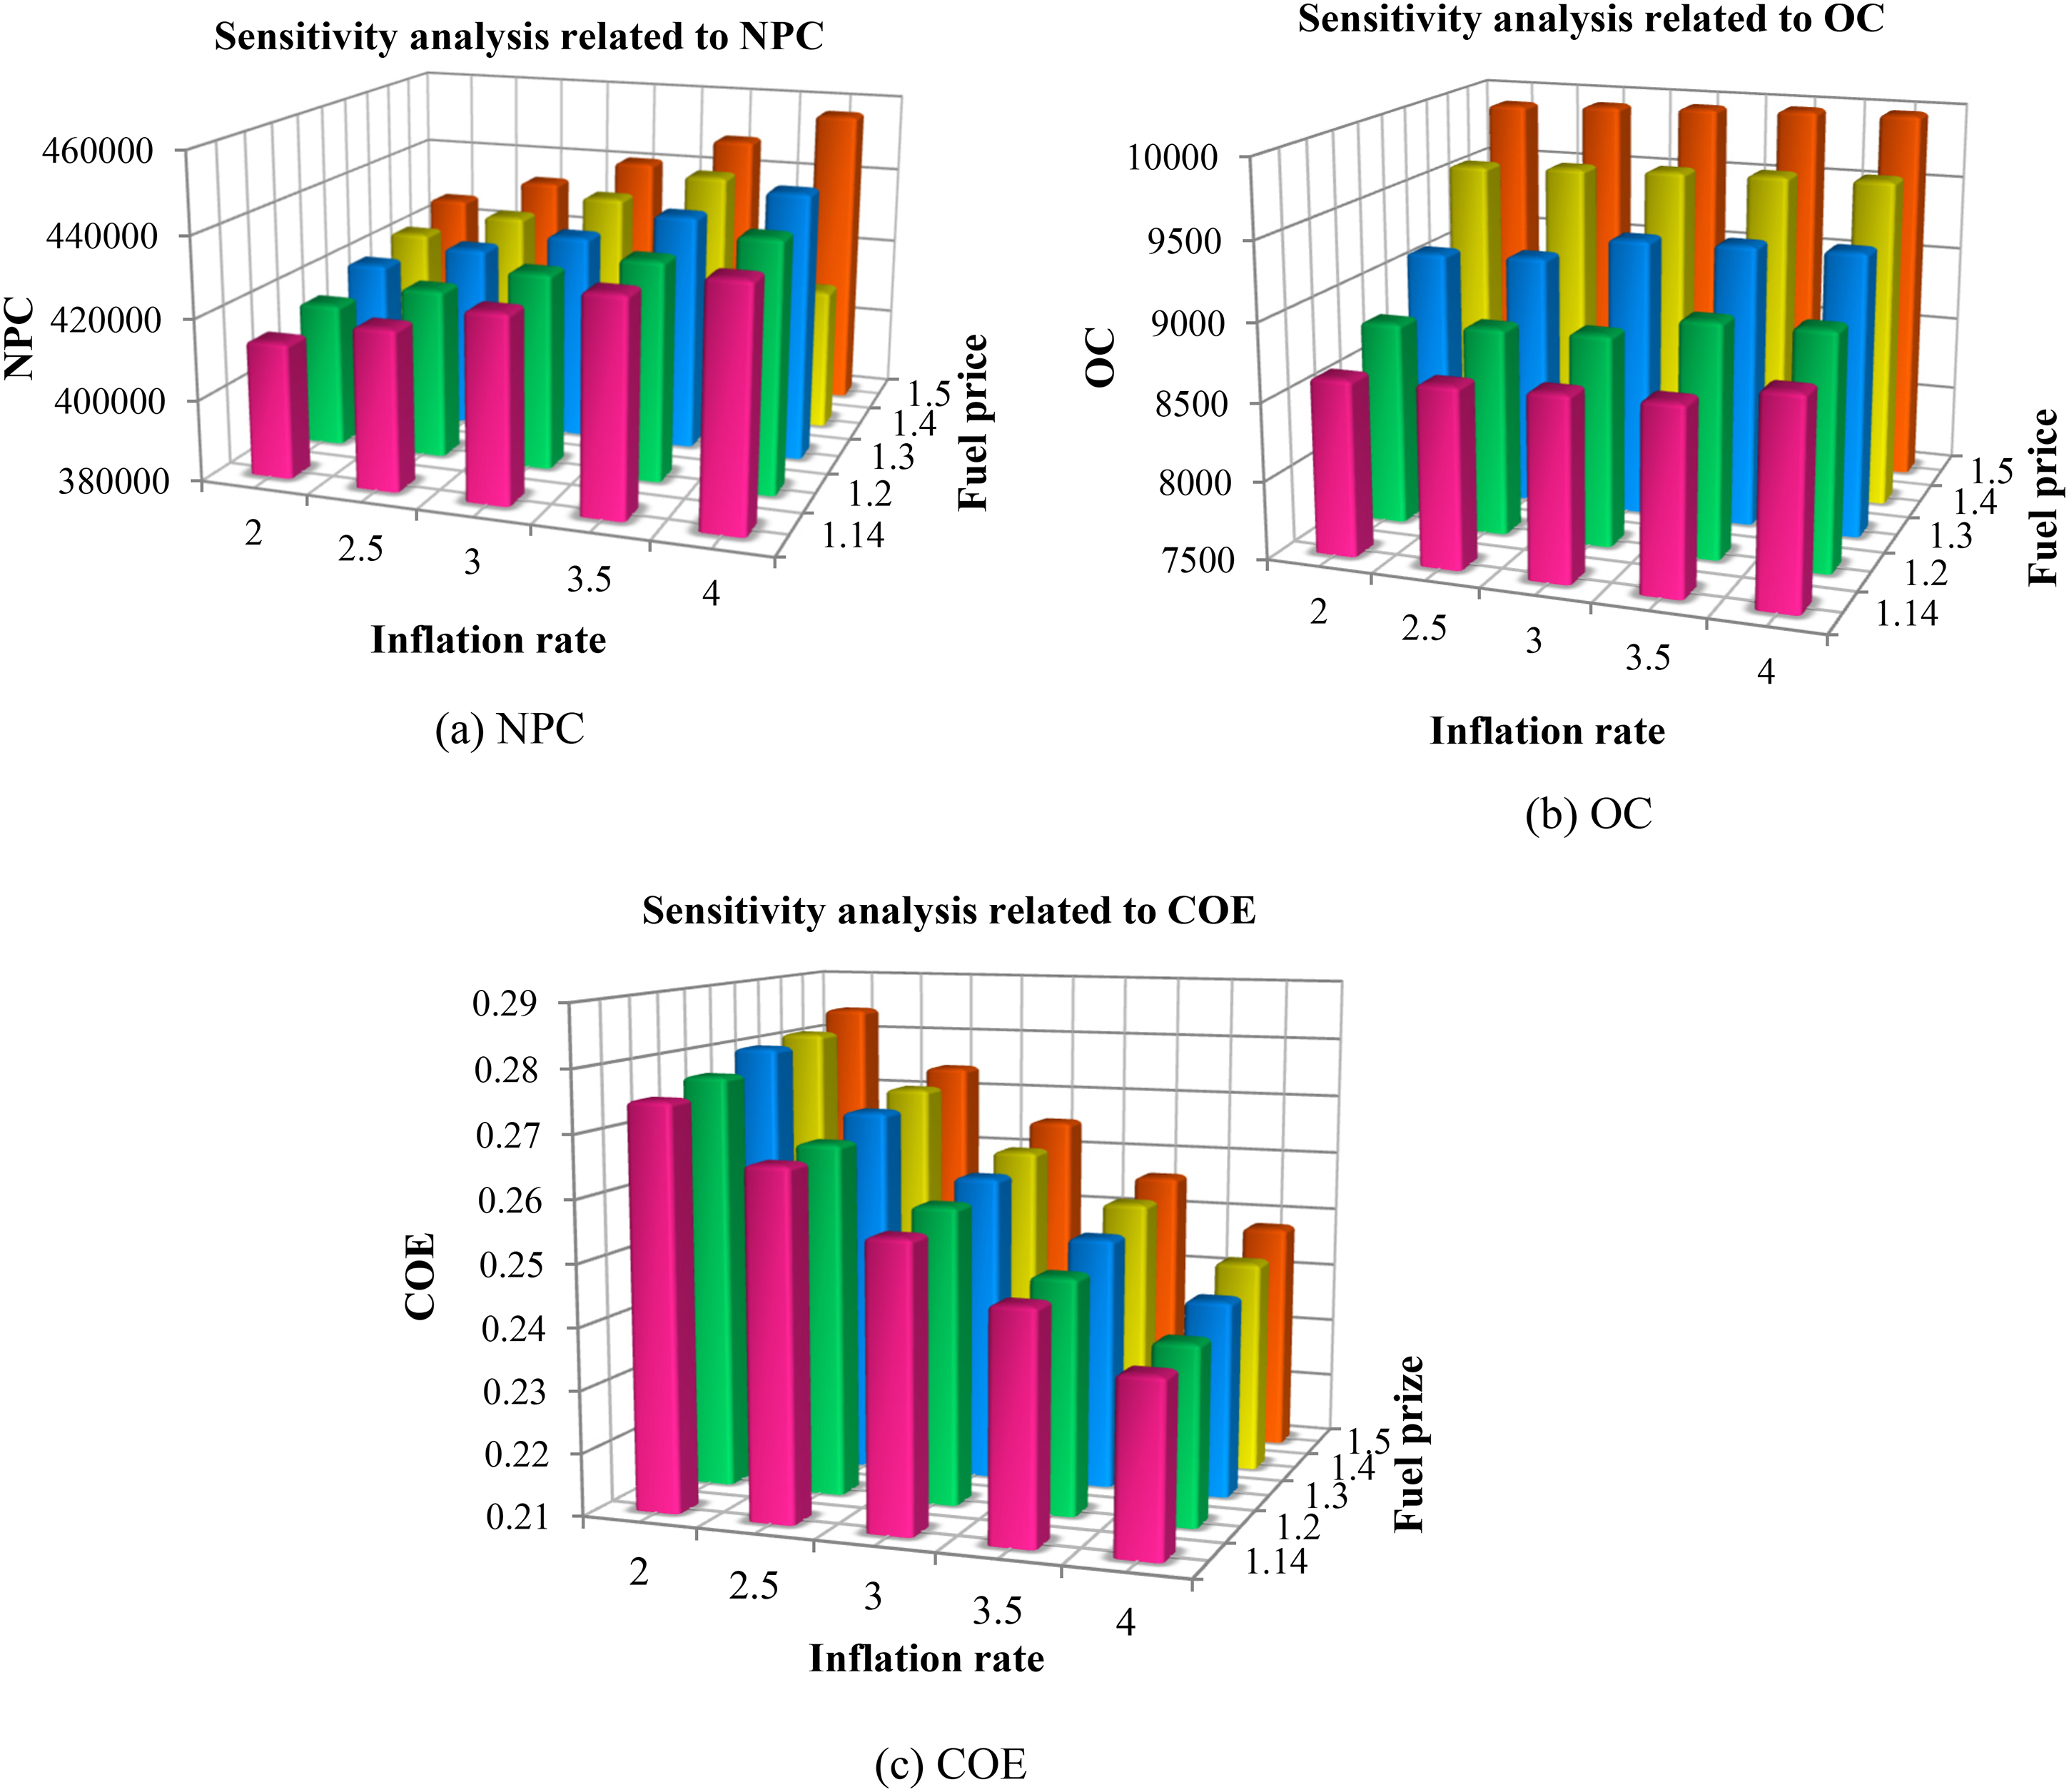
Sensitivity analysis related to NPC, OC and COE.
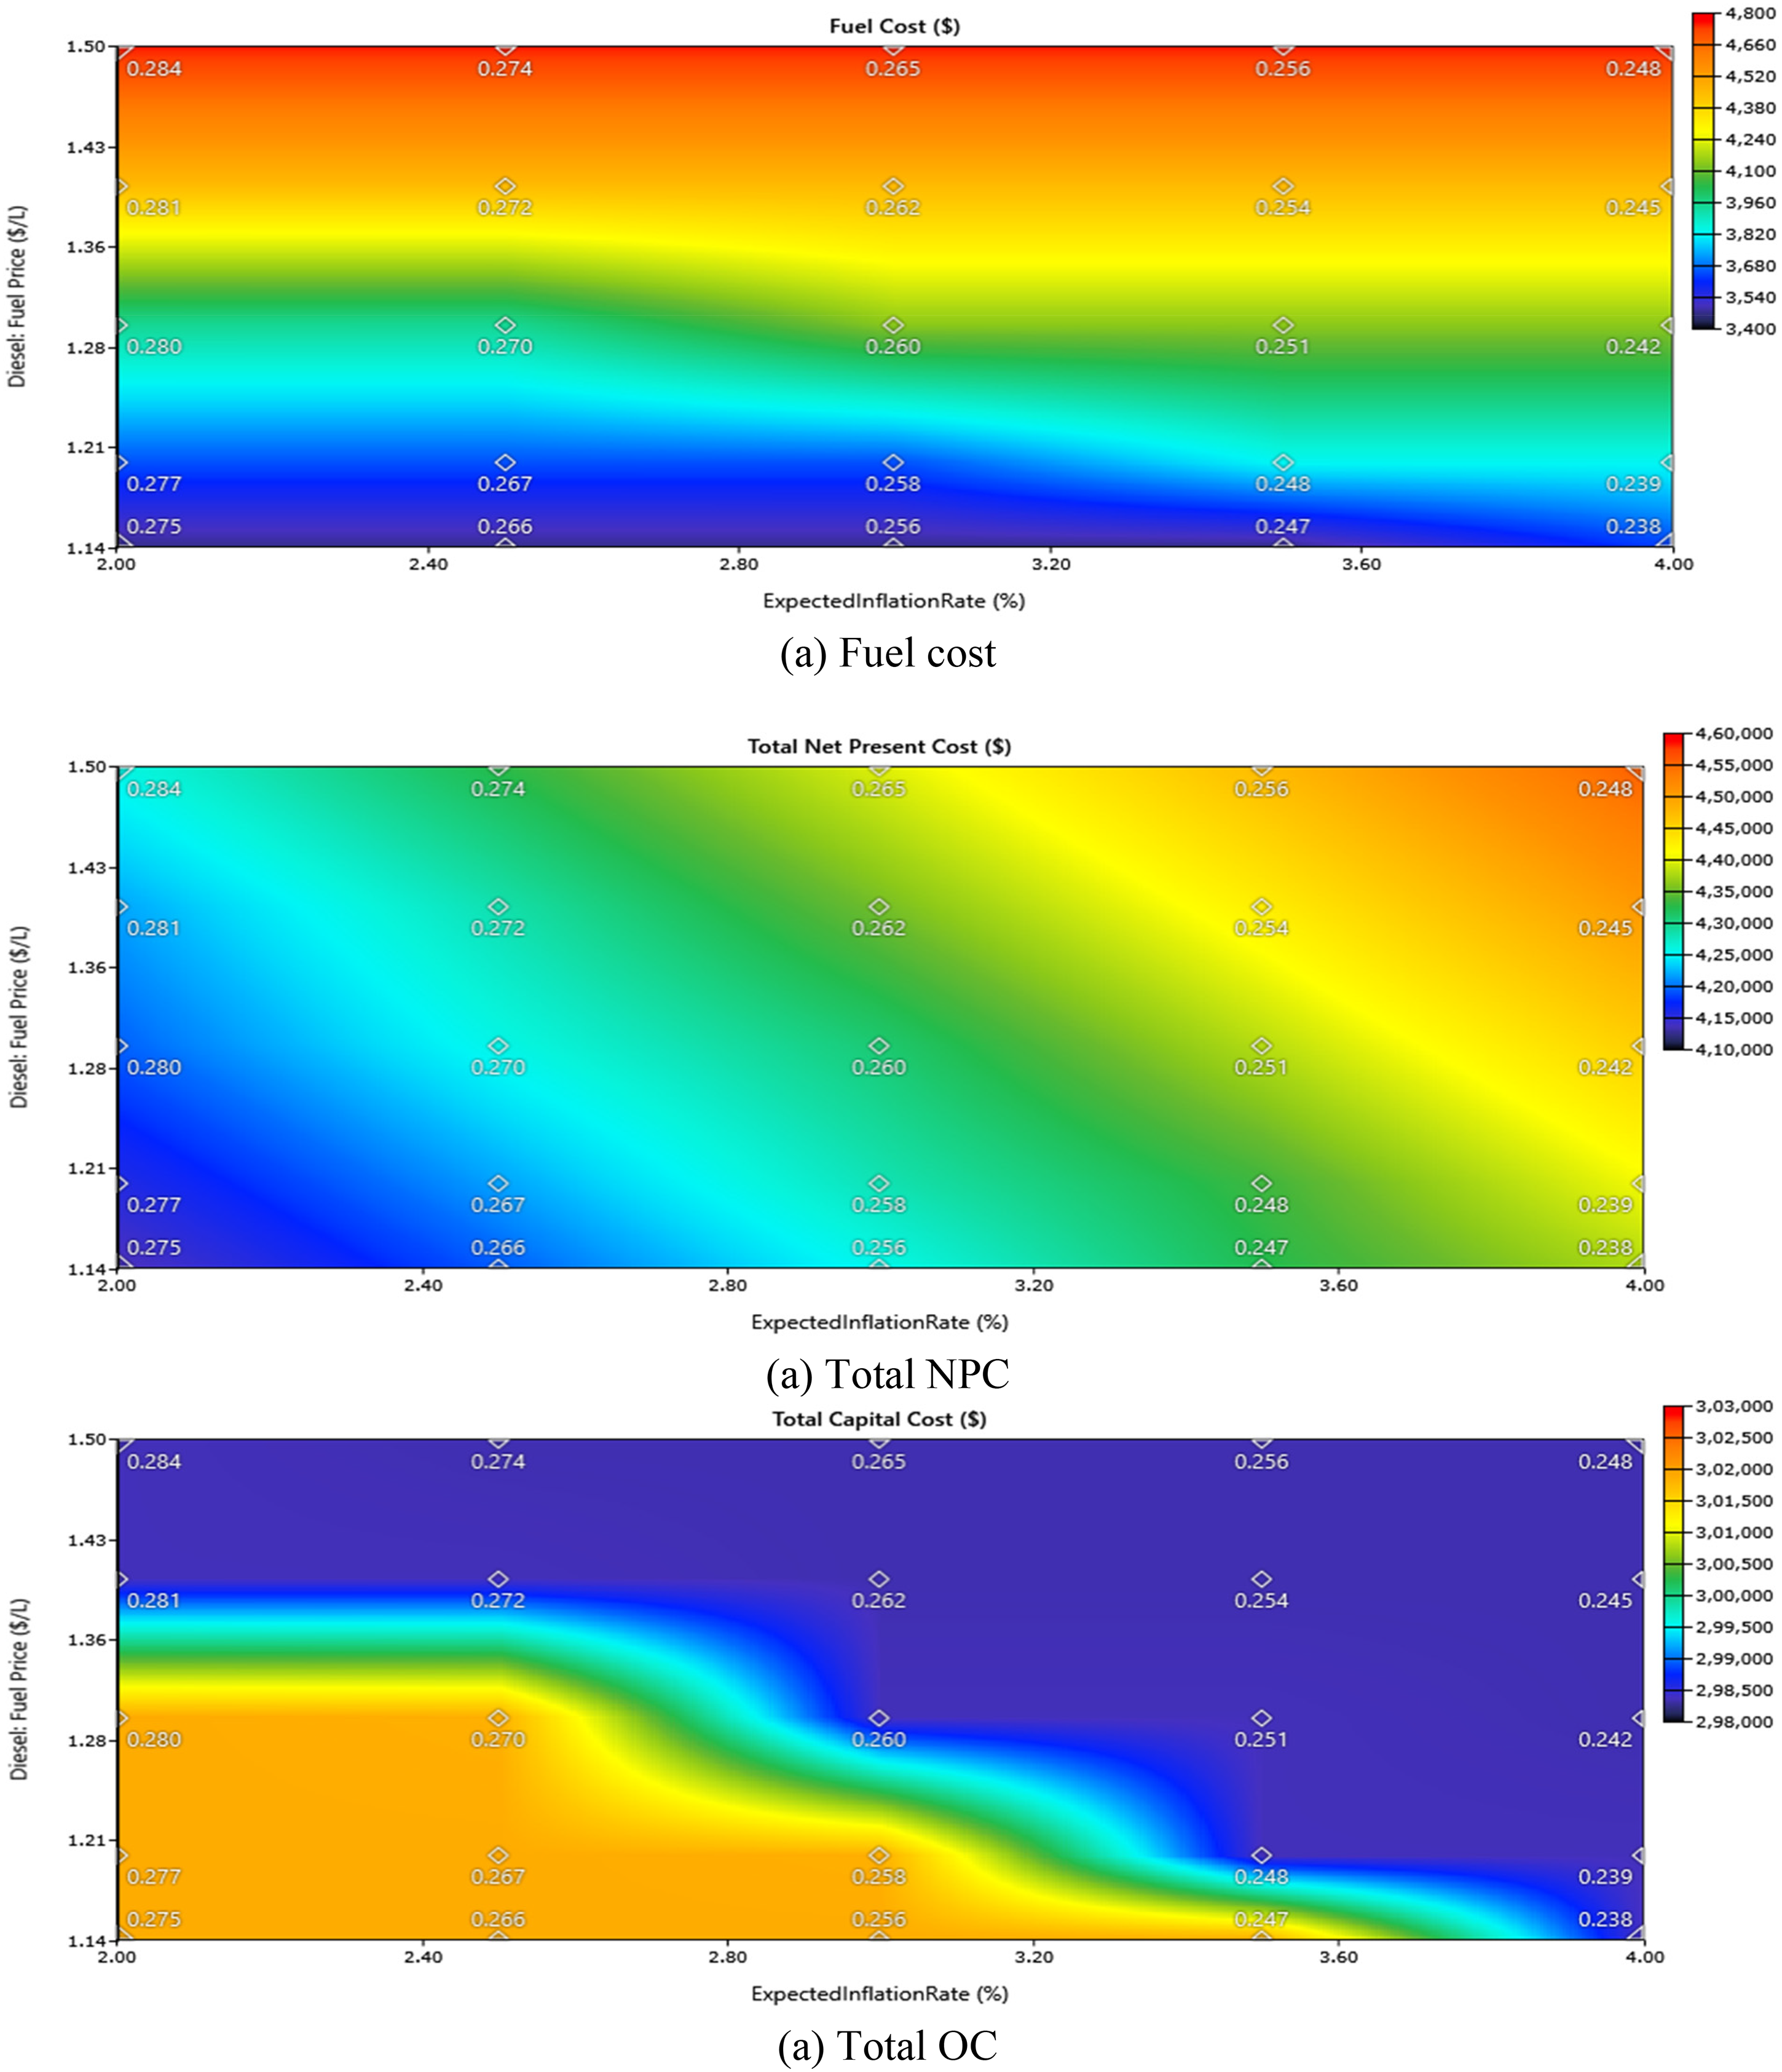
Sensitivity analysis of fuel cost, NPC and OC superimposed with COE under scenario A, for case WPVT.
The term, payback, means to recover the investment in a short period of time. In a HRES, the base case system, which is based on conventional energy source alone, is needed to calculate the payback period. In this study, the detailed payback parameters like, present worth, annual worth, internal rate of return, return on investment, simple payback and discounted payback, were analyzed between scenarios A and B.
The reduced present worth and annual worth were reported in WPVT and TAPVT by scenarios A and B respectively. Minimum internal rate of return and return on investment were evidenced in WPVT and HAPVTCA, respectively, under scenarios A and B.
The simple payback period is recorded as fewer years in TAPVT, under scenario A and in VAPVTCA under scenario B. But both outcomes were found to be minimum values in TAPVT, for discounted payback years. It can be concluded that TAPVT reported best optimal values against simple and discounted paybacks. The detailed outcomes of all payback parameters are depicted in Figure 15.
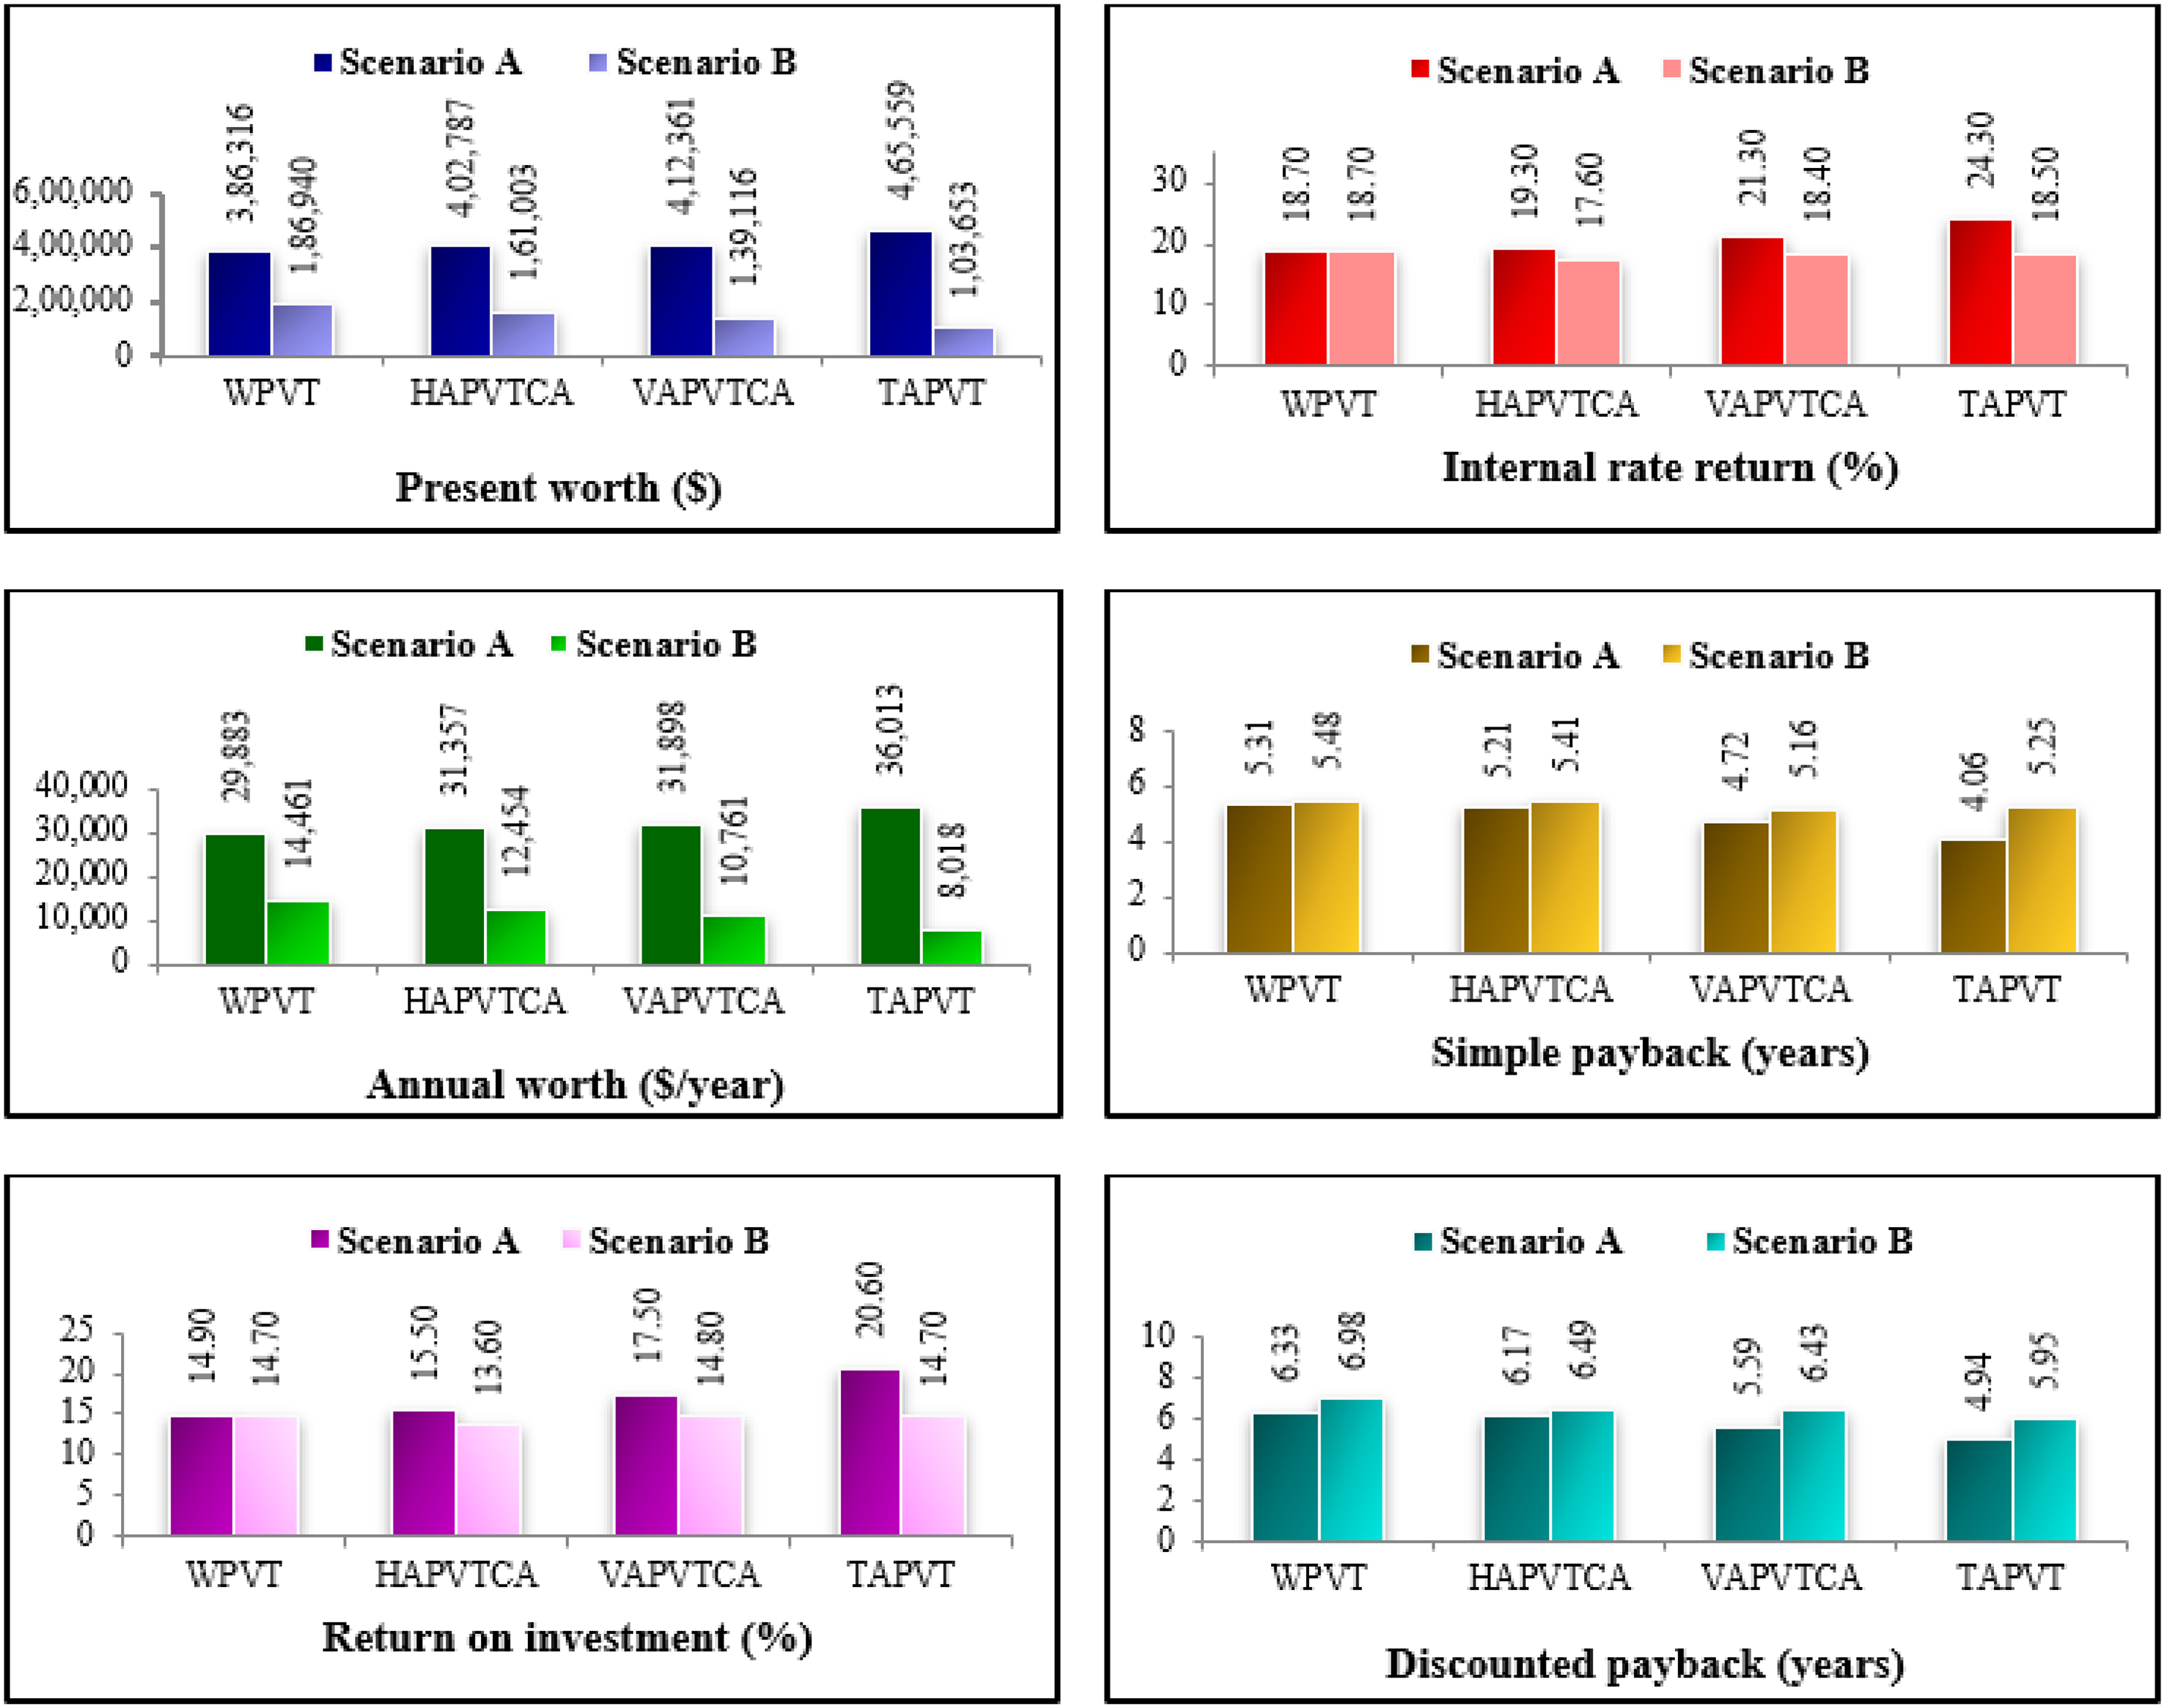
Payback analysis comparison between scenario A and B under WPVT.
In the battery performance analysis, the maximum energy output (kWh/year) was reported in TAPVT, under both scenarios A and B and it was found in WPVT, under scenario C. The minimized energy losses (kWh/year) were obtained from HAPVTCA, under scenario A. VAPVTCA was proved to be the same for scenarios B and C. In converter side, the maximized inverter and rectifier capacity factor were reported in TAPVT and WPVT, respectively, under both scenarios A and B. It was proved the same in WPVT, under scenario C. Energy losses (kWh/year) for inverter and rectifier were recorded as the least in WPVT and TAPVT respectively, under scenario A. VAPVTCA and TAPVT attained the least amount of energy losses, for the same platform, under scenario B. WPVT and HAPVTCA reported outcomes under scenario C, under the same parameter. The state of charging of battery for all scenarios under WPVT is shown in Figure 16 and the extensive battery and converter properties, under different tracking with load scenarios, are depicted in Tables 17 and 18, respectively. Based on the converter parameter outcomes, TAPVT proved its better performance and it was highly encouraging.
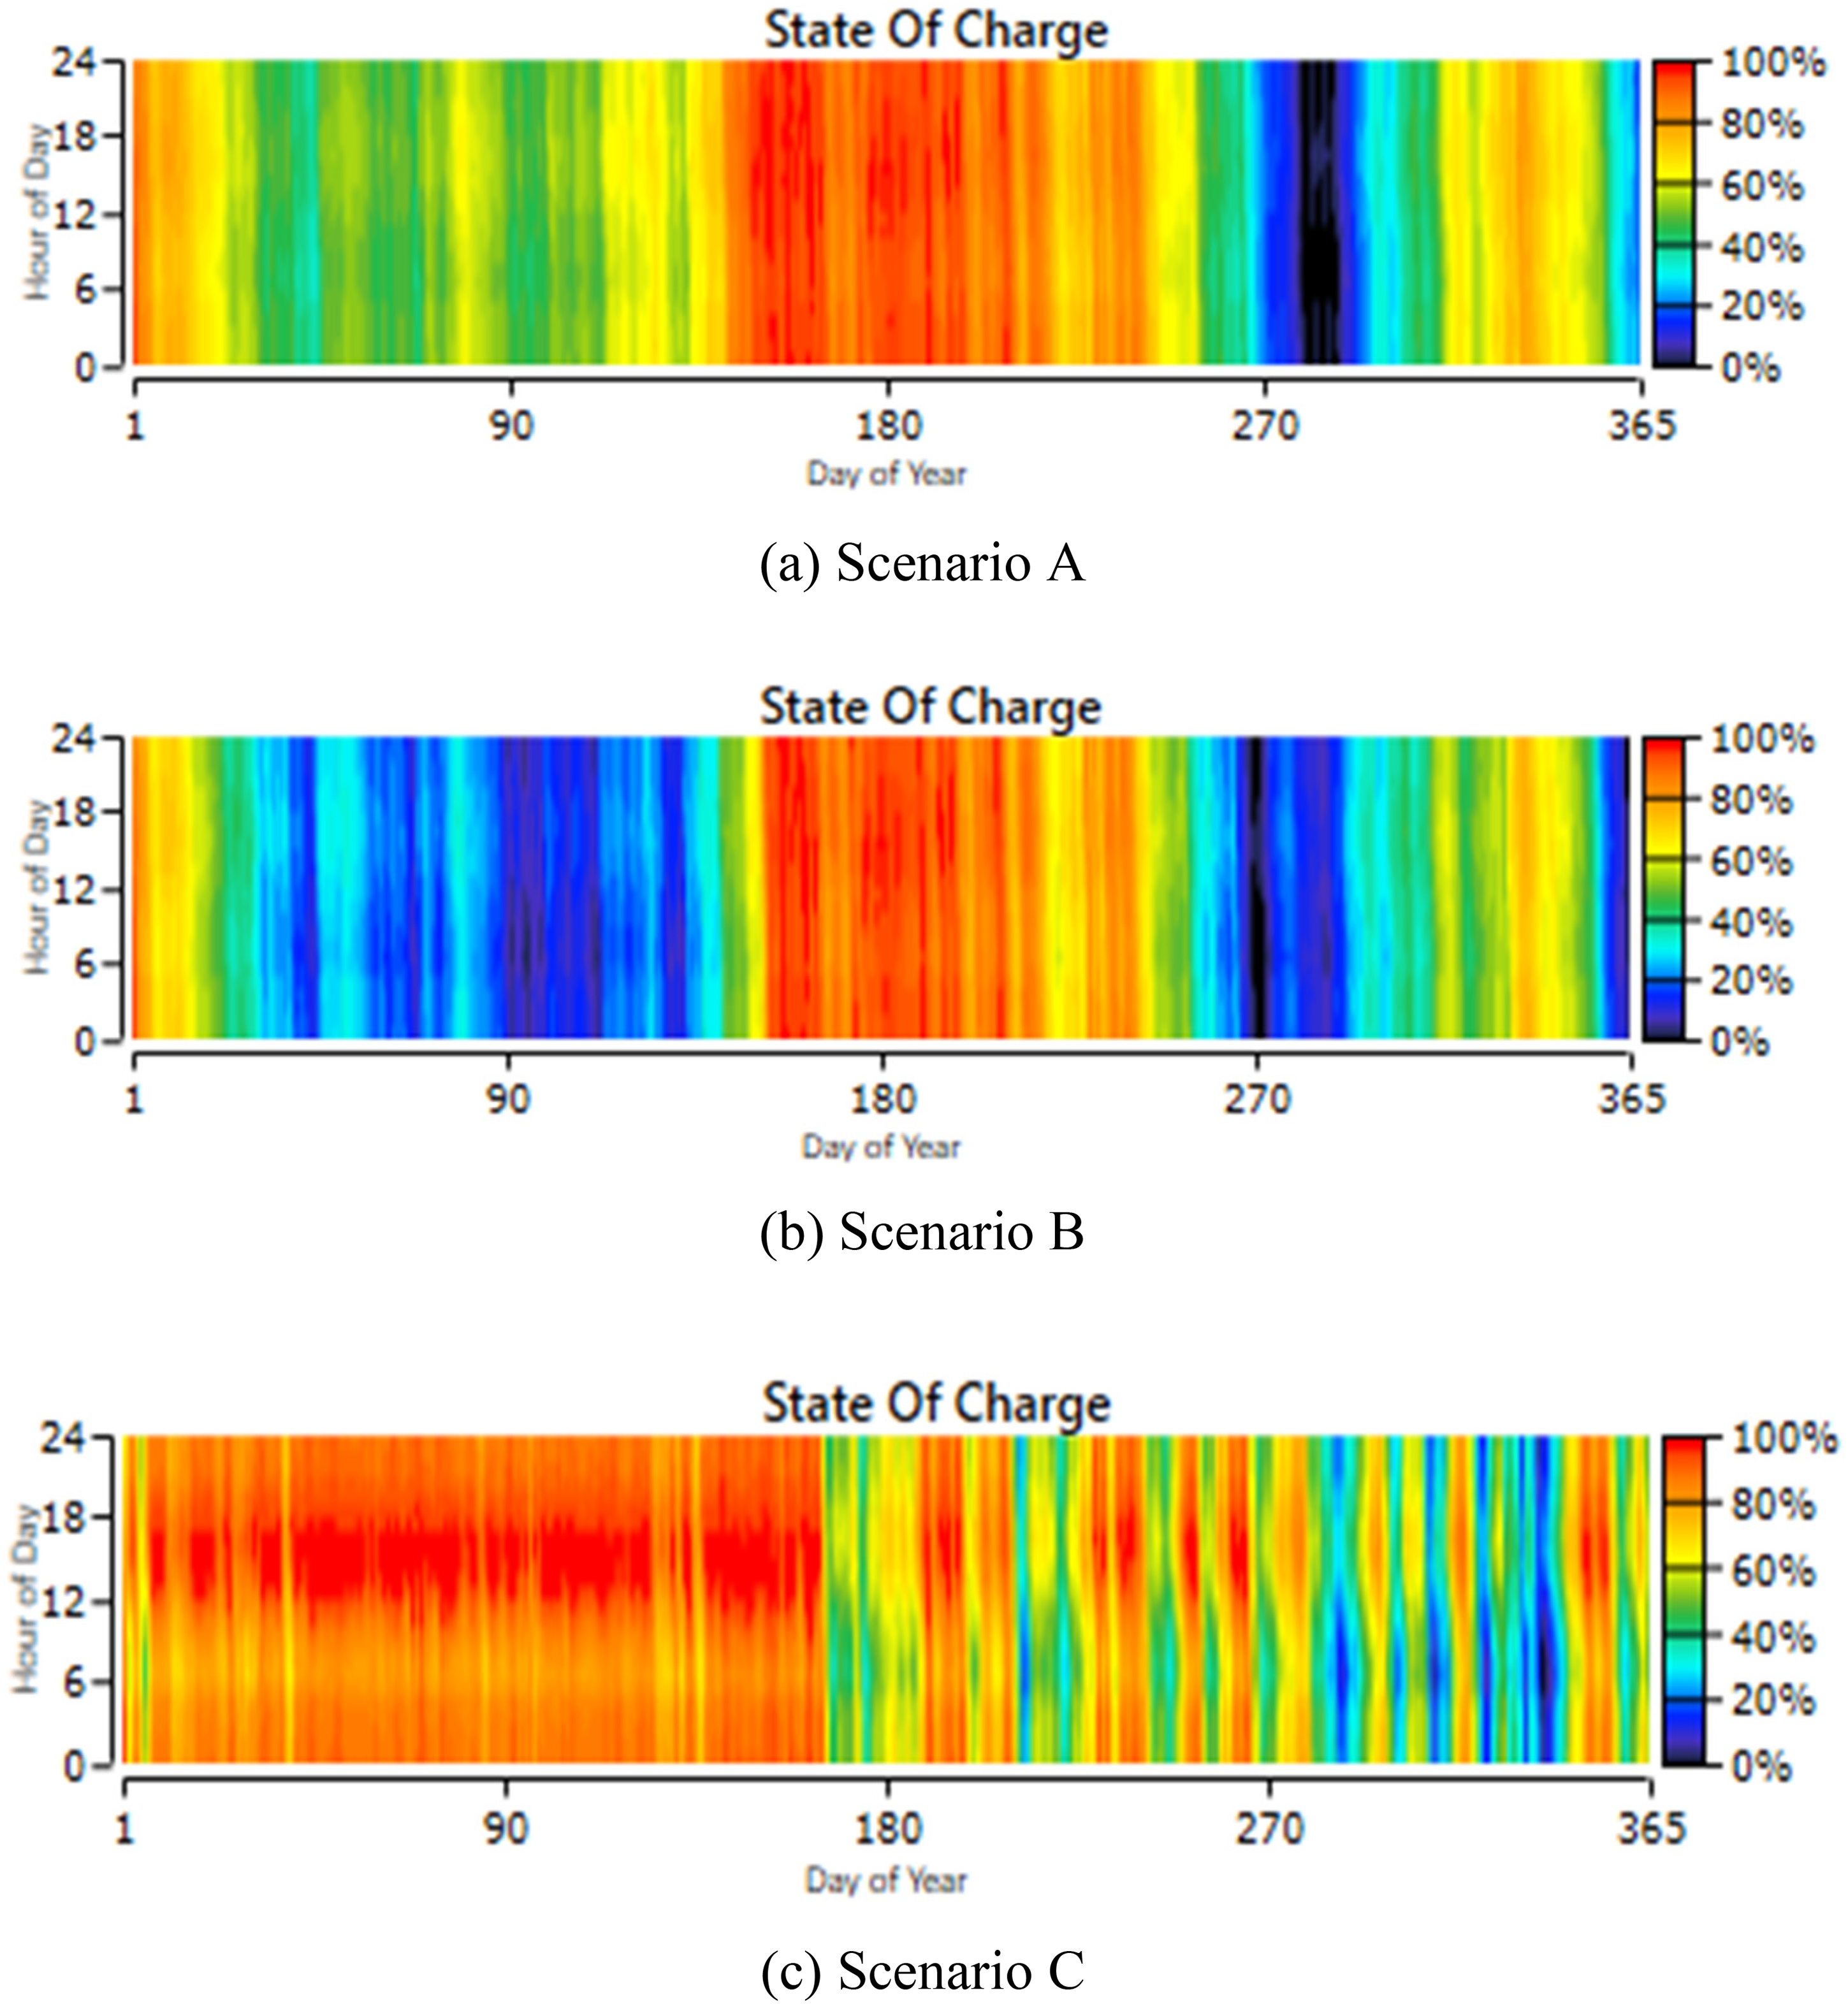
Battery state of charging (SOC) for case WPVT.
Extensive battery properties under different tracking with load scenarios.
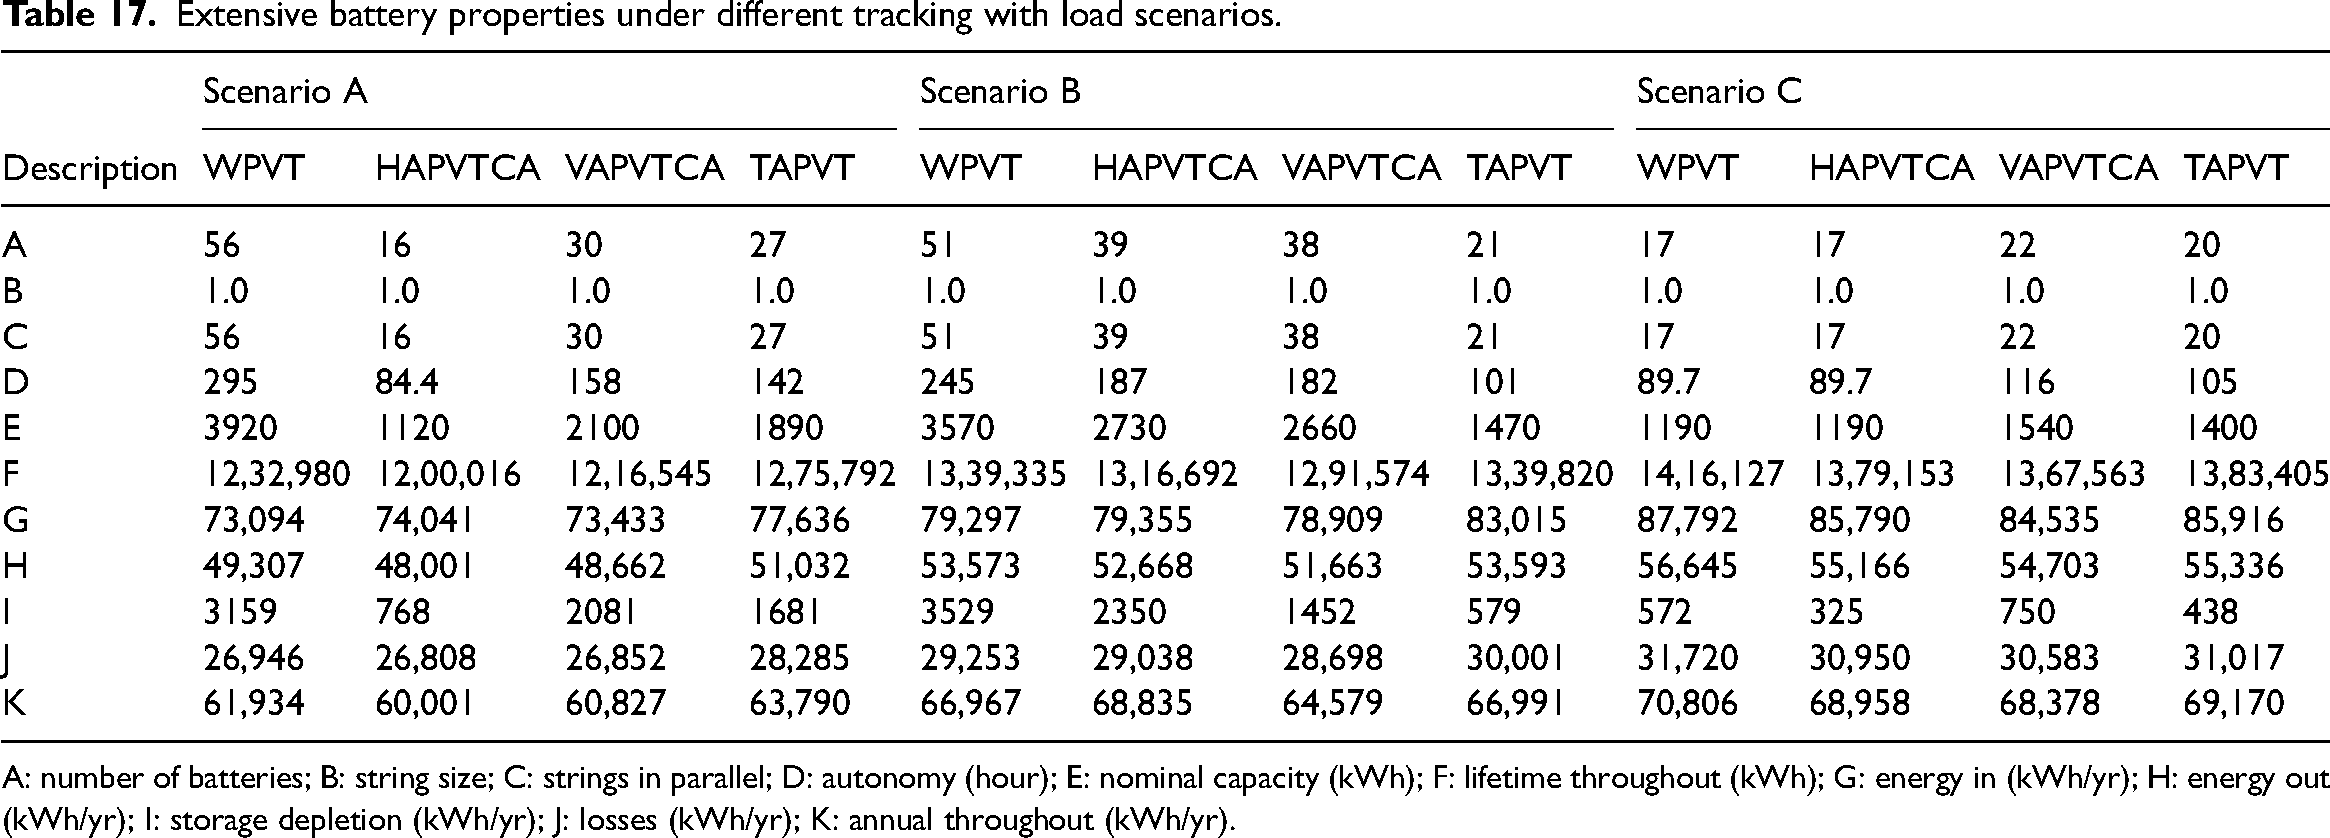
A: number of batteries; B: string size; C: strings in parallel; D: autonomy (hour); E: nominal capacity (kWh); F: lifetime throughout (kWh); G: energy in (kWh/yr); H: energy out (kWh/yr); I: storage depletion (kWh/yr); J: losses (kWh/yr); K: annual throughout (kWh/yr).
Extensive
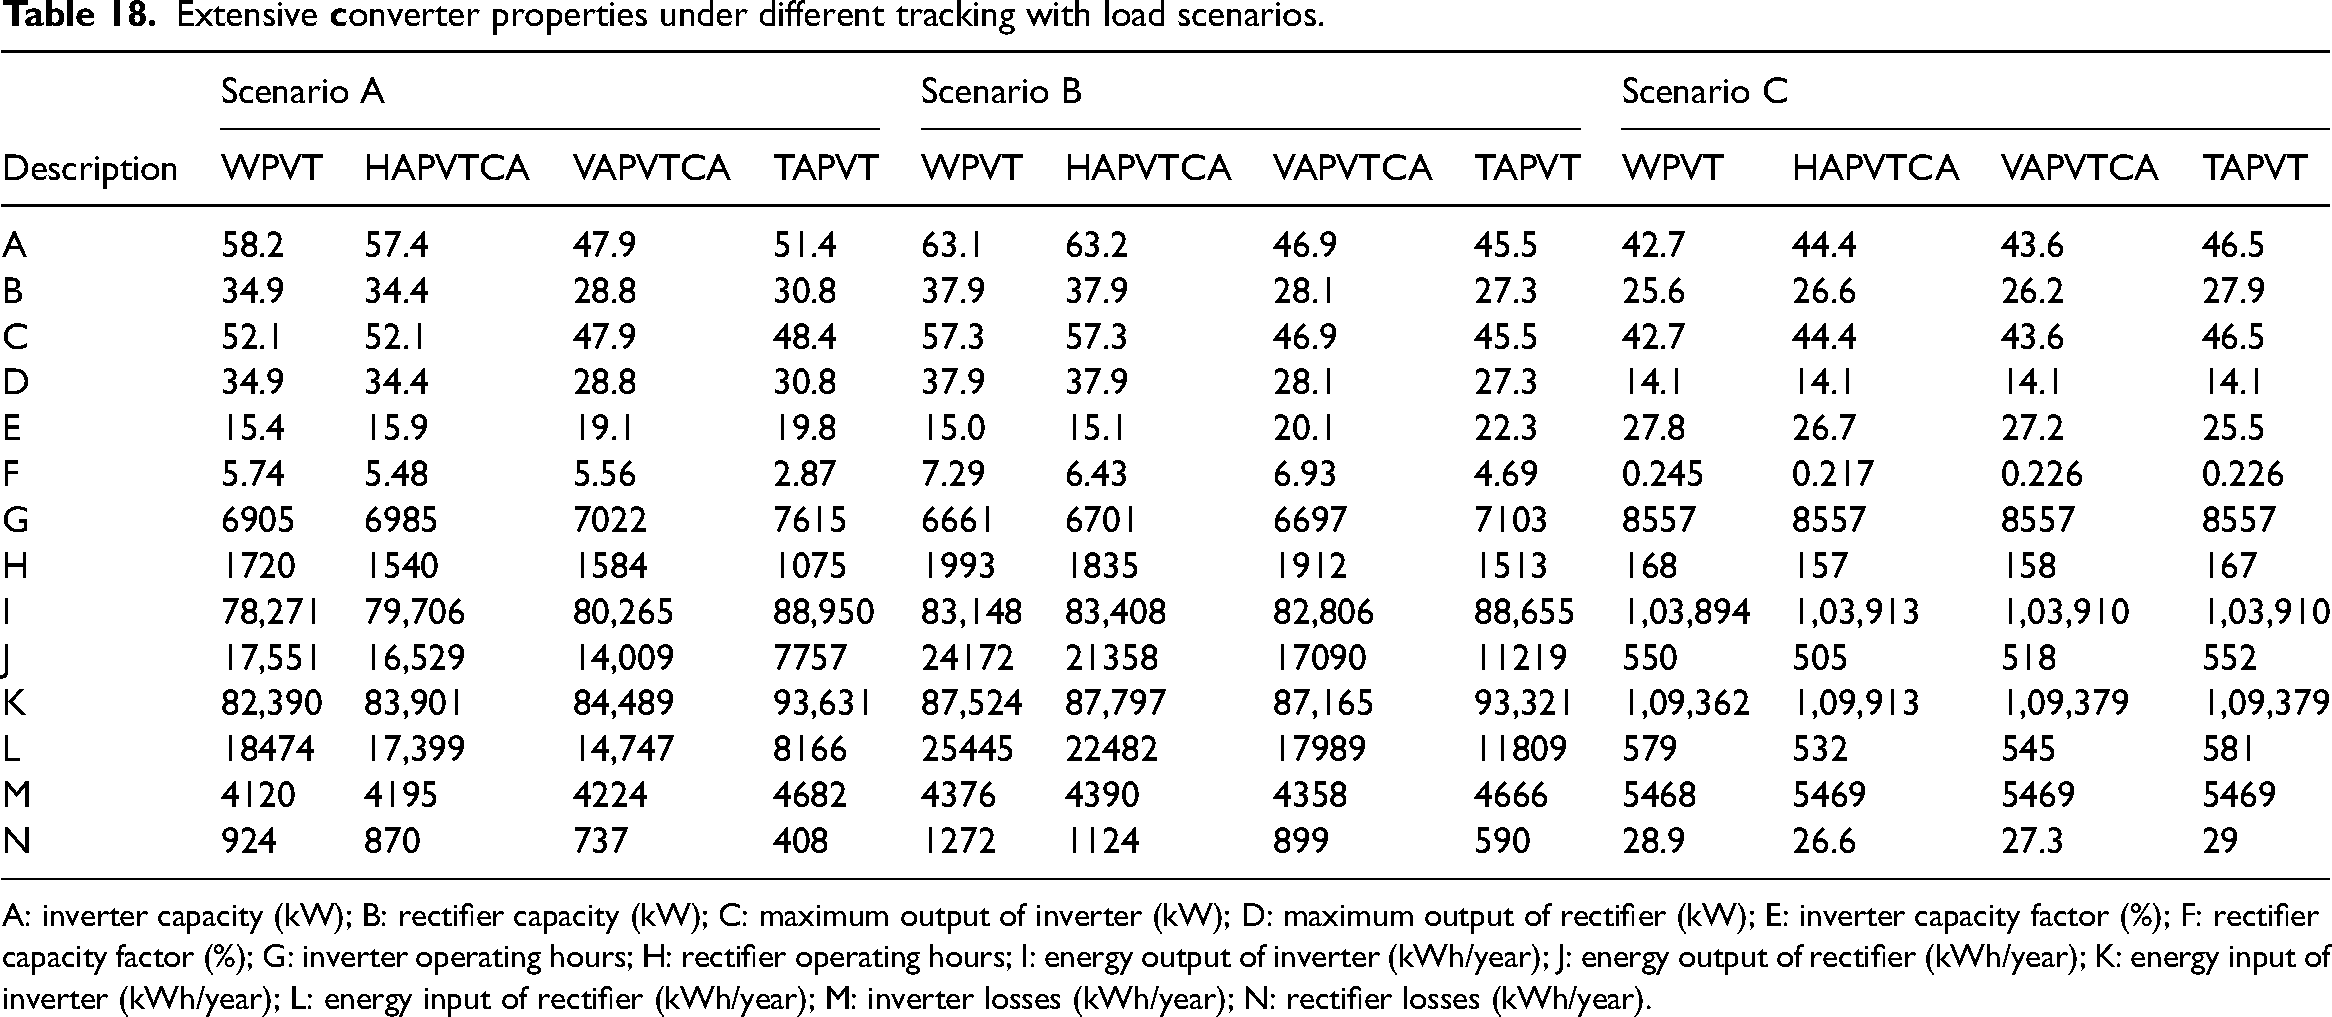
A: inverter capacity (kW); B: rectifier capacity (kW); C: maximum output of inverter (kW); D: maximum output of rectifier (kW); E: inverter capacity factor (%); F: rectifier capacity factor (%); G: inverter operating hours; H: rectifier operating hours; I: energy output of inverter (kWh/year); J: energy output of rectifier (kWh/year); K: energy input of inverter (kWh/year); L: energy input of rectifier (kWh/year); M: inverter losses (kWh/year); N: rectifier losses (kWh/year).
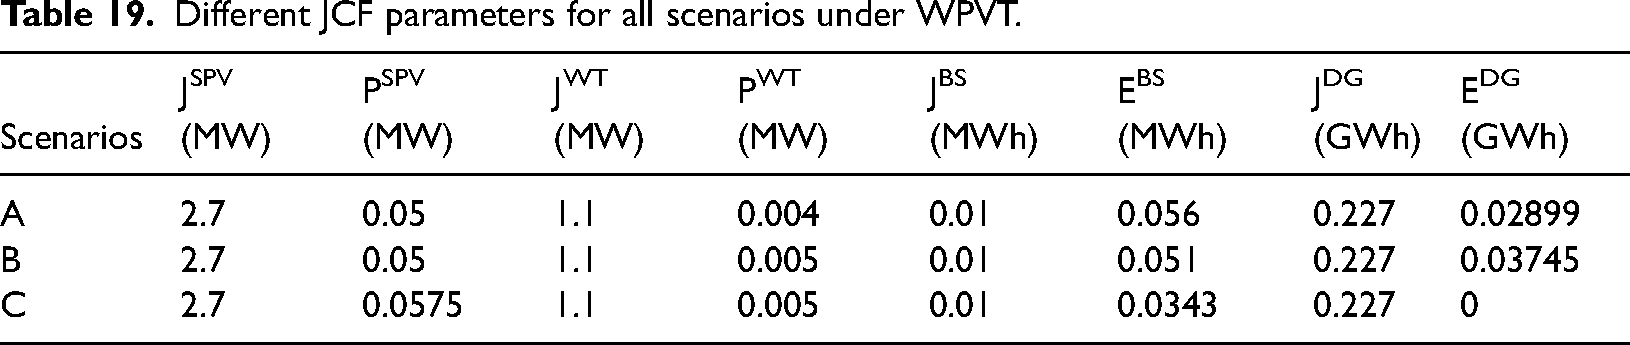
The range of job creation, including all stages like installation, operation and maintenance jobs for SPV and wind generation power system was from 0.5 to 7.6 and 0.2 to 2.9 jobs/MW respectively. The average jobs for both power generating systems were 2.7 and 1.1 jobs/MW. Likewise, the job creation for battery system can be taken as 0.01 jobs/MWh. 66 In diesel power generation, it was from 0.17 to 0.34 jobs/GWh and an average of 0.227 jobs/GWh was considered in this study. 67 The net JCF of the proposed HRES design were 0.14654, 0.14951 and 0.16109 under scenarios A, B, and C, respectively, under WPVT. The corresponding values of JCF parameters are given in Table 19. The percentage REF values, for scenarios A and B, are depicted in Figure 17 and it proved the utmost delivery of energy utilized by renewable energy sources.
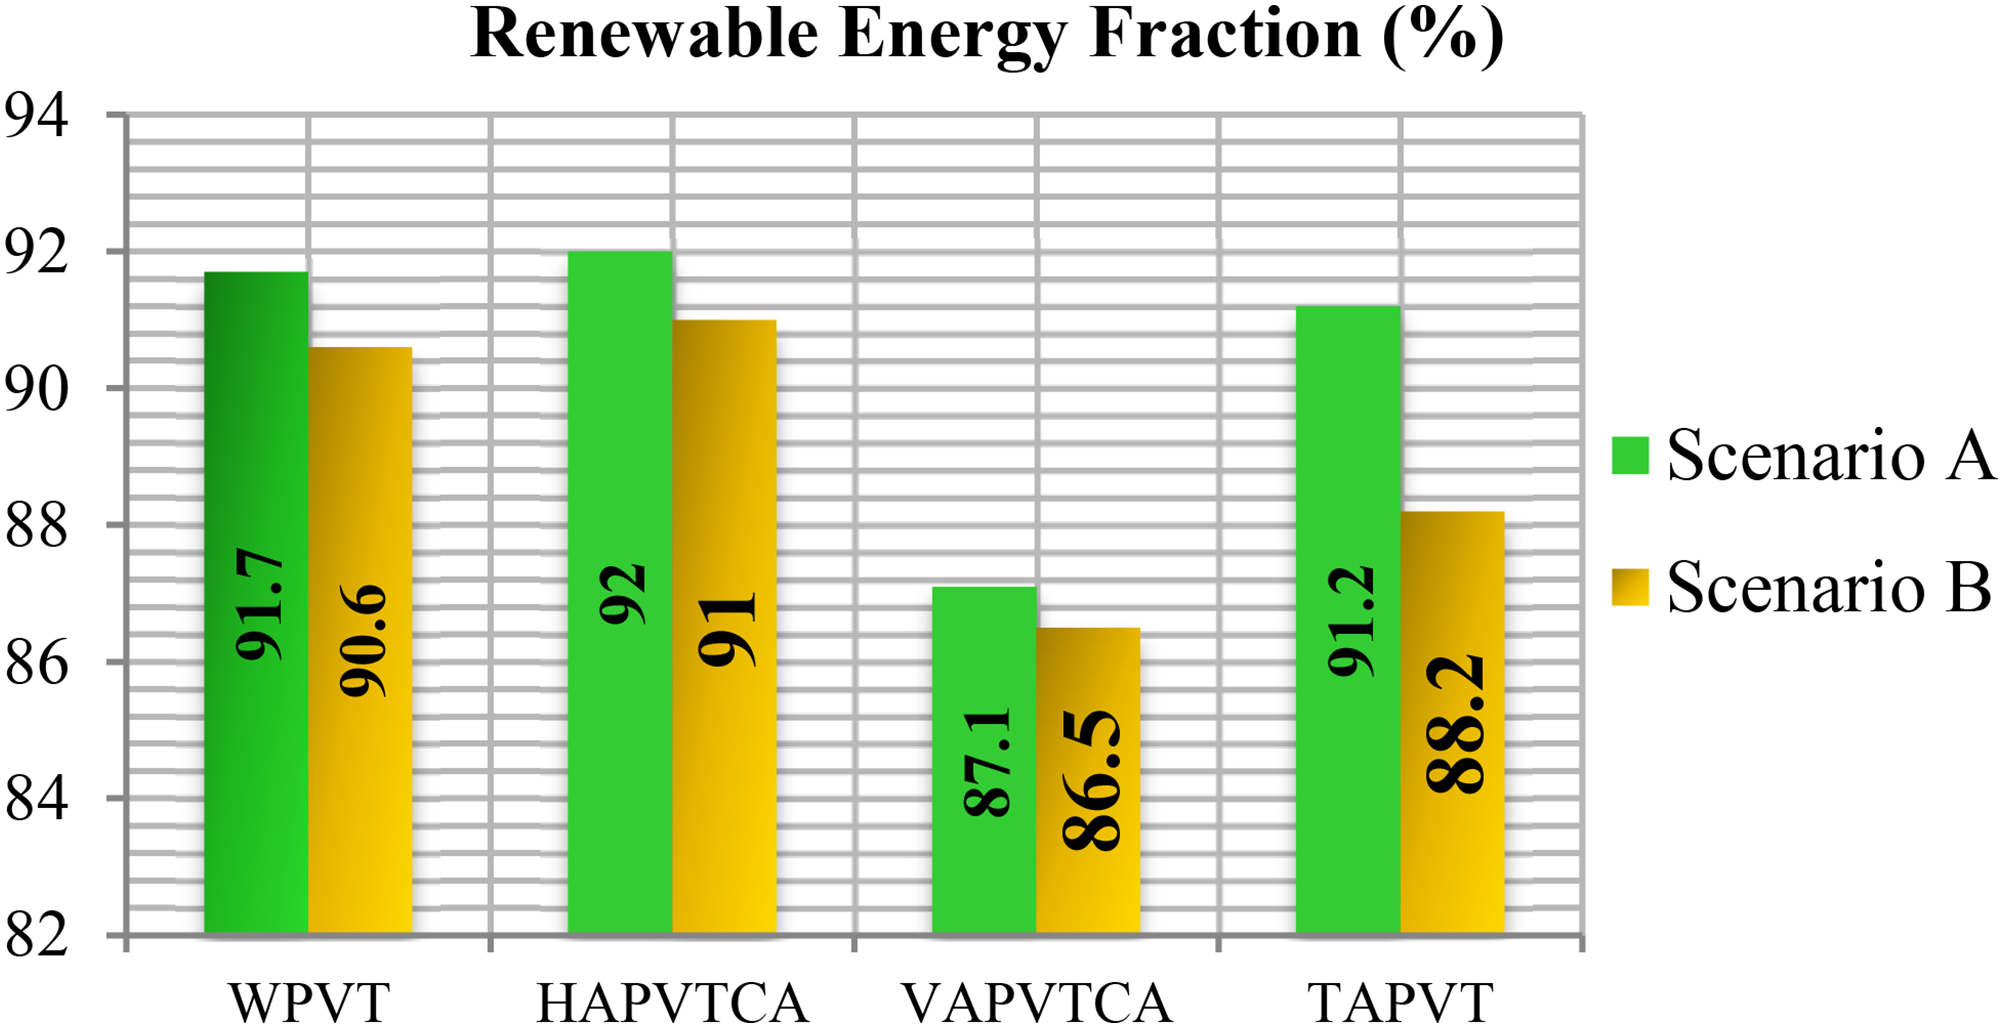
Percentage of REF values comparison for scenarios A and B.
Different JCF parameters for all scenarios under WPVT.
The JCF analysis in this study quantifies the impact of the proposed HRES on local employment. The methodology for calculating the JCF involves evaluating the direct, indirect, and
Conclusions
This study demonstrates the technical, economic, and societal benefits of a HRES for tribal residential schools and hostels in remote areas. The integration of solar, wind, and diesel generation provides a reliable and sustainable energy solution that minimizes fuel consumption, operating costs, and CO2 emissions, while maximizing energy production. The analysis highlights a positive return on investment (ROI) and a favorable JCF, contributing significantly to local employment and community development. Beyond these immediate benefits, this research underscores the broader significance of HRES in the context of remote electrification. In areas where grid extension is impractical or too costly, off-grid renewable energy solutions like HRES offer a viable alternative, providing clean, affordable, and reliable energy. This system not only addresses energy access issues but also supports sustainable development goals by promoting economic empowerment, improving education, and fostering local employment in underserved regions. Recommendations include further optimization of the system's configuration to reduce costs and enhance efficiency, as well as exploring energy storage solutions for improved reliability. It is also suggested that future work evaluate the scalability of the HRES to larger communities and assess its integration with smart grid technologies for better demand-response management. Ultimately, this work offers valuable insights for sustainable electrification efforts in remote communities globally, showcasing how hybrid renewable energy systems can play a pivotal role in shaping a greener, more resilient future for isolated populations and contributing to the global transition to clean energy.
Footnotes
Declaration of conflicting interests
The authors declared no potential conflicts of interest with respect to the research, authorship, and/or publication of this article.
Funding
The authors received no financial support for the research, authorship, and/or publication of this article.