
Abstract
Perovskite solar cells (PSCs) are among the most extensively studied photovoltaic technologies due to their excellent performance. A PSC device consists of multiple layers, including a perovskite absorber layer, electron transport layer (ETL), hole transport layer (HTL), and top and bottom conducting layers. The appropriate combination of these layers is crucial for achieving excellent PSCs. In this study, we explore the use of unconventional materials as ETLs for PSCs, specifically binary 3d transition metal oxides (TMOs) such as α-Fe2O3, ZnO, and Cr2O3. These materials exhibit excellent optoelectronic and semiconducting properties, making them promising candidates for ETLs in PSCs. We conduct a detailed analysis of the effects of α-Fe2O3, ZnO, and Cr2O3 as ETLs, focusing on how their structural and electronic properties influence PSC performance. Our investigation includes extensive characterization using X-ray diffraction (XRD), scanning electron microscope (SEM), Fourier transform infrared (FTIR) spectroscopy, atomic force microscopy (AFM), ultraviolet-visible (UV-Vis) spectroscopy, and solar simulator. We believe this study will provide valuable insights into the exploration of 3d TMOs as effective ETLs for PSCs. Furthermore, our findings could open new possibilities for utilizing unconventional layer combinations in PSCs, ultimately contributing to the development of high-performance PSCs.
Introduction
The rapid development of solar cell technology has the potential to address global energy and environmental challenges. As a result, various types of solar cells have been developed, including perovskite solar cells (PSCs). PSCs are known for their excellent performance; however, their stability remains a major challenge, limiting their widespread utilization as a reliable energy source. PSCs are primarily composed of perovskite materials such as methylammonium lead iodide (MAPbI3). 1 This material has a direct bandgap of approximately 1.6 eV, a high light absorption coefficient of around 104 cm−1, a high dielectric constant, and an exciton binding energy of about 10 meV, lower than the thermal energy available at room temperature (26 meV). These properties make MAPbI3 material highly suitable for photovoltaic applications, as it facilitates efficient electron-hole pair generation. 2
In the configuration of PSCs, the MAPbI3 layer is combined with an electron transport layer (ETL), a hole transport layer (HTL), and top- and bottom-conducting layers, all deposited on a substrate.2,3 The proper selection and combination of these layers are very important for obtaining high-performance PSCs. In this study, we explore the potential of binary 3d transition metal oxides (TMOs): α-Fe2O3, ZnO, and Cr2O3 as alternative ETL materials. These materials possess excellent optoelectronic and semiconducting properties, as summarized in Table 1, making them promising candidates for ETLs in PSCs. However, detailed investigations into their effectiveness as ETLs remain limited. To date, high-efficiency PSCs have primarily relied on a narrow selection of ETL materials, such as SnO2 and TiO2. Therefore, further exploration of alternative ETLs, particularly binary 3d TMOs with properties comparable to SnO2 and TiO2, is essential.
The characteristics of α-Fe2O3, ZnO, and Cr2O3.
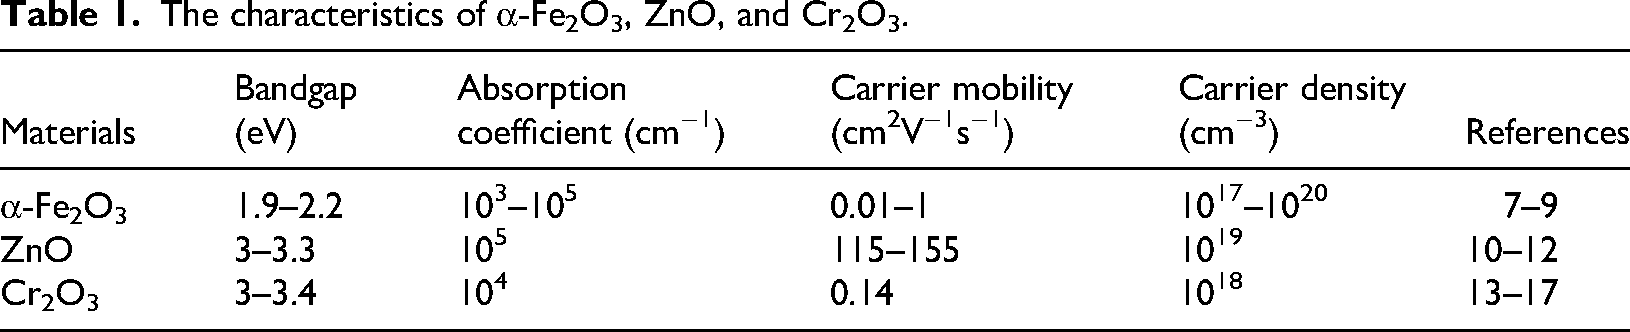
To the best of our knowledge, although ZnO is less commonly used as an ETL compared to TiO2 and SnO2, previous reports have demonstrated its potential application in PSCs. However, PSCs utilizing ZnO as the ETL have only achieved a power conversion efficiency (PCE) of around 1.44%. 4 Various modifications have been explored to improve ZnO's suitability as an ETL, including interfacial engineering, 4 doping, 5 and composite formulation. 6 In this study, we systematically compare ZnO with two rarely explored binary 3d TMOs, α-Fe2O3, and Cr2O3, as alternative ETL materials for PSCs. Through this comparison, we aim to identify key factors that determine the suitability of materials as ETLs in PSC devices.
Here, we conduct a detailed analysis of the effects of α-Fe2O3, ZnO, and Cr2O3 as ETLs in PSCs using X-ray diffraction (XRD), scanning electron microscope (SEM), Fourier transform infrared spectroscopy (FTIR), atomic force microscopy (AFM), and ultraviolet-visible (UV-Vis) measurements. We thoroughly examine how the crystal and electronic structures of these binary 3d TMOs influence their physical properties and, in turn, the overall performance of PSCs. Based on J-V analysis using a solar simulator, the PCEs of PSCs incorporating α-Fe2O3, ZnO, and Cr2O3 as ETLs were found to be 0.43%, 1.07%, and 0.63%, respectively. Although these efficiencies remain relatively low, we believe this study provides valuable insights that could drive further exploration and discovery of novel semiconductor materials, particularly binary 3d TMOs, as potential ETLs for PSCs. Additionally, this study could open new opportunities for incorporating unconventional ETL materials into PSC configurations, ultimately contributing to the development of high-performance perovskite solar cells (Table 1).
Experiments
Materials: Fe metal powder, Cr metal powder, and ZnCl2 powder 99% were purchased from Merck. HCl ≥37% was purchased from Smart Lab. Ammonia 25% and ethanol were obtained from Supelco. Fluorine-doped tin oxide (FTO) substrate and methylammonium iodide (MAI/CH3NH3I) were purchased from Greatcell. Lead iodide (PbI2) 99.99% (trace metals basis) was purchased from Tokyo chemical industry. Anhydrous dimethyl sulfoxide (DMSO), anhydrous dimethylformamide (DMF), and anhydrous chlorobenzene were obtained from Sigma Aldrich. Carbon paste (DN-CP01) was purchased from Dyenamo.
Synthesis of TMOs: α-Fe2O3, ZnO, and Cr2O3 were synthesized using the coprecipitation method. To synthesize α-Fe2O3, 3 g of Fe metal powder was dissolved in 15 mL of HCl (12.07 M). The resulting solution was filtered, and 23 mL NH4OH 25% was added until a precipitate formed. For ZnO synthesis, 1.5 g of ZnCl2 powder was dissolved in 20 mL of deionized water, followed by the dropwise addition of 5 mL of NH4OH 25% while stirring for 60 minutes until a milky white solution formed. Similarly, Cr2O3 was synthesized by dissolving 3 g of Cr metal powder in 20 mL of HCl (12.07 M) until a dark green solution was obtained. All resulting solutions were centrifuged to separate the precipitates. The obtained precipitates were then washed with deionized water until the pH was neutral and subsequently calcined at 500°C for 2 hours. Finally, the samples were grinded into powder form. After preparation, the samples were analyzed using a UV-Vis spectrophotometer (Thermoscientific Orion Aquamate 8100), XRD (Rigaku MiniFlex 600-C), and SEM–energy dispersive X-ray (EDS) (Thermoscientific Phenom ProX). The average particle size was determined using ImageJ through image segmentation of SEM images. The original SEM images were first converted to 8-bit grayscale to simplify the analysis. Thresholding was then applied to isolate individual particles from the background. Following this, the “Analyze Particles” function in ImageJ was used to extract particle size data. The resulting measurements were compiled and plotted using Origin software to generate the particle size distribution histogram.
Device Fabrication: The fabrication process began with cleaning a 2 × 2 cm2 conductive FTO substrate. α-Fe2O3, ZnO, and Cr2O3 were prepared as ETLs by dissolving 0.05 g of each precursor in 5 mL of ethanol and stirring at 700 rpm for 24 hours. Meanwhile, the MAPbI3 solution was prepared by dissolving 0.115 g of MAI and 0.363 g of PbI2 in a mixture of DMF and DMSO (4:1) under continuous stirring at 700 rpm for 3 hours at 70°C inside a glove box. Layer deposition was carried out using the spin coating method inside a glove box. Each ETL layer was obtained by deposition of 100 µL of α-Fe2O3, ZnO, or Cr2O3 solution onto the substrate, followed by spinning at 1000 rpm for 3 seconds and then at 2000 rpm for 30 seconds. The layers were then annealed at 150°C for 30 minutes. The surface quality of all ETL samples were then characterized using AFM (N8 NEUS BRUKER). Subsequently, the MAPbI3 layer was deposited by dropping 100 µL of the MAPbI3 solution onto the substrate and spinning at 1000 rpm for 10 seconds, followed by 3000 rpm for 30 seconds, with an antisolvent added during the last 15 seconds. The MAPbI3 layer was annealed at 70°C until it turned dark brown, followed by further heating at 100°C for 10 minutes. Next, a carbon top electrode was deposited using the doctor blade method and annealed at 100°C for 15 minutes. The schematic of the fabricated solar cell devices is shown in Figure 1. Finally, the performance of the fabricated PSCs was evaluated through J-V analysis using a calibrated Oriel solar simulator (Newport) under AM 1.5G illumination at 100 mW/cm². Data acquisition was performed with a high-precision Keithley SMU2400 source meter unit.
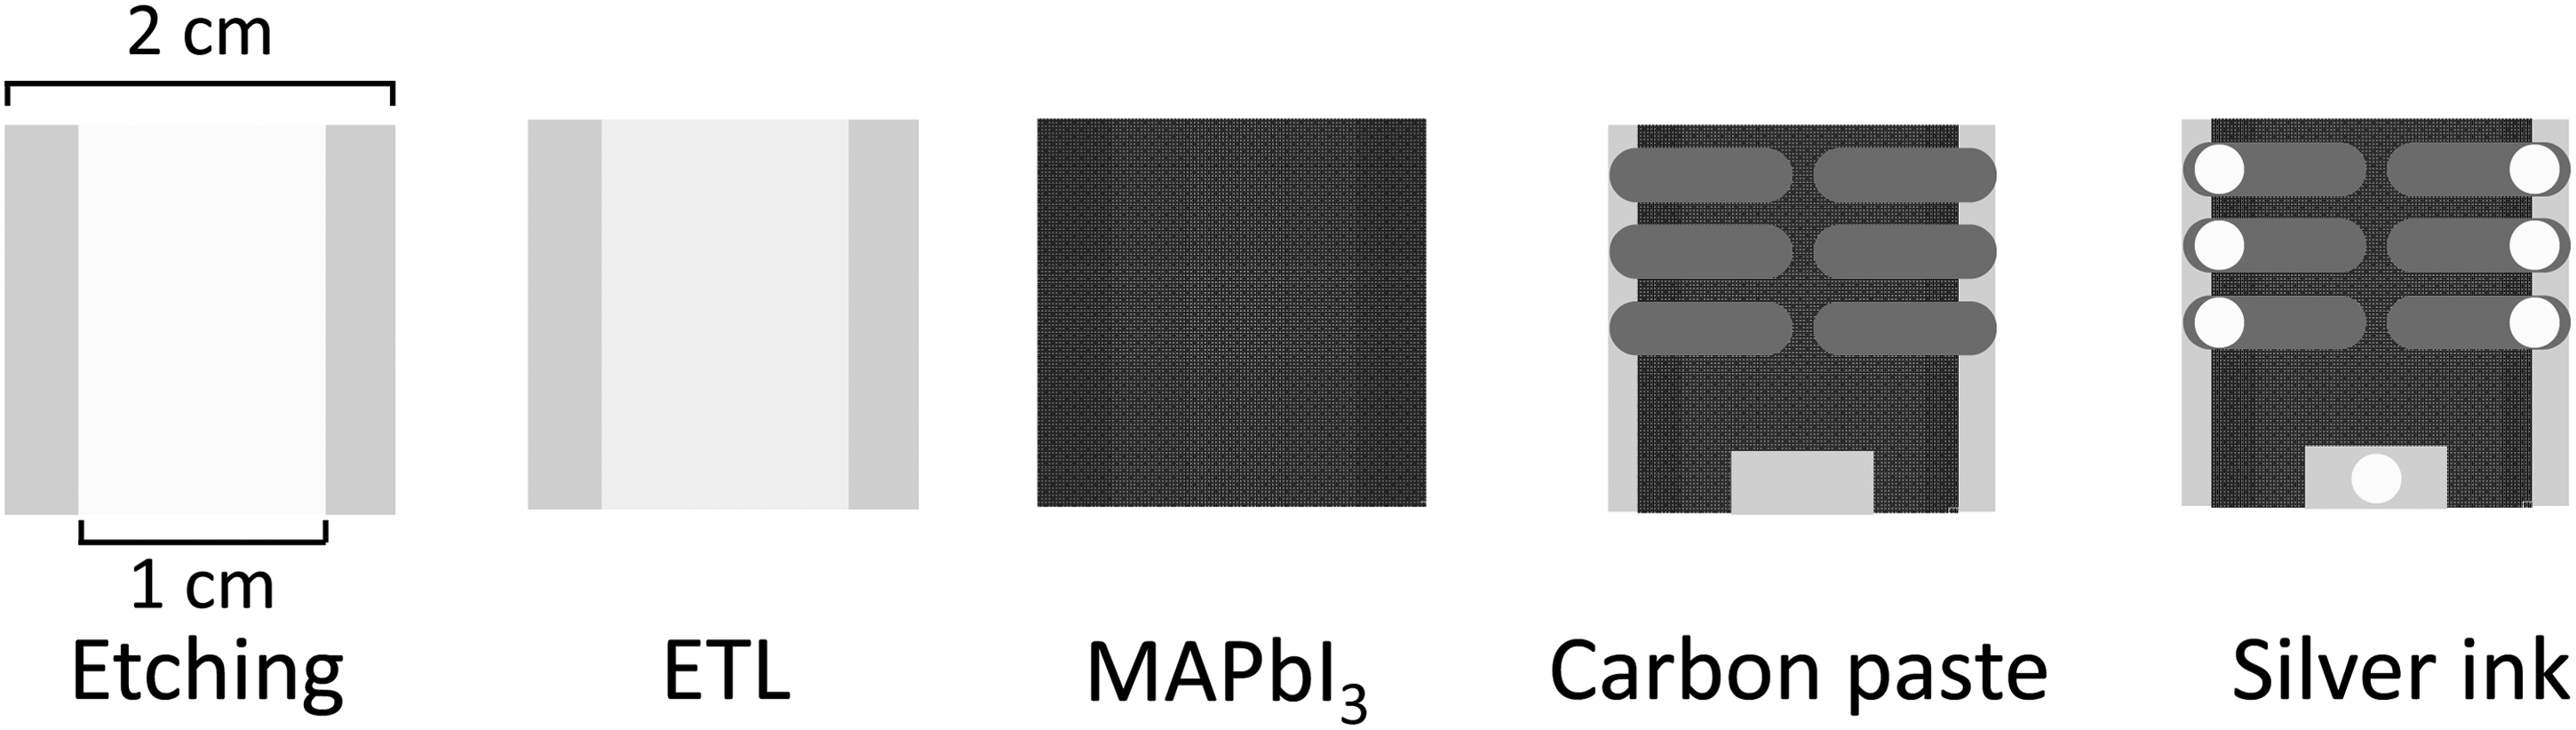
Illustration of a fabricated perovskite solar cell device with α-Fe2O3, ZnO, and Cr2O3 as ETL and carbon electrode as top contact. ETL: electron transport layer.
Results and discussions
It is important to note that the optoelectronic properties of α-Fe2O3, ZnO, and Cr2O3, as conventional semiconductor materials, depend on their crystal structures, which in turn influence their effectiveness as ETLs in perovskite solar cells. Therefore, a detailed structural analysis of α-Fe2O3, ZnO, and Cr2O3 is essential. To investigate their crystal structures, the synthesized α-Fe2O3, ZnO, and Cr2O3 samples were characterized using XRD. As shown in the full XRD scan in Figure 2(a), all three materials exhibit high purity, with no detectable secondary phases or impurities. Additionally, Figure 2(b) shows the Williamson-Hall (W-H) plot derived from the XRD measurements. The W-H plot is utilized to determine the grain size and lattice strain in the samples based on equation (3).18–20 Here, β represents the full width half maximum of the XRD peaks, θ is the Bragg angle, K a constant typically set to 0.9, and λ corresponds to the X-ray source wavelength, which is approximately 1.5406 Å.
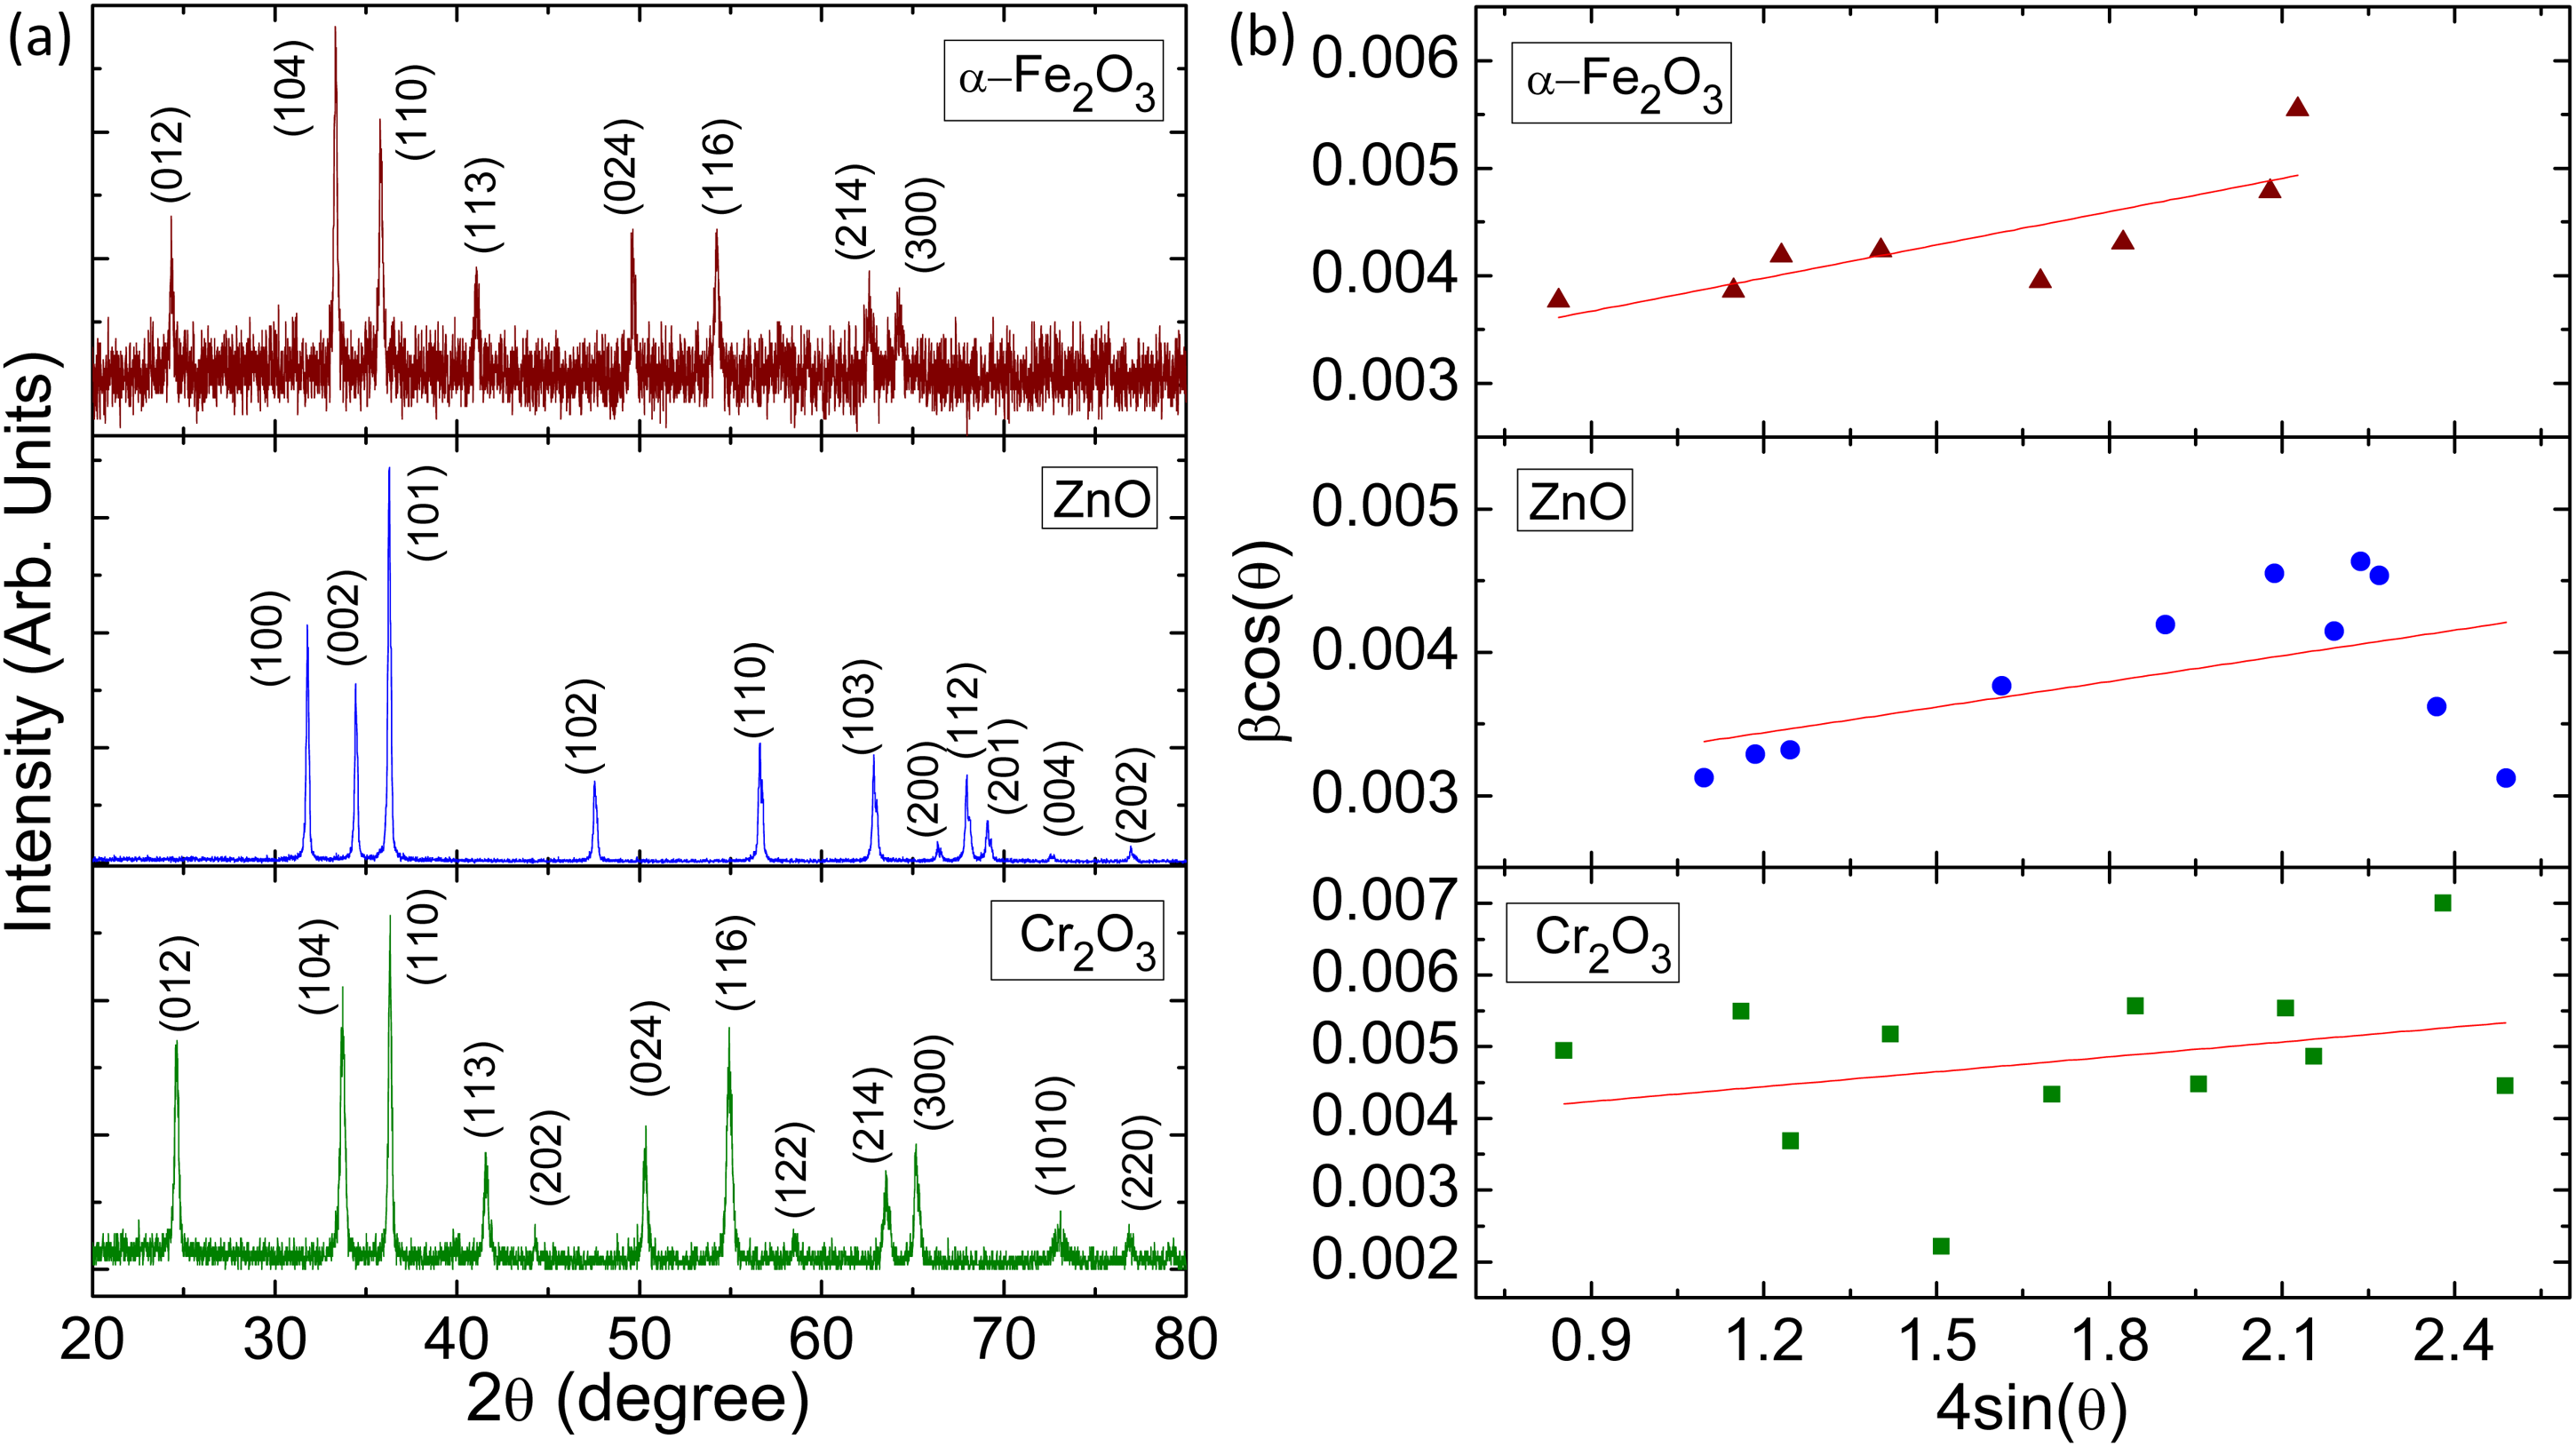
(a) Full scan of XRD measurement of α-Fe2O3, ZnO, and Cr2O3 precursor samples. (b) W-H plot derived from XRD results. XRD: X-ray diffraction.
The intercept 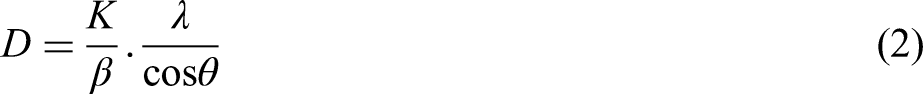
Furthermore, the lattice constant of the samples can be determined using Bragg's law in equations (3) and (4) (equation for hexagonal structure crystal). Here, d represents the interplanar spacing, while h, k, and l the Miller indices corresponding to the lattice plane. Additionally, a and c denote the lattice constants along the a-axis and c-axis, respectively. The calculated values were also compared with standard database values from previous reports for validation.

The calculation results and detailed information on the synthesized samples are presented in Table 2. It shows that the grain sizes of α-Fe2O3, ZnO, and Cr2O3, as calculated using both the W-H and Scherer methods, fall within the range of 30 to 50 nm. Additionally, the dislocation density calculated using the Scherrer method reveals that Cr2O3 and α-Fe2O3 exhibit higher values compared to ZnO, indicating that these materials experience greater microstrain compared to ZnO. This suggests that Cr₂O₃ and α-Fe₂O₃ undergo crystal deformation during the synthesis process. These results are consistent with the W-H plot analysis and the lattice parameter calculations using Bragg's equation, which show that the lattice constants of Cr2O3 and α-Fe2O3 deviate significantly from their standard bulk values. As conventional semiconductors, the optoelectronic properties of α-Fe2O3, ZnO, and Cr2O3 are influenced by their crystal structure. Our ZnO sample likely retains similar optoelectronic properties to those reported in previous studies. However, the presence of dislocations and defects in the crystal lattices of Cr2O3 and α-Fe2O3 may result in altered optoelectronic behavior.
Detail calculation results using Scherrer and W-H methods derived from XRD data, as well as the structure information α-Fe2O3, ZnO, and Cr2O3 samples.
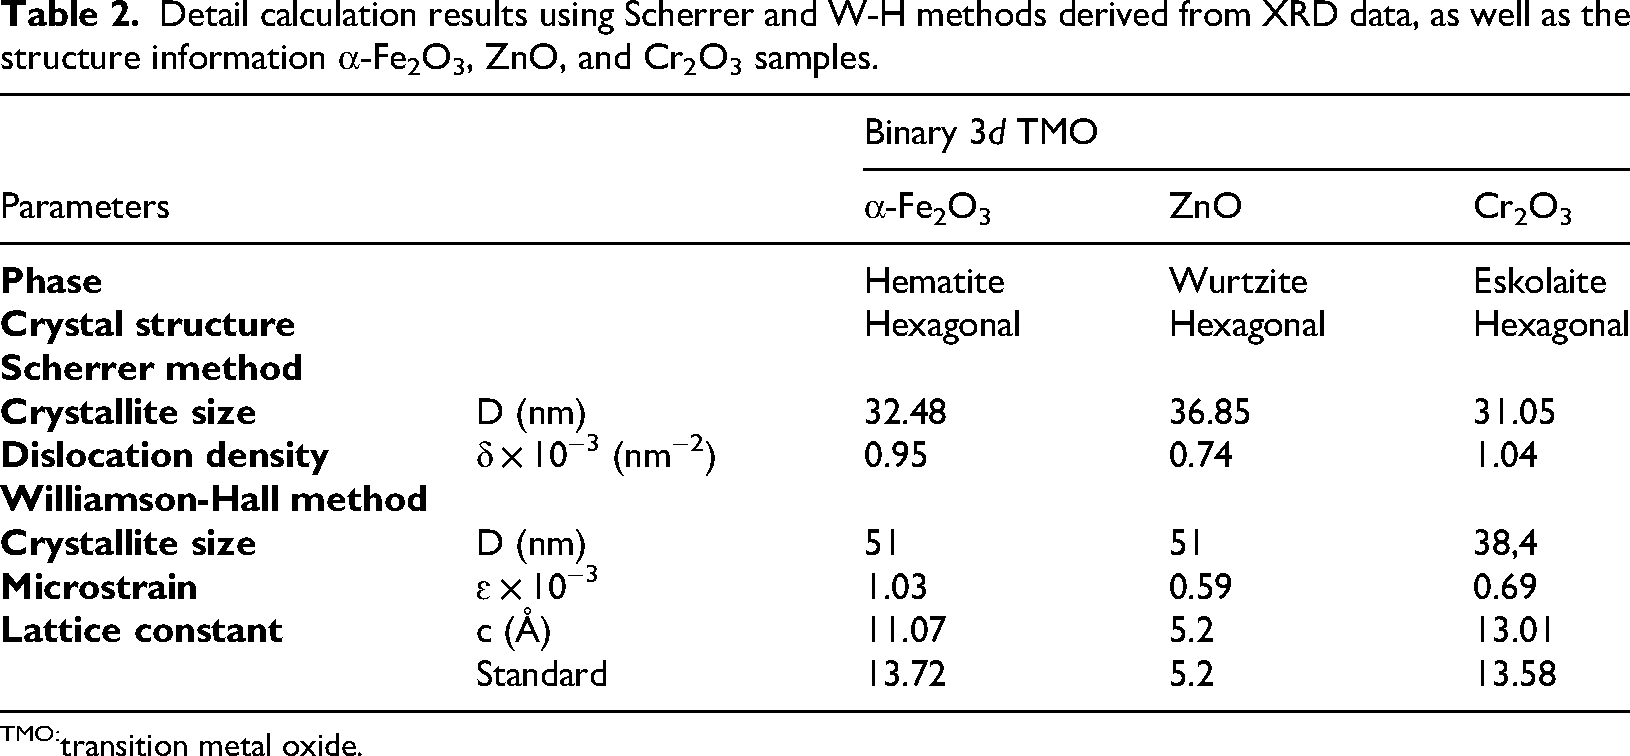
transition metal oxide.
SEM analysis was conducted to examine the microstructure of the synthesized α-Fe2O3, ZnO, and Cr2O3 samples, as shown in Figure 3(a)–(c). The SEM images show that all three materials exhibit relatively similar angular shapes (Figure 3, left-hand side panels). This morphological similarity can be attributed to their shared hexagonal crystal structure, which promotes the formation of comparable particle shapes. Additionally, the use of the same synthesis method for all samples likely contributed to the uniformity in particle formation of these three samples. The similarity in synthesis conditions is also reflected in the average particle size, which was analyzed using ImageJ. The results indicate that the particle size of the obtained α-Fe₂O₃, ZnO, and Cr₂O₃ samples is nearly identical, ranging from approximately 230 to 250 nm, as shown in Figure 3 (middle side panels). Furthermore, the EDX analysis (Figure 3, right-hand side panels) confirms that all samples are composed solely of their expected elemental constituents, with no detectable impurities from other elements.
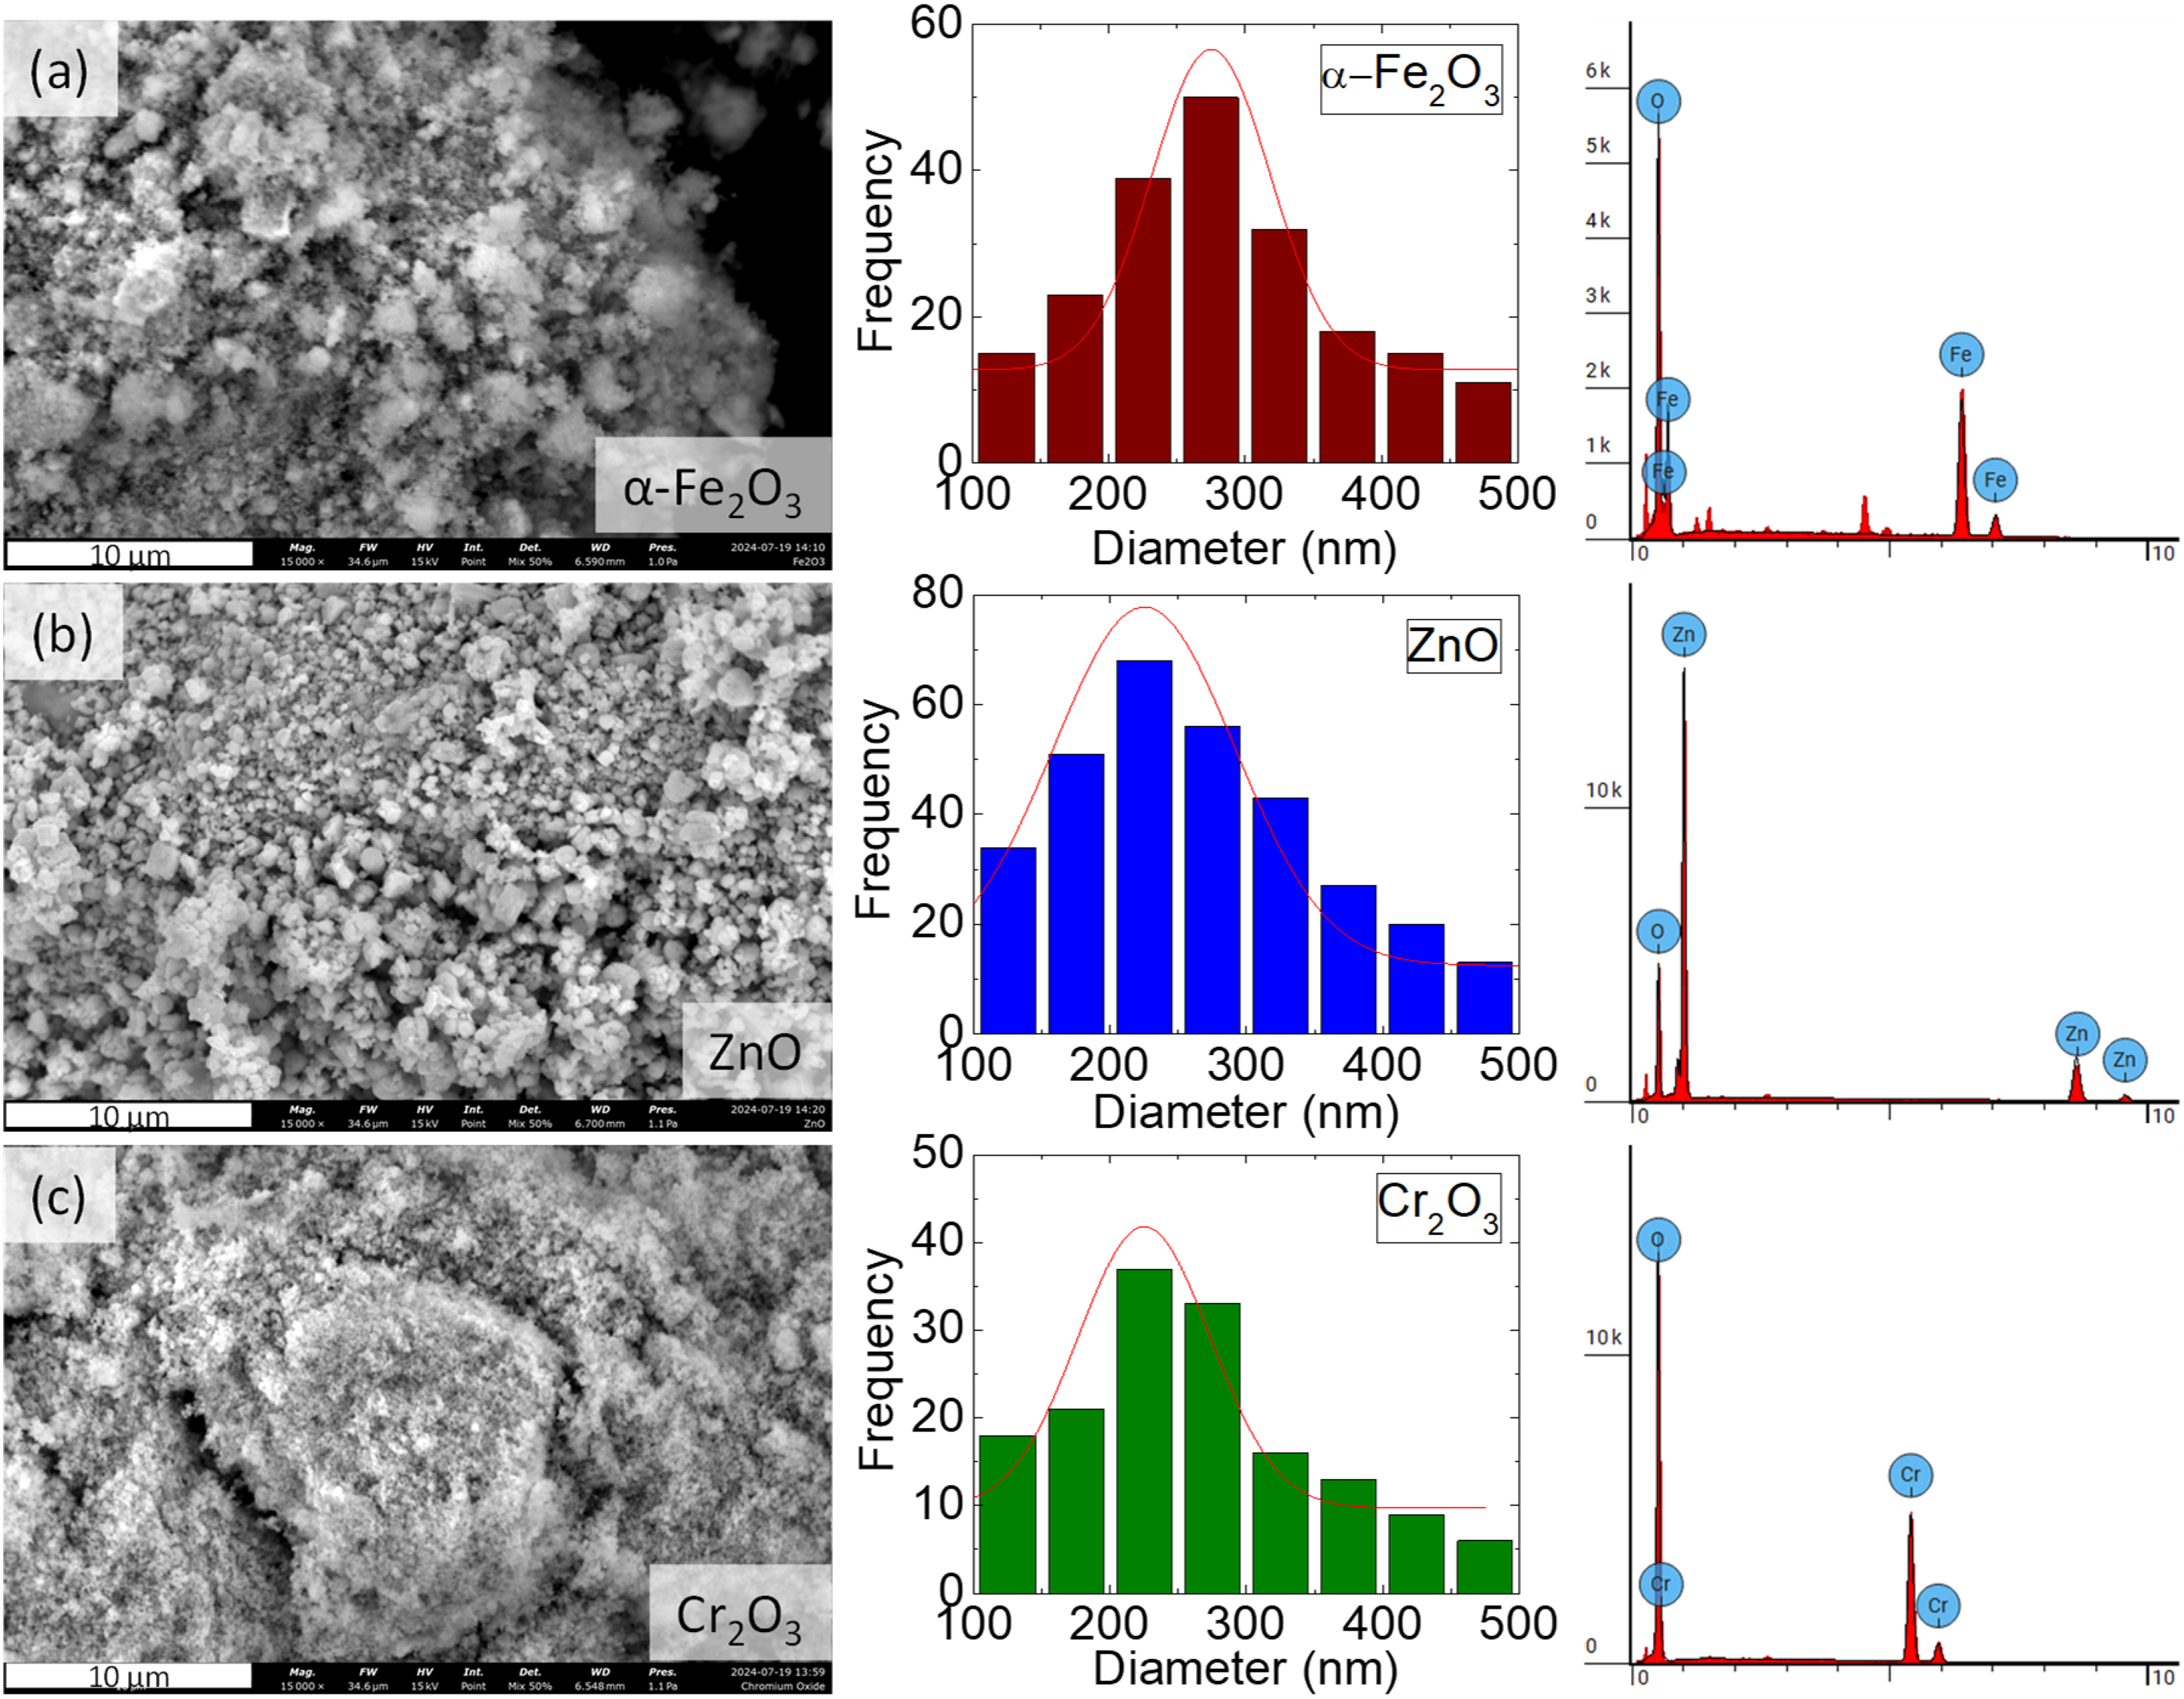
SEM measurement showing the morphology (left-hand sides), particle size distribution using ImageJ (right-hand side), and EDX of (a) α-Fe2O3, (b) ZnO, and (c) Cr2O3 precursor samples. EDX: energy-dispersive X-ray; SEM: scanning electron microscope.
The FTIR measurement results, shown in Figure 4, provide insights into the chemical structures of the α-Fe2O3, ZnO, and Cr2O3 samples. The spectra indicate the presence of identical organic functional groups: O-H, C-H, and H-O-H at higher wavenumbers, which originate from the solvents used during synthesis. Meanwhile, the characteristic peaks corresponding to Fe-O, Zn-O, and Cr-O bonds appear at lower wavenumbers.21–23 Interestingly, ZnO exhibits additional peaks associated with Zn-OH functional groups, which are absent in the α-Fe₂O₃ and Cr₂O₃ samples. This suggests that the surface states of ZnO differ significantly from the other two materials, as ZnO more readily adsorbs organic compounds on its surface. These surface characteristics strongly affect the solubility of the samples, with ZnO we found demonstrates a greater tendency to dissolve in ethanol compared to α-Fe2O3 and Cr2O3. The enhanced solubility of ZnO in ethanol results in better wetting on the FTO substrate, which in turn affects the surface roughness of the thin films formed via the spin-coating method.
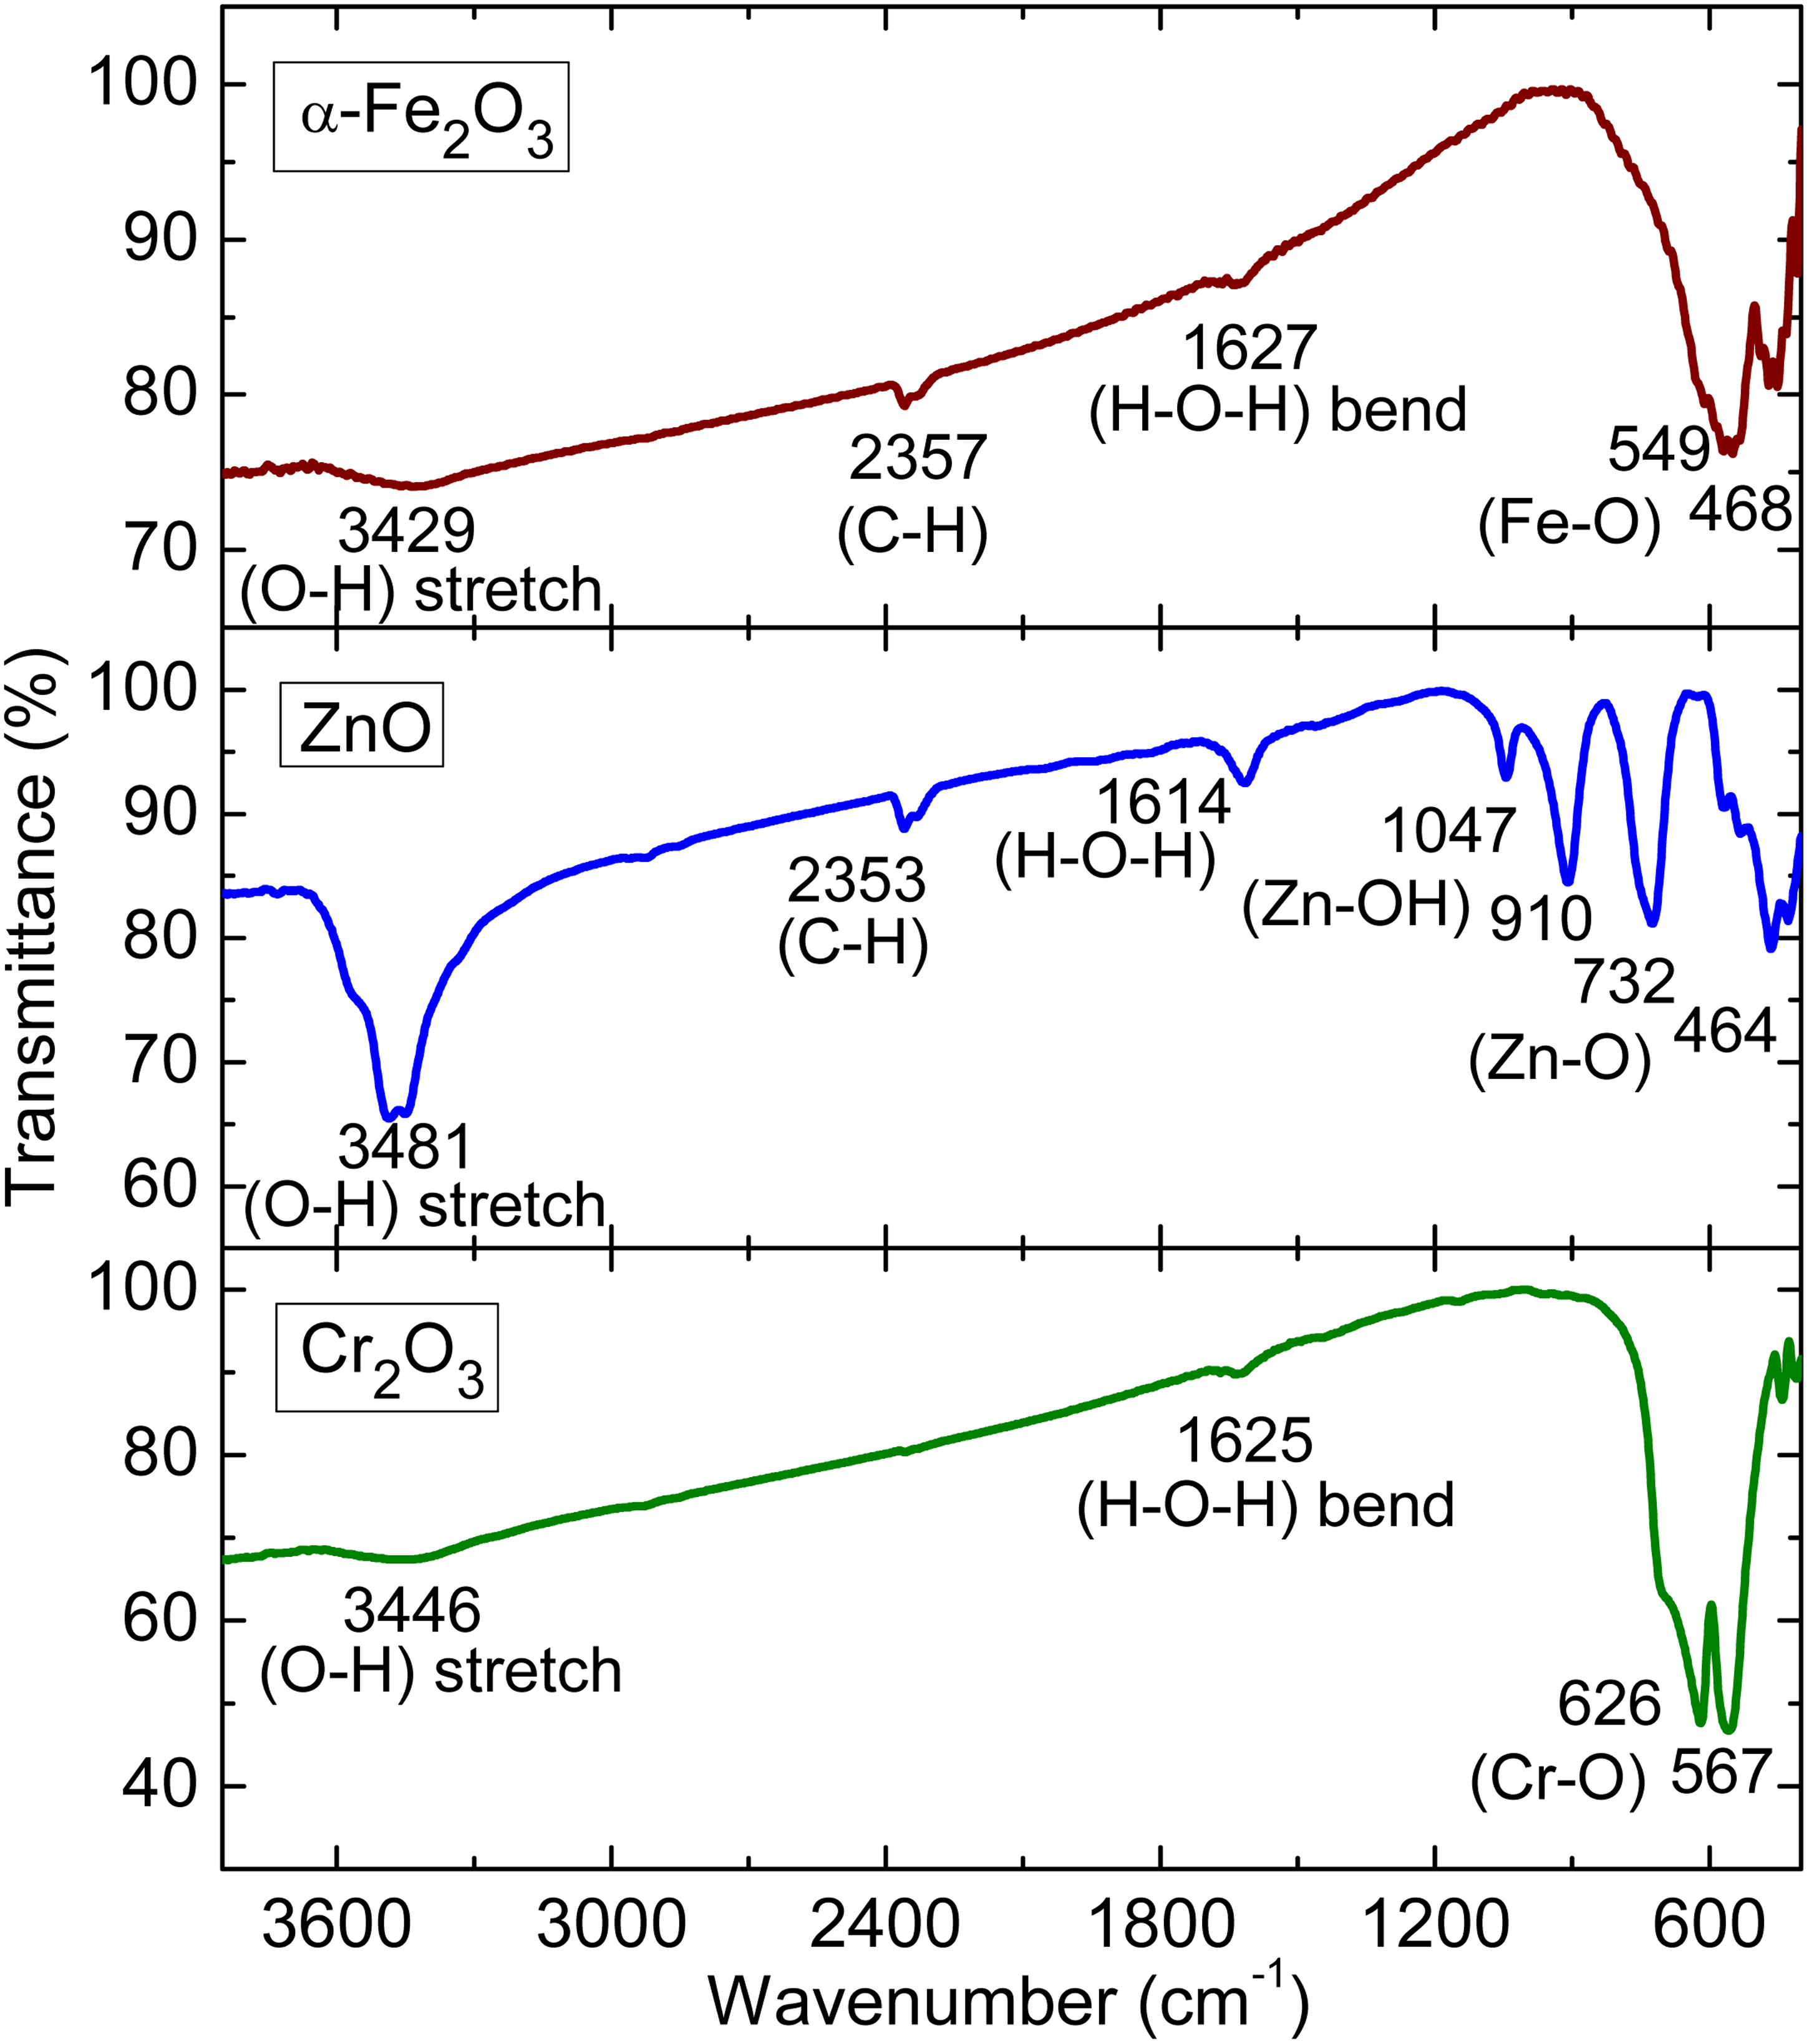
FTIR measurement of α-Fe2O3, ZnO, and Cr2O3 precursor samples. FTIR: Fourier transform infrared spectroscopy.
UV-Vis spectroscopy was performed to analyze the optoelectronic properties of the synthesized α-Fe2O3, ZnO, and Cr2O3 samples. The absorption spectra, shown in Figure 5(a), reveal distinct optical characteristics for each material. The synthesized α-Fe2O3 sample exhibits three small and broad absorption peaks at 280, 440, and 541 nm, confirming its semiconducting nature. 24 These peaks correspond to different electronic transitions25,26: the 541 nm arises from the Fe3d → Fe3d transition, while the 440 nm peak is attributed to the O2p → Fe3d. 27 Additionally, the 280 nm peak is likely associated with a double exciton transition involving magnetically coupled Fe3+ cations or pair excitation.28,29 In contrast, ZnO displays a single sharp absorption peak at 372 nm, which is related to exciton absorption.30,31 The Cr2O3 sample shows four broad absorption peaks. The peaks at 380, 488, and 630 nm correspond to the 3d electronic transition of Cr3+ ions within an octahedral coordination geometry, specifically 4A2g → 4T1g, 4A2g → 4T2g, and 4A2g → 2E2g, respectively.32–34 Meanwhile, the peak at 228 nm is likely associated with the electronic transition of Cr4+ ions. 34
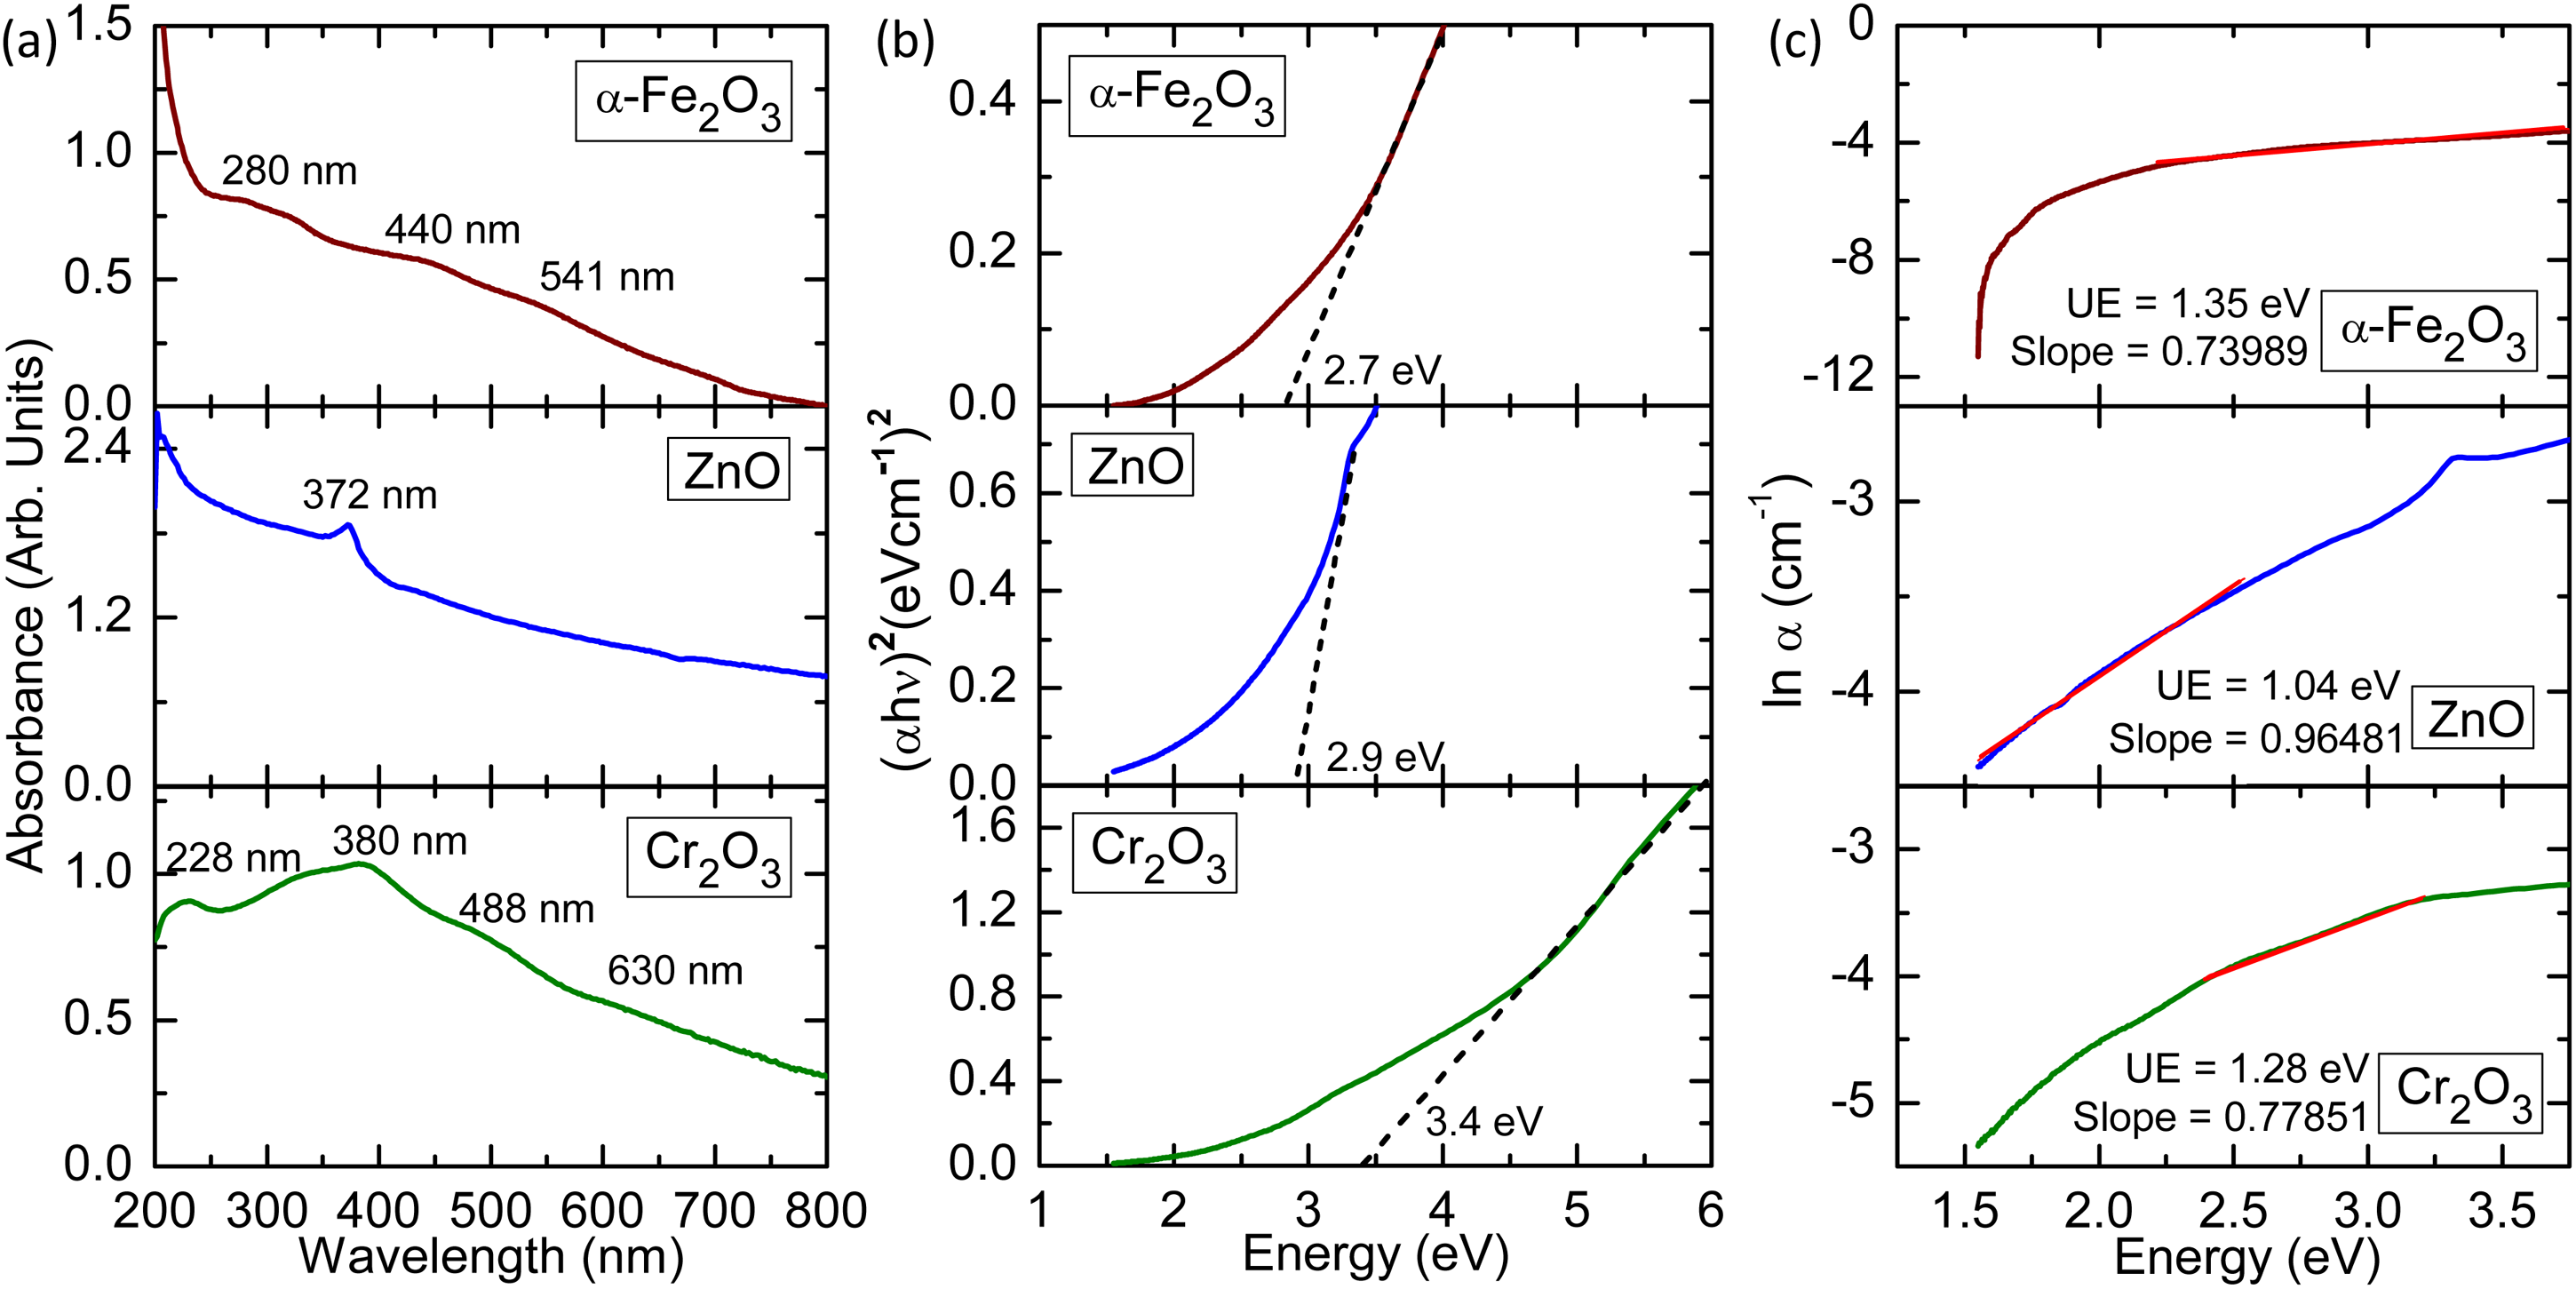
UV-Vis measurement results: (a) absorption spectra, (b) Tauc-plot, and (c) Urbach energy calculations of the α-Fe2O3, ZnO, and Cr2O3 precursor samples. UV-Vis: ultraviolet-visible.
Figure 5(b) shows the Tauc plot, which is derived from the absorption spectra and provides insights into the optical bandgap of the samples using equation (5). In this equation, A is a constant, α the absorption coefficient, h Planck's constant, v the frequency of the incident light, and Eg corresponds to the optical bandgap of the material.
It is important to note that the absorption spectra of α-Fe2O3 and Cr2O3 exhibit several peaks, making the determination of their bandgap values more complex. To ensure accuracy, we excluded lower energy regions in the Tauc plot, as these may correspond to false electronic transitions. For instance, in the α-Fe2O3, the absorption peak at approximately 280 nm is associated with pair excitation, while in Cr₂O₃, the 228 nm peak is linked to the Cr4+ electronic transition. In this case, we plot the bandgap according to 3d transition of the sample, resulting in the calculated bandgap for α-Fe2O3 is 2.7 eV, which is slightly higher than values reported in previous studies.7–9 Meanwhile, the Tauc plot for ZnO, determined based on its single exciton absorption peak, yields a bandgap of 2.9 eV, which is slightly lower than previous reports.10–12 In contrast, Cr2O3 exhibits a relatively high bandgap of 3.4 eV.13–17 The bandgap values are strongly related to the presence of defects within the samples. As shown in Table 2, the defect density and microstrain in the synthesized samples are relatively high, which likely influences their optoelectronic properties, making them different from their bulk counterparts. Relatively higher bandgap of the obtained Cr2O3 and α-Fe2O3 due to internal defects, in turn, may be beneficial to enhance light absorption of the active layer and increase photocurrent of the PCS device.
We further analyzed the optoelectronic properties of the synthesized samples in detail using Urbach energy (UE) calculations. Figure 5(c) presents the UE values for α-Fe2O3, ZnO, and Cr2O3, extracted from their absorption spectra using equation (6), where Eu represents the Urbach energy. It is important to note that the slope used in UE calculation corresponds to the correct electronic transitions within the samples, following the same approach as in the bandgap determination, which was previously discussed. The slope in UE for α-Fe2O3 and Cr2O3 samples is determined according to the 3d electronic transition of Fe3+ and Cr3+, respectively.
The UE provides insight into sub-bandgap energy or band tailing caused by defects.35–37 A higher UE value indicates more significant band tailing, which is associated with greater crystal disorder. In this case, α-Fe2O3 exhibits the highest UE of 1.35 eV, suggesting a high degree of crystal disorder, which agrees with the structural analysis presented in Table 2. Similarly, Cr2O3 also shows a relatively high UE of 1.28 eV, indicating notable crystal disorder. In contrast, ZnO has the lowest UE of 1.04 eV, indicating that its crystal disorder is significantly lower compared to the other samples.
Figure 6(a)–(c) shows the AFM measurement results of α-Fe2O3, ZnO, and Cr2O3 ETL on top of the indium tin oxide (ITO) substrate, respectively. It shows that they have different surface conditions, wherein both ZnO and Cr2O3 layers typically have almost the same surface roughness, 35 to 40 nm on average, though the ZnO layer exhibits better distribution compared to the Cr2O3 layer. Whereas, α-Fe2O3 exhibits the highest surface roughness up to 0.8 μm. Similar to our previous assumption from FTIR, ZnO, which is easier to dissolve in ethanol compared to α-Fe2O3 and Cr2O3, could support their wettability on the ITO substrate, thus resulting in a smoother layer surface. A smoother layer surface could initiate good contact on each layer in the PSC device, thus improving the photovoltaic process. 38 This supports the performance measurement results, wherein, PSC device using ZnO as ETL shows high PCE compared to other PSC devices using α-Fe2O3 and Cr2O3 ETL, as explained in the next section.
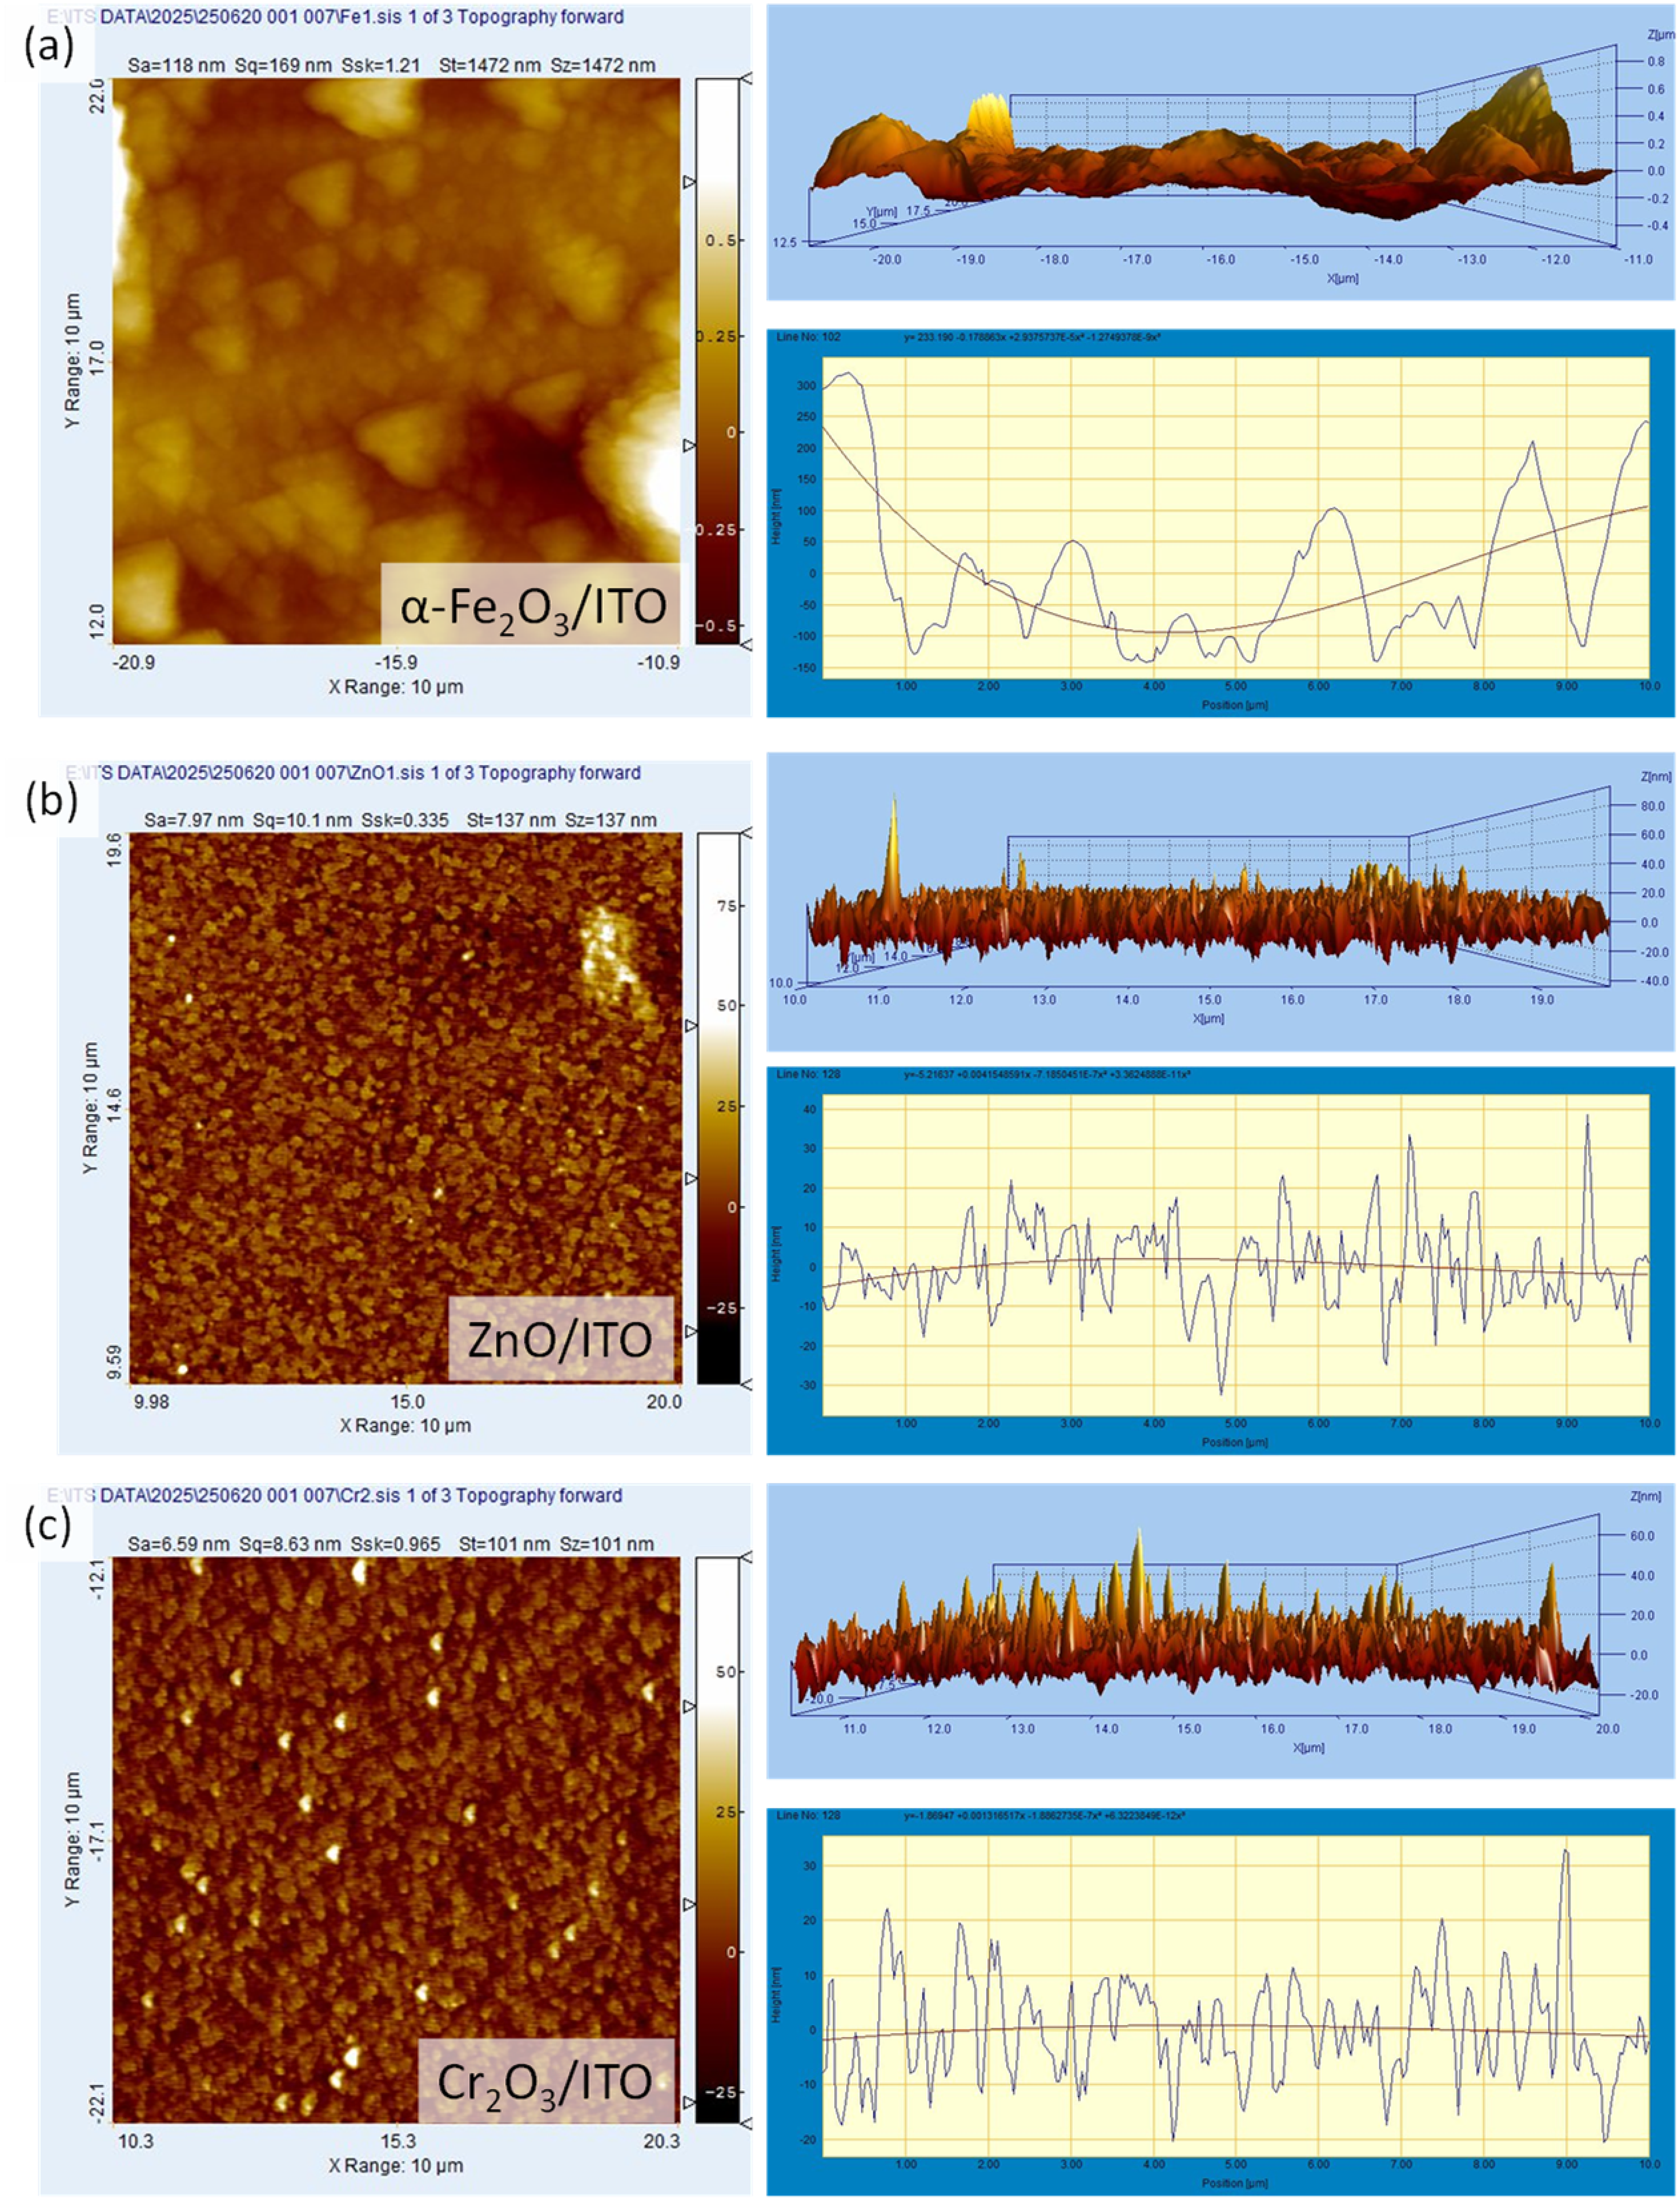
AFM measurement of (a) α-Fe2O3, (b) ZnO, and (c) Cr2O3 ETL on ITO substrate. ETL: electron transport layer.
Moreover, the device performance of PSCs employing α-Fe2O3, ZnO, and Cr2O3 as ETLs was evaluated, as shown in Figure 7. The J-V measurement results of the fabricated device are tabulated in Table 3. Among the tested ETLs, the PSC using ZnO exhibited the highest PCE of 1.07%, which is consistent with previous reports. 4 Additionally, the ZnO-based device demonstrated higher PCE, FF, and VOC compared to devices using α-Fe2O3 and Cr2O3 as ETLs. The enhanced solar cell performance of the ZnO-based PSC can be attributed to its higher carrier mobility, as shown in Table 1. Moreover, ZnO exhibits significant differences in crystal structure, electronic properties, and optoelectronic characteristics, as confirmed by our previous measurements, which likely contribute to its superior photovoltaic performance. In contrast, the α-Fe₂O₃-based PSC showed the lowest performance, with a PCE of 0.43% and the lowest VOC (277.2 mV) and FF (27.5%) among the tested devices. This could be due to higher defect density and microstrain in α-Fe₂O₃, as suggested by Table 2, which might lead to increased charge recombination and reduced carrier transport efficiency. Additionally, α-Fe₂O₃ has a relatively higher UE (1.35 eV), indicating significant band-tailing effects due to crystal disorder, further affecting charge extraction. Similarly, the Cr₂O₃-based PSC exhibited moderate performance, with a PCE of 0.63% and a VOC of 329.1 mV, which is higher than α-Fe₂O₃ but lower than ZnO. Cr₂O₃ also possesses a relatively high UE (1.28 eV), suggesting the presence of structural defects. However, its short-circuit current density (JSC, 6.84 mA/cm²) was the highest among the three samples, possibly due to better absorption properties in the visible range, as inferred from the UV-Vis analysis in Figure 5(a). Despite this, the lower carrier mobility of Cr₂O₃ compared to ZnO likely limits its overall solar cell performance.
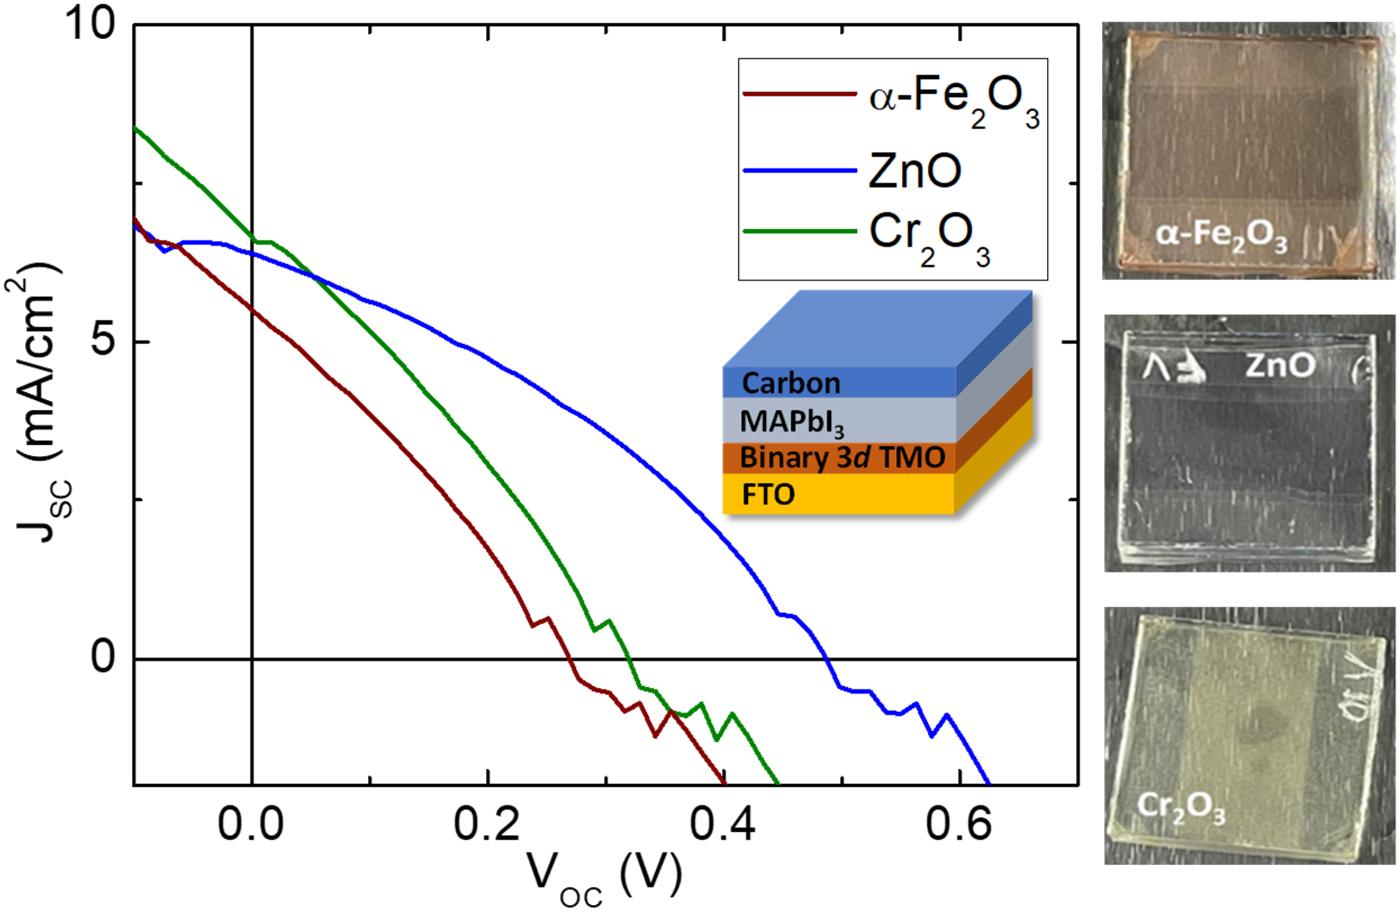
J-V curve of the perovskite solar cell devices using ETL made from the α-Fe2O3, ZnO, and Cr2O3. At right-hand side panel shows the photograph of α-Fe2O3, ZnO, and Cr2O3 ETL layers on conductive FTO substrate, respectively. ETL: electron transport layer; FTO: fluorine-doped tin oxide.
The performance (PCE, FF, VOC, and JSC) of reverse bias perovskite solar cell devices using ETLs made from α-Fe2O3, ZnO, and Cr2O3.
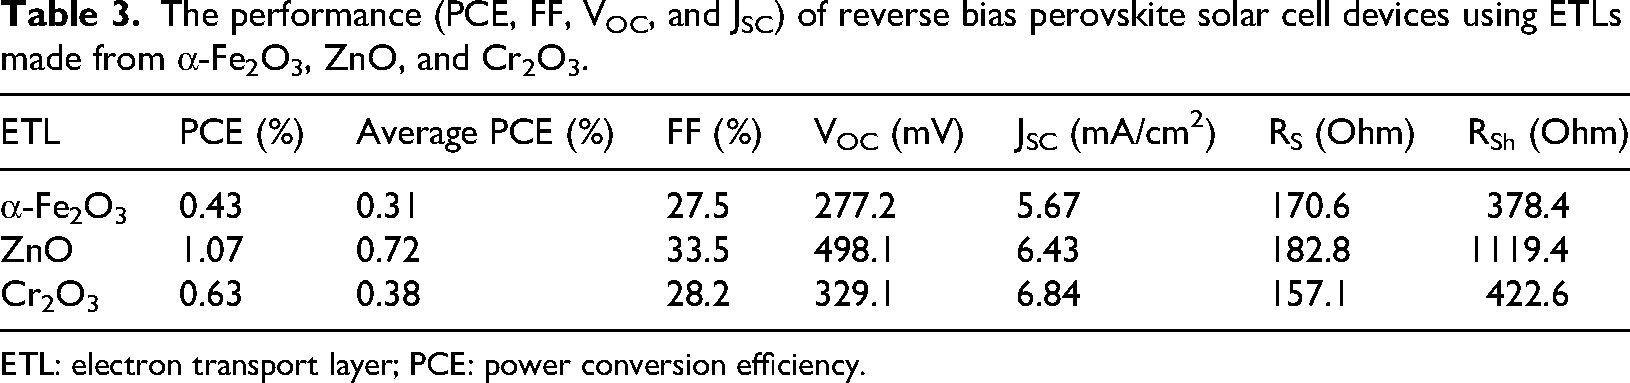
ETL: electron transport layer; PCE: power conversion efficiency.
Moreover, the values of series (RS) and shunt (RSh) resistances also impact the device's performance. RS is an internal resistance within the device, while RSh is a parallel resistance that leads to leakage paths within the structure. 39 It means that a lower RS indicates lower internal resistance, which allows more current to flow without loss, while a higher RSh indicates less leakage current. Cr2O3-based PSC has the lowest RS; however, its RSh remains lower than that of ZnO-based PSC, which outperforms the other ETLs because it combines low RS and a high RSh value. Overall, these results highlight that ZnO remains a superior ETL candidate for perovskite solar cells due to its better charge transport properties, while α-Fe₂O₃ and Cr₂O₃ exhibit limitations due to higher defect densities and lower carrier mobilities, affecting their photovoltaic performance.
It is interesting to note that the Cr2O3-based PSC exhibits a higher JSC compared to devices using α-Fe2O3 ETL and ZnO as ETL. Additionally, the Cr2O3-based device demonstrates overall better performance than the α-Fe2O3-based device. We speculate that the wider bandgap of Cr2O3, compared to α-Fe2O3, contributes to its improved solar cell performance. The bandgap of the ETL plays a crucial role in achieving high-performance solar cells. A wide-bandgap ETL could enhance light absorption of the active layer and increase photocurrent. Enhancing the performance of α-Fe2O3, ZnO, and Cr2O3 as ETLs could be achieved through various modifications, such as structural engineering, doping, composite, defect engineering, and surface engineering. Interestingly, our synthesized α-Fe2O3 sample exhibits a smaller lattice constant than its bulk counterpart, which unintentionally results in a higher bandgap. Defect density of the synthesized Cr2O3 was also found to be relatively high, which further induces a relatively high bandgap of Cr2O3. With proper modifications, we believe that α-Fe2O3, ZnO, and Cr2O3 can be further optimized as effective ETLs to obtain high-performance PSCs. Fabrication methods also hold crucial roles in obtaining high-performance PSC devices using binary 3d TMO as an ETL. Here, we found that ZnO shows a greater tendency to dissolve in ethanol compared to α-Fe2O3 and Cr2O3. The enhanced solubility of ZnO in ethanol results in better wetting on the FTO substrate, forming a smoother layer surface compared to α-Fe2O3 and Cr2O3. The low solubility of the TMO hinders the formation of a uniform and high-quality ETL layer on the FTO substrate, which then further induces bad interfaces with the perovskite layer. The strategies to address this issue, such as exploring more soluble binary 3d TMO and optimizing deposition conditions, are very necessary.
Conclusions
Perovskite solar cell devices based on MAPbI3 using various ETLs made from α-Fe2O3, ZnO, and Cr2O3 have been successfully fabricated. It shows that these binary 3d TMO could be used as ETL, though the generated PCE is very small. Proper optoelectronic properties such as bandgap and carrier mobility of these binary 3d TMO, support them as ETL in perovskite solar cells to generate photovoltaic. The perovskite solar cell device using ZnO ETL exhibits more excellent performance compared to using α-Fe2O3 and Cr2O3 ETL due to its highest carrier mobility. The device using Cr2O3 ETL also shows better photovoltaic performances compared to the device using α-Fe2O3 ETL due to its wider bandgap compared to α-Fe2O3. By using proper modifications, we believe that α-Fe2O3, ZnO, and Cr2O3 as excellent ETLs to obtain high-performance perovskite solar cells.
Footnotes
Funding
The authors disclosed receipt of the following financial support for the research, authorship, and/or publication of this article: This work was supported by Universitas Airlangga through IRCON 2024 Unair grant number 190/UN3.LPPM/PT.01.03/2024 and RIIM-LPDP grant Number 82/II.7/HK/2022.
Declaration of conflicting interests
The authors declared no potential conflicts of interest with respect to the research, authorship, and/or publication of this article.
Data availability statement
Data available on request/reasonable request.