
Abstract
The transition to a circular carbon economy (CCE) is critical for reducing CO2 emissions and climate change mitigation. However, existing studies have overlooked the role of ecological foundations such as biocapacity and renewable energy. As a results, most of these struggle to establish the extent of the complexities underpining the interaction amongst the drivers of carbon economies. This study addresses these gaps by employing advanced machine learning (ML) models (Random Forest and Gradient Boosting) and linear fixed effects model to analyze data from 16 belt and road initiative (BRI) countries from 2000 to 2022. The results predicted and quantified the impact and the relative importance of renewable energy, technological innovation, and biocapacity on CO2 emissions across 16 Upper-Middle Income countries in the Belt and Road Intiative (BRI) region. Both the RF and GB models demonstrated high predictive accuracy and robustness (R2 > 0.98 on the full dataset). The linear FE model also achieved an R2 (within) of 0.74, confirming the presence of significant unobserved country-level heterogeneity across the region. The most significant finding reveals that biocapacity surpasses both renewable energy and technological innovation as the most influential predictor of CO2 emissions across the BRI region. This underscores the critical, yet neglected, role of ecological carrying capacity as the foundation for a circular carbon loop. This study contributes a novel, data-driven methodology for sustainability transition analysis and offers a crucial policy insight. The study therefore noted that achieving carbon circularity in the BRI region requires a re-prioritization towards biocapacity protection as a non-negotiable prerequisite, alongside the acceleration of clean energy and technology adoption.
This is a visual representation of the abstract.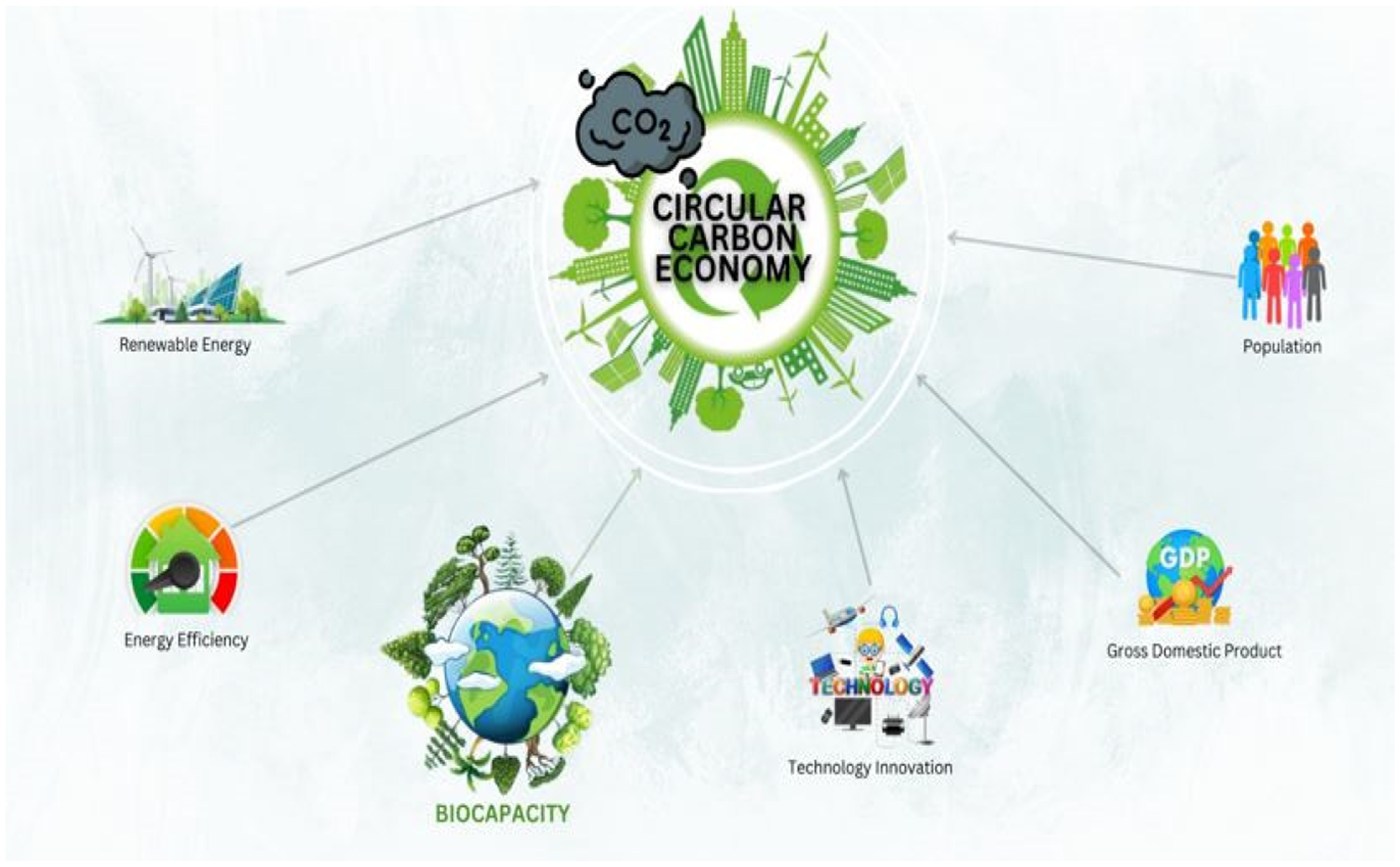
Keywords
Introduction
The threats of increasing carbon emissions and global warming has intensified the call for countries to ensure sustainable production and consumption of goods and services.1,2 Following this global concern, the concept of circularizing economies based on low-carbon emissions emerged as a transformative approach towards efficient production and consumption of natural resources and the achievement of environmental sustainability.3,4 Widely conceptualized as circular economy (CE) or circular carbon economy (CCE), the principle of circularizing an economy places emphasis on strategies and policies that ensure reduction, reuse, recycling, and removal of wastes (solid, liquid. and gas) from the environment.5,6
CE framework is not only intended to ensure the reduction of greenhouse gas emissions, but also to enhance energy security, promote economic diversification, and stimulate technological innovation.7,8 The relevance of the CCE to sustainable development lies in its potential to provide a holistic solution to climate change while supporting global economic growth and stability.9–11Though CE principles provide a foundational mindset, their application to carbon management demands a more focused framework. It encompasses the process of transitioning an economic system towards a state where carbon emissions are systematically minimized, captured, and repurposed within a closed-loop system, rather than released as a waste product into the atmosphere.
Critical to CO2 emissions reduction and circularization of economies is the advent of green technological innovations, consumption of clean energy such as renewable energy, adoption of energy efficiency measures and protection of biocapacity.12–14 The evidence has so far suggested that biocapacity is an indispensable component of CO2 emission reduction and sustainable development as it helps quantify the capacity of the economy to generate renewable resources and absorb wastes, including CO2 emissions. Accordingly, it becomes the basis for achieving economic growth, social equity, climate change and environmental sustainability.15–17 The literature further demonstrated that biocapacity is a core component of ecological footprint analysis which directly impacts sustainable development. 18
A significant number past studies further demonstrated that technological innovation plays a transformative role in enabling economies develop new materials, processes, and systems that enhance resource efficiency.19,20 Technological innovations also enable the recycling and reuse of products and wastes materials, which reduces their impact on the environment.21,22 Green technological innovations such as carbon capture and storage (CCS) and advanced recycling techniques are pivotal in closing the carbon loop.23,24
Though the principles of CCE are well-established, a significant gap exists in identifying and quantifying the most critical, actionable drivers for its implementation, particularly within diverse and rapidly developing economic contexts.19,25 The existing literature predominantly focuses on technological innovation and renewable energy as the primary engines of decarbonization. 26 However, the role of biocapacity remains critically underexplored within quantitative CCE models, creating a fundamental uncertainty. 18 It is worth noting that the transition to a circular carbon system has become a technological challenge. It also hinges on the preservation of the ecological foundation upon which all economies depend.
China's Belt and Road Initiative (BRI) presents a critical and timely case study for this problem. The BRI region is characterized by a dynamic blend of high-growth economies and developing nations, each with distinct energy needs and environmental challenges.27,28 With the BRI, countries such as China, Turkey, Bulgaria, Kazakhstan, Costa Rica, Malaysia and Ecuador have shown strong economic growth (GDP) after the global economic meltdown caused by the COVID-19 pandemic. The region also encompasses a vast heterogeneity of economies, from major emitters like China and Russia to biodiverse nations like Malaysia and Ecuador (see Figure 1). The diversity of the BRI region creates a “natural laboratory” to test which drivers are most universally influential.
29
However, traditional econometric methods often struggle to capture the complex interactions in such varied datasets. This is where machine learning (ML) models offer a distinct advantage, providing the robustness and flexibility to model these intricate systems effectively. This study bridges these conceptual, empirical, and methodological gaps. The novelty lies in the integrated application of advanced ML techniques (Random Forest [RF] and Gradient Boosting) to quantify the relative importance of biocapacity protection alongside renewable energy and technological innovation as drivers of circular carbonization within the specific and critical context of the BRI. To this end, the study pursues three core objectives.
To predict and quantify the individual and collective impact of biocapacity, renewable energy, technological innovation, and energy efficiency on CO2 emissions across a panel of BRI countries. To determine the relative importance of these variables in driving circular carbonization efforts, explicitly testing the hypothesis that biocapacity is a dominant, foundational driver. To provide context-specific policy insights that can guide BRI stakeholders in prioritizing interventions for effective transition to a low-carbon economy.
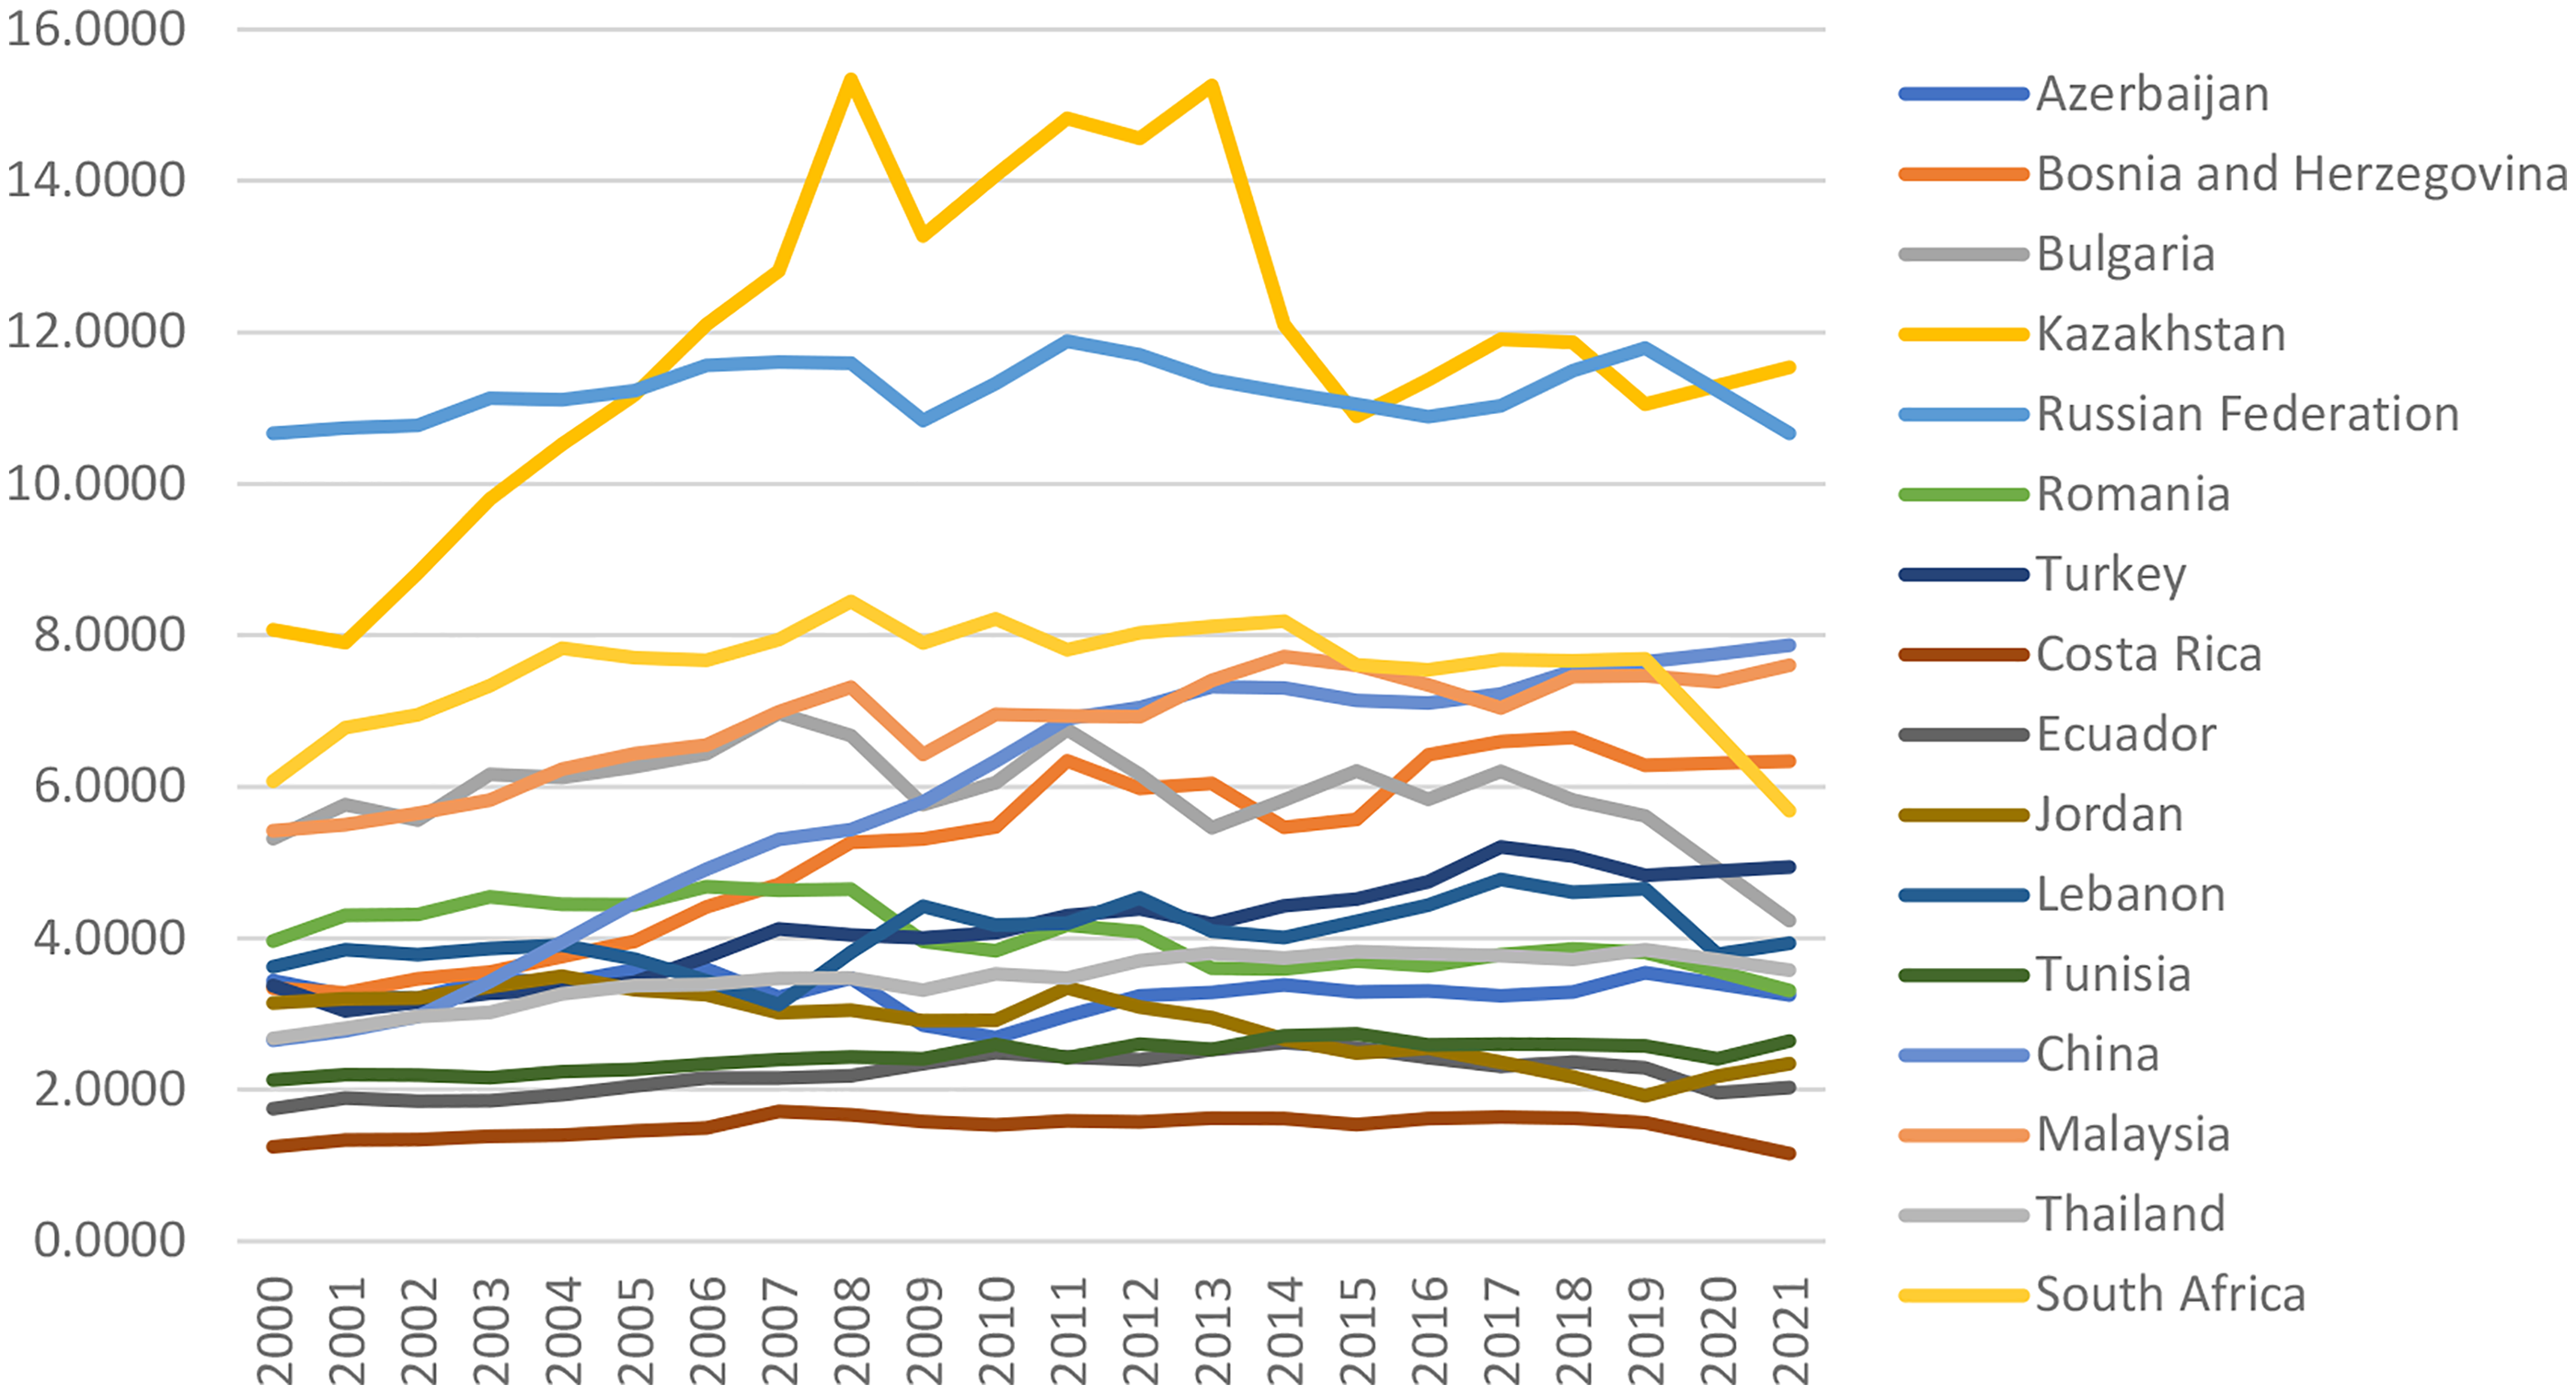
Level and pattern of CO2 emissions among BRI member states for period 2000–2021.
As the first part provides a general overview of the conceptual issues, the second part provides a critical review of the extensive literature on the subject matter, highlighting the theoretical and empirical perspectives on CCE and carbon emissions. The third part presented the methods and materials, explaining the study area, data source and variable description. While the fourth part presents the empirical and discussions, the fifth section provides the conclusion, presenting the policy implications, limitations and direction for future research.
Literature review
Theoretical background
There exist several theoretical positions on CO2 emissions due to the complexities and uncertainties surrounding economic activities and anthropogenic greenhouse gas emissions.6,30 Accordingly, there have been several theoretical perspectives or positions applied towards exploring the effects of various factors (renewable energy, FDI, urbanization, natural resources, GDP, etc.) by different scholars. However, the choice of the theoretical perspective is mostly influence by objectives and bounding assumptions of the research and its methodology. The theoretical logic of circular carbonization is grounded in Ecological Economics, which recognizes the economy as a subsystem of a finite global ecosystem. From this perspective, the economy's metabolism (energy and material flows) must respect biophysical limits. The biocapacity of a nation, representing the regenerative capacity of its ecosystems, constitutes this fundamental ecological ceiling.
To Bressanelli et al., 31 carbon circularization of an economy presents a responsible approach in the utilization of both natural and human resources of a countries as opposed to the traditional inefficient utilization of these resources. Highlighting the core principles of CCE, Kirchherr et al. 21 indicated that any attempt to circularize an economy should promote reduction, reuse, recycle and regeneration. Similarly, Jensen-Cormier et al. argued that the principle of CCE strives to stimulate job creation and achieve zero-waste generation and cleaner growth targets simultaneously. The study further argued that economies that try to circularized and/or carbonize achieve higher rate material and resource efficiency and minimal level of CO2 emissions. A circular carbon system, therefore, cannot be achieved if economic activity consistently overshoots this biocapacity, as the sinks for waste (CO2) are overwhelmed. Concurrently, the process of transitioning to such a system aligns with Socio-Technical Transition Theory, which explains how radical innovations reconfigure complex systems. In this context, technological innovations (carbon capture, advanced recycling, smart grids) are the enabling agents that disrupt carbon-intensive regimes, while renewable energy acts as the cornerstone of a new, sustainable energy regime, directly replacing fossil fuels at the system's core.
Proximate drivers of circular carbonization: A three-pillar approach
Renewable energy
Access to energy is critical for economic growth process. However, access to clean and sustainable energy is more critical in the face of economic and environmental sustainability.13,32,33 Over the years, the biggest threat to the environment has been the consumption of fossil fuels as they are the main source of GHGs particularly CO2 emissions. 34 Heavy reliance on fossil fuels in many countries presents serious threat to carbon emission reduction efforts, climate change mitigation and the achievement of sustainable development.35,36 Upon recognizing these, a significant number of studies have consistently presented renewable energy sources such as solar, wind, and hydroelectric power as the main drivers of carbon reduction strategies.26,35,37
A major proxy measure of CCE that has widely been investigated by past studies is RE.4,38,39 For instance, Salem et al. 40 indicated that RE is foundational element to the transition from fossil fuels towards clean and sustainable economy, as it offers a direct mechanism for reducing CO2 emissions. To Hwang and Sánchez Díez, 2 RE development improves energy resiliency, which enables strong and sustainable economic growth and development. Similarly, Gawusu and Ahmed 1 argued that the integration of RE sources into the energy mix of the country not only reduces reliance on fossil fuels but also enhances the transition of the economy to lower CO2 emissions.
In terms of creating of employment opportunities, Echeverría et al. 19 noted that the construction and installation of RE infrastructure provides higher employment opportunities in the short term than the development of fossil fuel infrastructure. Highlighting the significance to decarbonization of an economy, Stram 41 noted the heavy investments in renewable energy technologies such as wind, solar, and hydroelectric has resulted in substantial declines in CO2 emissions in many countries. Establishing a long-term causal relationship between renewable energy consumption and CO2 emissions Saad and Taleb 42 suggested that RE does not only help to mitigate climate change but also promote sustainable economic growth.
Highlighting the significance of decarbonization of an economy, Gasparatos et al. 43 noted the heavy investments in renewable energy technologies such as wind, solar, and hydroelectric have resulted in substantial declines in CO2 emissions in many countries. In an attempt to establish the long-term causal relationship between renewable energy consumption and CO2 emissions Saad and Taleb 42 revealed that RE not only helps mitigate climate change but also promotes sustainable economic growth. The compelling evidence presented by these past studies highlighted the positive impacts of RE on an economy, underscoring the role of RE in promoting environmental sustainability and reducing carbon footprints.1,44
Technological innovations
Critical to circularization of an economy is the advent of technological innovations.13,14 Significant evidence from past studies showed that technological innovation plays a transformative role in enabling economies develop new materials, processes, and systems that enhance resource efficiency.19,20 Technological innovations also enable the recycling and reuse of products and wastes materials, which reduces their impact on the environment. 45
In a study, Luomi et al. 25 argued that technological innovations such as CCS and advanced recycling techniques are pivotal in closing the carbon loop. To Zha et al. 46 efficiency in economies has been achieved by innovative ways of reducing the consumption of natural resources, particularly energy resources which has resulted in carbon emission reductions. In highlighting the importance of technological innovations, Du et al. 47 noted the continuous reduction of carbon emissions in advanced countries such as China is due to the implementation of green technological innovations. In contribution, Kirikkaleli et al. 20 argued that the emergence of technology especially renewable energy technologies has contributed towards delivering clean and sustainable energy for both household consumption. It has also facilitated the lower cost of production and efficient consumption of energy in China, improving the emissions status of the country.
Biocapacity protection
An important but mostly ignore elements in decarbonization strategies is biocapacity of the economy. The Global Footprint Network indicated that biocapacity is a critical metric for analyzing regional sustainable development success as it evaluates the ability of the ecology, environment, and natural assets to guarantee human and animal existence. In highlighting the importance of biocapacity, Wang et al. 48 noted that assessment of biocapacity is an indispensable component of sustainable development as it helps quantify the capacity of the economy to generate renewable resources and absorb wastes, including CO2 emissions.
In an earlier study, Wackernagel et al. 49 argued that protecting and enhancing biocapacity is essential for maintaining ecological balance and supporting sustainable development. The study by Qamruzzaman 50 further revealed that the sustainability of the natural environment is significantly dependent on destruction of preservation of the biodiversity and natural resources of a country. Accordingly, the conversation natural resources and protection of the biocapacity determines the efficacy of carbon sequestration of the environment and ecological strength of the country. 51
Synthesis of the relationship between the variables and the literature gaps
The drivers of circular carbonization such as renewable energy, technological innovation, and biocapacity protection, do not operate in isolation but function as an interconnected system.19,25 Renewable energy acts as a structural Substitute, thus the direct replacement of fossil fuels with renewables (solar, wind, etc.). This is the most straightforward mechanism for achieving “reduce” in the carbon context. It decouples energy production from CO2 emissions at the source. 43 Technological Innovation Act as the enabling force in the circularization process. As a critical multiplier, innovation enhances the efficiency and integration of renewable energy (e.g., via better storage), enables the “reuse” and “recycling” of carbon (e.g., through carbon capture and utilization [CCU]), and facilitates the “remove” function (e.g., via direct air capture). Furthermore, digital and material innovations improve resource efficiency across industrial processes, reducing the overall carbon footprint of production.52,53
Biocapacity protection is critical as it serves as foundational sink and resource base for the world.16,17 Biocapacity represents the natural capital that provides both the resources for a bio-economy (e.g., sustainable biomass) and the critical ecosystem services, most notably carbon sequestration via forests and oceans. 16 Protecting and enhancing biocapacity is not merely an adjacent environmental goal; it is a prerequisite for a functional circular carbon system. A degraded biocapacity means a reduced planetary capacity to absorb residual emissions, placing an impossible burden on technological solutions alone. Thus, it provides the essential sink that complements the source-side actions of renewable energy and innovation. 15 In this synergistic discussion, technological innovation accelerates the renewable transition and manages carbon flows, while a protected biocapacity provides the ultimate sink and resource base, ensuring the long-term viability and resilience of the entire system. This study empirically tests this theoretical logic within the critical context of the BRI.
Fundamentally, a critical synthesis of current literature on CCE showed that significant effort has been made by previous studies towards unravelling the various factors determining CCE.4,54,55 With the use of c conventional econometric model, past studies presented compelling evidence on the relationship between renewable, technological innovation and biocapacity and CO2 emission. However, the literature so far has failed to categorically establish the extent to which each of the proximate drivers influence CCE in the BRI region, thus creating a gap that could hinder the circularization of economies. Additionally, though the some studies highlighted the importance of maintaining ecosystems as carbon emissions continue to rise, current studies on CCE has overlooked the socio-economic challenges associated with bio-conservation efforts and the implications for circular carbonizing rapid developing economies such as those in the BRI region. This heightens the need for studies that could help scholars and policy makers determine the actual deterministic indicators of CCE and mostly important how to align biocapacity protection with current economic activities.
With the advent of technological innovations and AI, ML has emerged as a powerful tool in environmental sciences, offering novel insights and predictive capabilities that traditional statistical methods might miss. 56,57 ML techniques have been applied successfully in various areas, including predicting air quality, 58,59 modeling energy consumption, 60,61 and optimizing resource management. 62,63 Within the context of CCE, machine learning can analyze complex datasets to identify patterns and relationships between economic activities and carbon management practices.
Past studies demonstrated ML's utility in enhancing the accuracy of emissions forecasting and evaluating the potential impacts of different carbon reduction strategies, which is critical for circular carbonizing the BRI region. However, the application of ML in integrating CCE within the economic frameworks of the BRI countries is relatively underexplored, presenting a significant opportunity for its application in this research. Moreover, there is a notable gap in the literature concerning the quantification of impacts from specific CCE initiatives, especially in diverse and economically disparate regions like those involved in the BRI. It is against these gaps that the study employed ML as a robust predictive modeling technique to determine the actual CCE Proxy measures in the BRI. By this, the study made significant contributions to both theory and practice.
Methods and materials
Data description
The study was carried in the BRI region across 16 upper-middle countries under the BRI compact, utilizing dataset covering environmental and economic indicators. These countries include Azerbaijan, Bosnia and Herzegovina, Bulgaria, China, Costa Rica, Ecuador, Jordan, Kazakhstan, Lebanon, Malaysia, South Africa, Romania, Russia, Thailand, Tunisia, and Turkey (see Figure 2). According to the World Bank, these countries are classified as upper-middle-income countries. These countries were carefully and purposively chosen due to their similarities in economic growth, energy consumption and investment potentials. In the selecting these countries, we also considered the frequency and level of investments from the BRI secretariat into these countries over the period under consideration. The shared characteristics among the BRI countries have a direct influence on investment and policy decisions of the BRI secretariat. The data were sourced from the IEA, World Bank, OECD, Global Footprint Network, Our World in Data, and the BRI databases.
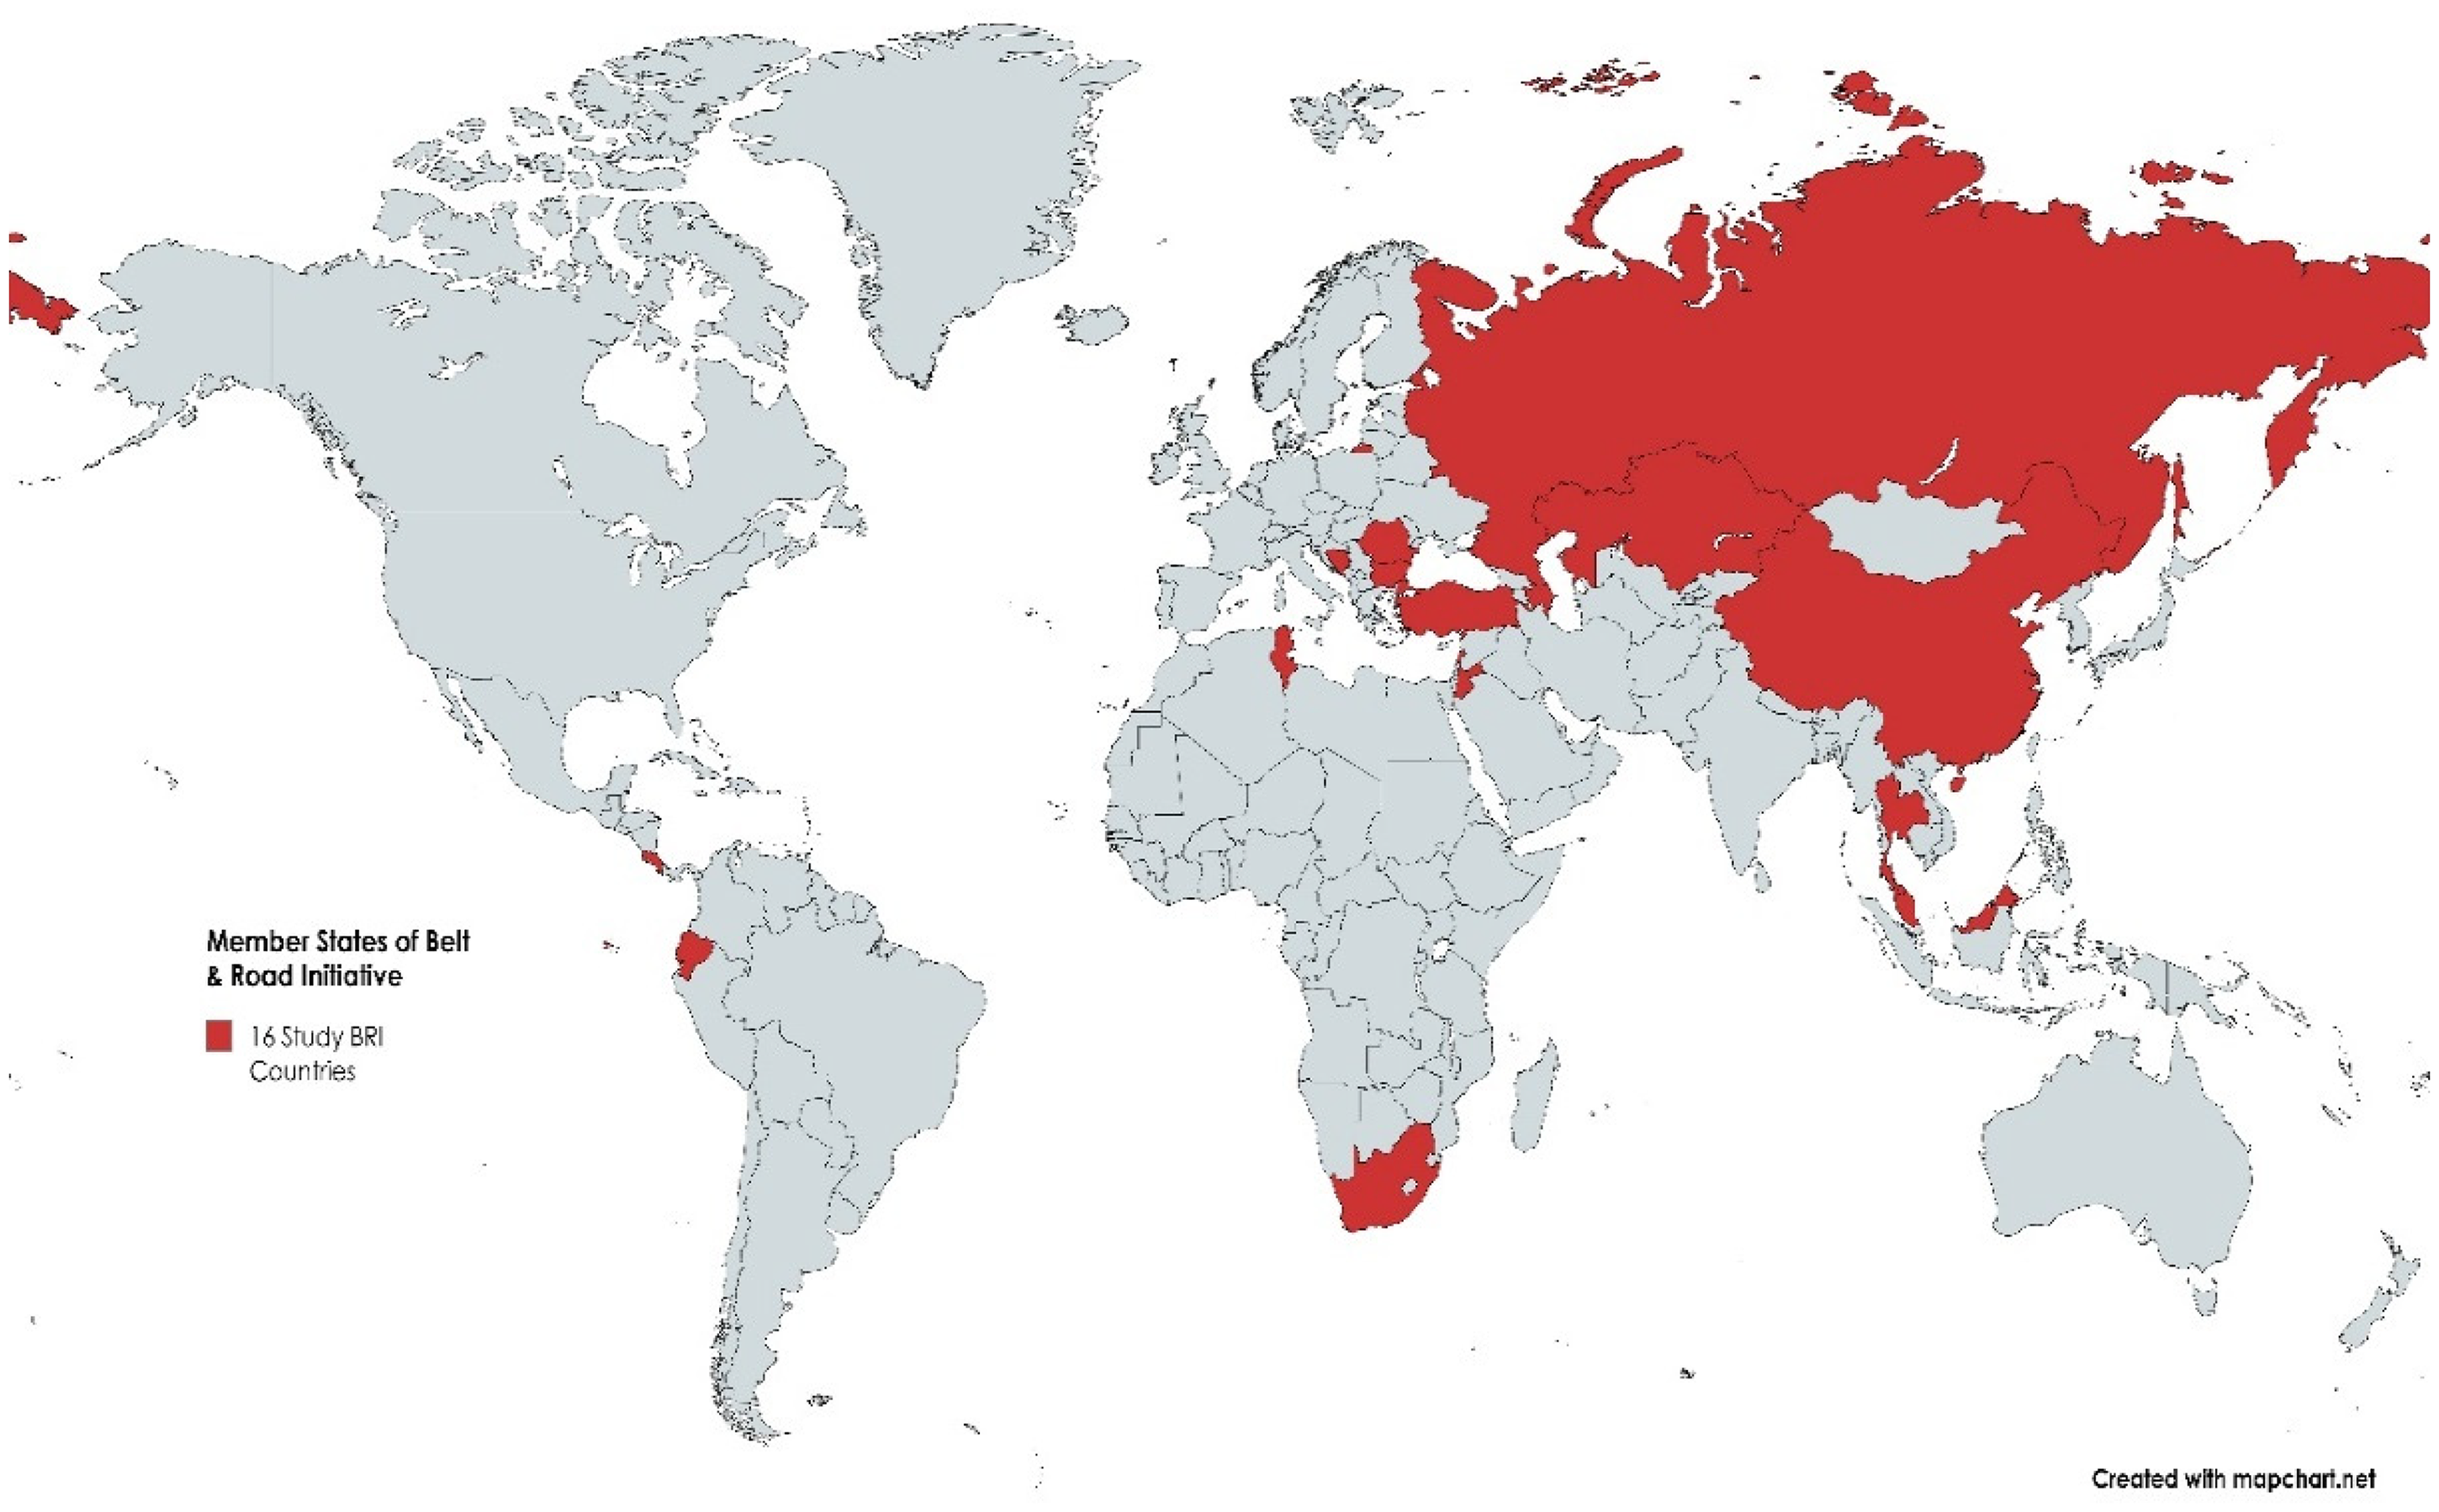
World map showing BRI member states studied.
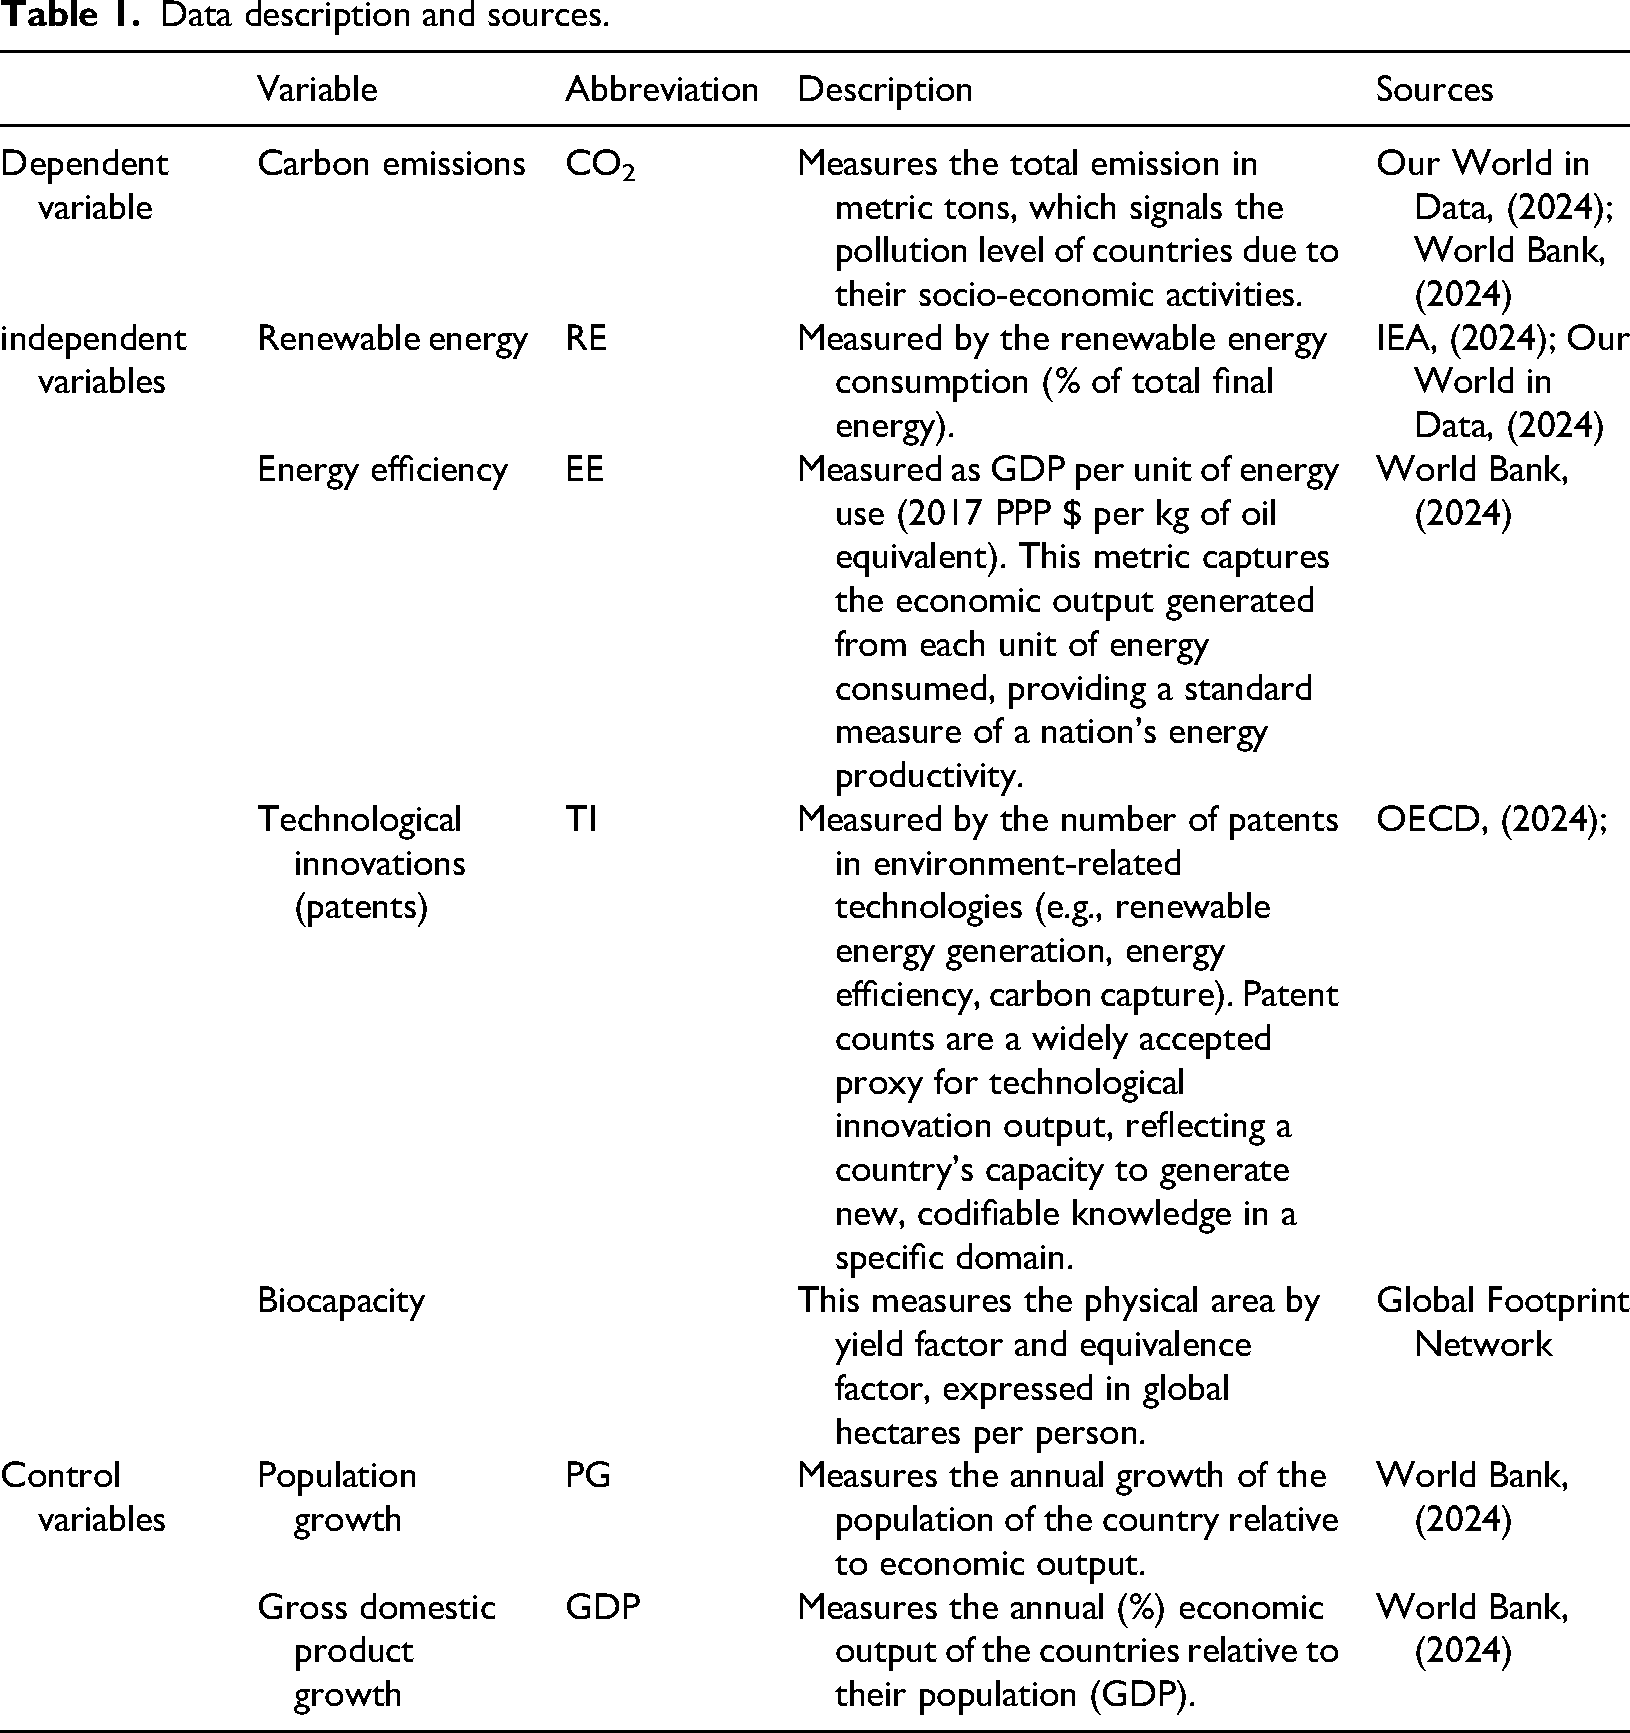
For the purpose of this study, seven environmental and economic indicators, which CO2 emissions, renewable energy, energy efficiency, technological innovation, biocapacity, population growth and GDP growth (see Table 1). The dataset covered a period of 22 years, spanning from 2000 to 2021. The CO2 emissions were considered as the dependent variable (explained) whiles renewable energy, energy efficiency, technological innovation, biocapacity were the explanatory variable. Population growth and GDP growth were also treated as controlled variables. A significant number of previous scholars have utilized these variables in their studies, based on which the relationships that exist between these important indicators were established.64–67 The widely utilization of these variables and their ability to show the consequences of the economic and environmental policies on the CO2 emissions justified their consideration in this study.
Data description and sources.
Data preprocessing
The data underwent several preprocessing steps to ensure quality and consistency for machine learning analysis. The initial dataset exhibited a missing data rate of less than 5%, which was determined to be missing completely at random (MCAR) via Little's test. Given the low rate and MCAR nature, we employed a K-Nearest Neighbors (K-NN) imputation method (with k = 5) to handle missing values. This method estimates missing values based on the feature similarity of the k-most similar observations, preserving the dataset's structure and variability better than mean imputation. 68 To assess potential imputation bias, we conducted a sensitivity analysis by comparing the descriptive statistics and distributions of the original and imputed datasets; no significant distortions were observed. Following imputation, all continuous variables were standardized to a mean of zero and a standard deviation of one to mitigate the influence of differing scales on the machine learning algorithms.
Feature selection
Feature selection in this study was approached through a thoughtful blend of domain expertise and automated selection techniques to pinpoint the most relevant predictors for CCE outcomes. The process began with a correlation analysis (see Figure 1), which served to identify and prioritize features that showed a high correlation with the target variable, CO2 emissions. This step ensures that the most statistically significant variables are considered for model training. Subsequently, importance metrics from preliminary models, such as decision trees, were utilized to assess the relevance of each feature in the dataset. Features that demonstrated low importance scores, indicating the minimal influence on the model's predictions, were flagged for potential removal to streamline the model.
Model selection
The selection of appropriate machine learning models for this study was guided by the nature of the data and the specific research objectives. The study favors RF and Gradient Boosting models, which are widely used by previous scholars because they offer distinct advantages in terms of prediction accuracy, interpretability, and handling of various data types and structures. 69 The study favored these models because they are powerful analytical tools capable of capturing complex, non-linear relationships and interactions between a wide array of predictors while providing robustness against overfitting and variance in data typical of multi-national datasets like those found in the BRI region. 70 While traditional econometric models (e.g., Fixed/Random Effects panel models) are excellent for establishing average marginal effects and testing pre-specified hypotheses, they often struggle with complex, non-linear, and interactive relationships unless these are explicitly modeled. The drivers of CO2 emissions within the heterogeneous BRI economies are unlikely to be purely linear or additive. ML models like RF and GB are inherently designed to capture these complex patterns without strong a priori assumptions about the functional form of the relationships.71,72
It is important to indicate the aim of this study was not only to estimate parameters but to predict CO2 emissions and identify the most influential drivers from a set of candidates. Traditional models provide coefficient estimates and p-values, which indicate statistical significance but not necessarily predictive importance. The feature importance metrics from RF and GB directly rank variables by their contribution to predictive accuracy, 73 offering a data-driven perspective on which factors are most critical in the CCE framework. 1 This is a complementary approach that can reveal insights potentially missed by theory-driven models. Finally, economic and environmental data often contain multicollinearity (e.g., between GDP, energy use, and innovation). While this can destabilize coefficient estimates in linear models, tree-based models are more robust to correlated features, providing a more stable assessment of variable importance.
Model training and validation techniques
For the purpose of training and validation, the dataset was split into two categories (training and testing sets) based on an 80–20 split. In addition, k-fold cross-validation as a cross-validation procedure was employed to ensure the robustness of the models. This also prevented overfitting of the variables. The validation of the models to ensure their accuracy and robustness was a critical part of the methodology. This study utilized several advanced validation techniques designed to thoroughly test and confirm the reliability of the predictive models developed. Initially, k-fold cross-validation, specifically with k = 10, was employed. This method involves dividing the entire dataset into ten equal parts, using nine parts for training and one part for testing. This process is repeated ten times with a different part used as the test set each time, allowing the models to be tested across all subsets of the data. Such a technique is crucial in minimizing the potential for overfitting and ensuring that the model's performance is consistent regardless of the data segment used.
In addition to cross-validation, the models were evaluated using specific performance metrics. The root mean squared error (RMSE) was used to quantify the prediction accuracy by measuring the average magnitude of the prediction errors, providing a clear idea of how much error the model typically makes in its predictions. R2 was also utilized to determine the proportion of variance in the dependent variable that could be predicted from the independent variables, offering insights into the effectiveness of the model in explaining the variability of the data.

where:
Furthermore, resampling techniques, particularly bootstrap methods, were applied. These techniques involve repeatedly sampling a subset of the data, fitting the model, and evaluating its performance on the resampled data. This approach helps estimate the confidence intervals of the model predictions, thereby providing valuable insights into the stability and reliability of the models across different samples. These robust validation techniques collectively ensure that the models developed are not only accurate and efficient but also reliable and generalizable across various scenarios and datasets.
The standard implementations of RF and Gradient Boosting assume that observations are independent and identically distributed (IID). However, our dataset, being a panel of countries over time, inherently violates the independence assumption due to temporal autocorrelation (observations from the same country in consecutive years are correlated) and cross-sectional dependence (countries may be subject to similar global shocks in a given year). A violation of the IID assumption can lead to overconfident feature importance estimates and potentially inflate the model's perceived predictive accuracy, as the model may be learning spurious time-specific or country-specific patterns rather than generalizable relationships.
Addressing panel data structure
A key limitation of the initial pooled machine learning approach is that it treats all 352 country-year observations as independent, failing to explicitly model the panel structure of the data. This means the model could not disentangle the within-country effects (how a change in a variable within a country affects its CO2 emissions) from the between-country effects (how differences between countries drive differences in emissions). Unobserved time-invariant country-specific factors (e.g., geographic, cultural, or institutional characteristics) and common temporal shocks could potentially confound the results if correlated with both the predictors and the outcome.
To account for this unobserved heterogeneity, this study incorporated country and year fixed effects into the machine learning models by including dummy variables for each country (15 dummies) and each year (21 dummies) as additional features. This approach, while computationally intensive, allows the tree-based models to learn and control for the baseline emission level of each country and the global trends affecting all countries in a given year, thereby providing a more robust estimate of the relationship between our core variables of interest and CO2 emissions. To benchmark the ML models, we estimated a linear fixed effects panel regression model.
Results and discussions
Descriptive statistics
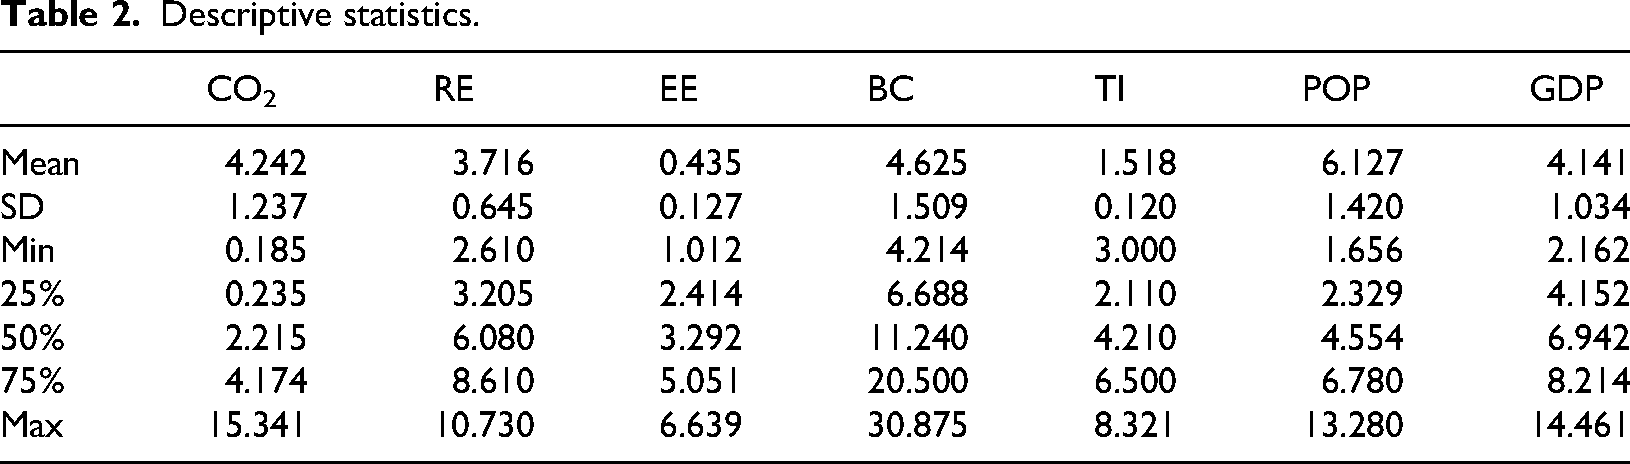
Prior to model training, the study conducted a descriptive analysis of the variables. Table 2 presents the summary statistics (mean, standard deviation, minimum, and maximum) for all variables used in the study. The results show a dramatic variation in carbon footprints, with emissions ranging from a minimum of 0.185 to a maximum of 15.341 metric tons per capita. The high standard deviation (1.237) and the fact that the 75th percentile (4.174) is significantly lower than the maximum value indicate a highly right-skewed distribution. This indicates that a majority of BRI countries cluster at moderate to low emission levels, while a small number of nations are extreme outliers, responsible for a disproportionately large share of the region's total CO2 output. This heterogeneity is a fundamental characteristic of the BRI and underscores the necessity for differentiated, rather than uniform, carbon reduction policies. The renewable energy sector shows significant potential for growth. With a mean consumption of only 3.716% of total final energy and a maximum of 10.730%, the data confirms that the BRI region remains heavily reliant on non-renewable energy sources. The interquartile range (25th percentile: 3.205%, 75th percentile: 8.610%) shows that most countries are at the early stages of their energy transition. The energy efficiency variable shows a moderate mean (0.435) with a considerable spread (Min: 1.012, Max: 6.639). The fact that the 25th percentile (2.414) is significantly lower than the 75th percentile (5.051) points to a substantial performance gap in energy productivity among member states.
Descriptive statistics.
Summary of the evaluation metrics.
The values for biocapacity is critical the objective of the study. The median value is 11.240 global hectares per person, but the mean is pulled down to 4.625 by a long left tail (Min: 4.214). This, combined with the 75th percentile being 20.500, indicates an extremely uneven distribution of ecological assets. A few resource-rich nations possess vast biocapacity, while many others operate at or near an ecological deficit. The very low mean (1.518) and the narrow interquartile range for environmental technology patents indicate a consistently low level of green innovation output across most BRI countries. The concentration of values at the lower end suggests a significant “innovation gap” in developing and commercializing environmentally relevant technologies, which is a major barrier to transitioning to a CCE.
Both population and GDP show positive growth on average (6.127% and 4.141% respectively). The positive GDP growth aligns with the BRI's objective as a driver of economic development. However, this growth, coupled with population increases, creates inherent pressure for higher energy consumption and resource use, posing a direct challenge to decarbonization efforts.
The correlations matrix (see Figure 3) provides an initial, linear perspective on the relationships, which complements the non-linear relationships captured by the ML models. From the visualization, CO2 emissions showed a notable negative correlation with renewable energy, indicating that countries with a higher reliance on renewable energy tend to have lower CO2 emissions. A strong positive correlation exists between energy efficiency and technological innovation, suggesting that countries investing in technology also tend to be more efficient in their energy usage. Additionally, a positive correlation between renewable energy and biocapacity implies that countries with greater ecological resources are more likely to adopt renewable energy sources.
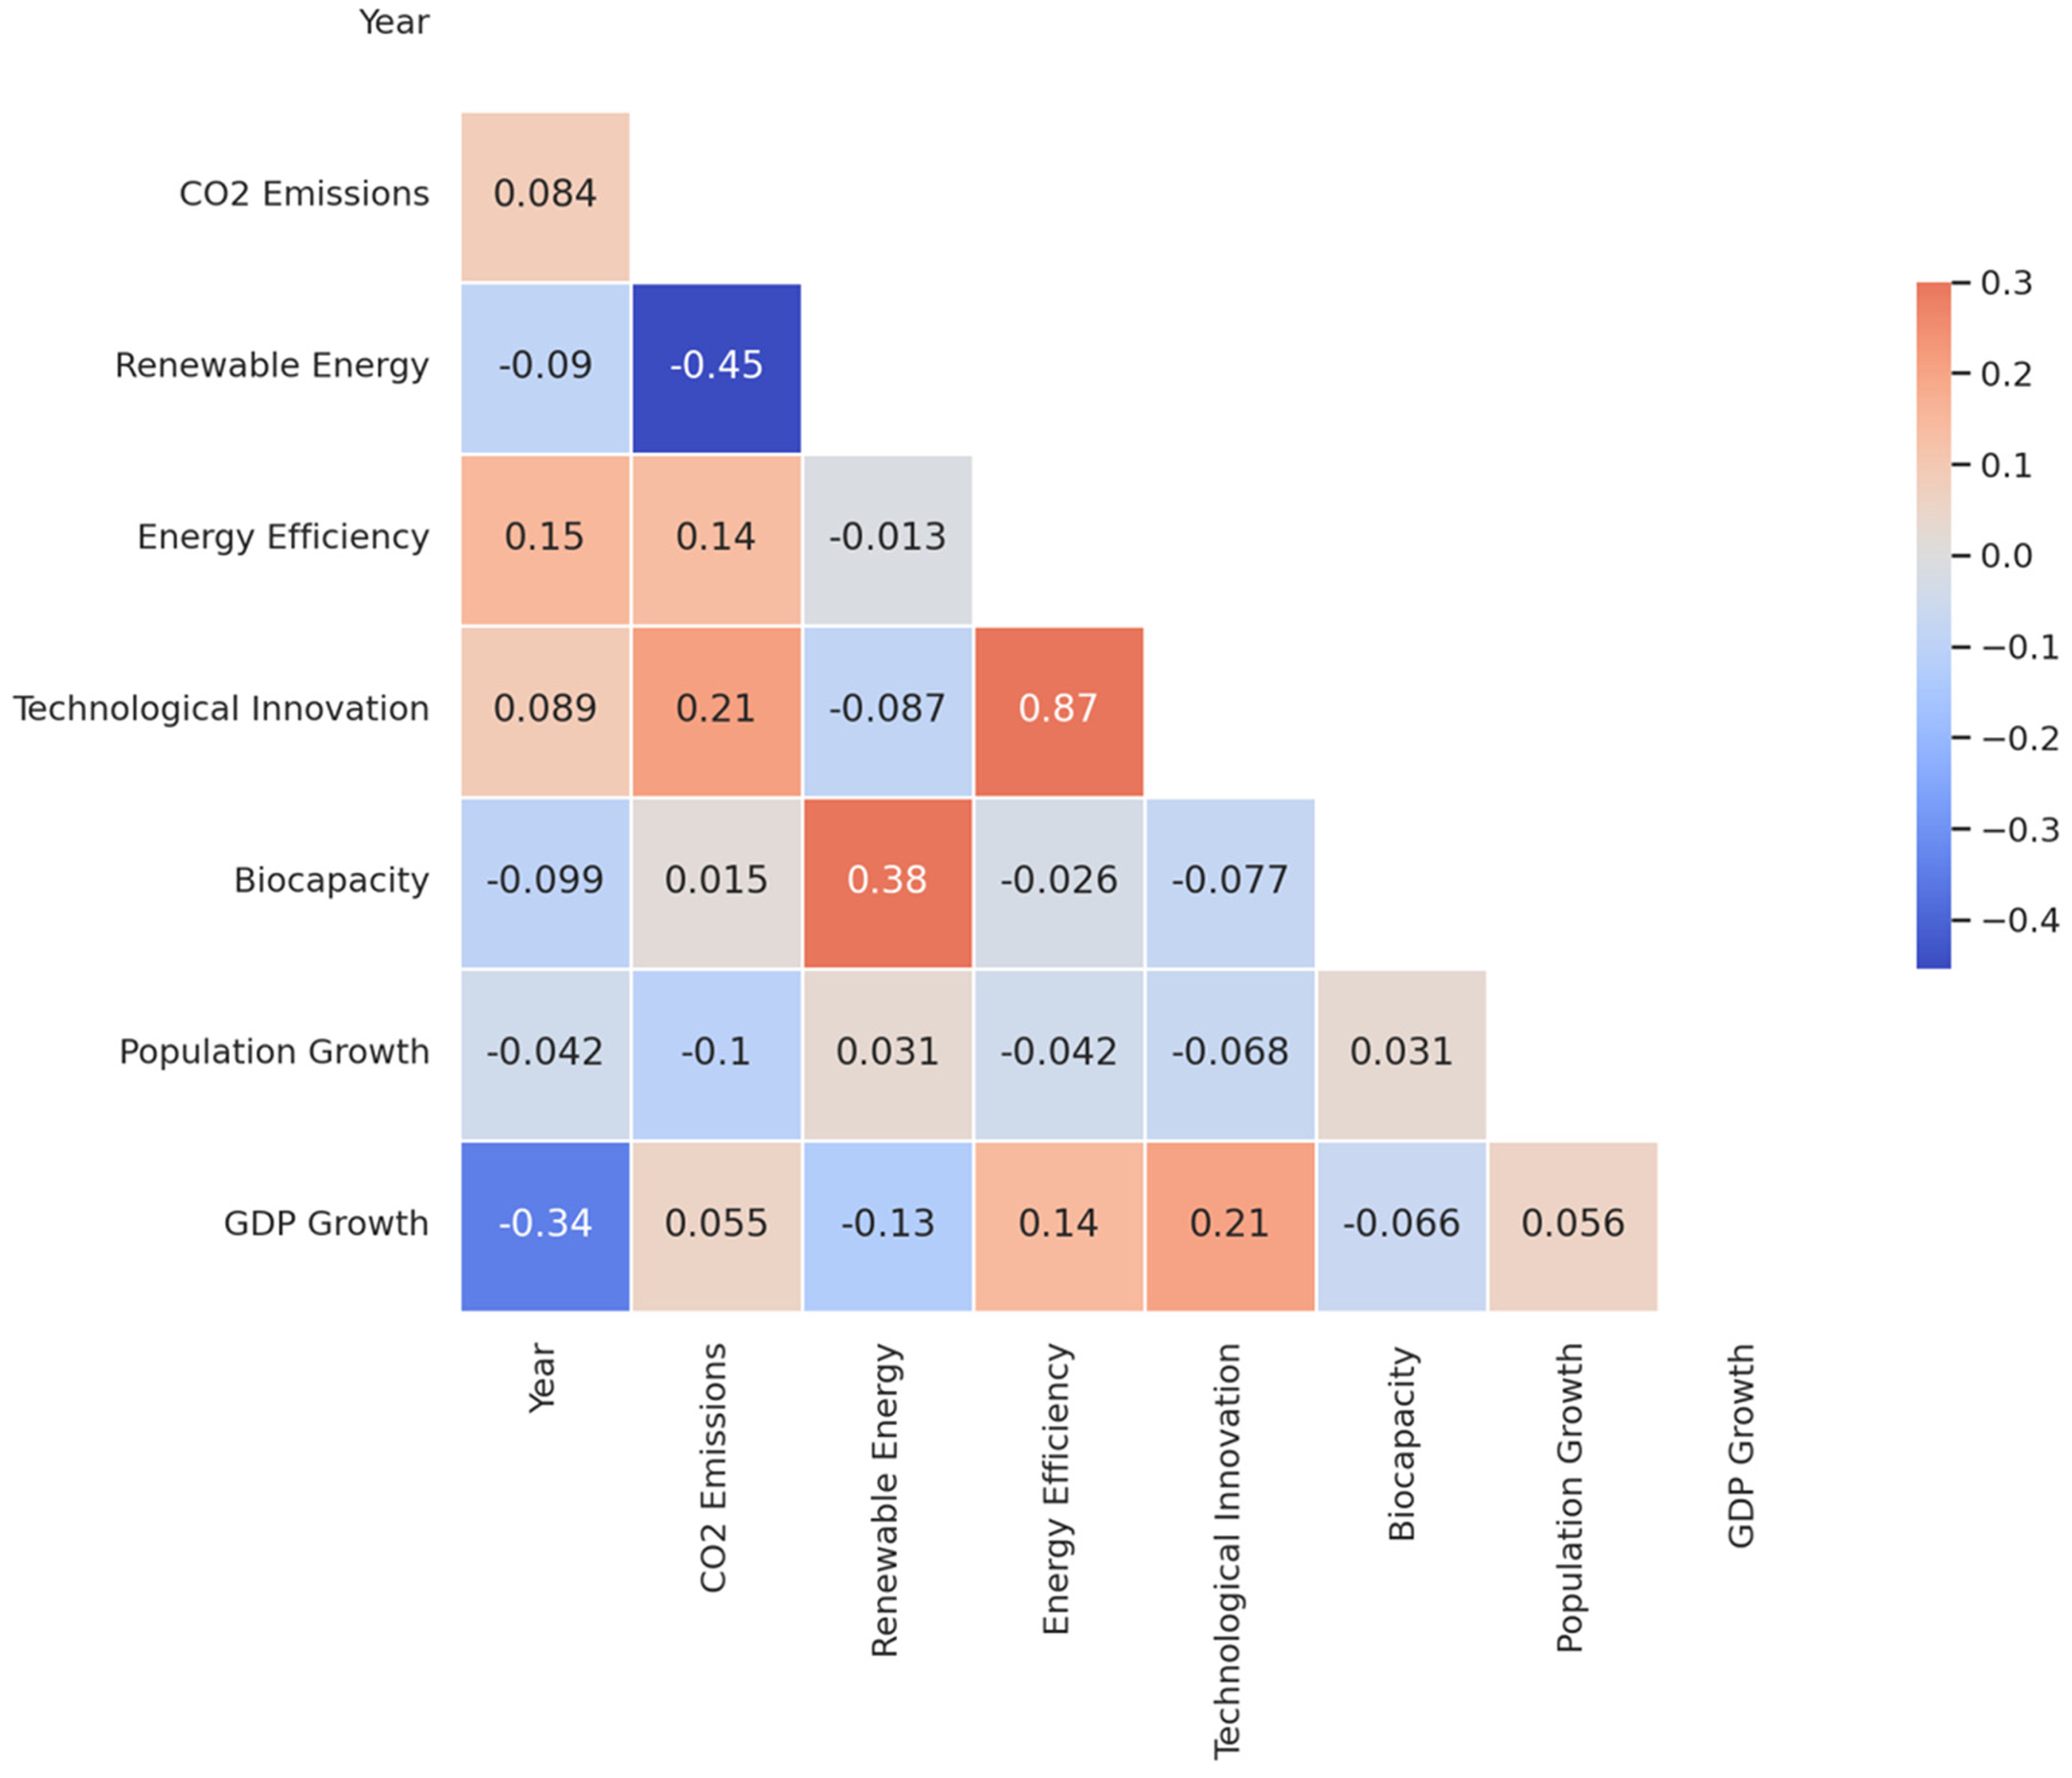
Correlation matrix of variables in the dataset.
The results in Figure 4 show the density of points between two variables from the dataset. This was exhibited the intricate relationships between the dependent variable and the highly correlated independent variables as well as the independent/control variables, which showed some level of correlation. The color scale, ranging from dark blue to yellow, represents the concentration of data points, with yellow indicating areas of higher density and dark blue indicating areas of lower density.
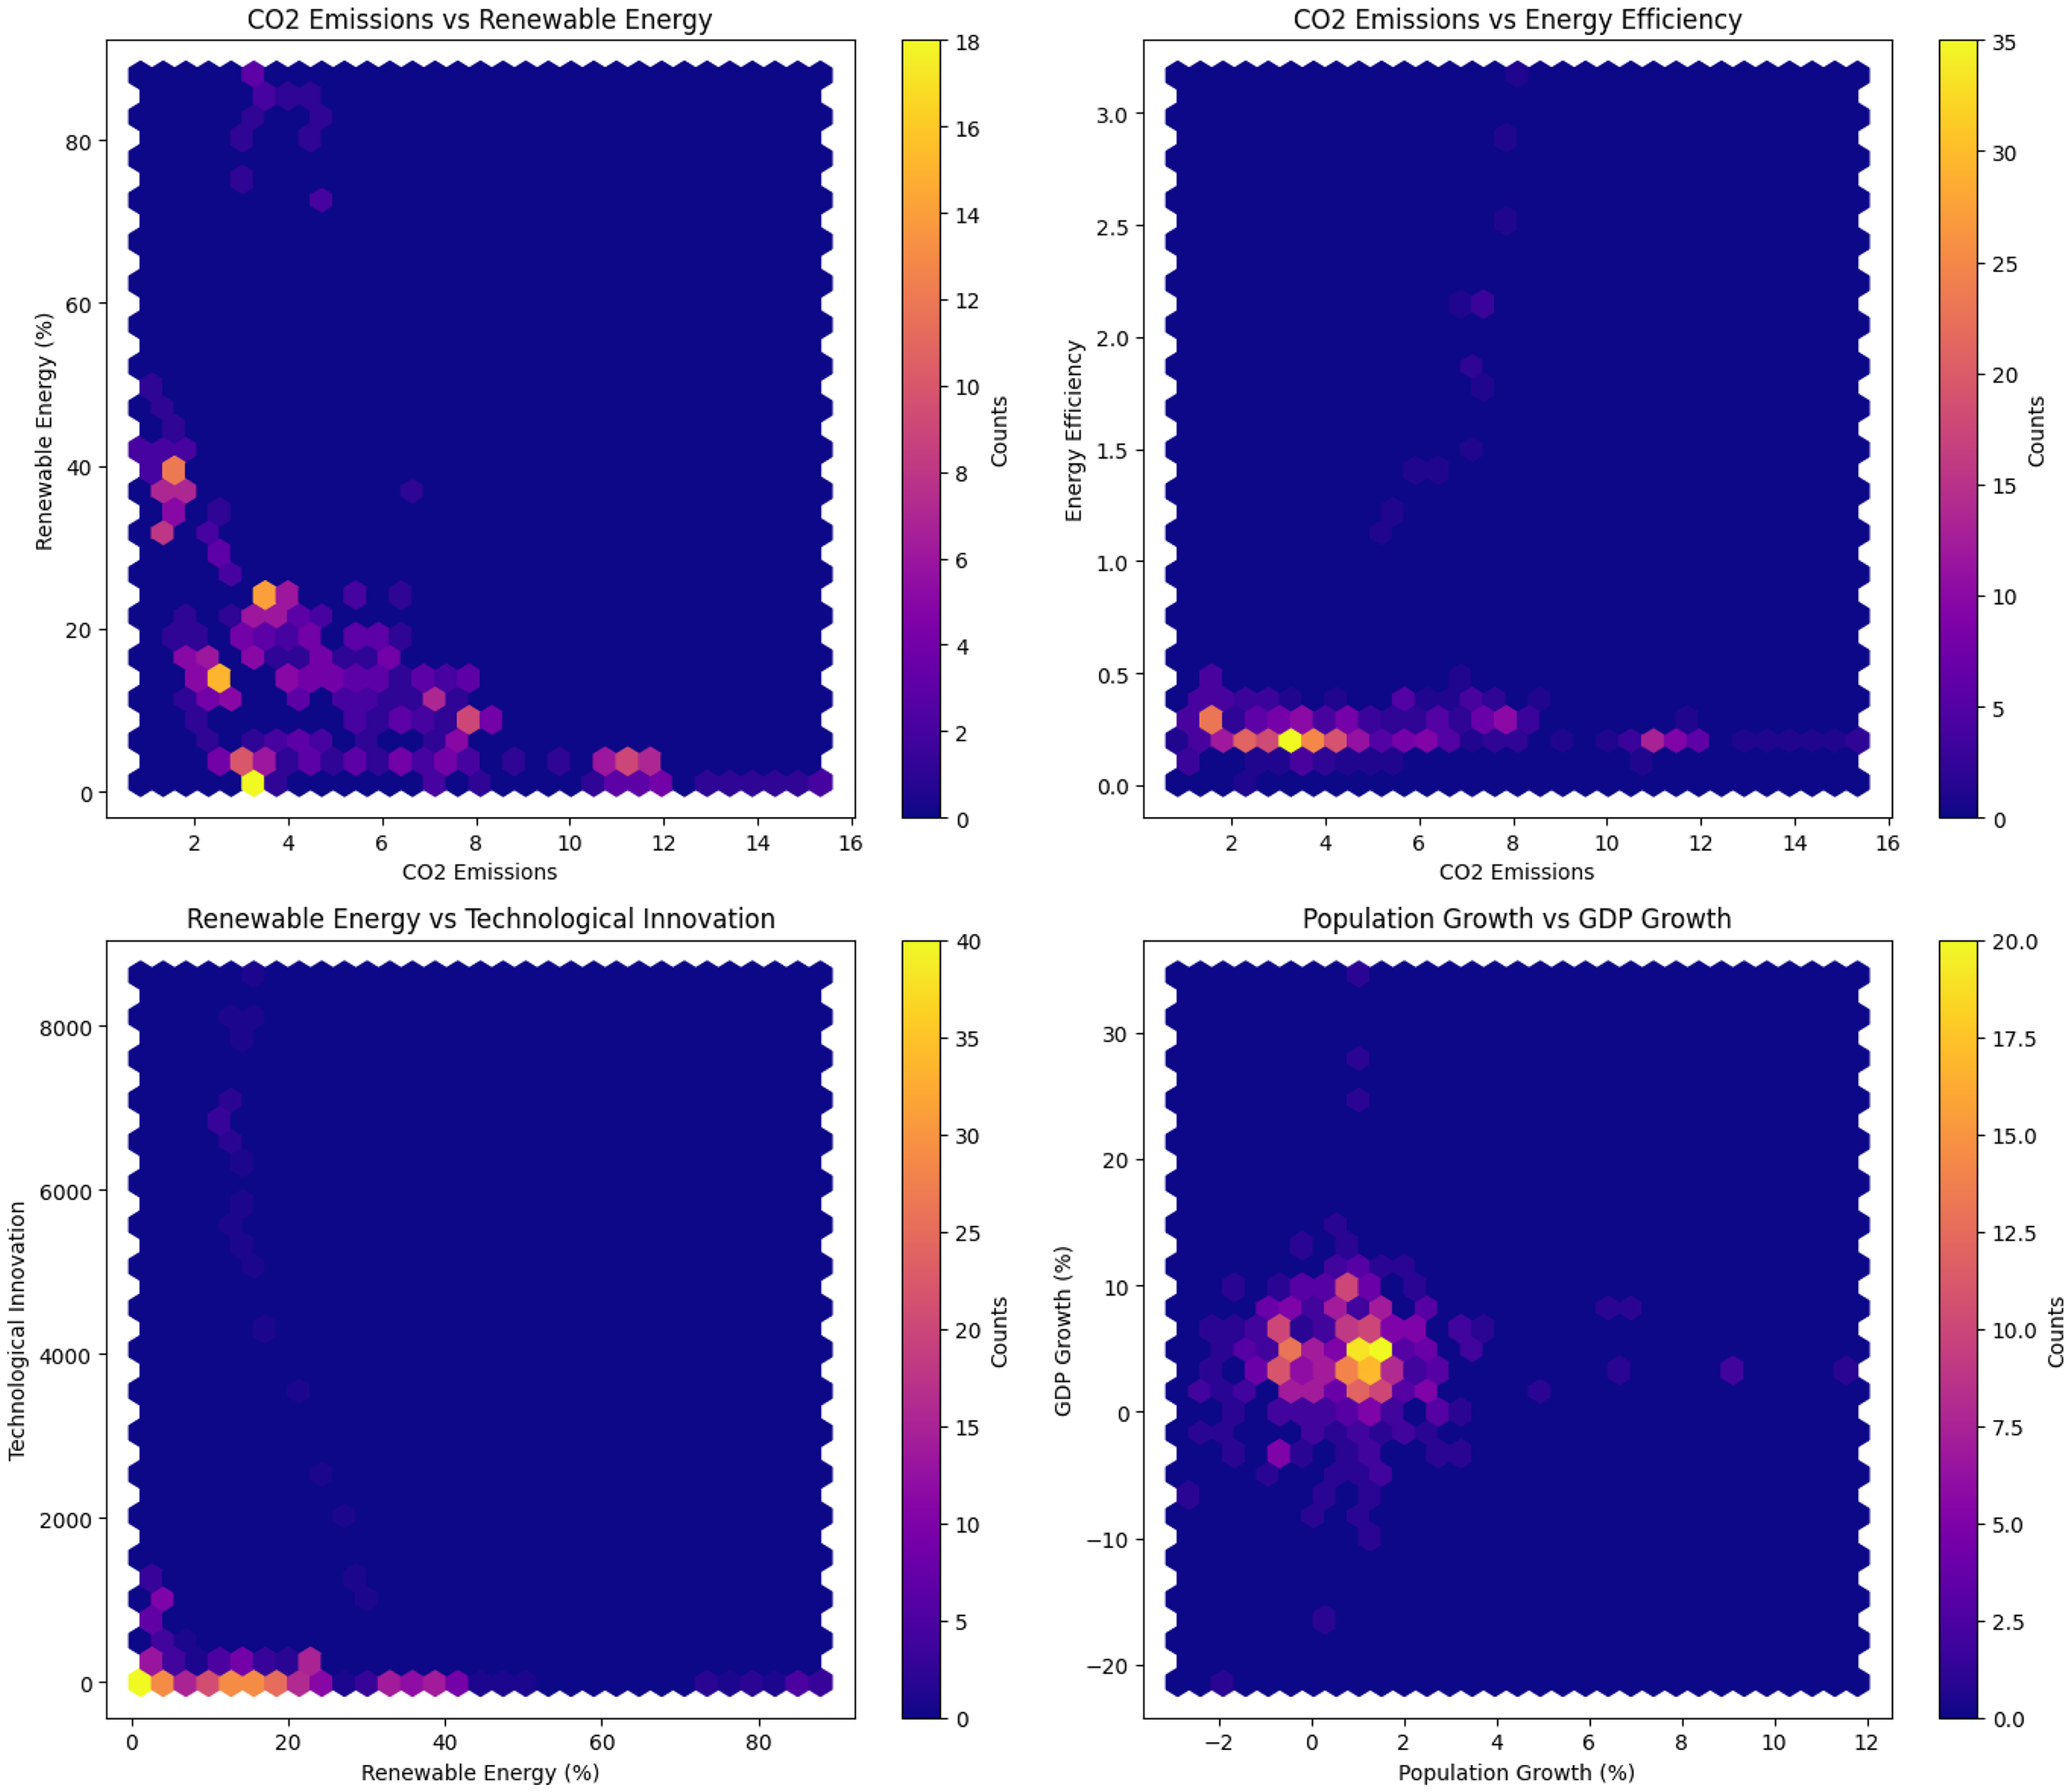
Analysis of energy, innovation, and economic factors across CO2 emissions, renewable energy, and population growth.
The relationship between CO2 emissions and renewable energy adoption is complex, with a high density of countries clustered at low levels for both variables (Figure 4, top-left). This suggests that many BRI nations have yet to decouple low emissions from low energy use through renewables, highlighting a significant opportunity for transition. The sparse distribution in the higher ranges of both variables suggests limited data in those regions.
The top-right plot explores the relationship between CO2 emissions and energy efficiency. The plot reveals that most data points are concentrated in regions of low CO2 emissions and low energy efficiency, indicating a potential correlation where entities with low emissions may not necessarily have high energy efficiency. This could highlight regions where efficiency measures are not the primary focus for reducing emissions.
In the bottom-left plot, the relationship between Renewable Energy and Technological Innovation is shown. There is a concentration of data points at low levels of both variables, implying that many entities with lower reliance on renewable energy also score lower on technological innovation, which may suggest an interdependence between the adoption of renewables and innovation.
The bottom-right plot examines Population Growth versus GDP Growth. Here, a cluster of points can be seen around small positive GDP growth and low or negative population growth, possibly indicating that moderate economic growth is observed even in areas with declining populations. There are also some instances of higher GDP growth correlating with more positive population growth, but these are less common.
Machine learning predictions: model performance and comparative analysis
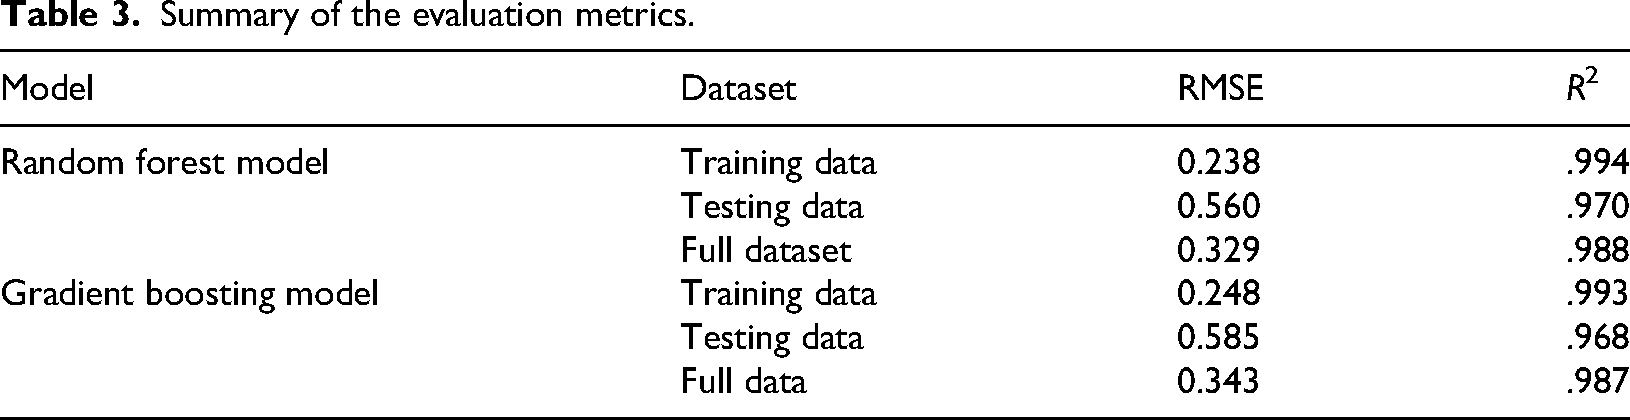
Both the RF and Gradient Boosting (GB) models demonstrated exceptional predictive power, confirming their suitability for capturing the complex, non-linear relationships within the BRI environmental dataset (Table 3). RF Model exhibited an R2 of .994 and the GB Model slightly lower at 0.993. These estimates are extremely high, suggesting that these models may be too powerful for the data. Alternatively, the estimate could indicate data leakage or insufficiently independent test set. Irrespective of these observation, the high values demonstrate that both models are highly effective in capturing the intricate relationships within the training data. However, when assessing performance on the testing data, the models exhibit a slight decline in accuracy. The RF Model achieved an R2 of .970, and the GB Model recorded a marginally lower R2 of .968. The corresponding RMSE values also increased, with the RF Model at 0.560 and the GB Model at 0.585, indicating that although both models generalize well, they experience some loss in precision when applied to new, unseen data. The performance on the full dataset further corroborates the robustness and utility of both models in broader applications, with the RF Model achieving an R2 of .988 and the Gradient Boosting Model closely following with an R2 of .987 (See Table 3). This confirms the models’ generalization capabilities and validates their applicability across the entire dataset.
Additionally, the most critical guard against overfitting is performance on unseen data. The models maintained high R2 values on the test set (.970 for RF, .968 for GB). The gap between training and test performance, while present, is reasonable and indicates that the models learned generalizable patterns rather than just memorizing the training noise. The average R2 values of .955 (RF) and .958 (GB) across all folds are still very strong and confirm that the model performance is consistent across different data subsamples, not dependent on a single train-test split. The high explanatory power may also be partly attributed to the aggregated, country-level nature of the data, where many underlying complex micro-relationships are averaged out, leading to more predictable macro-level trends.
Figure 5 provides a visual representation of the predictive performance of the RF and GB models, illustrated through scatter plots of actual versus predicted CO2 emissions. The plots are segmented to show results for both training data (left plots) and testing data (right plots), for each model.
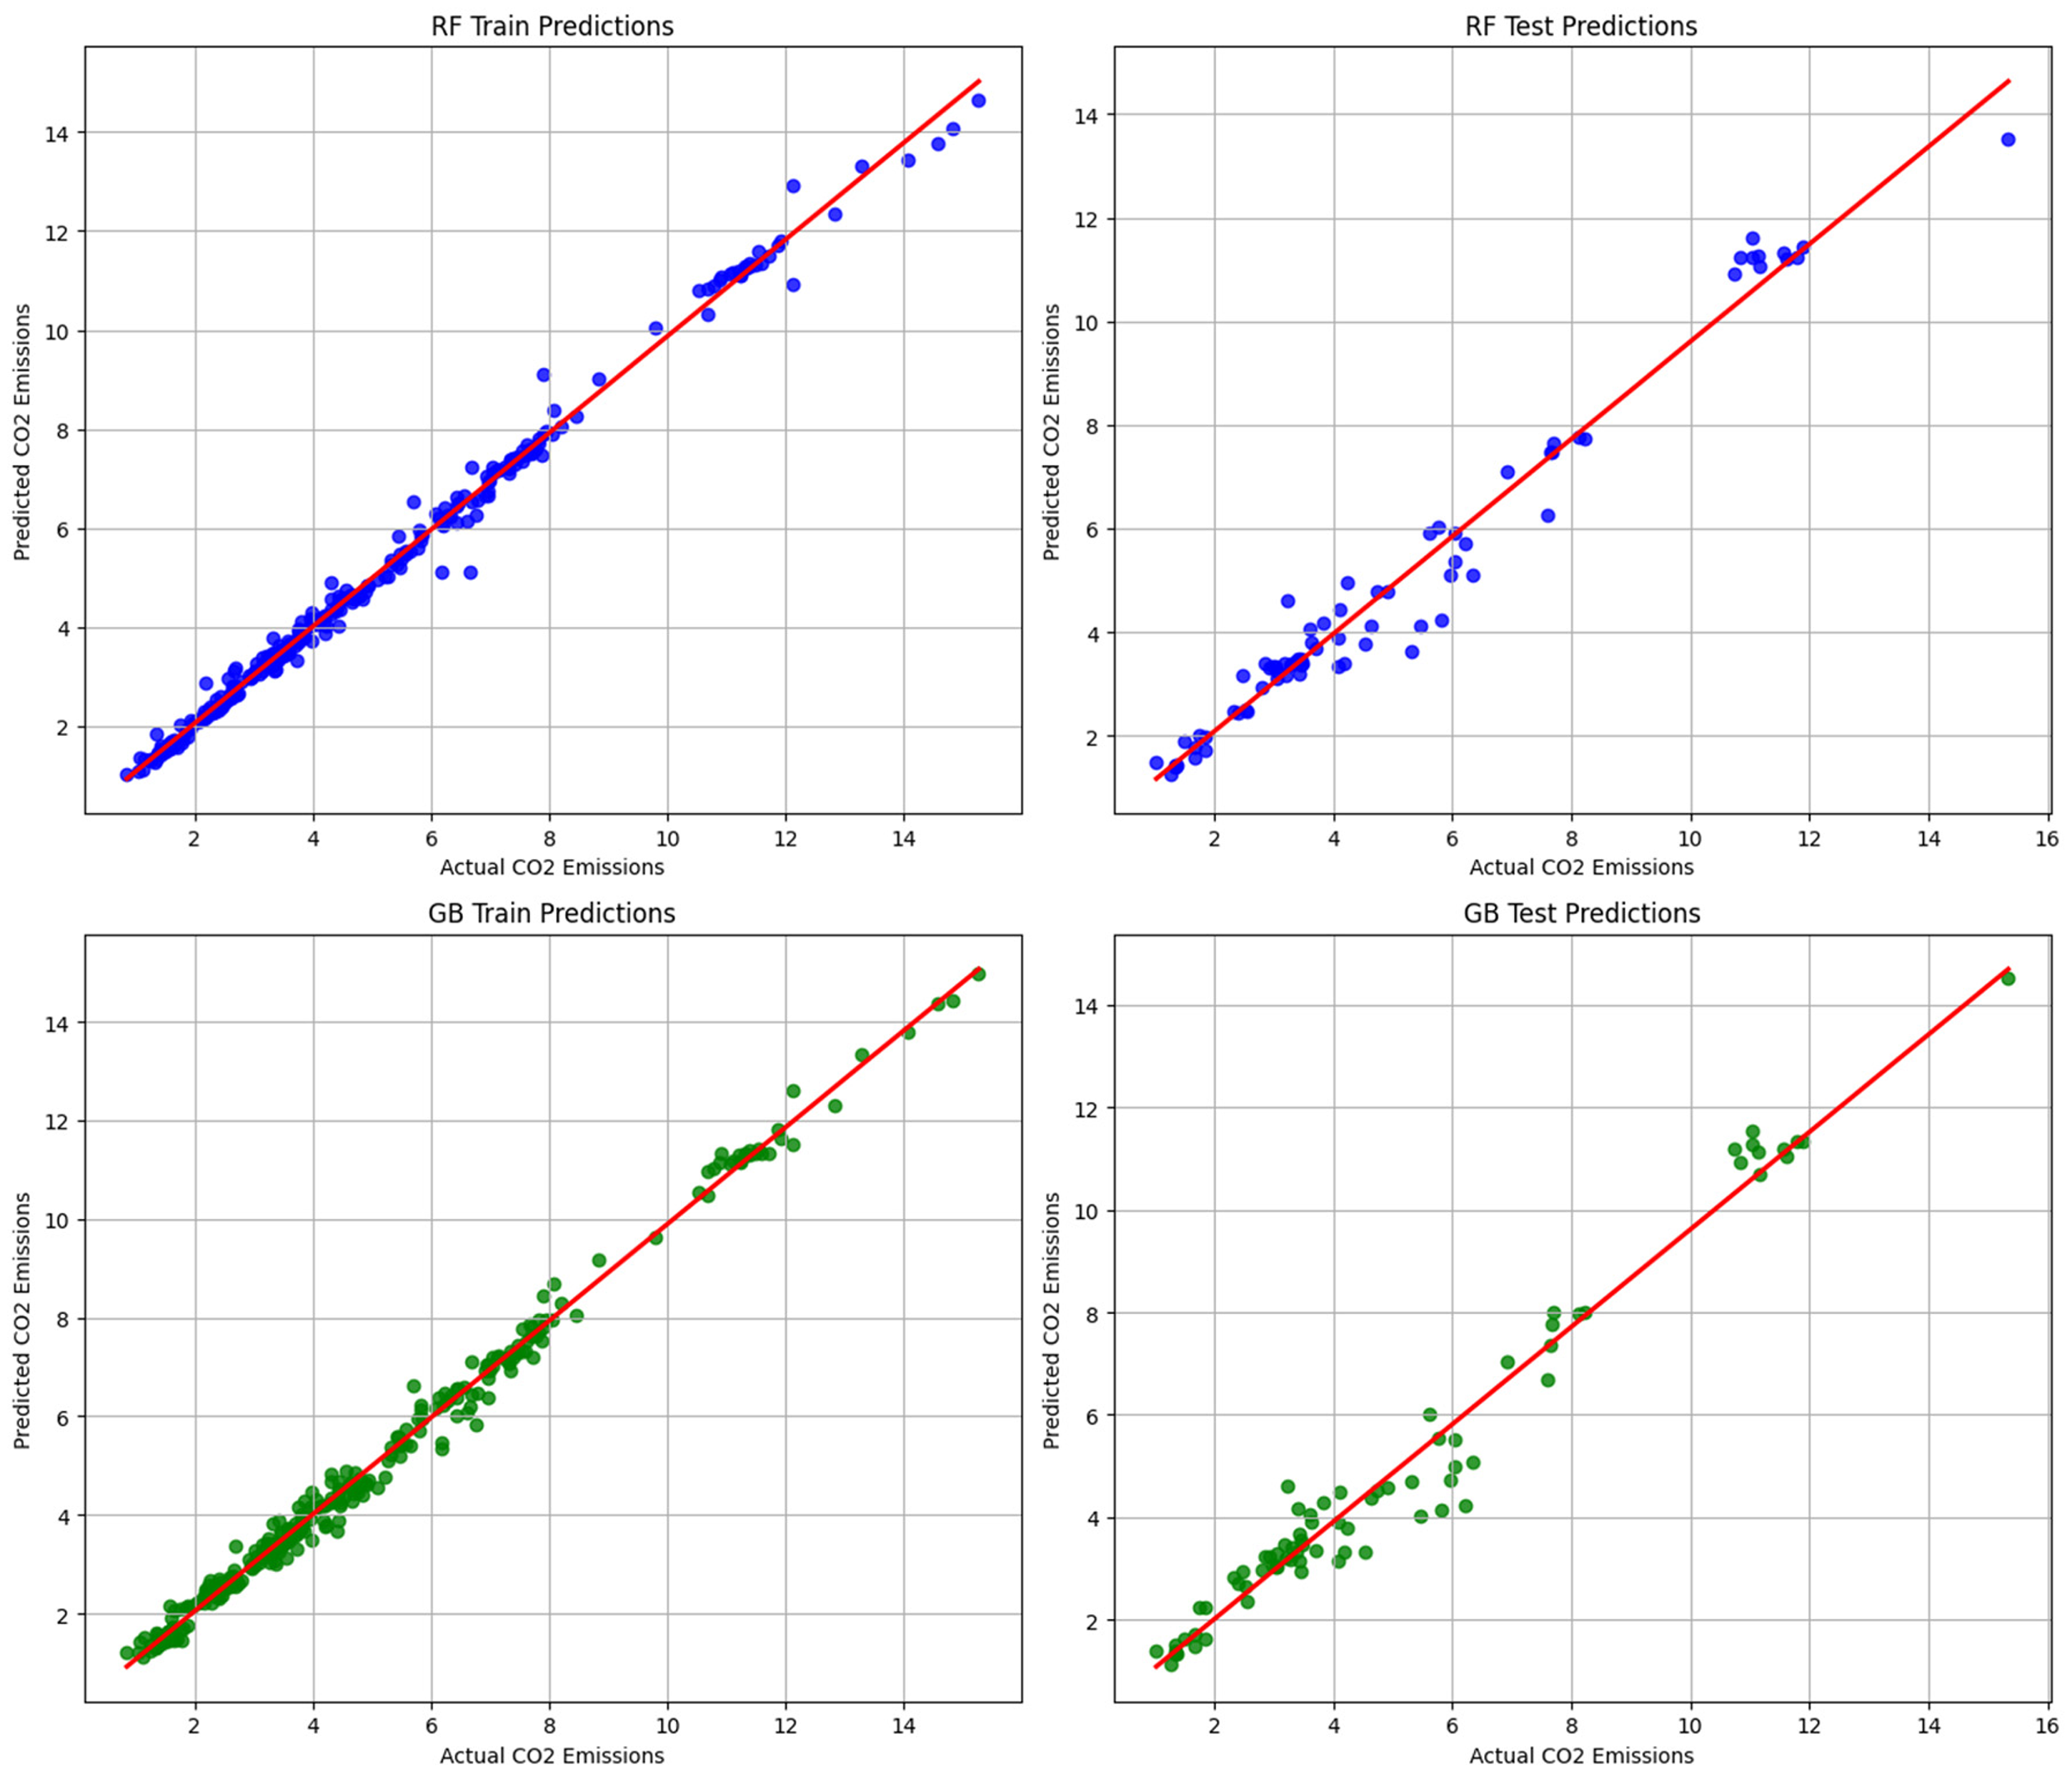
Predictive performance of RF and GB models.
The training data plot for the RF model shows points closely clustered around the line of best fit, indicating a high level of accuracy in predictions, with an R2 of .994. This is reflective of the model's ability to capture the underlying patterns within the training data effectively. The testing data plot, while still showing a good fit (R2 of .970), displays slightly more dispersion of points from the line, suggesting a reduction in prediction accuracy when the model is applied to unseen data.
Similar to the RF model, the GB training data plot shows a tight clustering of points along the line of best fit, demonstrating an R2 d of .993 and highlighting the model's strong learning capabilities. The plot for the testing data reveals a marginal increase in point dispersion compared to the training data, with an R2 of .968, indicating that while the GB model generalizes well, it does experience a slight drop in performance on new data.
To directly address the non-independence of country-level data, a Leave-One-Country-Out (LOCO) cross-validation was performed. The average performance across all held-out countries was RMSE = 0.82 and R2 = .91. While this represents a predictable decrease from the full-dataset performance (as the model is now tasked with predicting for a country it has never seen, with potentially unique structural characteristics), it confirms that the core relationships identified by the model are generalizable across the BRI region. The feature importance rankings derived from the LOCO analysis remained consistent with our primary findings, reinforcing the dominance of biocapacity.
Feature importance: an analytical explanation of the dominant drivers of circular carbonization
The feature importance analysis, consolidated from both RF and GB models (See Figure 6). For both models, “Biocapacity,” “Renewable Energy” and Technological Innovation emerged as significant predictors, reflecting their strong roles in influencing CO2 emissions outcomes followed technological innovations. Interestingly, “Biocapacity” appears to be slightly more influential in the RF model than in the GB model, suggesting that the way each model processes information and learns from the data might affect the perceived importance of features.
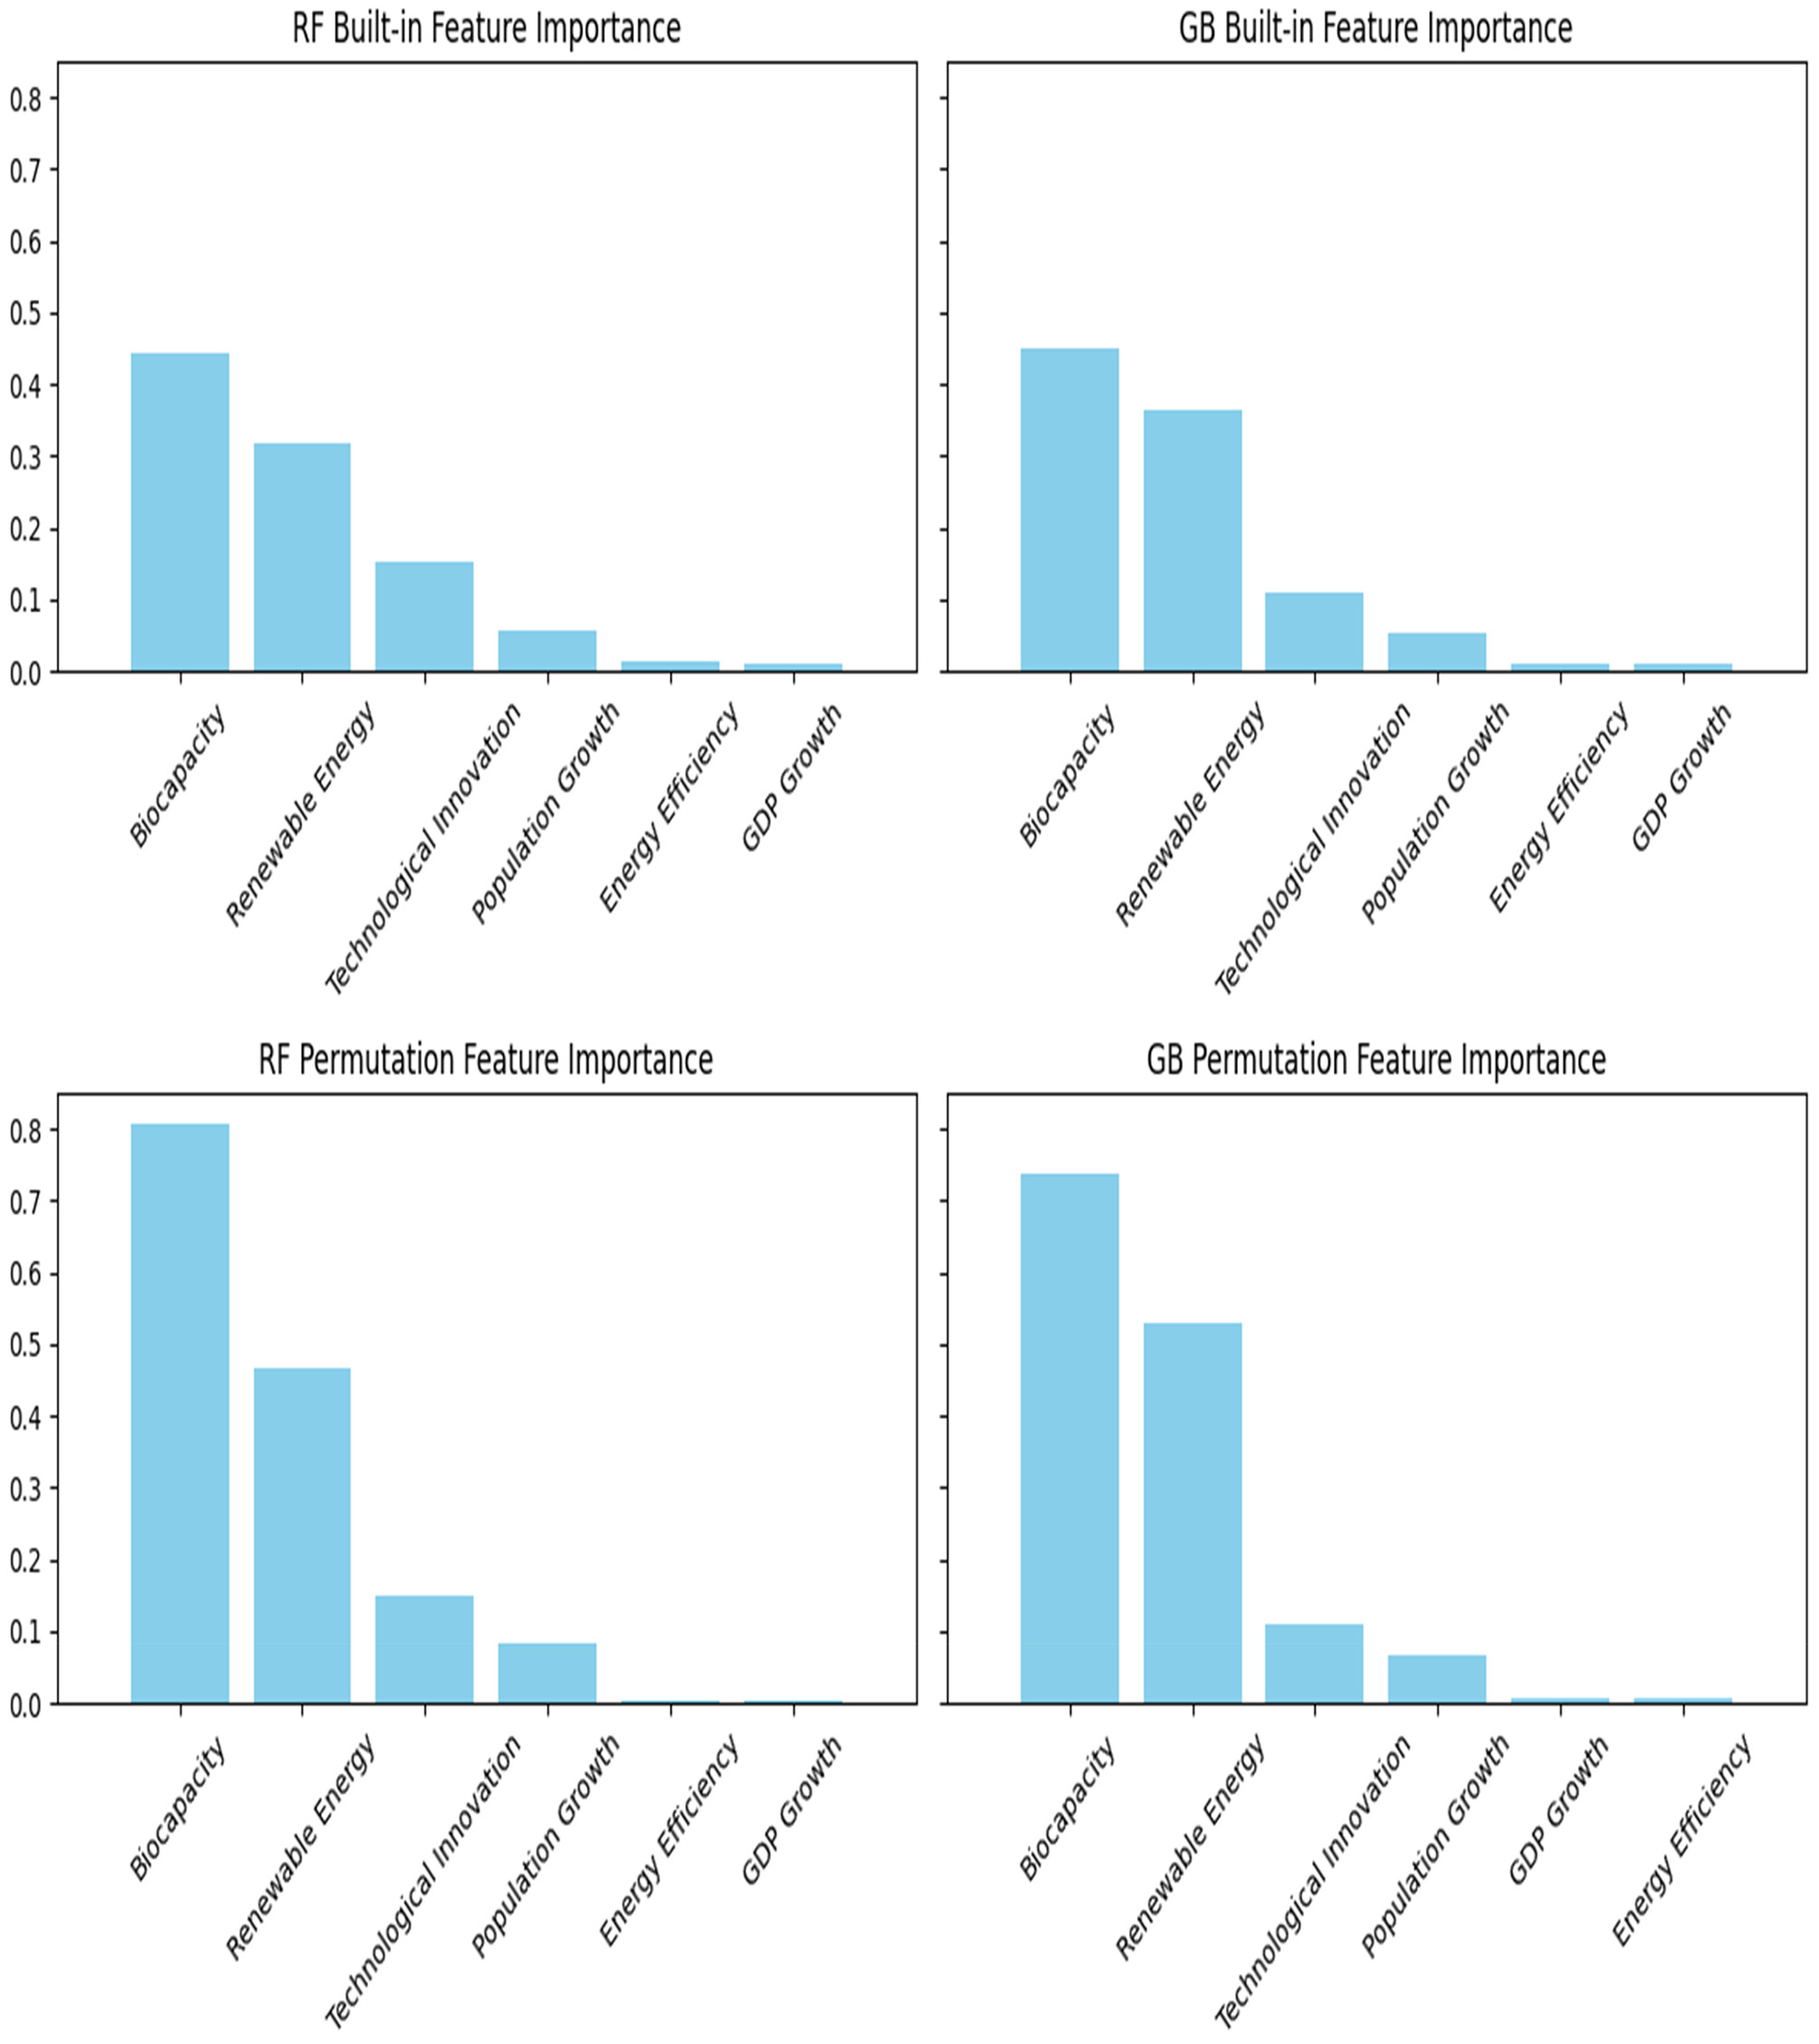
Analysis of feature importance across models.
The lower panels illustrate the permutation feature importance, which assesses feature importance by observing the effect on model accuracy when the feature's values are randomly shuffled. This method provides a model-agnostic metric that helps validate the built-in importance measures. The permutation importance plots largely corroborate the built-in importance findings, with “Biocapacity” and “Renewable Energy” again showing substantial impact on model predictions. However, these plots also highlight that “GDP Growth,” while less dominant, still plays a critical role, especially evident in the GB model.
The finding showed that biocapacity is the most influential predictor and as such, the most profound ecological foundation that CCE can be built. This observation confirm the critical role of biocapacity, as emphasized by scholars.49,51 As widely established in the literature, high biocapacity signifies natural carbon sinks. For the BRI economies, the integrity of this ecological base is the primary determinant of their carbon metabolism. This implies that member countries can invest heavily in renewable energy and efficiency, but if their forests are being cleared and its soils degraded, the most potent, natural carbon sink will be equally be destroyed. As widely established, healthy forests and marine ecosystems that actively remove CO2 from the atmosphere, directly contributing to the “removal” pillar of the CCE. It also signals resource regeneration capacity of the countries. The high biocapacity, thus reflects the ability of a nation's ecosystem to sustainably provide renewable resources (e.g., biomass for bioenergy), reducing pressure on fossil resources. Therefore, biocapacity does not just correlate with lower emissions; it acts as the non-negotiable pre-condition for closing the carbon loop.
Similarly, the findings also implied that technological solutions operate within the economy, but biocapacity defines the ecological boundary condition within which the economy must function. The strong showing of renewable energy aligns with established literature, confirming its role as the primary structural substitute for fossil fuels. 1 However, its secondary position to biocapacity suggests that its deployment may yield greater long-term dividends when implemented within a stable or growing ecological foundation, rather than in an environment of concurrent ecological degradation. This observation challenge the primacy of energy efficiency found in studies focused on developed economies.74,75 This discrepancy highlights a fundamental difference in context: for many developing BRI economies, the foundational challenge is ecological sustainability, not just industrial optimization.
The strong biocapacity potential revealed by the results considered as a proxy for broader environmental health of the BRI region. Arguably, countries that protect their biocapacity are likely to present stronger environmental governance and cultural practices that favor sustainability, which indirectly supports all CCE efforts. In the BRI context, where infrastructure development can strain local ecosystems, protecting biocapacity may be a prerequisite for long-term de-carbonization, potentially explaining its paramount importance.
Essentially, the evidence presented is critical for understanding which factors are most crucial in predicting CO2 emissions within the context of the CCE. By comparing the importance rankings from both built-in and permutation perspectives, the analysis ensures a robust evaluation of features, mitigating any bias that might arise from a single method. The insights derived from this figure are essential for policymakers and industries within the BRI region, as they provide a clear indication of which variables should be targeted for effective CCE implementation strategies. Such information is instrumental for directing efforts towards areas with the greatest potential for impact in reducing CO2 emissions, ultimately contributing to more sustainable economic development across the region.
Robustness and sensitivity analysis: a step beyond cross-validation
The ML models, with their high predictive accuracy, offer more than a ranking of variables; they provide a systemic diagnosis of the carbon metabolism within BRI economies. The most striking finding (dominance of biocapacity over renewable energy and technological innovation) demands a conceptual shift in how policymakers approach carbon reduction in developing and rapidly industrializing contexts. This result suggests that for many BRI nations, the foundational constraint is not merely technological capability but the integrity of the underlying ecological system that supports the economy and absorbs its waste.
The results in Figure 7 illustrate a comprehensive sensitivity analysis for six key predictors, showing how changes in each predictor affect predicted CO2 emissions. The sensitivity curve for GDP Growth demonstrates a steep decline in predicted CO2 emissions as GDP growth increases, leveling off as the growth continues. This pattern suggests that initial increases in GDP may lead to higher emissions, which stabilize with ongoing economic expansion. For instance, the GB model exhibits a more acute response to changes in GDP growth than the RF model, indicating different sensitivities in how each model processes this predictor.
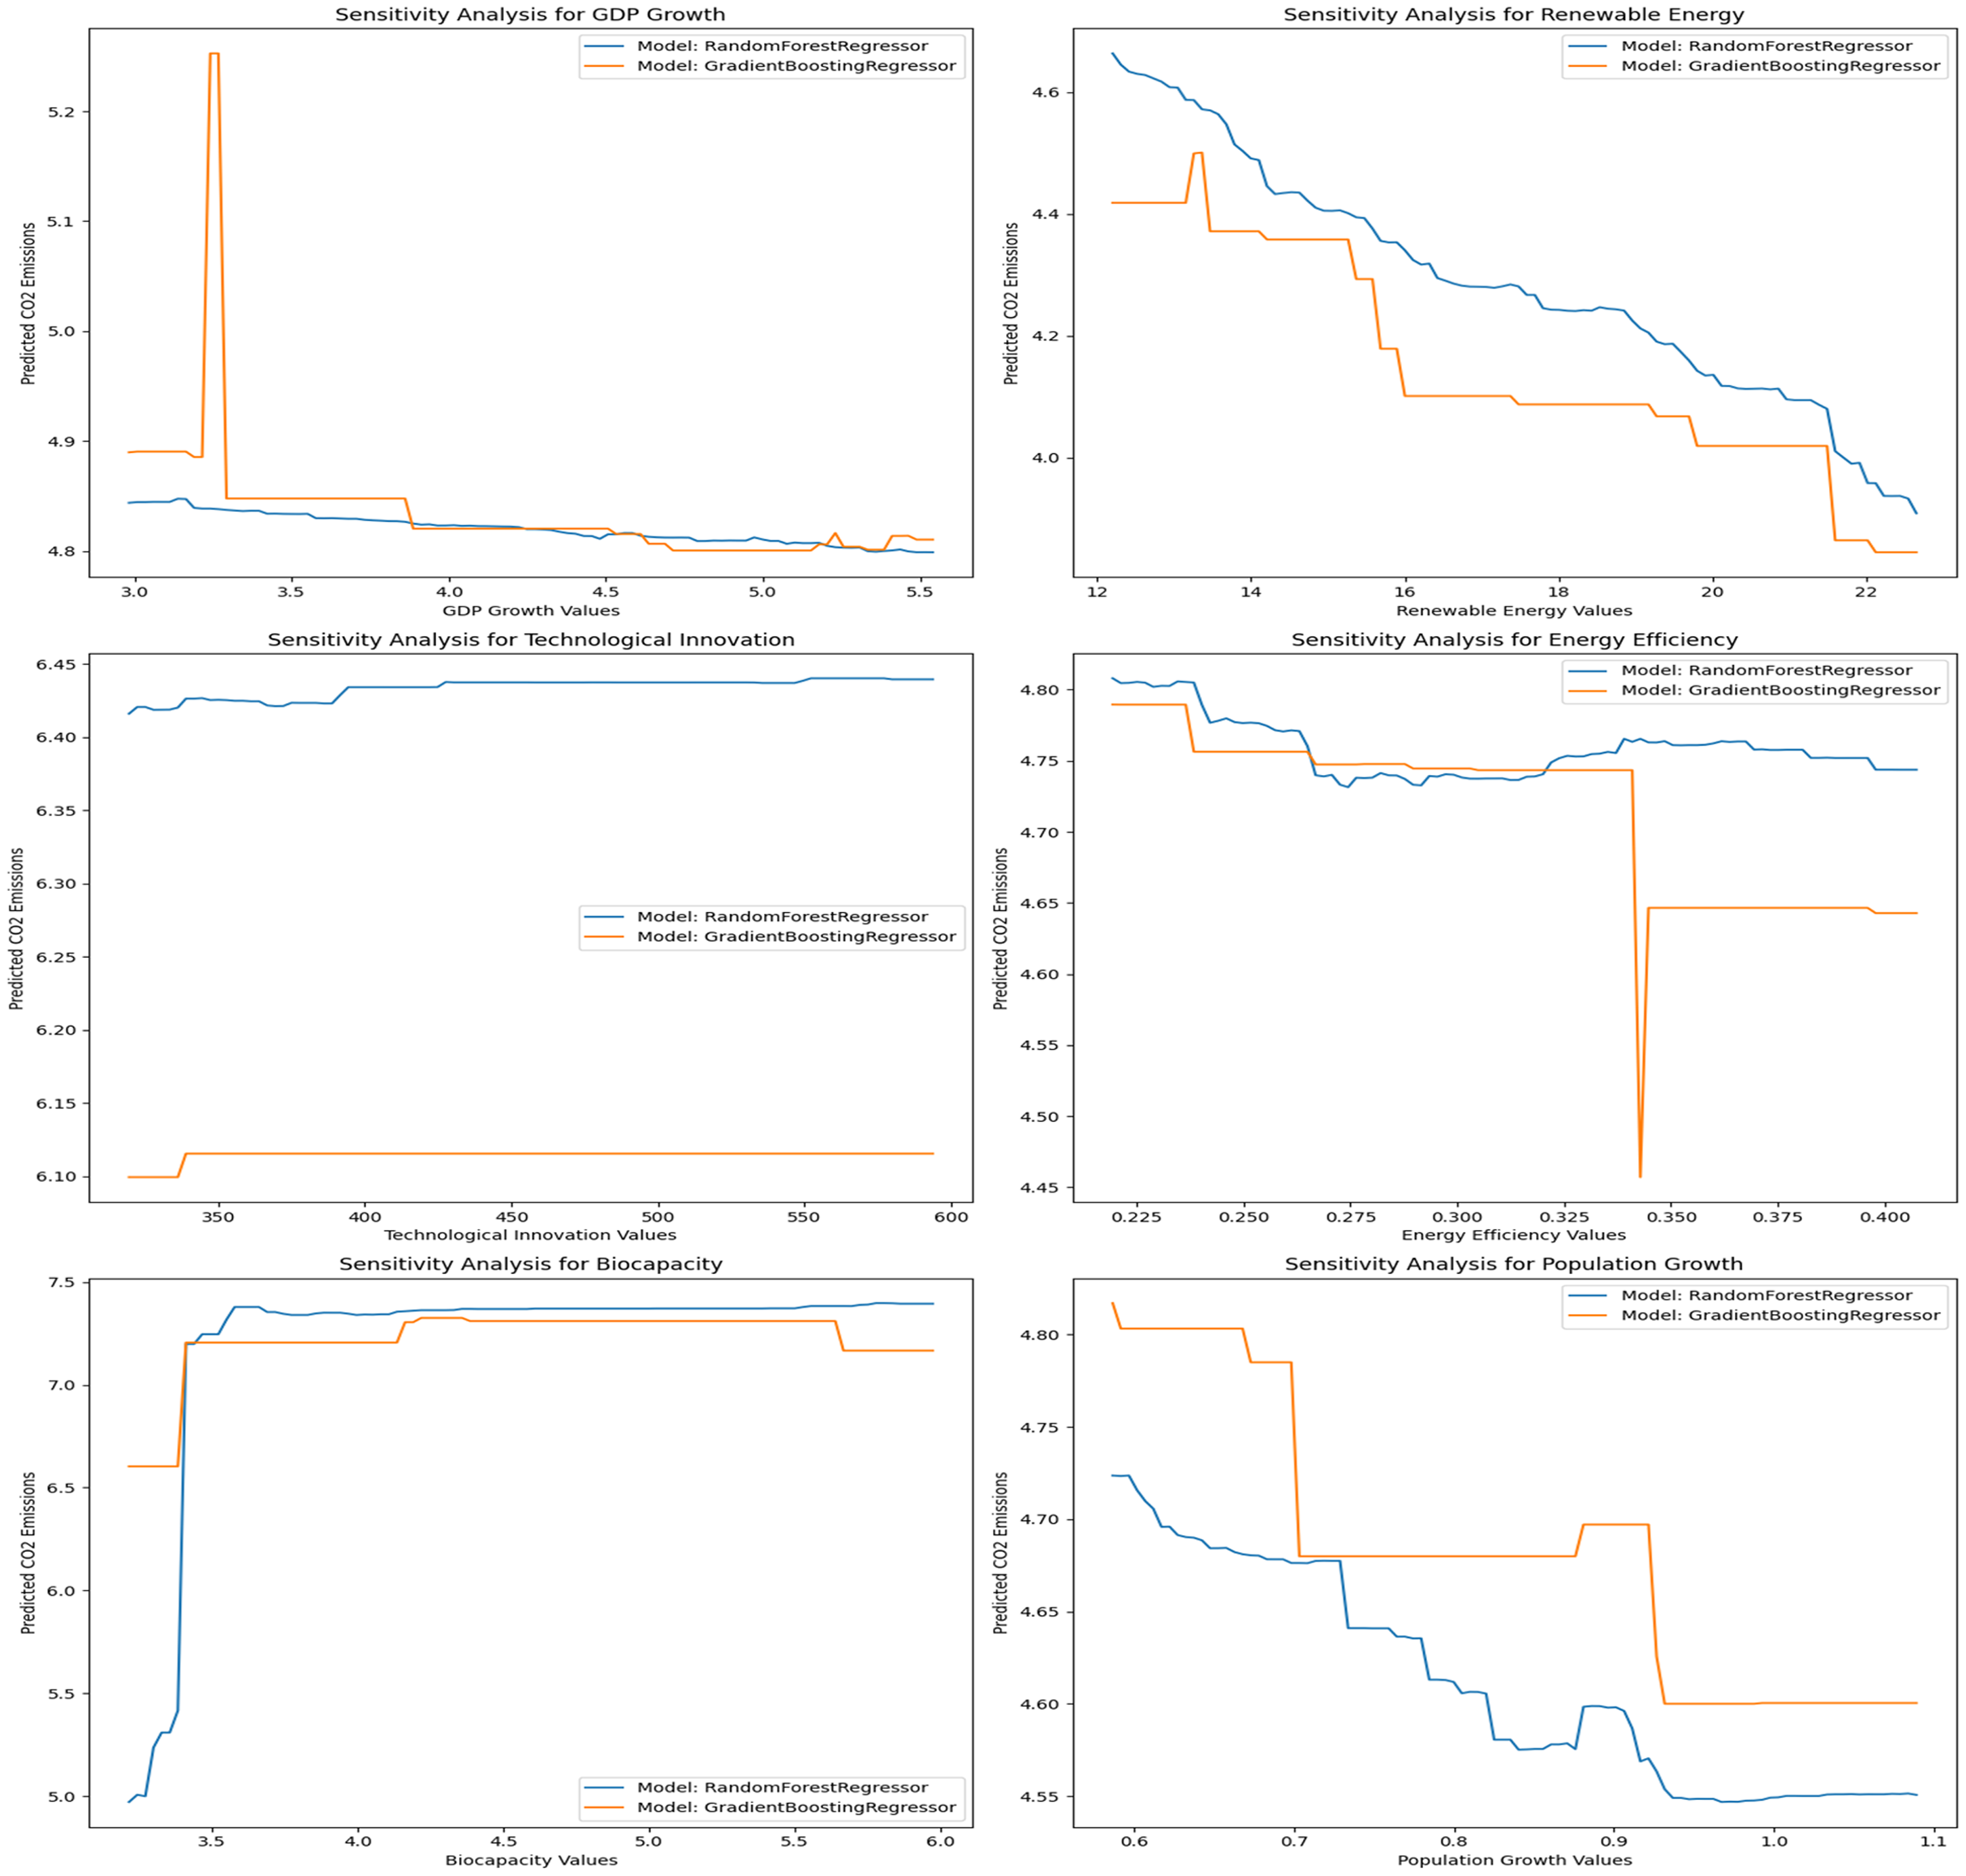
Sensitivity analysis for key predictors in CO2 emissions modeling.
In the renewable energy plots, there is a consistent decrease in CO2 emissions as the proportion of renewable energy use increases. This decline is smoother in the GB model, suggesting a linear relationship between renewable energy use and emissions reductions compared to the more variable response from the RF model.
Technological innovation shows a relatively flat response curve in both models, suggesting that while technological advances are crucial, their direct impact on CO2 emissions might be less immediate or potent compared to other factors like GDP growth or renewable energy utilization. However, Energy Efficiency's analysis indicates a marked decrease in emissions as efficiency improves, especially at certain efficiency thresholds where emissions drop significantly. This highlights the potential for energy efficiency improvements to dramatically reduce emissions, with critical levels where small increases in efficiency could result in substantial emissions reductions.
The impact of biocapacity on CO2 emissions is also significant, with higher biocapacity generally associated with lower emissions. This underscores the environmental capacity's role in buffering against carbon outputs. Finally, the analysis of population growth reveals a complex relationship, where CO2 emissions decrease initially with population increases but then begin to rise after reaching certain levels. This suggests that while initial population growth can lead to more efficient resource use and lower per capita emissions, further increases might drive overall emissions upward, reflecting the nuanced balance between population dynamics and environmental impact.
The predictive accuracy and robustness demonstrated by the RF and GB models align with previous studies emphasizing the potential of advanced machine learning techniques in environmental research. These models have successfully quantified the impact of the independent variables on CO2 emissions as the dependent variable, revealing the profound influence on CCE principles. The correlation results supports the narrative in the existing literature that economic variables such as energy consumption, renewable energy, technological innovation, GDP, population growth and CO2 emissions are critical levers in mitigating climate change impacts. 76
The built-in feature importance for both models revealed biocapacity, renewable energy and technological innovations as the most significant predictors, reflecting their strong roles in influencing CO2 emissions outcomes and for that matter most important CCE proxy measure for the BRI region.
Interestingly, biocapacity’ appears to be the most influential proxy measure than renewable energy, technological and energy efficiency in both the RF and GB models. The primacy of biocapacity can be interpreted through the lens of strong sustainability, which posits that natural capital is not freely substitutable by manufactured or technological capital. While innovation and efficiency are crucial, they are often incremental and operate within the economic system. Biocapacity, representing the regenerative and absorptive capacity of ecosystems, constitutes the external boundary condition for that system. The permutation importance results strongly corroborate the built-in importance findings, with “biocapacity,” “renewable energy” and technological innovations again showing substantial impact on model predictions.
Though with varied effect, the built-in feature importance and permutation importance results showed that population growth is more influential than energy efficiency and GDP growth. This revelation contradict the findings of many past studies which revealed renewable energy and energy efficiency as the most critical factor in building CE. For instance, Gan et al. 74 argued that improve energy efficiency in industrial processes, buildings, and transportation systems causes significant decrease in energy consumption and its associated emissions, making it a reliable element in CE efforts. Similarly, Belaïd et al. 75 argued that the significance of energy efficiency in carbonizing an economy is strengthened by its cost-effectiveness whereas the study by Gawusu and Ahmed 1 noted that the integration of RE sources into the energy mixed reduced reliance on fossil fuels and enhances the transition of the economies to lower CO2 emissions.
Even though biocapacity protection is given less attention in CCE literature, its relative importance in environment and sustainability discourse is highly acknowledged. In the BRI context, many member states are undergoing intense industrialization, urbanization, and resource extraction, processes that directly degrade biocapacity through deforestation, land-use change, and soil erosion. Our models indicate that when this foundational capital is compromised, the efficacy of even the best technological and efficiency measures is diminished. A nation can have state-of-the-art renewable infrastructure, but if its forests are being cleared and its soils degraded, its net carbon sink is shrinking, counteracting technological gains. Therefore, biocapacity does not merely “correlate” with lower emissions; it acts as the essential sink and non-negotiable pre-condition without which a circular carbon loop cannot be closed. Technological innovation is the engine of transition, but biocapacity is the track on which it must run.
Benchmarking against a classical fixed effects panel model
To benchmark the ML models, the study estimated a linear fixed effects panel regression model. The results are presented in Table 4 for comparison. The linear FE model achieved an R2 (within) of .74, confirming the presence of significant unobserved country-level heterogeneity. While the ML models (RF and GB with dummies) achieved a higher predictive accuracy (R2 > .98 on the full dataset), this is partly due to their ability to model complex non-linearities and interactions. More importantly, the hierarchy of feature importance for the substantive variables remained largely consistent in the ML models after including fixed effects, with Biocapacity, Renewable Energy, and Technological Innovation retaining their positions as the top three drivers. This consistency strengthens our confidence in the robustness of these core findings.
Comparison with linear fixed effects model.
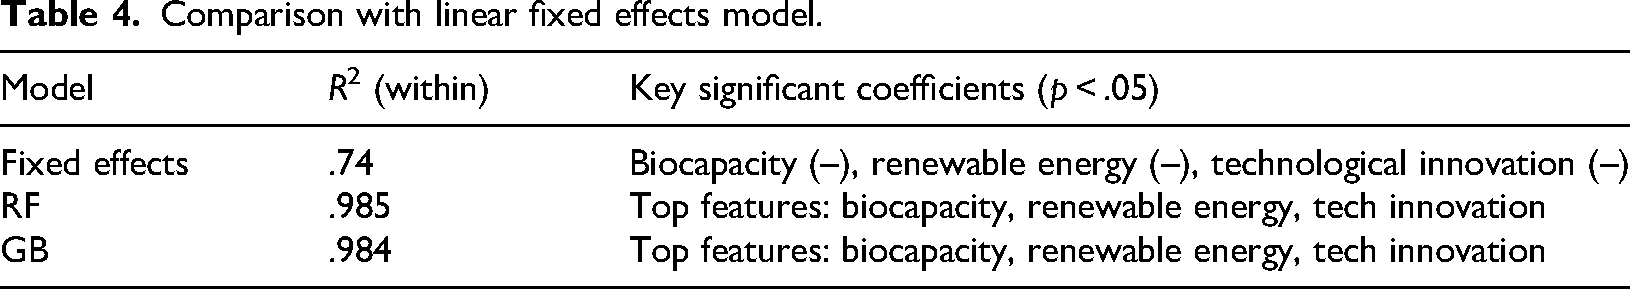
The persistent importance of biocapacity, even after controlling for all time-invariant country characteristics, suggests that changes in a country's biocapacity over time are a powerful predictor of changes in its CO2 emissions. This is a more robust finding than a simple cross-sectional correlation, as it isolates the internal dynamic within BRI countries. It implies that policies aimed at enhancing and protecting ecological resources can yield significant carbon mitigation benefits over time, even after accounting for a country's fixed starting point.
Conclusion and policy implications
Main conclusions
The findings of this study delivered an in-depth analysis into the actual deterministic factors that influence or could influence the circular carbonization of economies within the BRI region. This was achieved through the utilization of advanced machine learning techniques such as RF and GB models. The predictive models showed high levels of accuracy and robustness, with the RF model slightly surpassing the GB model in terms of generalizability and predictive accuracy across various datasets. The built-in feature importance results for both the RF and GB models showed that biocapacity, renewable energy and technology innovation are most significant predictors of CO2 emissions in the BRI. As revealed, biocapacity appears more influential than energy efficiency, population growth and GDP growth. The permutation importance results largely corroborate the built-in importance findings, with biocapacity, still showing substantial impact on model predictions. The results also highlight that “GDP growth,” though less dominant, still plays a critical role, especially evident in the GB model, exhibiting a more acute response to changes in GDP growth.
The sensitivity curve for GDP growth demonstrates a steep decline in predicted CO2 emissions as GDP growth increases, suggesting that an initial increase in GDP may lead to higher emissions, which will stabilize with ongoing economic expansion. The sensitivity analyses also provided deeper insights into how economic growth, technological innovation, and biocapacity contribute to CO2 emissions, offering detailed views of the complex interplay among various economic and environmental factors. Based on the comprehensive analysis, these results clearly predicted biocapacity, renewable energy and technological as significant proxy of measures for CCE. Though biocapacity protection is given less attention in the current literature on CE, its significance in environmental sustainability is highly recognized.
This study therefore adds a voice to the relative importance of biocapacity in circular carbonization efforts going into the future. The insights showed that biocapacity, which representing the carrying capacity of the environment is critical in CO2 reduction effort in the region. Additionally, the findings presented technological innovations as an important element in CO2 emission reduction efforts. Accordingly, enhancing technological innovation through supportive policies, such as subsidies for clean technology and research and development has the potential to improve environmental quality. The adoption of technological innovation should not be limited to production and consumption technological innovation. Technological innovation that can enhance monitoring and assessment of environmental impacts should be prioritized. The relevance of biocapacity and renewable energy in reducing CO2 emissions as established by the findings suggests that they should be central to future BRI activities and any CCE strategy of member states.
These findings fundamentally reshape the priority sequence for carbon reduction strategies in the BRI. The conventional policy pathway, often modeled on developed economies, prioritizes technological fixes and energy transition. The analysis suggests that for the BRI, a more effective and resilient strategy would be a two-pillar approach. The first is the foundation pillar that can provide a secure and enhance ecological capital. The first-order priority must be to halt and reverse the loss of biocapacity. This is not an ancillary “environmental” concern but a core economic and climate strategy. Policies must aggressively protect forests, wetlands, and other carbon-rich ecosystems. This pillar ensures the integrity of the planet's natural carbon sequestration system.
The second is the acceleration Pillar intended to drive technological transition across the BRI region. This pillar involves the accelerated deployment of renewable energy and energy-efficient technologies, precisely as commonly advocated by development practitioners. However, this findings of this study shows that these interventions will yield greater and more sustainable returns when implemented atop a stable or growing biocapacity base. This re-prioritization is critical because the BRI's current trajectory, heavily focused on infrastructure and mineral extraction (e.g., lithium for green tech), risks creating a “green paradox” where the pursuit of decarbonization technologies inadvertently destroys the very ecological capacity needed to achieve net-zero goals.
Policy implications and recommendations for the heterogeneous BRI
The policy implications of this study are profound and demand a reorientation of both national and BRI-level governance. From Carbon-Centric to Ecosystem-Based Policy: Environmental policy must move beyond a narrow focus on CO2 metrics to embrace integrated ecosystem accounting. The value of a standing forest as a carbon sink and a bastion of biocapacity must be explicitly factored into development decisions, potentially through robust payments for ecosystem services (PES) schemes. The government needs to condition the BRI investments. The BRI, as a major funder of infrastructure, should formally integrate biocapacity impact assessments as a mandatory component of project appraisal. Loans and investments could be tiered, with preferential terms for projects that demonstrate a net-positive impact on local and national biocapacity.
Further, the innovation policy of the BRI needs to be reframed. For instance, innovation subsidies and R&D funding should be expanded to include “bio-innovation,” covering technologies and practices for ecological restoration, sustainable agriculture, and circular bio-economies that enhance, rather than merely protect, biocapacity.
The findings of this study necessitate a move beyond one-size-fits-all sustainability policies. The BRI is not a monolith, as it is a collection of economies at different stages of development, with varying resource endowments and environmental pressures. Therefore, it is important that a differentiated policy framework that categorizes countries into strategic archetypes for targeted intervention is adopted.
For high-growth and high-emitting countries such as China, Russia, Kazakhstan and South Africa, decoupling rapid economic growth from ecological degradation is a major challenge. China has to leverage its leadership in renewable tech manufacturing to implement “Green BRI Conditional Financing.” It has also tie infrastructure loans to recipient countries’ commitment to biocapacity protection plans, creating a market for Chinese green tech while exporting sustainability standards. Likewise, Russia and Kazakhstan should focus on “Carbon Sink” policy initiatives. Given their vast forest and grassland areas, national accounts should formally value biocapacity. They should pioneer BRI-wide carbon offset markets, where their protected ecosystems generate revenue, providing a fiscal incentive to move beyond oil and gas dependence.
For South Africa, the attention should be on how to address the tension between coal, biodiversity, and development. Policy should focus on “Just Transition Corridors,” where renewable energy projects (solar, wind) are strategically sited to minimize impact on critical biodiversity zones (like the Cape Floristic Region) and include direct investment in ecological restoration as a core component of the energy transition.
Countries such as Malaysia, Ecuador, Costa Rica, and Bulgaria “biocapacity reservoirs” with rich biodiversity (tropical rainforests, unique ecosystems). However, they are unable monetize the protection of their ecological assets without sacrificing economic development. These countries should advocate for the adoption of a “Debt-for-Nature Swaps” policy. The BRI, led by China as a major creditor, is uniquely positioned to pioneer large-scale “BRI Debt-for-Biocapacity Swaps.” For instance, debt relief for Ecuador could be directly linked to verifiable protection of the Yasuní rainforest, with funding directed towards sustainable community-based enterprises. Also, Malaysia and Costa Rica should use policy to create “Circular Bio-Economy Zones,” offering tax incentives for industries that create high-value products from sustainable forest and agricultural resources (e.g., bioplastics, pharmaceuticals), ensuring that the economic value of a standing tree exceeds that of a logged one.
Most of the vulnerable and developing member countries in the BRI region are facing challenges when it comes to building climate resilience and this can be attributed to limited resources. For technology transfer and adaptation, it is recommended that the BRI policy prioritize “Sino-Desertification Innovation Partnerships.” The partnership should focus on transfer of various technologies and not just on solar panels. It should include technologies on water-saving agricultural tech, desert greening techniques, and low-cost environmental monitoring systems developed in China's own arid regions. They should also establish a dedicated fund, financed by the larger BRI economies, that provides grants (not loans) for specific, high-impact restoration projects in the most vulnerable member countries.
Limitations and direction of future research
This study was not conducted without some limitations. Firstly, the heterogeneity of the BRI region presented difficulties in standardizing data across diverse economic contexts. Also, variability in data quality, especially with some of countries lacking robust data collection infrastructures, posed significant hurdles in achieving a uniformly high level of data accuracy. Furthermore, modeling the non-linear interactions between various predictors required careful tuning of ML models to avoid overfitting while maintaining generalizability across the dataset. Another limitation was the interpretation of ML outputs, particularly understanding the complex relationships and the relative importance of different features in the models. This required a delicate balance between leveraging machine learning for its predictive power and ensuring that the models remained interpretable for policymakers and industry stakeholders.
Going into the future, potential researchers use more recent data points to improve the precision of the predictive models and broaden their applicability to localized economies. Including diverse variables such as policy indices, public awareness levels, and international trade dynamics could also offer deeper insights into other influential factors that could enhance the CCE efforts. Employing advanced statistical and machine learning techniques, such as deep learning or ensemble methods, could uncover further complexities within the data. Additionally, conducting longitudinal studies would provide valuable perspectives on how the impacts of sustainable practices evolve, offering a dynamic view of long-term environmental and economic outcomes. Comparative studies between the BRI region and other economic corridors or global regions could also help to contextualize the BRI-specific findings and distinguish between universal and localized strategies for implementing CCE.
Nomenclature
Carbon Capture and Storage
circular carbon economy
random forest
gradient boosting
International Energy Agency
mean absolute error
machine learning
mean squared error
root mean squared error
Footnotes
Authors contributions
Seidu Abdulai Jamatutu contributed to conceptualization, data curation, methodology and investigation writing–original draft. Huaming Song contributed to conceptualization, supervision and funding acquisition and validation. Sidique Gawusu contributed to methodology, software and data curation and investigation. Kyei Emmanuel Yeboah contributed to software, visualization and writing–reviewing and editing. Abdul Haseeb Tahir contributed to validation and writing–review and editing. Nabila Amin contributed to validation and writing–review and editing. Chen Kan contributed to software, visualization, and writing–data curation review and editing. Victor Appiah-Kubi contributed to writing–review and editing.
Funding
The authors disclosed receipt of the following financial support for the research, authorship, and/or publication of this article: This work was supported by the Belt and Road Innovative Talents Exchange with Foreign Experts Project (grant number: DL2023182002L).
Declaration of conflicting interests
The authors declared no potential conflicts of interest with respect to the research, authorship, and/or publication of this article.
Data availability statement
Data is available on request from authors.