
Abstract
The 2008 financial crisis triggered the first contraction of the world economy in the post-war era. This article investigates the effect of the Great Recession on child poverty across the EU-27 plus Iceland, Norway and Switzerland and studies the extent to which social protection spending may have softened the negative impact of the economic crisis on children. While the risks of child poverty are substantially higher in countries with higher rates of working-age unemployment, suggesting a significant impact of the Great Recession on household incomes via the labour market, the study finds evidence for social protection spending cushioning the blow of the crisis at least to some extent. Children were significantly less likely to be poor in countries with higher levels of social protection spending in 2008–2013, even after controlling for the socio-demographic structure of the population, per capita gross domestic product (GDP) and the working-age unemployment rate. The poverty-dampening contextual effect of social spending was greater for the poverty risks of children in very low work intensity families and large families. The study uses two complementary thresholds of income poverty, both based on 60 percent of the national median: a relative poverty line and a threshold anchored in 2008. Although the choice of a poverty line makes a difference to aggregate child poverty rates, individual-level risks of a child being poor associated with a range of household-level characteristics are similar for the two poverty lines.
Introduction
Following the global financial crisis, the world plunged into recession in 2009 for the first time in the post-war period (Keeley and Love, 2010). The economy contracted by 3.6 percent in the 27 member states of the European Union (EU) (Organisation for Economic Cooperation and Development (OECD) statistics). This major economic downturn became known as the ‘Great Recession’ (Jenkins et al., 2013). Although most of the EU countries returned to modest growth by 2011, several economies have slipped into a second contraction since then. Thus, this article uses Great Recession as a catch-all term to refer to the period between 2008 and 2013, the last year for which internationally comparable micro-data on household income are available for the EU at the time of writing.
It is notable that in most industrialised countries, at least a decade before the start of the Great Recession, time and again children were found to be at a greater risk of poverty than the population as a whole. In an influential study of income distributions across the OECD in the 1990s, Forster and Mira D’Ercole (2005) documented higher rates of relative income poverty among children in most countries. The first detailed analysis of child poverty across the EU, based on cross-country comparative data from the EU Statistics on Income and Living Conditions (EU-SILC) 2005, also highlighted that in most member states poverty rates were higher among children (Social Protection Committee, 2008). This finding has been a consistent feature of every new wave of the EU-SILC to date. In the majority of EU countries, children were found to be at a higher risk of relative income poverty (Atkinson and Marlier, 2010; Bradshaw et al., 2012) and material deprivation (Tarki, 2011) than the overall population.
It is widely acknowledged that poverty harms children not only at the time it is experienced (Brooks-Gunn and Duncan, 1997), but it also often has long-term consequences (Corak, 2006; Esping-Andersen and Myles, 2009; Gregg and Machin, 2001). Therefore, investment in children is seen as an effective way of achieving equality of opportunities for all (Esping-Andersen, 2008). The necessity of addressing disadvantage early is one of the reasons why child poverty has been on the political agenda of the EU, leading to the adoption of the European Commission (2013) Recommendation ‘Investing in Children: Breaking the Cycle of Disadvantage’. The Recommendation is part of the broader EU Social Investment Strategy, which emphasises investment in human capital from a very early age. Reducing child poverty everywhere, including developed countries, is one of the Sustainable Development Goals of the post-2015 development agenda. 1
This article examines changes in the material living conditions of children between 2008 and 2013 across the EU-27 plus Iceland, Norway and Switzerland. Using six waves of micro-data from the EU-SILC and macro-data for the corresponding income reference years, the analysis investigates the effects of both household- and country-level predictors on risks of monetary child poverty in a multilevel logistic regression framework. It focuses on the effect of the economic crisis on child poverty, the extent to which spending on social protection benefits may have softened its impact and whether this differed by household type. While doing so, this article also illustrates the implications of using a relative poverty line derived from contemporary median incomes and a poverty line anchored in a base year (2008).
Literature review and hypotheses
Research on previous downturns in industrialised countries suggests that economic crises tend to affect children excessively. For instance, child poverty measured in relative terms but anchored in the first year of each downturn increased during each of the previous three recessions in the United Kingdom (the 1970s, the early 1980s and the early 1990s), even as pensioner poverty was falling (Muriel and Sibieta, 2009). In Sweden, economic hardship rose significantly among households with children during the 1990s recession, with the greatest increases in absolute poverty of all age groups recorded for those under 20 years (Mood and Jonsson, 2014).
Emerging cross-country comparative evidence on the impact of the Great Recession indicates that children have indeed been adversely affected. Across the OECD area, recent statistics highlight that children and young people were the groups hit hardest by the crisis (OECD, 2014; UNICEF Office of Research – Innocenti, 2014). As of 2012, children were at a higher risk of poverty or social exclusion than the overall population in all but five countries of the EU-28 (Social Protection Committee, 2014). Between 2008 and 2013, child poverty increased faster (or fell more slowly) than pensioner poverty in nearly all EU countries (Bradshaw and Chzhen, 2015). Based on evidence for 17 European countries from the 2010 Life in Transition survey, subjective perceptions that the crisis had affected their households a fair amount or a great deal were more widespread among adults with children, especially in countries with higher poverty rates (Chzhen, 2016).
In the United States, where the global financial crisis began, the national child poverty rate rose from 18 percent in 2007 to 22.5 percent in 2011, with the number of high poverty states (with child poverty of 20 percent or higher) reaching 27: the original 14 plus additional 13 states tipping over the benchmark by 2011 (Isaacs and Healy, 2012). Using a different poverty measurement method, Bitler et al. (2014) show that between 2005–2007 and 2010–2012, child poverty increased in 34 US states. 2 In a study of the social impact of the crisis in Greece, Matsaganis (2013) documented a twofold increase (from 21.8% to 42.6%) in the child poverty rate between 2009 and 2012, using the poverty line anchored in 2009. 3 In Spain, poverty increased faster among children than the overall population between 2008 and 2012, although the poverty line itself shrank in real terms since 2009 (Ayllon Gatnau, 2015). Adults in households with children reported significantly higher levels of economic stress between 2004 and 2011 in Ireland (Whelan et al., 2016).
Although EU countries that suffered worse economic downturns saw greater increases in child poverty, on average (UNICEF Office of Research–Innocenti, 2014), social protection policies in place at the time of the crisis should, in theory, have cushioned the impact of the Great Recession on households. In a comparative study of the impact of the Great Recession on household incomes in six rich countries, Jenkins et al. (2013) showed that the effects of the economic crisis on net incomes varied with the ‘the buffering capacity of social safety nets’ (p. 246). However, their role could not be identified conclusively in a small sample of countries.
Nevertheless, there is ample cross-country comparative research evidence, spanning a period at least two decades before the start of the Great Recession, that greater levels of social spending are associated with lower poverty rates across industrialised countries. Using data for 15 affluent countries from the Luxembourg Income Study (LIS), Kenworthy (1999) reported a strong negative association between different measures of social policy extensiveness for the period 1960–1991 and poverty rates in 1991, controlling for gross domestic product (GDP) per capita in 1960. In a more recent and statistically sophisticated analysis of the LIS, Bäckman and Ferrarini (2010) found a significant association between family policy transfers and lower child poverty risks across 21 countries, controlling for country differences in the socio-demographic structure. Pooling data for 22 OECD countries for five equally spaced time points between 1985 and 2005, Caminada et al. (2012) found higher social expenditure as a share of GDP to be significantly associated with lower poverty rates, controlling for the share of the population over 65, unemployment rate and GDP per capita. According to Nolan and Marx (2009), ‘no advanced economy achieves a low (relative) poverty rate with a low level of social spending, regardless of how well it does at maximising employment – arguably one of the most robust findings of comparative poverty research’ (pp. 329–30). However, since most of this evidence excludes new accession states of the EU, it is of interest if this relationship holds in a more diverse sample of 30 European countries during the Great Recession.
It is worth noting that after an initial and short-lived phase of fiscal stimulus in response to the global financial and economic crisis, many governments implemented austerity reforms. Although child and family policies largely avoided direct cuts at the start of the crisis (Richardson, 2010), mounting pressure from the financial markets prompted most countries to engage in fiscal consolidation since 2010–2011, with working-age social transfers (e.g. child/family, unemployment and disability benefits) among the most popular targets of cuts (OECD, 2014). Thus, social protection systems were falling under threat when they were most needed (Immervoll and Llena-Nozal, 2011). Meanwhile, social safety nets of last resort, such as social assistance and minimum income protection schemes, have been eroding in European countries for around two decades, with ever greater emphasis on work-related requirements and less generous cash transfers (Marchal et al., 2014; Nelson, 2013; Van Mechelen and Marchal, 2012).
Thus, this article contributes to the literature on the impact of the Great Recession on children’s living conditions and the role of the welfare state in buffering this impact, by investigating whether the generosity of the social protection systems in place during the Great Recession is still associated with lower levels of child poverty across 30 European countries, once relevant household-level and macro-economic indicators are controlled for. Using the level of social spending as a share of GDP as a proxy for welfare state generosity, it is expected that it will be associated with lower risks of individual-level child poverty even after working-age unemployment rates and GDP per capita are accounted for, particularly in the initial period (2008–2009) when most countries engaged in fiscal stimulus (Hypothesis 1).
The analysis also investigates whether the effects of social spending during the period 2008–2013 differ by household type. It has been well established that children in workless households, lone-parent families, large families (those with three or more children) and households with lower educated adults were particularly vulnerable to poverty long before the start of the Great Recession (Atkinson and Marlier, 2010; De Neubourg et al., 2012; Fusco et al., 2010; Social Protection Committee, 2008; Tarki, 2011). Among children in lone-parent families, those in single-unit households, female-headed households, large families and those where the parent did not work full-time were more likely to be poor or deprived (Chzhen and Bradshaw, 2012). In countries with sufficiently large migrant populations to obtain reliable estimates from household surveys, children in households headed by foreign-born adults were also consistently more likely to be poor (Tarki, 2011). Thus, it is expected that although children in traditionally vulnerable types of households would be more likely to be poor during the crisis, differences by household type would be smaller in countries with more generous social spending. Equivalently, the poverty-dampening effect of social spending will be greater for children in low work intensity households, large families and lone-parent families (Hypothesis 2).
Data, variables and methods
This article uses micro-data from the EU-SILC 2008–2013 for 30 European countries (EU-27 plus Norway, Iceland and Switzerland). The EU-SILC is the main source of information on living standards in the EU, collecting nationally representative and cross-country comparable statistics on income and social inclusion. 4 Since income poverty estimates produced by Eurostat are derived from the EU-SILC, this article uses published indicators for descriptive statistics wherever possible, while all multivariate analyses rely on the micro-data from the user database. 5 The 2008 wave is used as the pre-crisis baseline in this study because the EU economy only slipped into recession in 2009. However, the income reference year in the EU-SILC is the calendar year before the interview (for all EU-SILC countries except the United Kingdom, for which it is the current year, and Ireland, for which it is the last 12 months). Thus, child poverty rates estimated using the 2008 wave of the survey refer to 2007 incomes (except in the United Kingdom). Nevertheless, annual incomes in the reference period are thought to be good proxies for current income.
Using the conventional EU measure of child poverty, children are counted as income poor (‘at risk of poverty’) if they live in households with equivalent disposable income (after taxes and transfers but before housing costs) below 60 percent of the national median. Low income, adjusted for household size and composition, is thus measured with reference to the ‘average’ person in the society. However, the relative poverty indicator is less useful during the crisis, when the living standards of the whole population may be changing. For example, if everyone’s income falls by the same amount, no one will appear to have become any poorer in relative terms. Thus, in order to measure the change in living standards since the crisis, the baseline (2008) poverty line is held constant. It is adjusted for price inflation but not for changes in median incomes so that ‘individuals may compare their material circumstances not only with those of the average person in the society in which they live, but also with their own in a previous period’ (Matsaganis, 2013: 10). Moreover, during economic crises, the anchored poverty rate is more sensitive to the deteriorating living conditions of the poor (OECD, 2014; Social Protection Committee, 2013). To paint a fuller picture and to clarify the implications of using either of these approaches, both the ‘floating’ relative poverty line and the one anchored in 2008 are used here. This study uses spending on social protection benefits 6 as a share of GDP as a proxy for welfare state generosity. While a useful indicator of the overall size of the welfare state, social protection has limitations as an indicator of benefit generosity because it can be influenced by the business cycle and demographic shifts (Nelson, 2012). Indeed, social spending tended to increase at the start of the economic crisis, mostly due to unemployment benefits fulfilling their function as automatic stabilisers. However, in the countries where GDP shrank during the crisis, spending as a share of GDP may have gone up even as it was decreasing in absolute terms. To net out the effect of the business cycle on household incomes via the labour market, the working-age (25–59 years) unemployment rate is used a control in the analysis. All models are estimated separately by year in order to capture differences in the levels of social spending across countries irrespective of changes in spending over time. The socio-demographic structure of the population is captured by including a range of household-level covariates. To account for the fact that child poverty rates tend to be lower in richer countries, per capita GDP in purchasing power standards is also controlled for. Alternative indicators of social spending, for example, spending on child/family benefits and unemployment benefits separately, in purchasing power standards or as a percentage of total social protection spending, are used in robustness checks.
There are other aggregate measures that could be used in this analysis, but they are less suitable given the research questions posed here. One such measure is the change in the national child poverty rate before and after social transfers. It is widely used as an indicator of social transfers’ effectiveness in poverty reduction (e.g., Martorano, 2014; Social Protection Committee, 2014), but it is based on the unrealistic assumption that the counterfactual pre-transfer income distribution is independent of the welfare state (see Bergh, 2005). For instance, the indicator assumes that the labour supply and household formation of individuals would not have been different in the absence of social transfers.
One can also use type case (or ‘model family’) benefit level data to measure absolute levels of benefit generosity. The governing tax and benefit rules are used to simulate the net income available to stylised households (e.g. single adult; lone parent with two pre-school children), given their market income (or lack thereof). Although harmonised model family data are often used to study cross-country institutional variation and benefit adequacy (Marchal et al., 2014; Nelson, 2010, 2013), they are not necessarily well suited to the analysis of individual risks of relative poverty during an economic crisis. Model family calculations presume full take-up of benefits, in addition to other simplifying assumptions. Moreover, the model family data sets include most of the countries and years in this analysis (i.e. Social Assistance and Minimum Income Protection Interim Data Set (SaMip); 7 CSB Minimum Income Protection Indicators (CSB-MIPI) 8 ) focus on minimum income and social assistance provisions reaching only a subgroup of households with children potentially at risk of relative poverty at times of economic turbulence. 9
Country-level data and individual-level data from the EU-SILC are combined in one data set. The following household-level controls are used: very low work intensity household, 10 lone-parent status, 11 large family (with three or more children under 18 years), migrant status (one or more adults born outside the EU), owner-occupied household, at least one adult working in the public sector, 12 age of the youngest child in the household and highest level of education in the household. In order to correctly account for its hierarchical structure, that is, children nested within countries, and to be able to estimate the effects of country-level variables on the individual-level outcomes, this article uses the multilevel modelling approach (see Snijders and Bosker, 2012). Models are estimated separately by year rather than by pooling the six waves in order to allow the effects of all covariates to vary freely across time.
Results
Anchored and relative child poverty rates between 2008 and 2013
There was a lot of variation in child poverty levels before the start of the Great Recession. In 2008, the share of children living in households with equivalent income below 60 percent of the national median ranged from around 1 in 10 (9%–13%) in the Nordic countries, the Netherlands and Slovenia to between a quarter and a third (25%–33%) in Bulgaria, Italy, Romania and Spain (Figure 1). In 11 out of European 30 countries, at least one in five children were at risk of poverty in 2008.
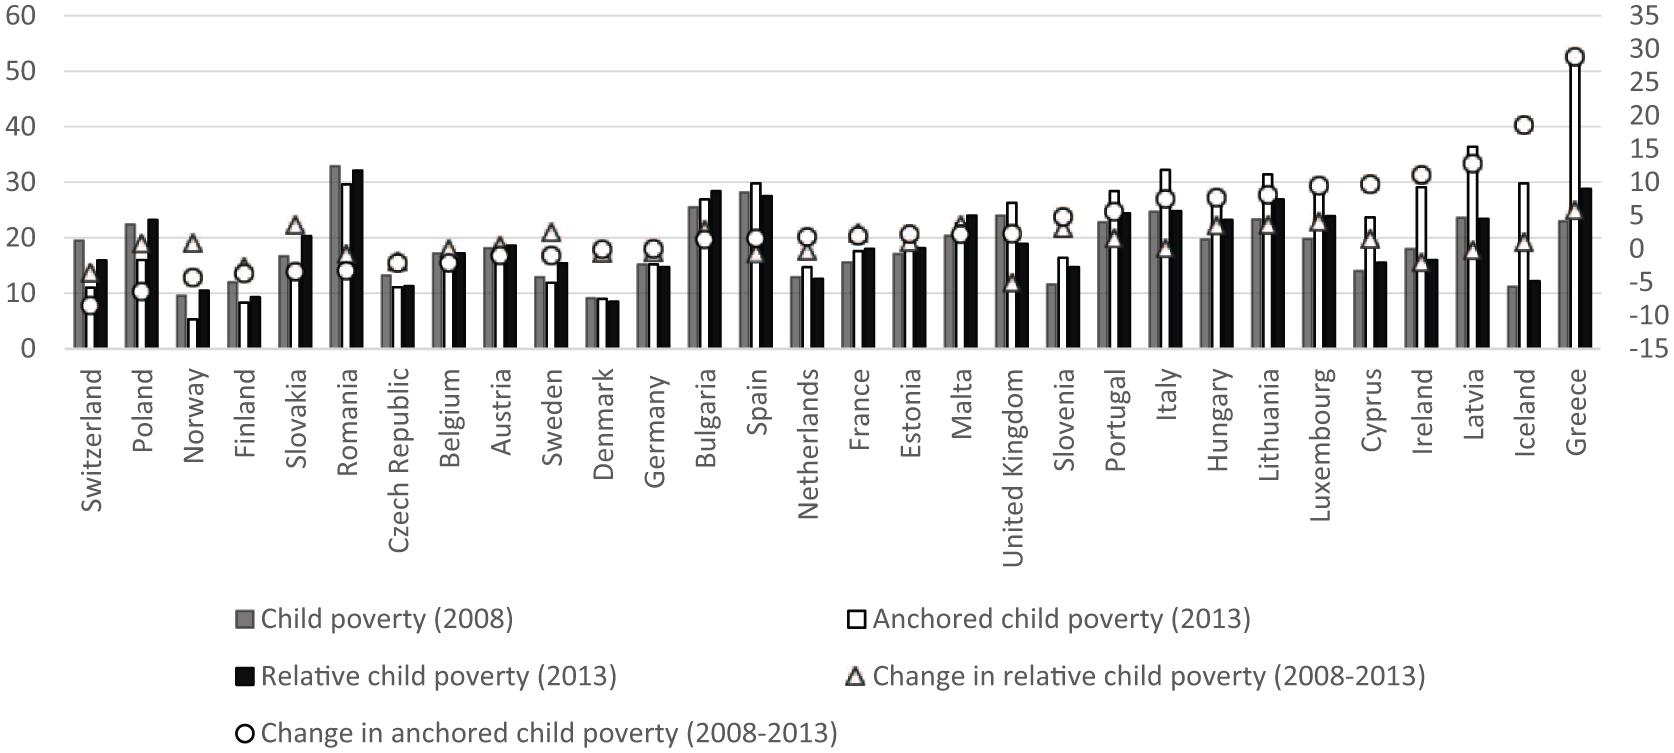
Child poverty rates in 2008 and 2013 (%).
In about a third of the countries studied here, child poverty rates have increased between 2008 and 2013, using the same poverty line (adjusted for inflation) in both years. Figure 1 illustrates that the biggest absolute increases in anchored child poverty were observed in Latvia (13 ppt), Iceland (19 ppt) and Greece (29 ppt). In 18 countries, child poverty has increased by at least 1 ppt, which can be interpreted as statistically significant. 13 However, while focusing on changes in child poverty since the start of the economic crisis, it is important not to lose sight of the absolute levels. After a substantial increase in poverty, Iceland had some of the highest anchored child poverty rates in 2013, but so did Romania after a 3 ppt decrease from the pre-crisis level. Meanwhile, in five countries, child poverty rates dropped by at least 3 ppt to reach the comparatively low levels of 5–15 percent: Poland, Slovakia, Switzerland, Norway and Finland. This suggests an improvement in children’s living standards in these countries from the pre-crisis levels. 14
Figure 1 also shows that changes in the anchored poverty rate between 2008 and 2013 tended to be greater in absolute terms than the respective changes in the relative poverty rate. Even in Greece, where child poverty increased fastest on both measures, relative poverty went up by 6 ppt while anchored poverty went up by 29 ppt. In three countries – Ireland, Spain and the United Kingdom – relative poverty decreased while anchored poverty increased. In these countries, a fall in median incomes produced a lower poverty threshold and a corresponding decrease in the relative poverty rate, although a greater share of children saw a fall in their household incomes in real terms since the start of the crisis.
Across the countries studied, the correlation between the anchored and relative child poverty rates became progressively smaller between 2009 and 2013 (Table 1). Moreover, the two poverty rates do not co-vary with other macro-level indicators in a similar fashion. Relative child poverty is more highly correlated with social spending during the entire period 2009–2013 (Figure 2), as well as with per capita GDP, while anchored poverty appears to be more sensitive to the working-age unemployment rate between 2010 and 2013.
Correlations between child poverty rates and social spending, unemployment rates and GDP per capita.
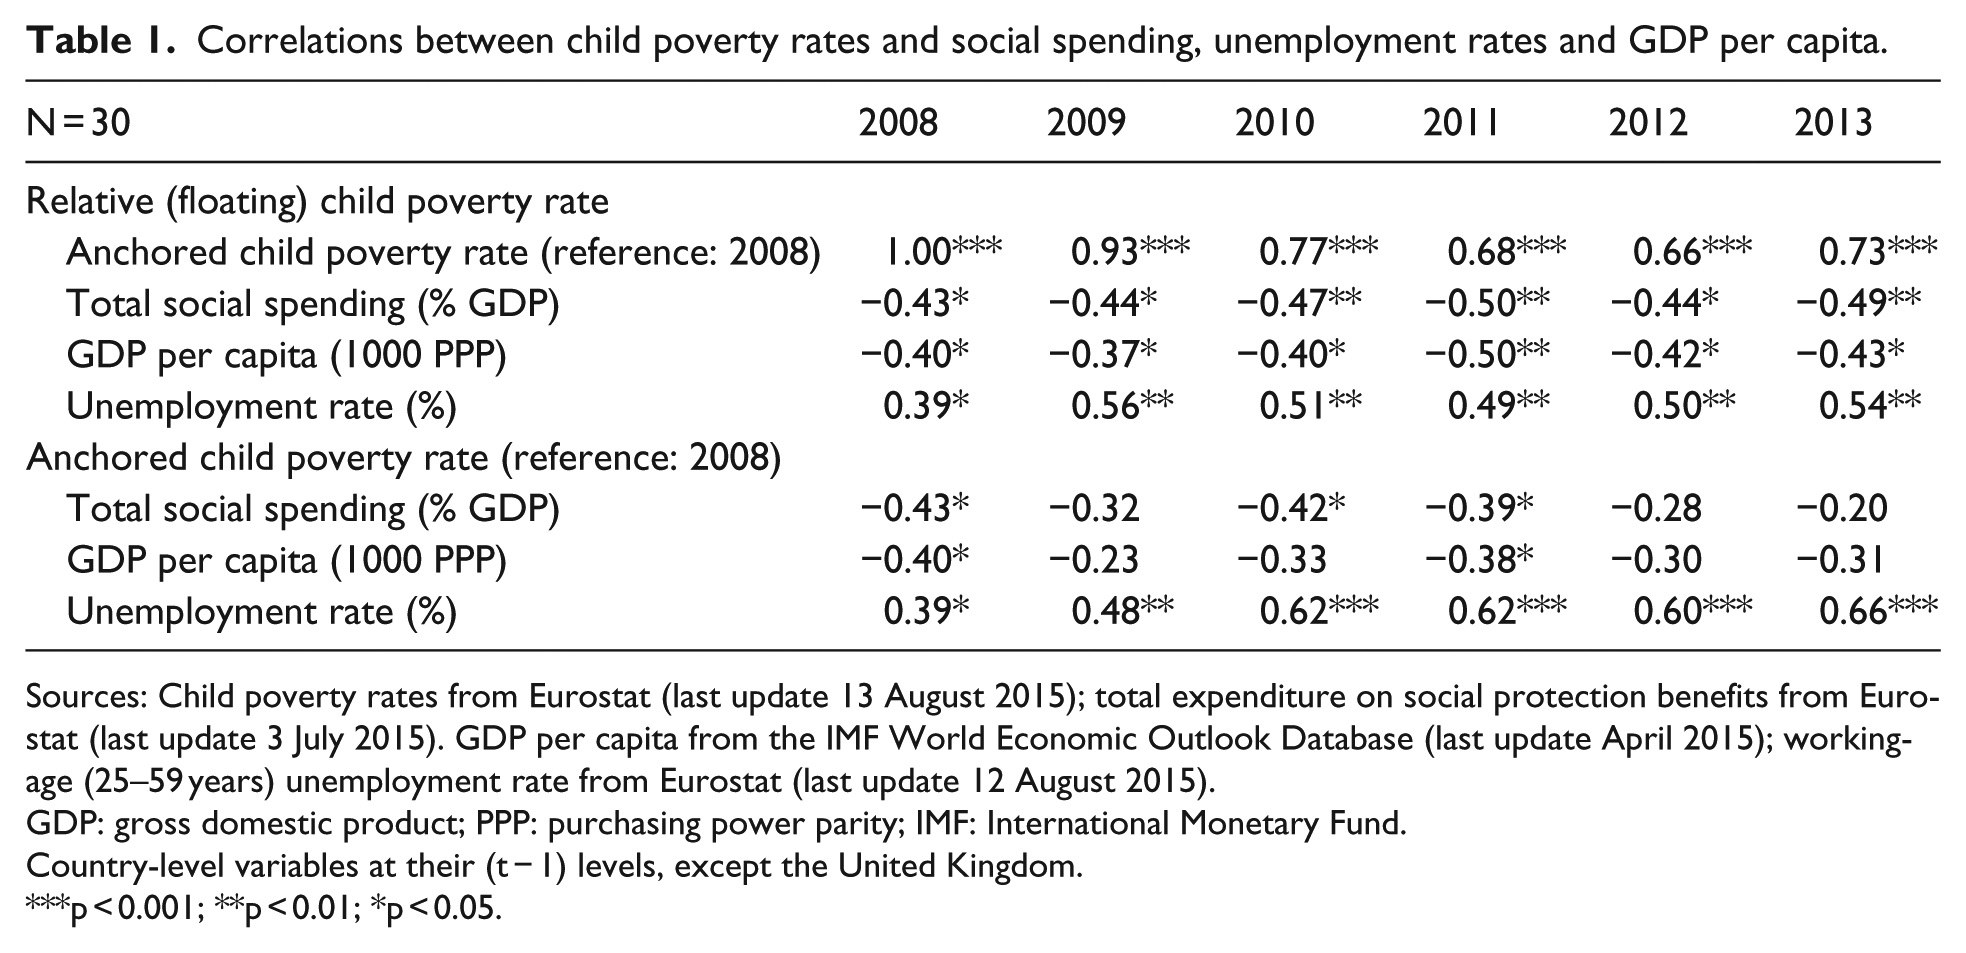
Sources: Child poverty rates from Eurostat (last update 13 August 2015); total expenditure on social protection benefits from Eurostat (last update 3 July 2015). GDP per capita from the IMF World Economic Outlook Database (last update April 2015); working-age (25–59 years) unemployment rate from Eurostat (last update 12 August 2015).
GDP: gross domestic product; PPP: purchasing power parity; IMF: International Monetary Fund.
Country-level variables at their (t − 1) levels, except the United Kingdom.
p < 0.001; **p < 0.01; *p < 0.05.
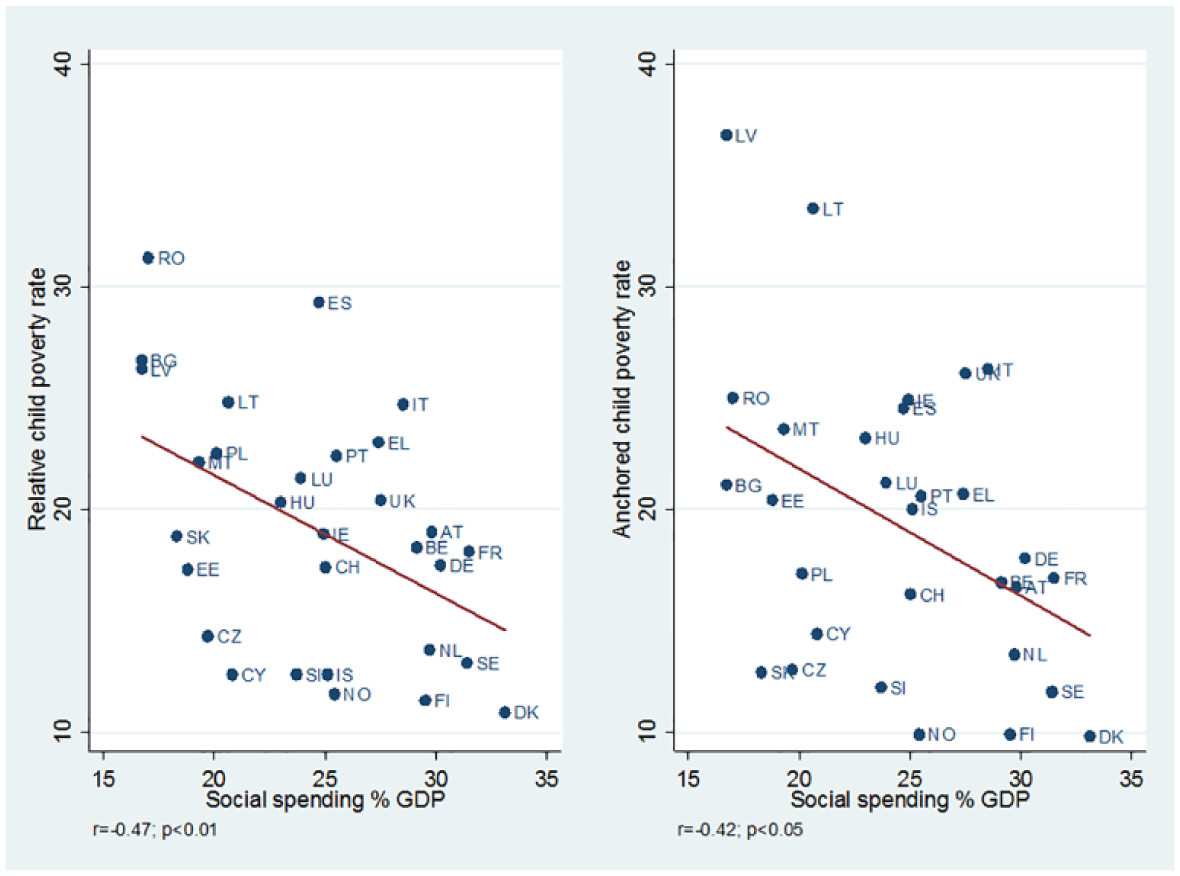
Child poverty rates and total social spending in 2010.
Child poverty during the Great Recession: effects of household characteristics, macro-economic conditions and social spending
Tables 2 and 3 report the results of random intercept multilevel logistic regression models 15 of child poverty estimated separately for each wave of the EU-SILC between 2008 and 2013, using the relative and anchored poverty thresholds, respectively. 16 Both models include cross-level interactions between social spending and three indicators of household-level vulnerability to poverty (very low work intensity household, large family and lone-parent household). The reported estimates are the effects of the predictor variables on the logarithm of the odds of a child being poor. To calculate the corresponding effects on the odds of poverty, leading to a more intuitive interpretation, the estimated coefficients need to be exponentiated (‘anti-logged’).
Multilevel logistic regression of relative child poverty (2008–2013).
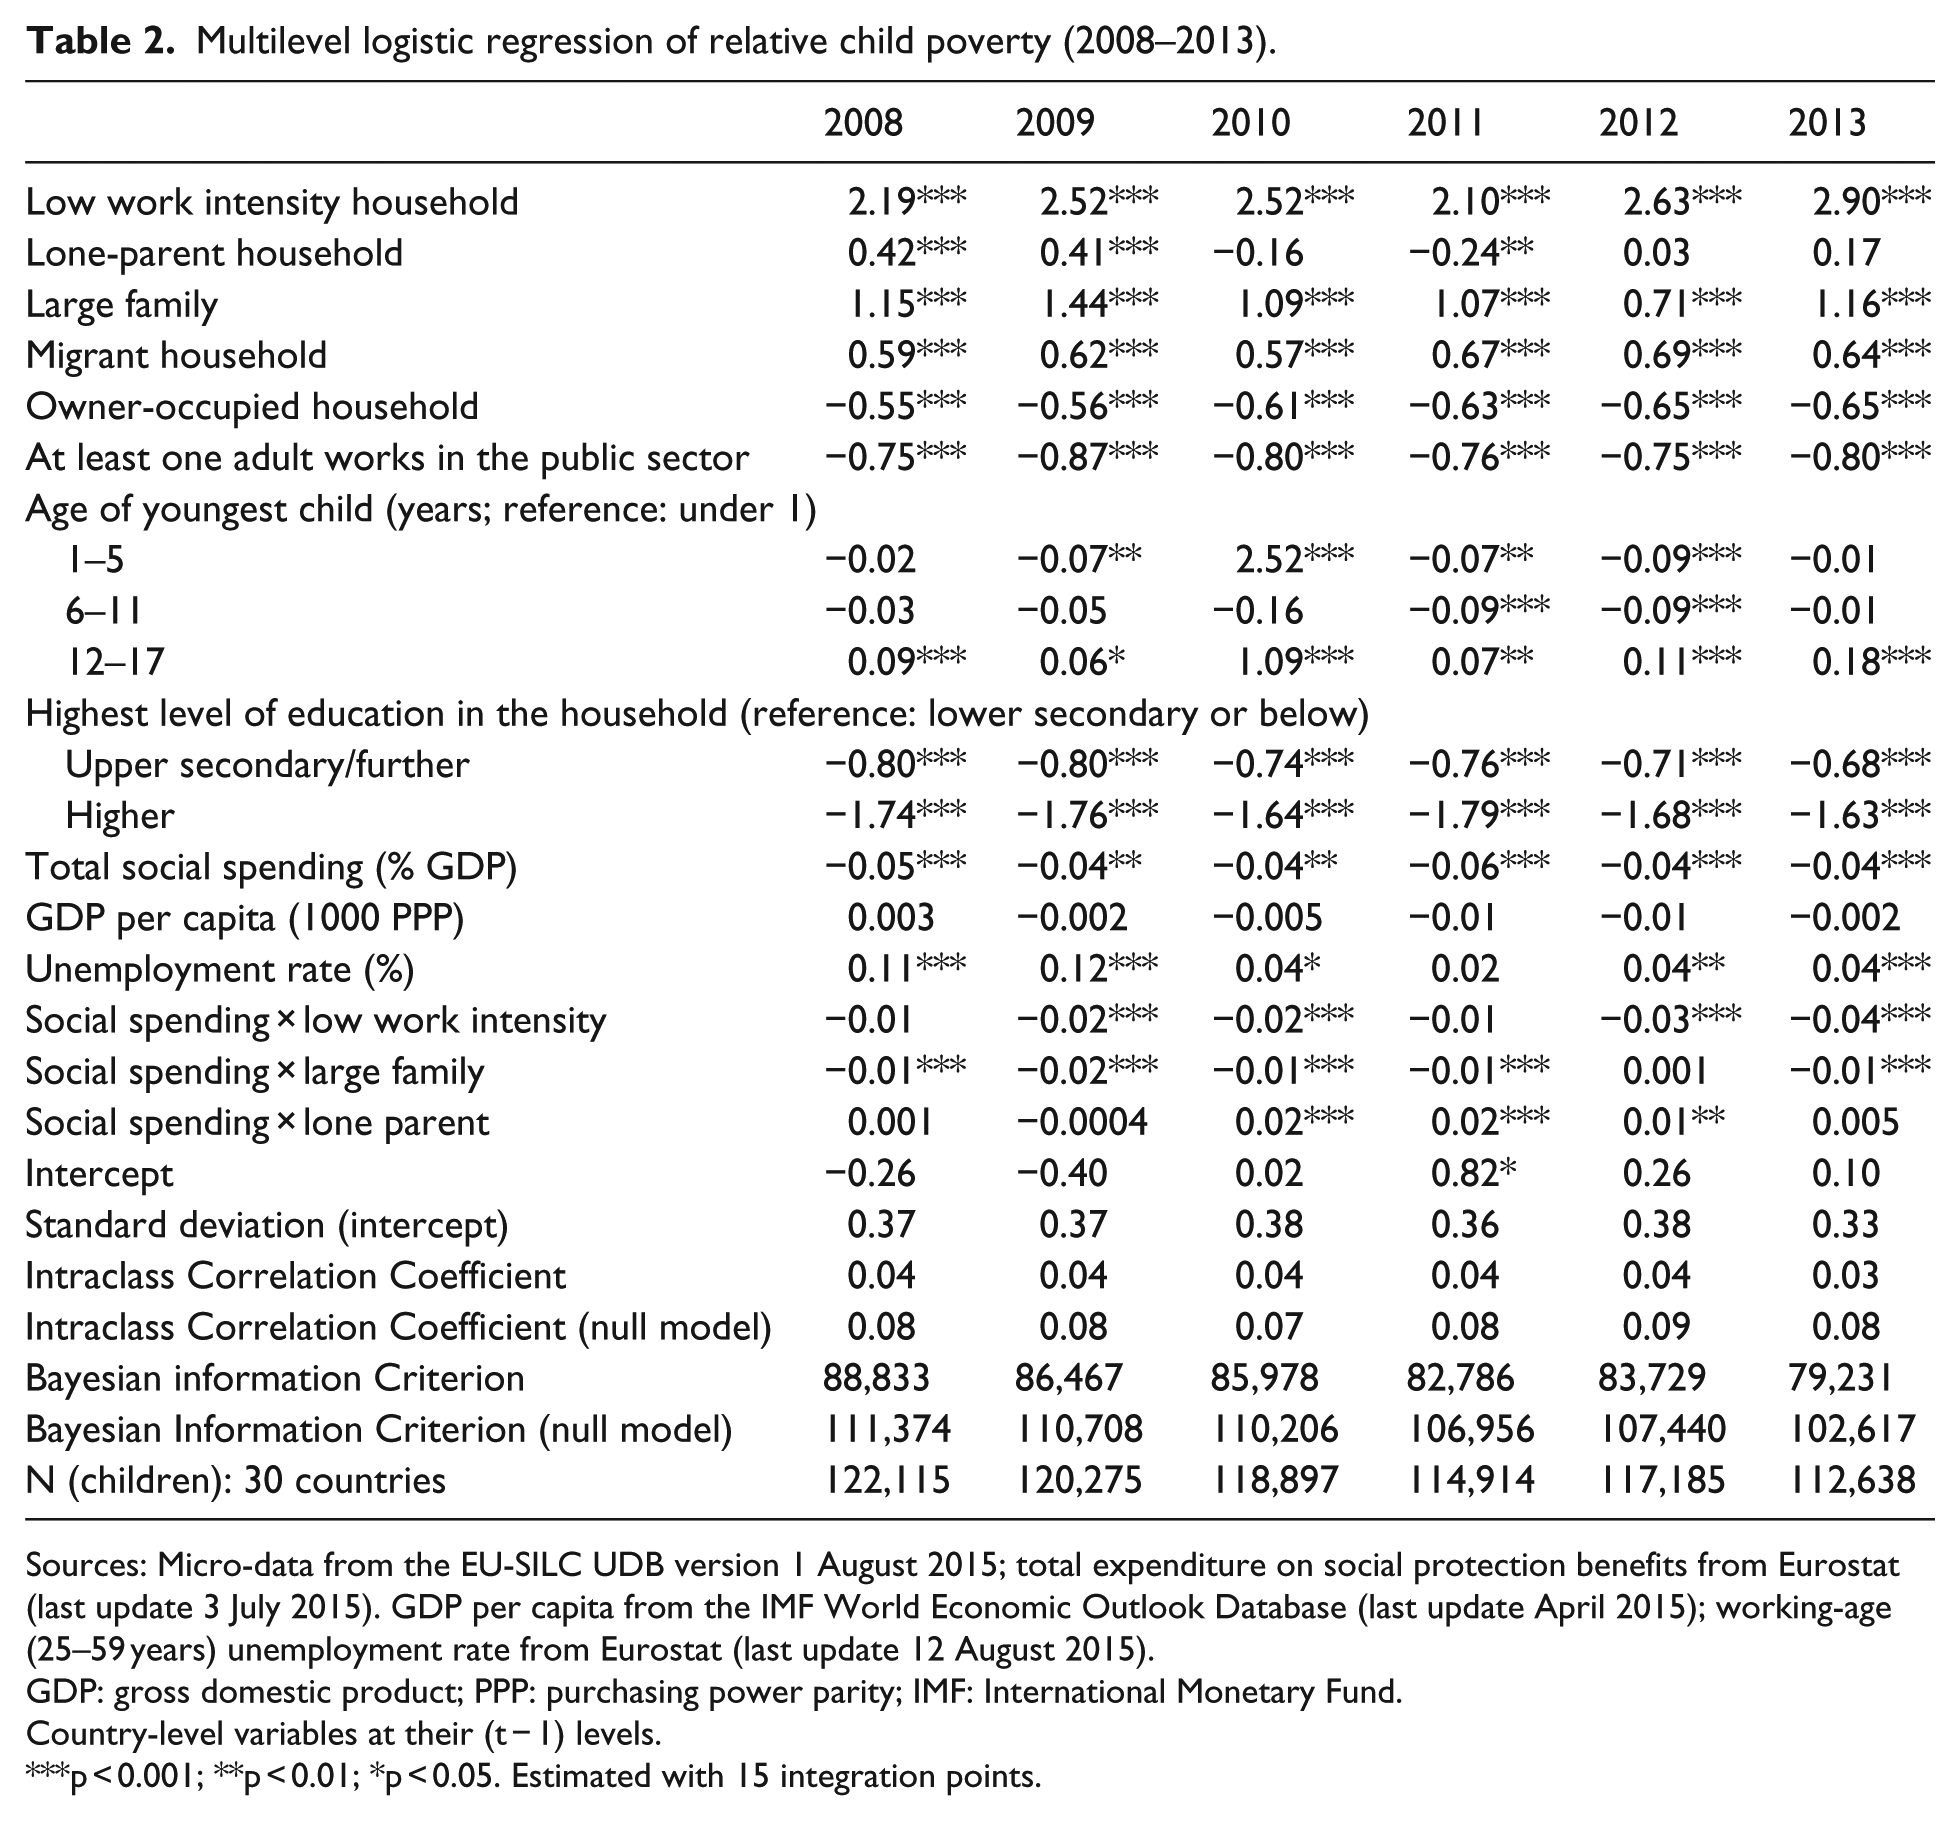
Sources: Micro-data from the EU-SILC UDB version 1 August 2015; total expenditure on social protection benefits from Eurostat (last update 3 July 2015). GDP per capita from the IMF World Economic Outlook Database (last update April 2015); working-age (25–59 years) unemployment rate from Eurostat (last update 12 August 2015).
GDP: gross domestic product; PPP: purchasing power parity; IMF: International Monetary Fund.
Country-level variables at their (t − 1) levels.
p < 0.001; **p < 0.01; *p < 0.05. Estimated with 15 integration points.
Multilevel logistic regression of anchored child poverty (2008–2013).
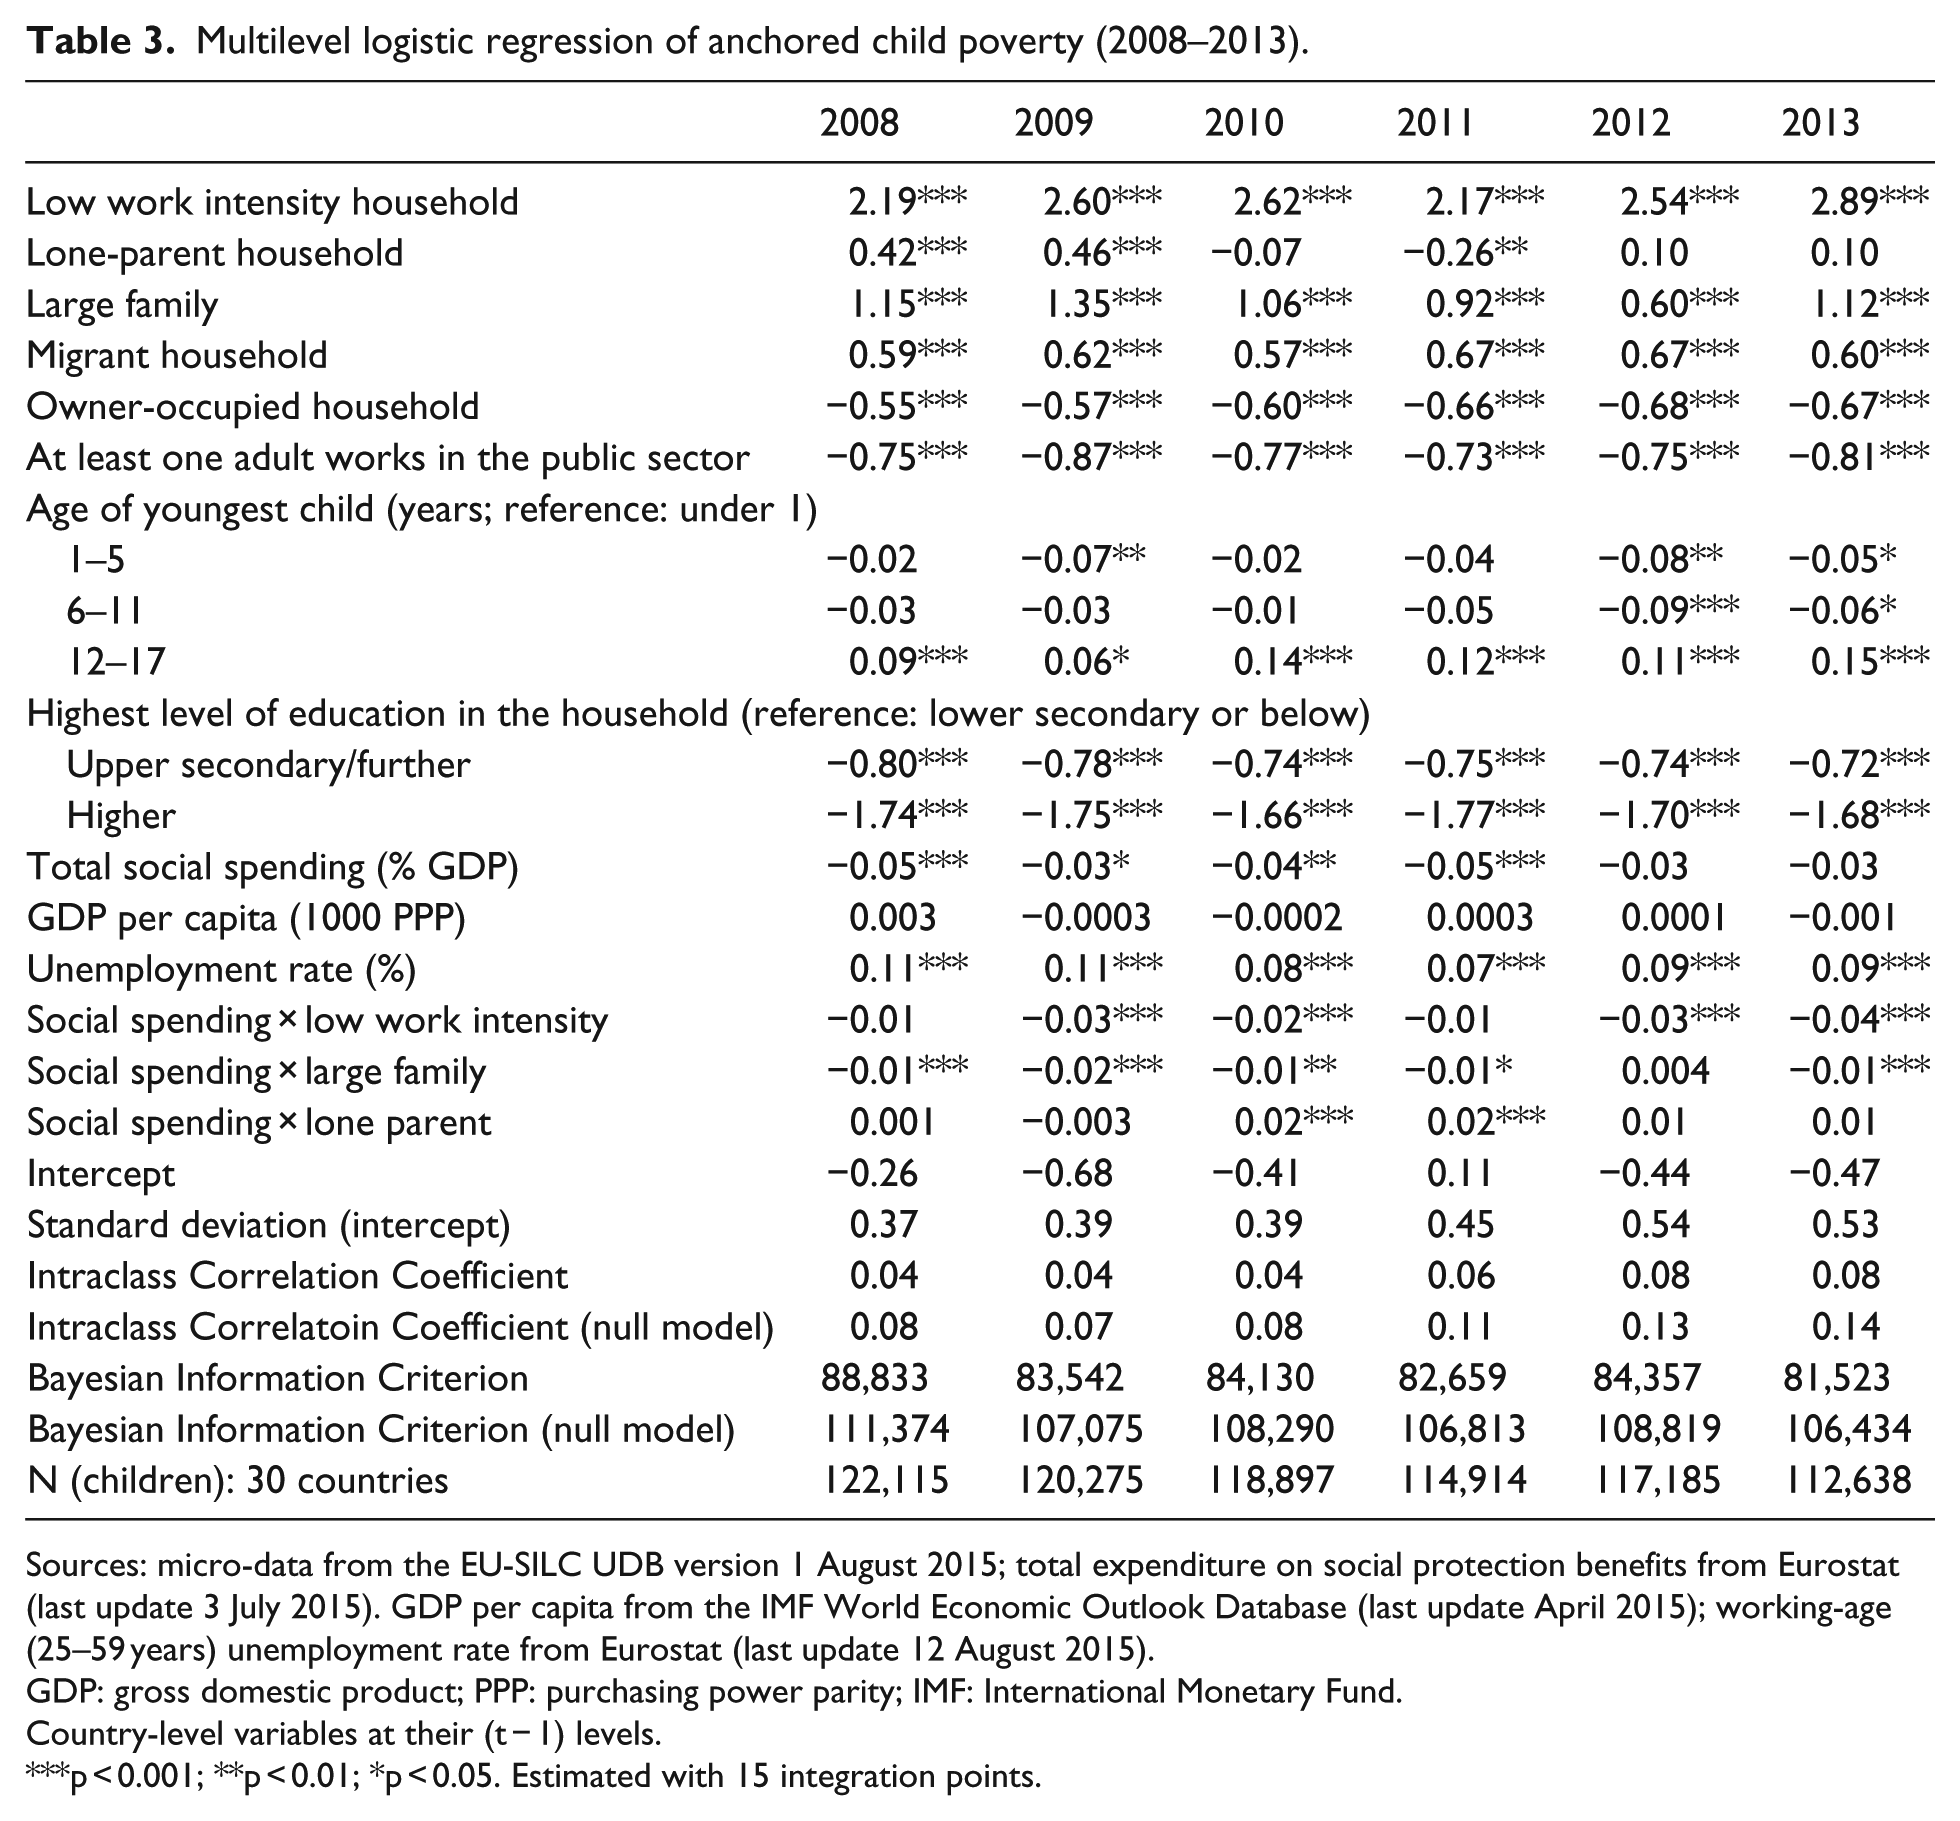
Sources: micro-data from the EU-SILC UDB version 1 August 2015; total expenditure on social protection benefits from Eurostat (last update 3 July 2015). GDP per capita from the IMF World Economic Outlook Database (last update April 2015); working-age (25–59 years) unemployment rate from Eurostat (last update 12 August 2015).
GDP: gross domestic product; PPP: purchasing power parity; IMF: International Monetary Fund.
Country-level variables at their (t − 1) levels.
p < 0.001; **p < 0.01; *p < 0.05. Estimated with 15 integration points.
The effects of household-level controls are all as expected in both models. Unsurprisingly, living in a very low work intensity household has the largest effect on the individual risk of poverty. However, due to the statistical significance of cross-level interaction terms between work intensity and social protection pending in 2009–2010 and 2012–2013, the effects of work intensity cannot be interpreted in isolation. All else being equal, the odds of living in relative poverty (see Table 2) for children in very low work intensity households are between 7 and 8 times greater than the odds for those who live in higher work intensity households, given average levels of social protection spending. 17
Children are also more likely to be poor if they live in lone-parent households and large families, with some variation across social spending levels, as well as in migrant households, non-owner-occupied households, those where no one works in the public sector and households where the highest level of education among adults is lower secondary or below, ceteris paribus. Adolescents (aged 12–17 years) are consistently found to be at the greatest risk of poverty. This maybe because the ‘modified’ OECD equivalence scale used to adjust household incomes for differences in size and composition attributes a greater weight to children aged 14 years and older.
The effects of these indicators are remarkably similar across the two models, suggesting that the same types of socio-demographic risks are associated with the two measures of income poverty. The effects of household-level characteristics are also relatively stable over the years, indicating that the relative importance of different inequalities has not changed dramatically between 2008 and 2013. However, differences between lone-parent and other households declined somewhat over the years, while differences between renters and owner-occupiers increased, all else being equal.
Country-level characteristics also affect individual risks of child poverty, although to some extent this depends on which poverty line is chosen. Country wealth (GDP per capita) has no significant effect on the risks of child poverty in either model. 18 The working-age unemployment rate has a significant effect on individual risks of child poverty, except in 2011 for relative poverty. The effects of unemployment are larger and more precisely estimated for anchored poverty during the entire period studied. This suggests that the crisis has had a greater impact, via the labour market, on poverty measured in relation to past, rather than current, living standards.
Having controlled for cross-country differences in socio-demographic structure, unemployment and per capita GDP, total spending on social protection benefits as a share of GDP has significant negative effects on the risk of relative poverty every year between 2008 and 2013 and on the risk of anchored poverty between 2008 and 2011 only. This is consistent with the results of macro-level analysis (Table 1) and lends support to Hypothesis 1 (i.e. that higher social protection spending would have cushioned the impact of the economic crisis on household income, especially in the earlier period). To check whether certain types of benefits drive the effects of social protection spending, alternative indicators were used as robustness checks: spending on family/child benefits as a percentage of total social protection spending 19 or in purchasing power standards per inhabitant, as well as spending on unemployment and housing benefits as a share of total social spending. However, none of these had statistically significant net effects on child-level risks of poverty (results available on request), suggesting that it is the combination and interplay of different types of social protection benefits that make the most difference as contextual effects.
However, since the models in Tables 2 and 3 include cross-level interaction terms, the baseline effects of social spending only apply to children who live in higher work intensity households, with one or two children under 18 years, and two parents. To calculate the effects of social spending for children in other household types, the estimated interaction term coefficients also need to be taken into account. Figures 3–5 show predicted probabilities (estimated at the means of all predictors using the coefficients for 2010 from Table 2) of living in a household with disposable income below 60 percent of the contemporary median, across the range of social protection spending in the sample, separately by household work intensity, family size and family type. The model for 2010 is used for illustrative purposes here because it refers to incomes in 2009 at the height of the economic crisis. Since the respective regression coefficients are similar for anchored poverty in Table 3, predicted probabilities for anchored poverty are not plotted separately here.
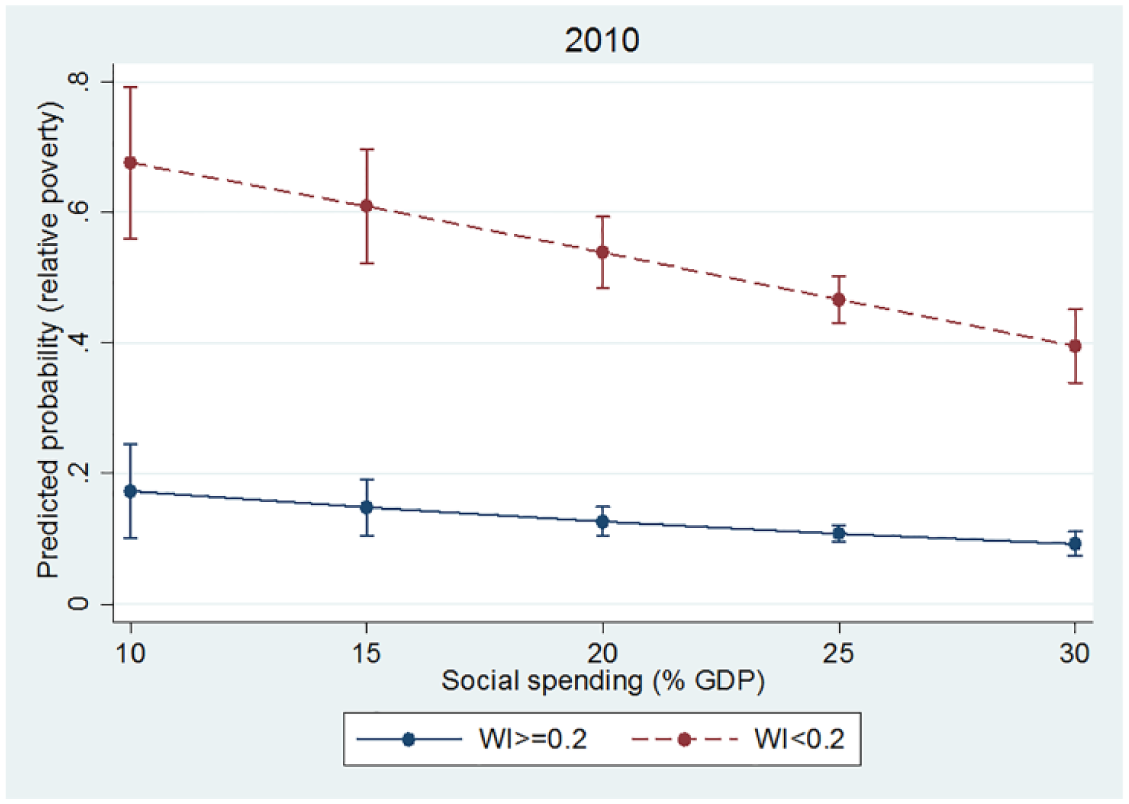
Effect of total social spending on the predicted probability of a child being poor, by household work intensity (2010).
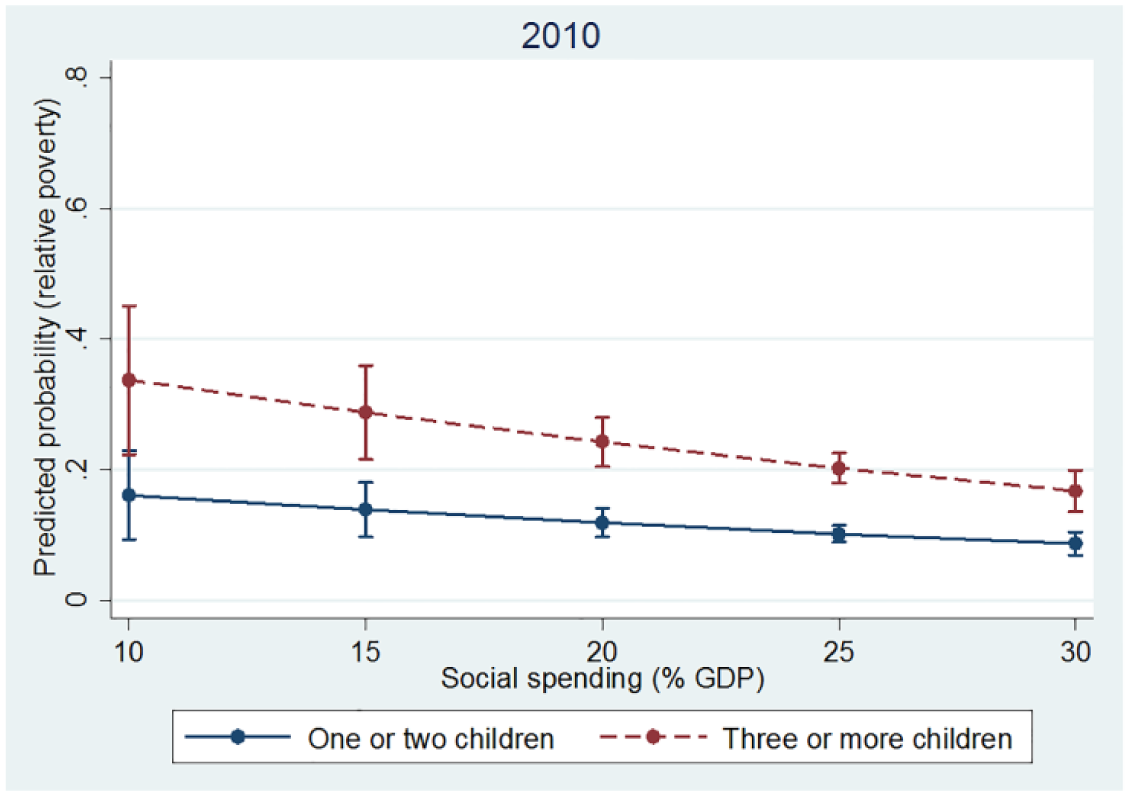
Effect of total social spending on the predicted probability of a child being poor, by number of children in the household (2010).
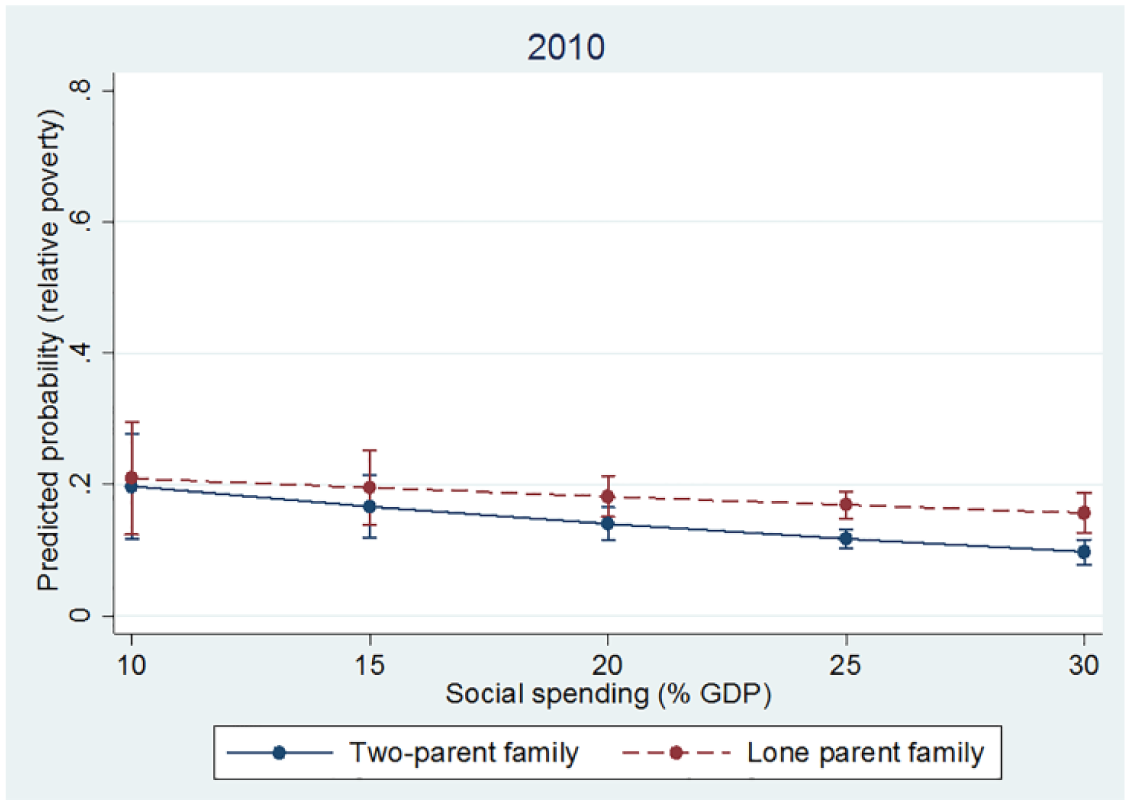
Effect of total social spending on the predicted probability of a child being poor, by family type (2010).
Figure 3 shows that differences in the predicted probability of living in a poor household by work intensity are progressively smaller at higher levels of social protection spending. It also illustrates that the poverty-dampening effect of social spending is higher (in absolute terms) for very low work intensity households. Going from the highest level of social spending in the sample (30% of GDP) to the lowest (10% of GDP), the predicted probability of relative poverty ranges from 0.40 to 0.68 and from 0.09 to 0.17 for children in very low work intensity households and those in higher work intensity households, respectively. Although at all levels of social spending, households with work intensity below 20 percent are substantially more likely to be poor, these results support Hypothesis 2 (i.e. that differences by work intensity would be lower in countries with higher social spending and that the poverty cushioning effect of social spending would be greater for more vulnerable households).
Similarly, differences by household size are smaller at higher levels of social spending and the effect of social spending is somewhat higher for larger families (Figure 4). The predicted probability of relative poverty ranges from 0.17 to 0.34 for children in large families and from 0.09 to 0.16 for those in smaller families, given the variation in social spending across the 30 countries in the sample.
Similar findings, however, do not bear out for differences by family type (Figure 5). In 2010, children in lone-parent households appear to be just as likely to be poor as those in couple families, everything else being equal, given low to medium levels of social spending, with differences emerging at higher levels of spending only. This could be because lone-parent households are more widespread in predominantly Western and Nordic European countries with higher levels of social spending, where lone parents tend to live as single-unit households, while in Eastern and Southern European countries, with lower levels of social spending, lone parents tend to live in multi-generational households (see Chzhen and Bradshaw, 2012). Meanwhile, the poverty-dampening effect of social spending is somewhat greater for children in couple families, suggesting that lone-parent poverty rates are not as sensitive to aggregate levels of social protection spending.
Conclusion
The 2008 financial crisis triggered the first contraction of the world economy in the post-war era. This article investigates the effect of the economic crisis on child poverty across the EU-27, plus Iceland, Norway and Switzerland, between 2008 and 2013. Although this study focuses on the material well-being of children, more data are needed to investigate the impact on other aspects of child well-being, such as health and safety, education, and behaviours and risks, as well as subjective well-being. Some of these effects may not manifest until long after the Great Recession. This article uses two complementary thresholds of income poverty, both based on 60 percent of the national median: a relative (or contemporary) poverty line and a threshold anchored in 2008. The implications of using these two different but related measures during the Great Recession have not been analysed extensively to date. Between 2008 and 2013, anchored child poverty increased in 18 countries, decreased in 10 countries and remained unchanged in two (Denmark and Germany). Meanwhile, relative poverty increased in 14 countries, decreased in five countries and remained stable in 11 countries. Increases in relative poverty tended to be smaller in magnitude than changes in anchored poverty, suggesting that the living standards of average households often fell at the same time as those of the poor. Meanwhile, individual-level risks of a child being poor across a range of household-level characteristics were similar for the two poverty lines. This suggests that the selection of a poverty threshold matters more for the analysis of aggregate poverty rates than the household-level risk factors associated with income poverty.
Although child poverty is more widespread in countries with higher rates of working-age unemployment, suggesting a significant impact of the Great Recession on household incomes via the labour market, the study finds evidence for social protection spending cushioning the blow of the crisis at least to some extent. Children were significantly less likely to be poor in countries with higher levels of social protection spending in 2008–2013, even after controlling for the socio-demographic structure of the population, per capita GDP and the working-age unemployment rate. The effects of spending were larger and more precisely estimated for relative rather than anchored poverty. These results are consistent with the vast body of literature on the pre-crisis relationship between poverty and social spending in smaller samples of rich countries (e.g. Caminada et al., 2012). Even at a time when economic output shrinks in absolute terms (e.g. in 2009), children are less likely to be income poor in countries that spend a larger share of their GDP on social protection benefits.
Moreover, social spending seems to make more of a difference to the poverty risks of children in low work intensity families and large families. This is not surprising since they are more likely to rely on social protection benefits. However, this was not the case for differences between family types: social spending had a greater effect for children in couple families, and the differences between lone-parent and couple families were greater in countries with higher levels of spending. This is likely because lone-parent families are more widespread and more likely to live in autonomous households in the predominantly richer European countries with higher levels of social spending.
Overall, the results for 2008–2013 emphasise the importance of social transfers during an economic crisis and its aftermath of uneven and muted recovery. However, given the predominance of austerity policies triggered by the deficits accumulated during the crisis and the 2- to 3-year lag with which household income data become available, it is still too early for a final account of the full impact of the crisis on children and the role of social policies. Moreover, further research is needed to disentangle the effects of both the design and generosity of different benefit types on child poverty.
Footnotes
Funding
The author(s) received no external financial support for the research, authorship and/or publication of this article.