
Abstract
Background
Standing toe curl (STC) has an immediate effect on muscle activity, but the kinematics of the exercise and its effect on the medial longitudinal arch of the foot are unknown.
Objective
The purpose of this study was to examine the differences in kinematic and kinetic changes during toe flexion while performing towel curl (TC) in a standing position and STC.
Methods
Ten healthy adults with normal feet (18 limbs) participated in this study. Using a three-dimensional motion analysis system, we calculated the toe flexion angle, medial longitudinal arch (MLA) angle, MLA height, MLA length, ankle joint angle, center of foot pressure, and center position of the hip joint during toe flexion using TC and STC exercises.
Results
The TC exercise resulted in a decrease in the MLA due to the backward shift in the center of pressure and ankle dorsiflexion. On the other hand, STC did not demonstrate any significant difference in the position of the center of pressure or ankle joint angle, allowing the toes to flex while maintaining a standing posture and resulting in an increase in the MLA.
Conclusions
STC was suggested to be effective in maintaining MLA for weight support.
Keywords
Introduction
The foot consists of three arches formed based on the anatomical and functional arrangement of the foot bones: the medial longitudinal arch (MLA), lateral longitudinal arch, and transverse arch. 1 These foot arches respond flexibly to load changes and play an important role in shock absorption and propulsion during movement.2,3 Among the arches of the foot, the MLA is the longest and tallest arch and is considered important when considering the support of the body. This is facilitated by a static support mechanism composed of bones, joints, and ligaments and a dynamic support mechanism composed of muscles around the foot. Recent studies have suggested that the intrinsic flexor muscles of the foot play a supporting role in the maintenance of MLA through methods such as electrical stimulation and paralysis of the intrinsic flexor muscles of the foot.4,5 This has led to increased attention to the importance of the intrinsic flexor muscles of the foot.
In clinical situations, towel curl (TC) exercises are frequently performed as an exercise therapy to strengthen the intrinsic flexor muscles of the foot and increase the MLA. 6 Moreover, training under load has been reported to be effective in improving the toe function. 7 Therefore, performing TC in the standing position is considered effective for movement under load. However, for movements under a load, such as walking or running, supporting the arch of the foot during forward loading while kicking off is necessary. However, owing to the characteristics of the movement, TC is performed with a backward load to flex the toes, which results in loading conditions that differ from those encountered in actual sports performance situations. Therefore, we devised a toe flexion exercise (standing toe curl; STC) that places a load on the front of the foot. 8 With the STC, flexing the toe while placing a load on the forefoot by extending the toe distal to the metatarsophalangeal joint from the platform has become possible (Figure 1).
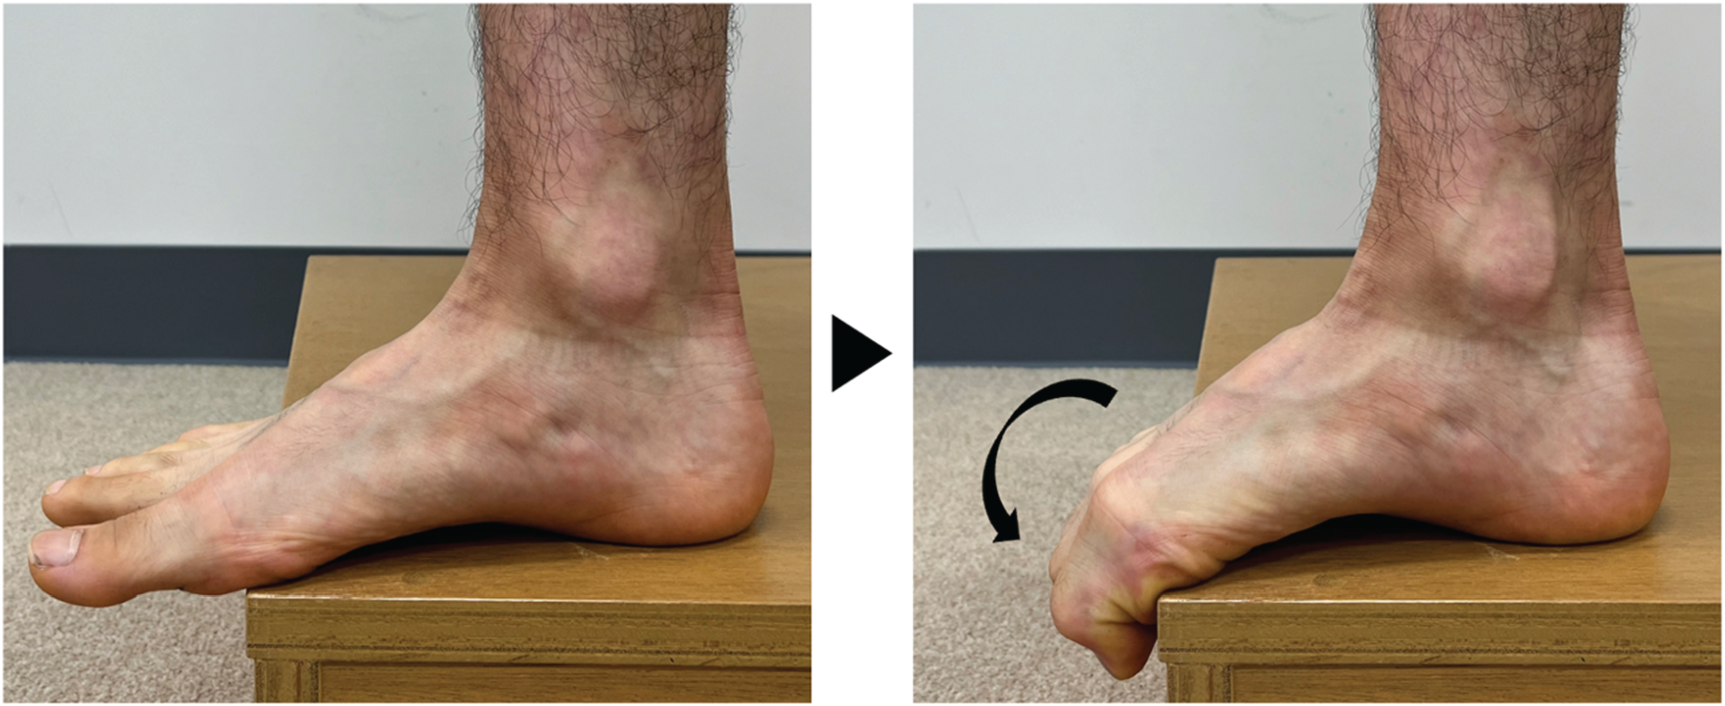
STC: Standing Toe Curl. Toe flexion is possible with the toe distal to the metatarsophalangeal joint out of the platform and with the forefoot also loaded.
Thus far, we have examined the immediate effects of TC and STC separately on muscle activity for the intrinsic and extrinsic flexor muscles of the foot. The results demonstrated that STC was more effective than TC in increasing muscle activity in the intrinsic and extrinsic flexor muscles of the foot. Regarding the intrinsic flexor muscles of the foot, the activity of the abductor hallucis muscle, which contributes to the MLA support, increases. 8 However, surface electromyogram analysis cannot capture the kinematic characteristics of exercise or the morphological changes in the MLA associated with toe flexion. The intrinsic flexor muscles of the foot, including the abductor hallucis muscle, are believed to help support the MLA.4,9 Intervention studies have confirmed that toe flexion exercises lead to an elevation of MLA.10,11 Therefore, in STC, focusing on morphological changes in the foot, such as increased MLA due to toe flexion, and clarifying the kinetic basis is necessary. Therefore, in this study, we aimed to verify the effects of toe flexion exercises using a three-dimensional (3D) motion analysis system and to analyze the kinematic and kinetic characteristics during toe flexion.
Participants
The participants included were 10 healthy adults with 20 limbs (age 21.6 ± 1.3 years: mean ± standard deviation). Participants were excluded if they had an orthopedic disease or pain in their lower extremities within 6 months before the study or if they had a history of surgery involving their lower extremities. In addition, based on the results of the Foot Posture Index-6 (FPI-6), an assessment of foot alignment, two limbs were excluded due to differences in foot morphology. Limbs with a score of 6 or higher, which is considered a pronated foot, and those with a score of −5 or lower, which is considered a supinated foot were excluded. 12 As a result, 18 limbs (five men, five women, age 21.1 ± 1.6 years, height 166.3 ± 6.2 cm, weight 56.2 ± 9.6 kg, body mass index (BMI) 20.2 ± 2.3, foot length 24.0 ± 1.3 cm, FPI-6 2.1 ± 1.6 points, arch height rate 24.7 ± 1.7%, joint range of motion (ROM): dorsiflexion 20.6 ± 4.2°, plantar flexion 49.2 ± 6.0°, hallux flexion 31.9 ± 11.6°: mean ± standard deviation) were targeted. This study was approved by the Ethics Review Committee of Aomori University of Health Sciences (approval number: 22013, dated June 21, 2022). The participants received a thorough verbal and written explanation in advance, and their consent was obtained before the study began.
Basic attributes included height, weight, BMI, and foot morphology such as foot length, FPI-6, arch height index (AHI), and ROM of the ankle and toe joints. The FPI-6 was used to evaluate the degree of pronation and supination of the foot while the participant was standing relaxed. 13 AHI was calculated by instructing the examiner to apply 90% of the individual's body weight to one lower leg and dividing the height of the dorsum of the foot at 50% of the foot length by the total foot length. 14 An electronic caliper was used to measure the height of the dorsum of the foot. The limb position for the measurement involved having the knee extended and the hip joint in a neutral position, midway between internal and external rotation. A goniometer from the University of Tokyo was used to measure the joint ROM. After obtaining consent from the participants, we applied the device directly to the ankle joint and measured the plantar dorsiflexion angle of the joint, with the basic axis being the fibula and the axis of movement being the fifth metatarsal bone. To calculate the ROM of the toes, the reference axis was the first metatarsal and the axis of movement was the first proximal phalanx. The flexion angle of the large toes was also measured to determine the ROM. The measured values were recorded at intervals of 5°.
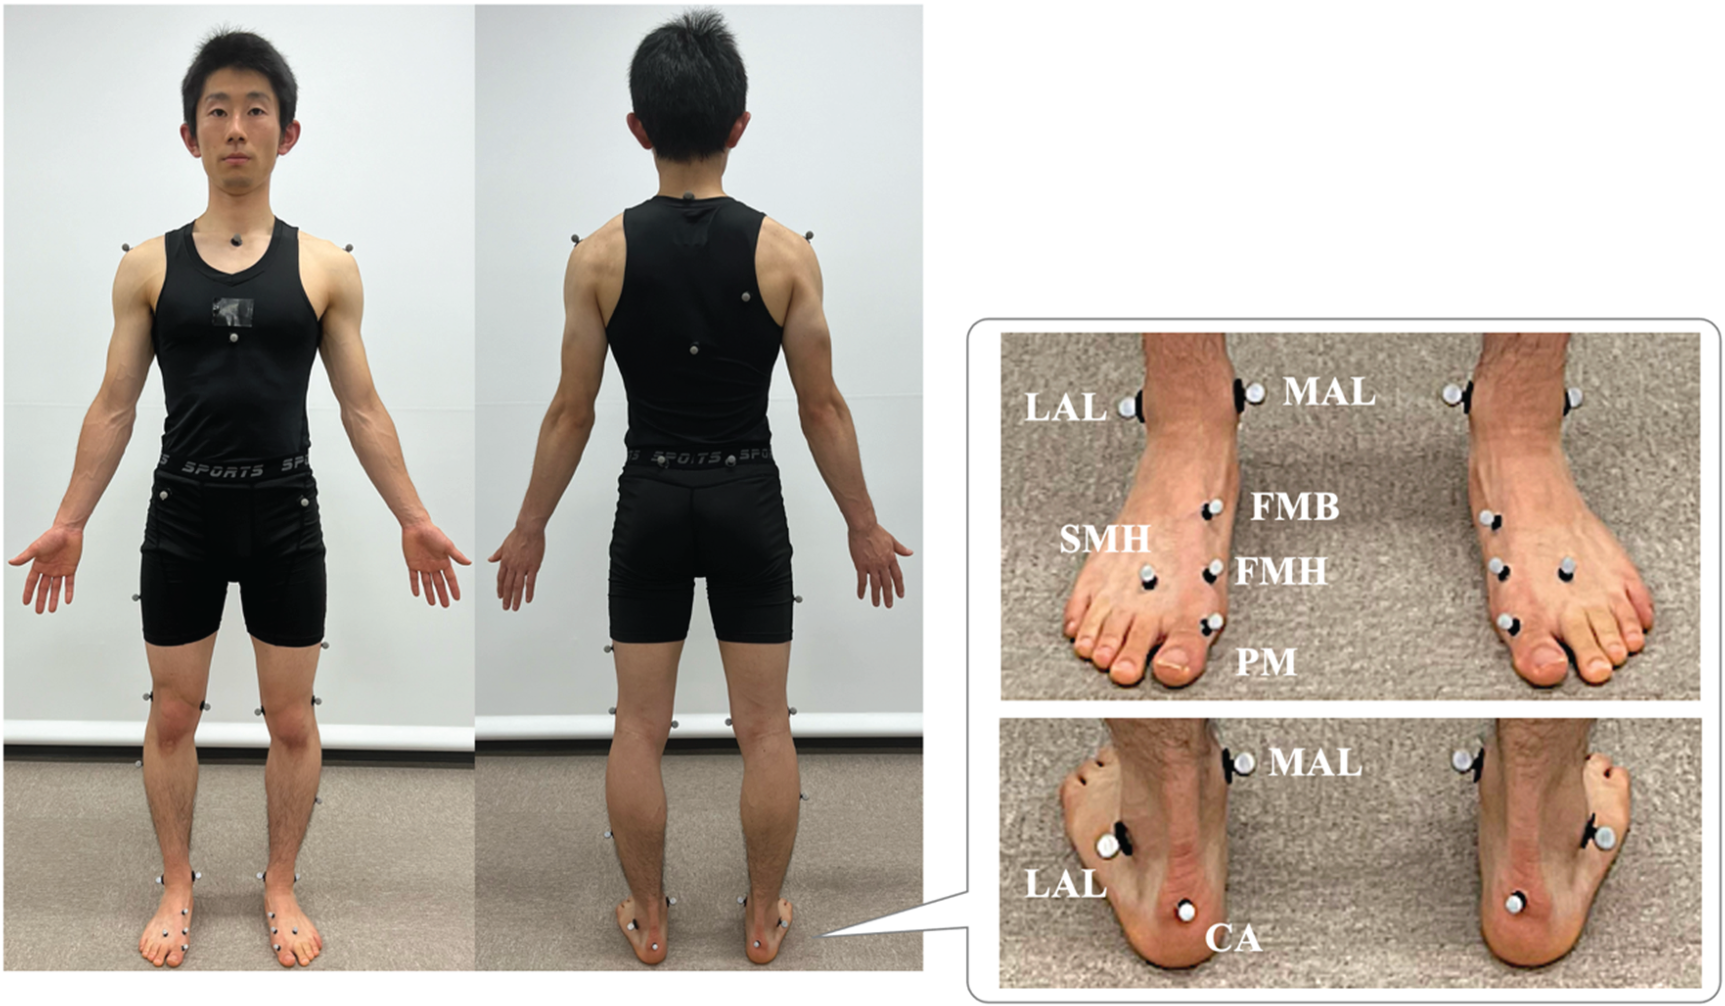
Placement of reflective markers around the foot region. MAL, distal apex of the medial malleolus; CA, calcaneus; FMB, base of first metatarsal; FMH, head of first metatarsal; PM, proximal phalanx of the first toe; LAL, distal apex of the lateral malleolus; SMH, head of the second metatarsal, each affixed.
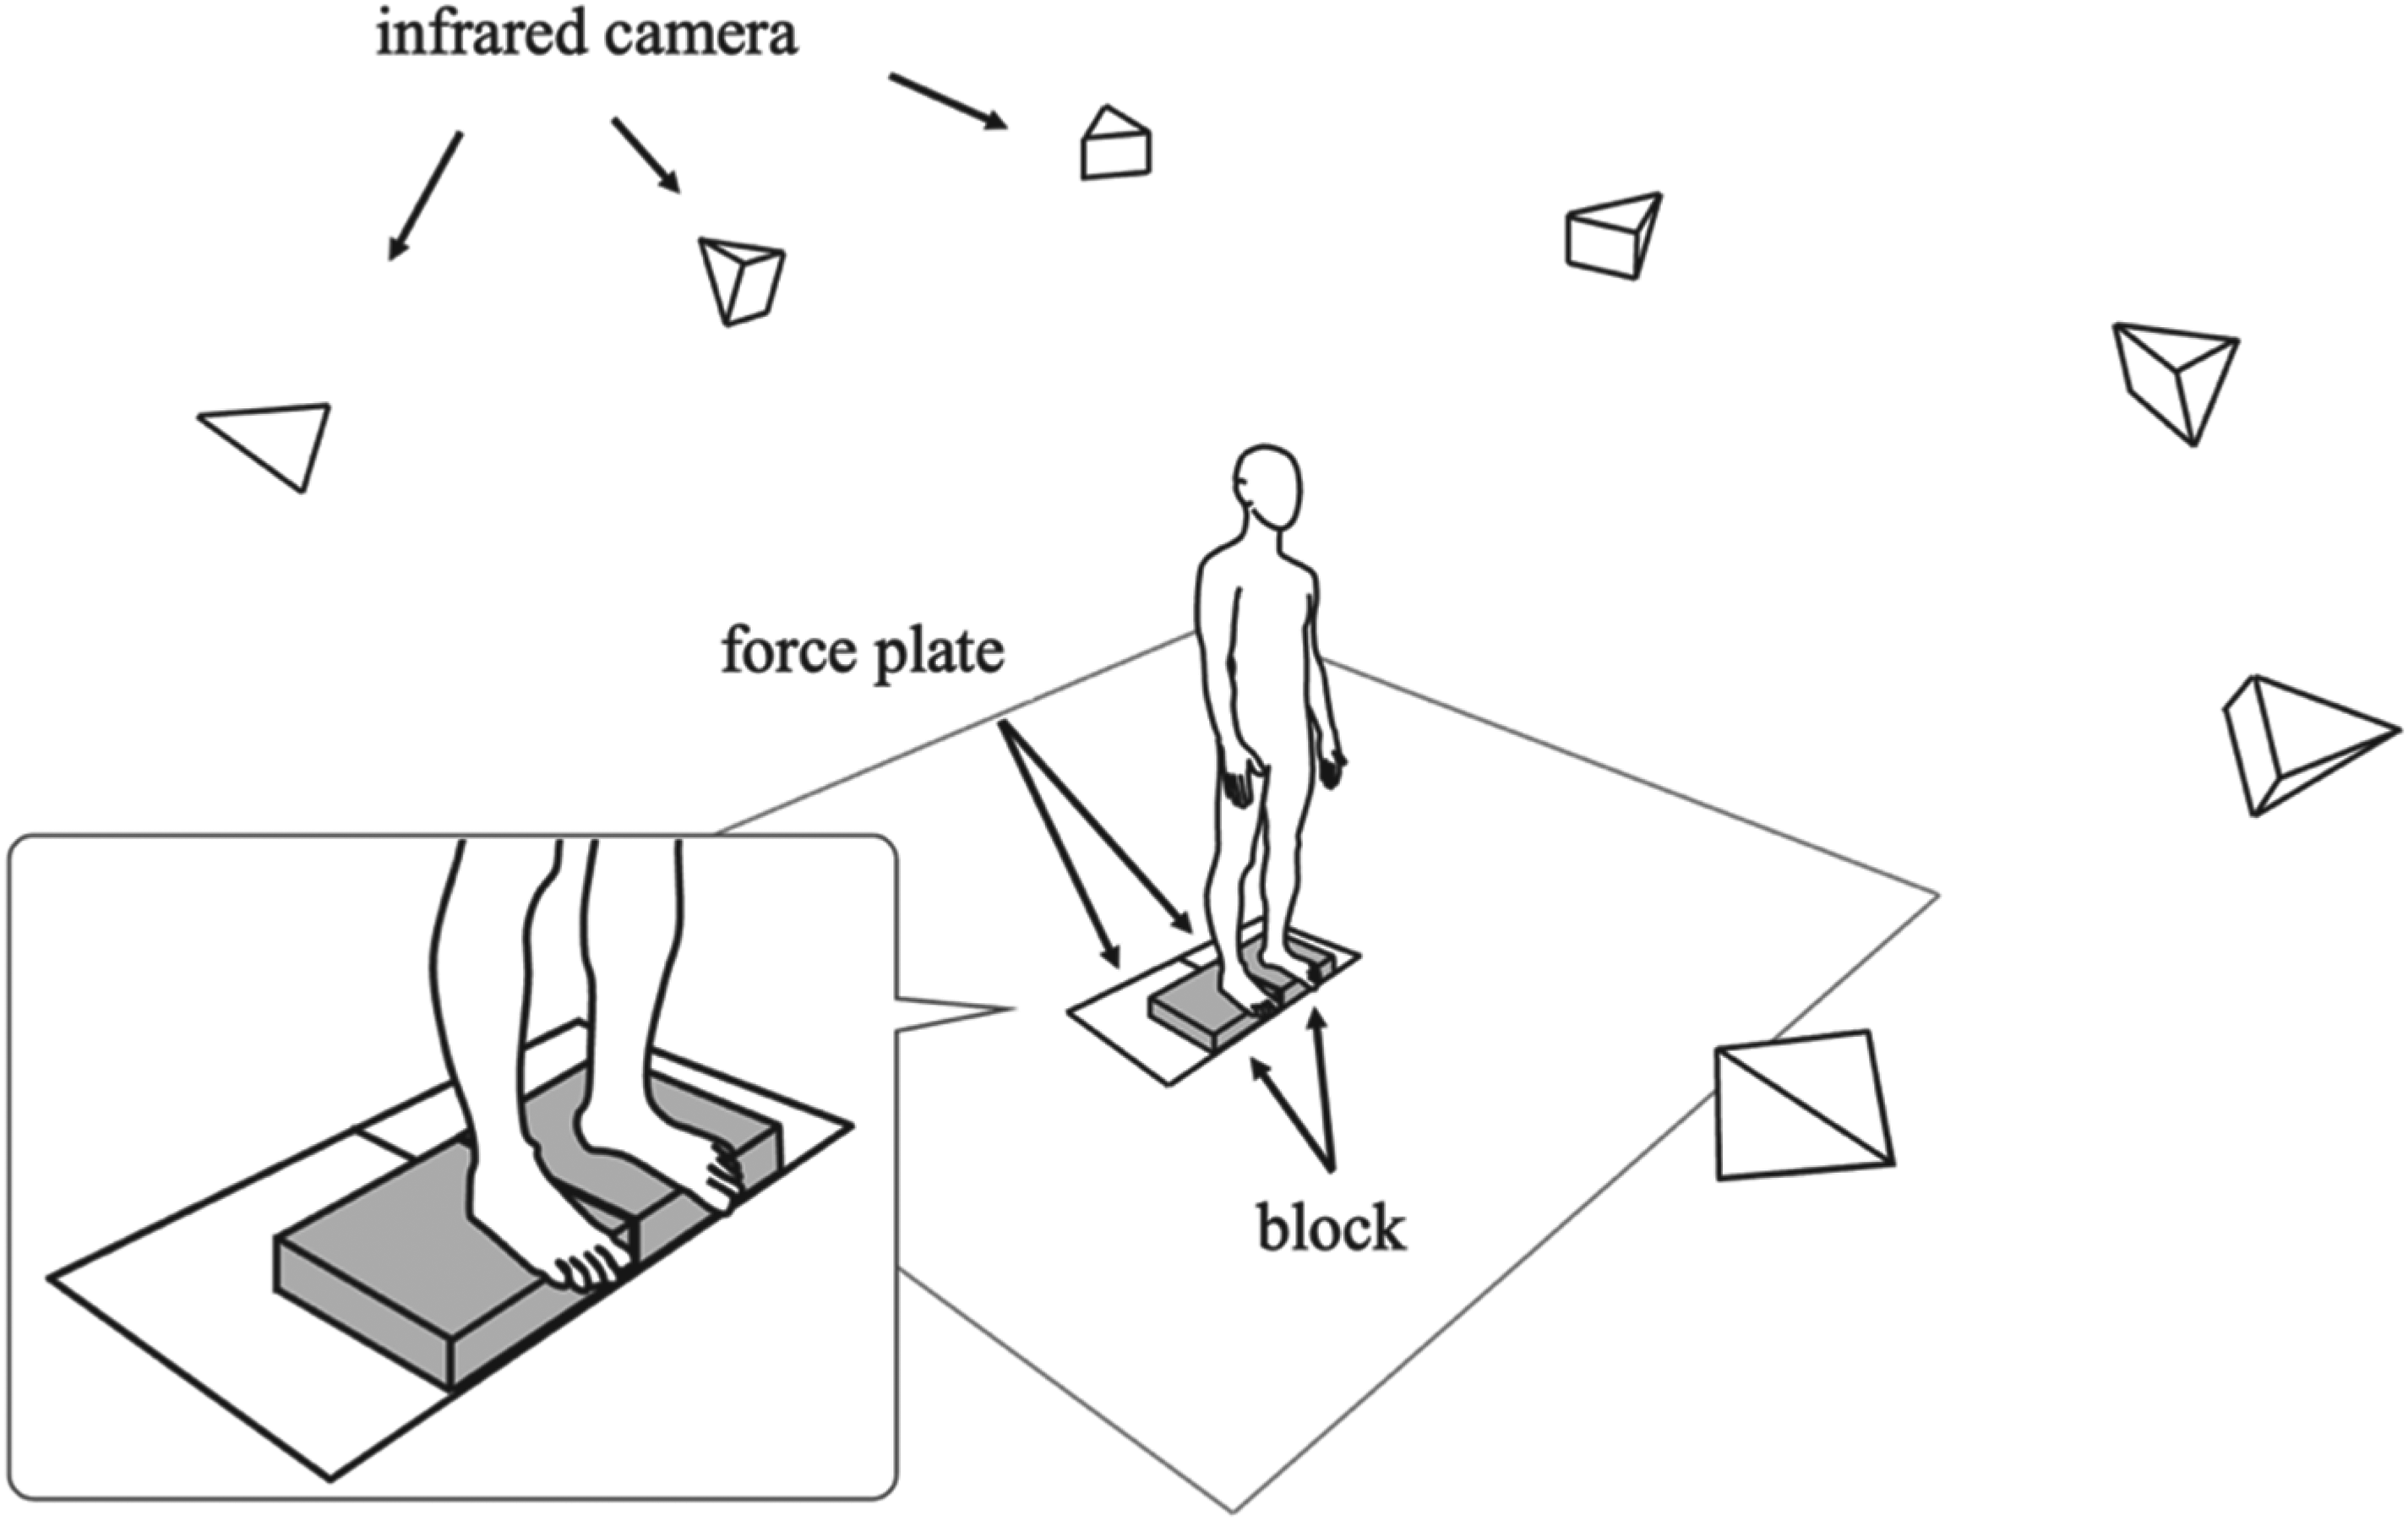
To measure kinematic and kinetic data during toe flexion, a 3D motion analysis system (Vicon MX T-20, Vicon Motion Systems Ltd., UK) consisting of eight infrared cameras and eight ground reaction force meters (OR6-6-2000, Advanced Mechanical Technology Inc., USA). The system calculated the coordinate data obtained at a sampling frequency of 100 Hz from 9.5 and 14 mm diameter retroreflective markers attached to 37 locations on the participant's body. Referring to the Trunk Body of Plug-in Gait, 15 additional retroreflective markers were placed at 10 points on the medial epicondyle of the knee joints, medial malleolus of the ankle joint, head of the first metatarsal (FMH), base of the first metatarsal (FHB), and proximal phalanx of the first toe (PM),16–19 for a total of 37 points bilaterally (Figure 2).
The toe flexion conditions included the TC and STC exercises in the standing position. Toe flexion was performed twice under each condition, and seven parameters were measured during toe flexion for each trial: hallux plantar flexion (HALpf), MLA angle (MLAa), height of the MLA, length of the MLA, angle of the ankle joint, center of pressure (COP), and hip joint center position. In the standing posture, patients were instructed to keep their eyes forward, with both upper limbs hanging to the side of the body without anterior-posterior trunk tilt or lateral flexion, both knee joints in extension, avoiding unbalanced loading on the contralateral lower limb, and flexing only the toes. Even when the toes were flexed, the participants were instructed to maintain an upright posture on the non-measuring side, keeping the knee joint extended and the foot and hip joints in a neutral position. The two conditions were conducted on the same day, with a 10-min rest period between conditions to minimize test effects and fatigue. The order of measurements was randomized to ensure that the sequence of the interventions did not affect the results.20,21
To allow the toes to flex without leaving the platform or touching the floor during STC, a block with a height of 6 cm was placed on the ground reaction force meter. Two conditions were then applied. The contralateral lower limb was elevated on a table of the same height, and the participants maintained a standing position on two adjacent floor reaction force meters. The ground reaction force of each lower limb was determined by placing the foot on different ground reaction force meters. After the block was installed, the floor-reaction force meter was recalibrated to zero for each condition.
After attaching the markers, measurements were obtained in a stationary standing position and used as reference values. In the static standing posture, an anatomical limb position was maintained by the participants for 5-s. Next, the participants were instructed to maintain maximum effort in toe flexion for 5-s, while measurements were taken. Before the actual measurements, we practiced each task movement under the two conditions. After confirming that the individuals were accustomed to the task movement, we conducted measurements.
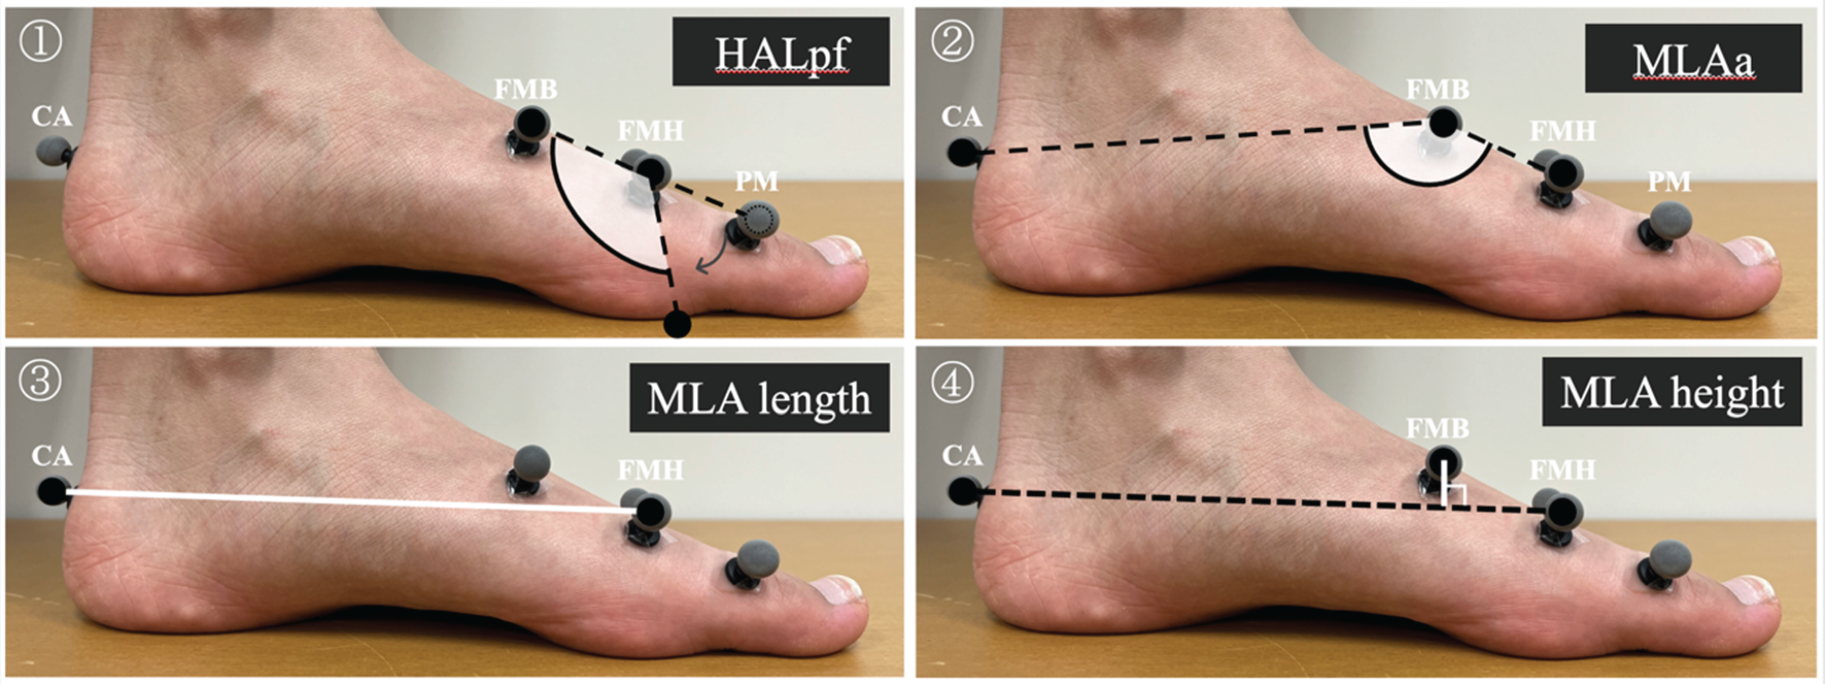
3D foot model schema for computing kinematic data in the sagittal plane. (Modified excerpt from references 14 and 24).18,19 HALpf indicates the angle of hallux flexion and MLAa indicates the medial longitudinal arch angle. HALpf was calculated based on the marker positions of FMB, FMH, and PM. MLAa is derived from the marker positions of CA, FMB, and FMH. As the MLAa value decreases, the arch ascends to greater heights.
Measurement data were processed using the VICON NEXUS2.3 (Oxford Metrics, UK) and the motion analysis software Visual 3D (C-motion, USA). A low-pass filter (Butterworth filter) was employed to remove noise from the measured position coordinate information of the reflective marker. The cutoff frequency was set to 6 Hz at the coordinate position of the marker. In this study, we modified the 3D foot model proposed in a previous study and calculated kinematic data (Figure 3). 22 Moreover, HALpf is determined using the position of the markers placed on the FMB, FMH, and PM. Additionally, the metric is calculated by determining the angle formed by the two vectors using the position vector from FMH to FMB (FMB-FMH) and from FMH to PM (PM-FMH). Note that the lower the value of HALpf, the more pronounced the curve. In this study, the toe flexion angle was defined as HALpf. Additionally, MLAa was determined using marker positions at the calcaneus (CA), FMB, and FMH. The angle was calculated by finding the angle between the two vectors formed by the position vector from FMB to CA (CA-FMB) and from FMB to FMH (FMH-FMB). Furthermore, since the marker was affixed to the proximal first metatarsal on the upper surface of the foot, minimal slippage was assumed to be present between the skin and bone. 23 Furthermore, the larger the MLAa value, the lower the arch, and the smaller the value, the higher the arch. In addition, the maximum value of MLAa change was calculated as the MLAa peak value during toe flexion. The MLAa and HALpf were calculated based on the angle of the foot with respect to the sagittal plane. The MLA length is the distance between the two points connecting the CA and FMH, and the MLA height is the distance of the perpendicular line drawn from the FMB to the line segment CA-FMH. 18 The higher the MLA height, the higher the arch. The ankle joint angle was calculated as the foot angle relative to the line perpendicular to the shank segment. The higher the value, the greater the ankle dorsiflexion. The MLA length, MLA height, COP, and hip joint center position were measured as positions in the global coordinate system of the laboratory. The COP and hip joint center position were used to assess the movement distance; the higher the value, the more backward the movement.
The analysis interval was identified from the marker position. The average value from the middle 3-s of the 5-s toe flexion period was used as the measured value for that trial. For each analysis item, the maximum measured value during the two conditions of toe flexion was calculated. Additionally, the change in value between the baseline static standing measurement and each measured value during toe flexion was determined. The maximum value of the change in the two trials was used as the representative value for statistical analysis. The change in each measured value was calculated by subtracting the value measured while standing still from the value measured during toe flexion. In addition, the change in HALpf was calculated by subtracting the value measured during flexion from the value measured in the static standing position. In addition, a static standing position was used to calculate the HALpf, MLAa, MLA height, MLA length, and ankle joint angle. A static standing position before toe flexion was used for the COP and hip joint center positions, and the differences were calculated.
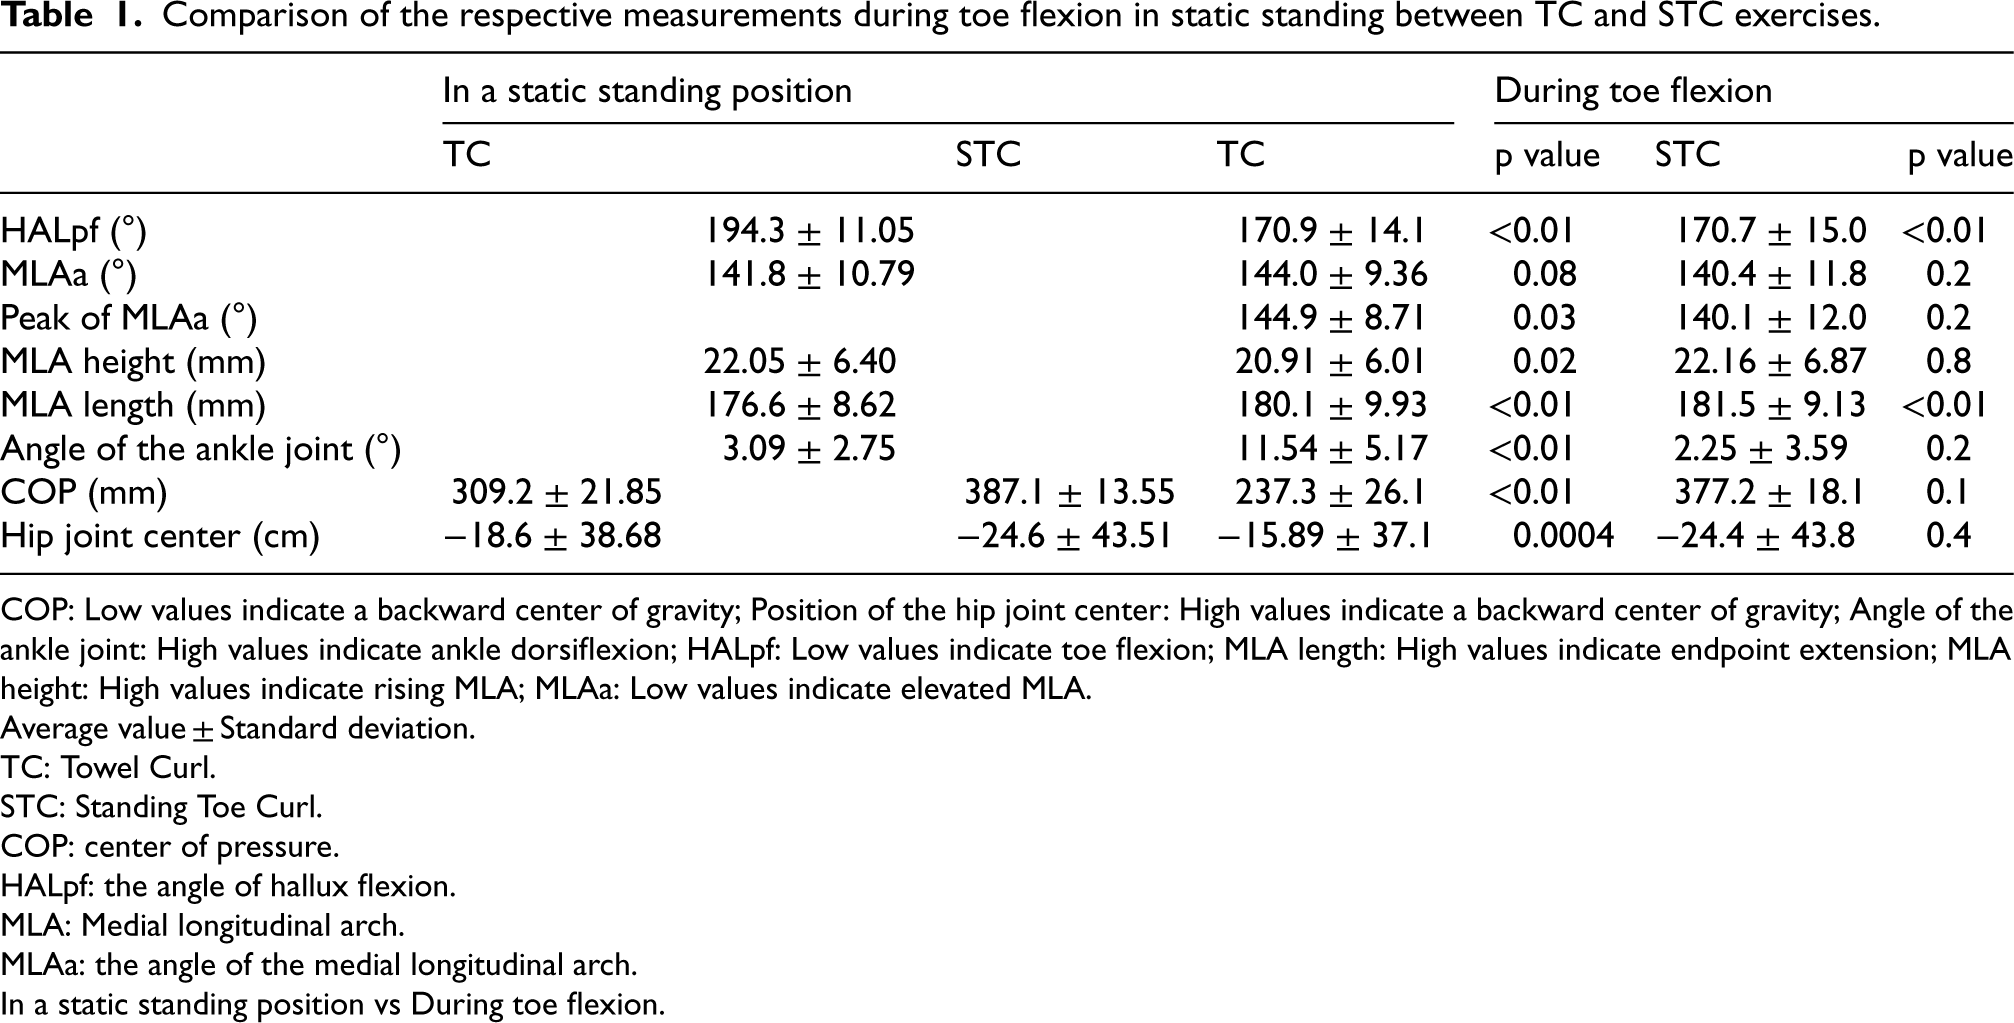
Comparison of the respective measurements during toe flexion in static standing between TC and STC exercises.
Comparison of the respective measurements during toe flexion in static standing between TC and STC exercises.
COP: Low values indicate a backward center of gravity; Position of the hip joint center: High values indicate a backward center of gravity; Angle of the ankle joint: High values indicate ankle dorsiflexion; HALpf: Low values indicate toe flexion; MLA length: High values indicate endpoint extension; MLA height: High values indicate rising MLA; MLAa: Low values indicate elevated MLA.
Average value ± Standard deviation.
TC: Towel Curl.
STC: Standing Toe Curl.
COP: center of pressure.
HALpf: the angle of hallux flexion.
MLA: Medial longitudinal arch.
MLAa: the angle of the medial longitudinal arch.
In a static standing position vs During toe flexion.
After confirming normality using the Shapiro–Wilk test, if the data followed a normal distribution in the comparison of HALpf during static standing and toe flexion under the two conditions, a paired t-test was performed to confirm the statistical significance of the differences. If this was not the case, the Wilcoxon signed-rank sum test was utilized. In addition, as MLA may increase momentarily during each toe flexion condition, a corresponding t-test or Wilcoxon signed rank sum test was performed to compare the MLAa during static standing and the MLAa peak value. This was done to identify any differences in change. Similarly, to compare the amount of change during toe flexion between the two conditions, we conducted a paired t-test or the Wilcoxon signed-rank sum test. Modified R Commander 4.2.1 was used for statistical analyses, and the significance level was set at 5%.
Results
Two of the 18 target limbs were excluded because the ground reaction force component was not sufficiently measured at the time of analysis; the ground reaction force component was significantly prominent and demonstrated abnormal Vicon values. The results were calculated for 16 limbs in the COP position.
Table 1 displays the comparison results of the measured values during toe flexion in TC versus static standing position, and in STC versus static standing position. In the TC, significant changes were observed in six of the seven measured items, excluding MLAa, compared to static standing measurements (p < 0.05). In the STC, significant changes were observed in HALpf and MLA lengths (p < 0.05). In addition, when we compared the MLAa peak value during toe flexion with the MLAa while standing still, the TC demonstrated a significantly lower arch (p = 0.03), while the STC displayed no statistically significant difference (p = 0.2).
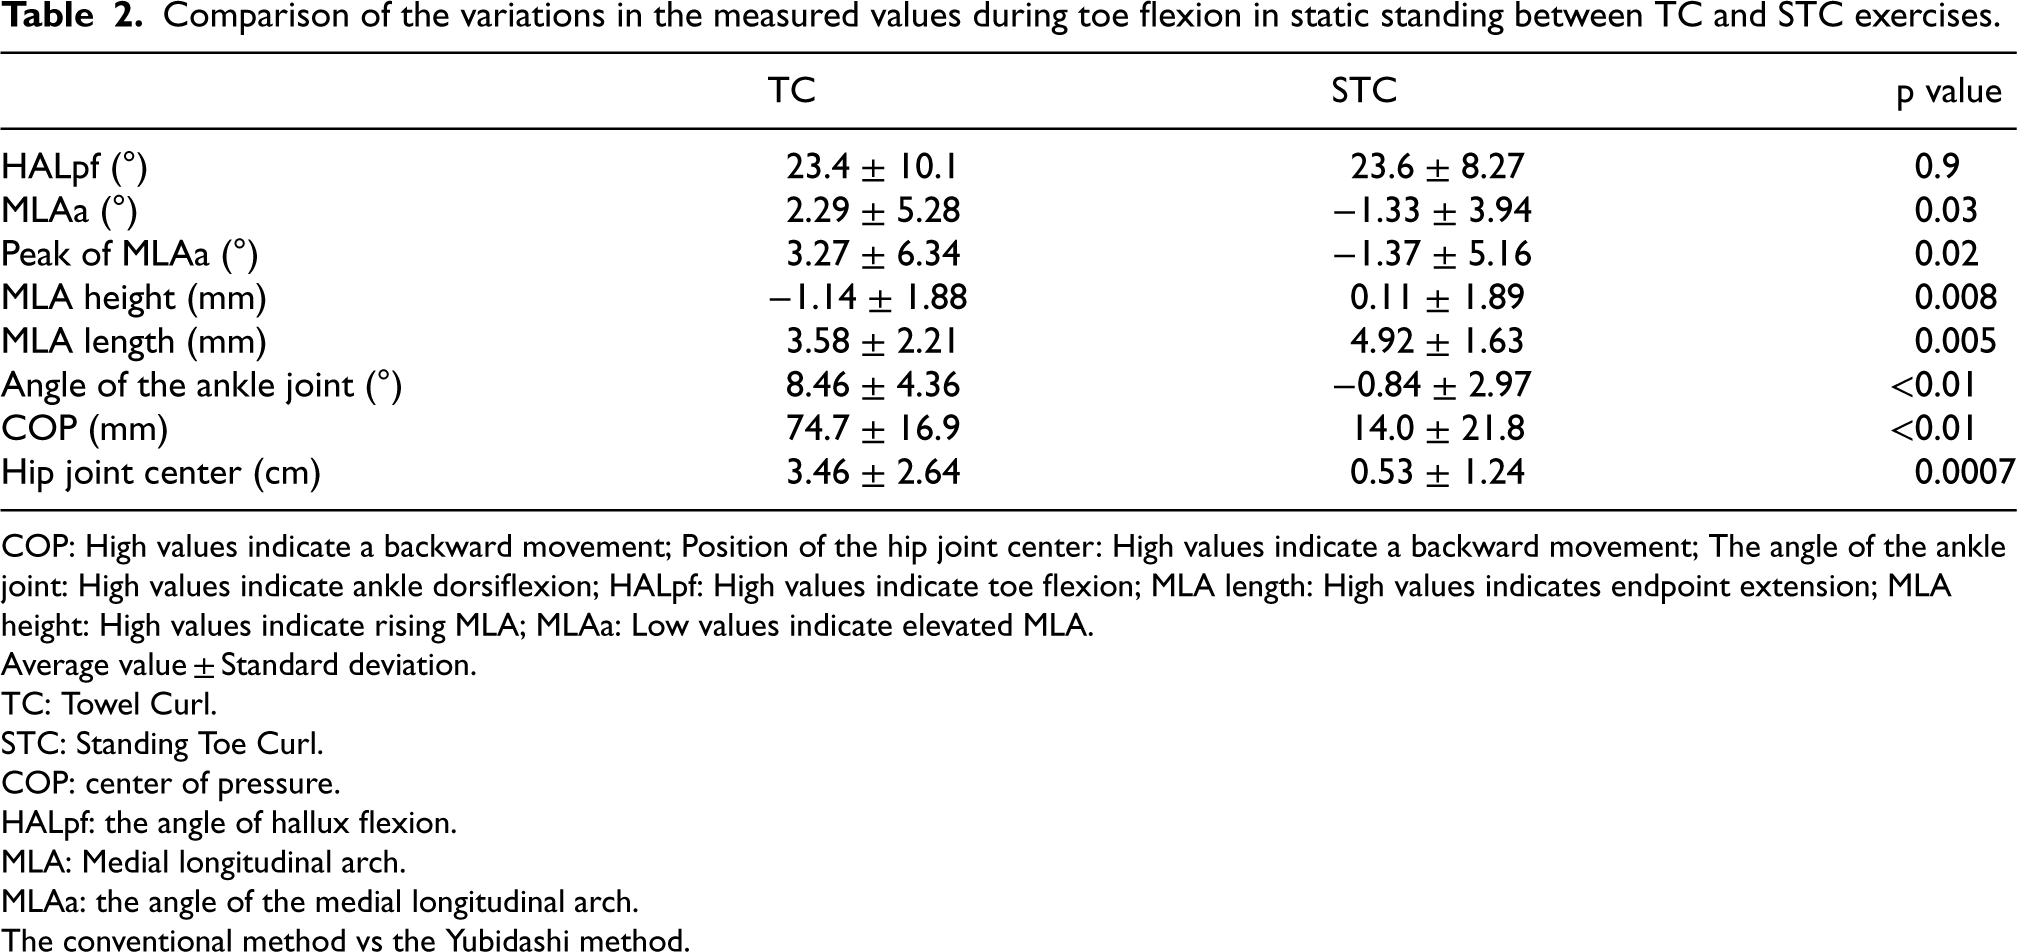
Table 2 compares the amount of change from the static standing position during toe flexion under the two conditions. No statistically significant difference was observed in the HALpf. However, MLAa demonstrated a significantly high value (low arch) in the TC group and a significantly low value (high arch) in the STC group. Similarly, MLA height exhibited a significantly low value (low arch) in the TC group and a significantly high value (high arch) in the STC group. As the MLAa changed, MLA length demonstrated a significantly high value (lengthening) in the STC group. The ankle joint angle was significantly greater in the TC group (dorsiflexion) than that in the STC group. In the TC group, both the COP and hip joint center positions demonstrated significantly high values (posterior movement).
Comparison of the variations in the measured values during toe flexion in static standing between TC and STC exercises.
Comparison of the variations in the measured values during toe flexion in static standing between TC and STC exercises.
COP: High values indicate a backward movement; Position of the hip joint center: High values indicate a backward movement; The angle of the ankle joint: High values indicate ankle dorsiflexion; HALpf: High values indicate toe flexion; MLA length: High values indicates endpoint extension; MLA height: High values indicate rising MLA; MLAa: Low values indicate elevated MLA.
Average value ± Standard deviation.
TC: Towel Curl.
STC: Standing Toe Curl.
COP: center of pressure.
HALpf: the angle of hallux flexion.
MLA: Medial longitudinal arch.
MLAa: the angle of the medial longitudinal arch.
The conventional method vs the Yubidashi method.
Temporal variations in MLAa and hallux flexion angle in the TC (a) and STC (b). A constant portion of the MLAa indicates that toe flexion is being held.
In addition, Figure 4 displays the temporal changes in the MLAa associated with toe flexion during one trial each of the TC and STC for one representative participant. In the TC, in 13 of 18 limbs, with toe flexion, MLAa exhibited a rapid increase followed by a rapid decrease, after which a consistent waveform was observed, suggesting a tendency to maintain MLAa. In contrast, in the STC, the MLAa decreased with toe flexion in six out of 18 limbs, and a constant waveform was observed when a small angle was maintained.
In this study, we compared the kinematic and kinetic data of the developed STC with data of the TC and examined the changes in the MLA associated with toe flexion. As a hypothesis, we predicted that TC would flex the toe with posterior loading, and STC would flex the toe with anterior loading compared to the TC. Although MLA increases under both conditions, we hypothesized that MLA would increase more under STC than under TC. The results of this study demonstrated that the TC became a posterior center of gravity with ankle dorsiflexion, as hypothesized; however, the MLA decreased, contrary to our hypothesis. Generally, toe flexion exercises strengthen the intrinsic flexor muscles of the foot involved in MLA support and are used for foot arch formation. 6 Therefore, we believed that the MLA would also increase in TC. However, a previous study reported that the MLA decreased during TC exercise, 20 and the present results support this observation. In contrast, in STC, as hypothesized, MLA increased when the toes were flexed under a loading situation that closely resembled a static standing position without ankle joint movement. We discuss these factors from the following five points: kinematic characteristics, center of gravity, load situation, and activity of the extensor and abductor hallucis muscles.
The decrease in the MLA in the TC was related to the activity of the extensor toe muscles. In this study, the MLAa was calculated based on three points on the line connecting the first metatarsal and the CA. If the distance that the FMH moves distally is longer than the distance that the FMB, which is the apex, moves distally, the endpoint defining the three-point angle will lengthen. This will cause the three-point angle to expand, resulting in a decrease in the MLA height. From the results of this study (Table 1), it can be interpreted that the MLA height decreased as the MLA length connecting FMH and CA, which is the bottom surface that defines MLAa, increased. Dorsiflexion of the ankle joint caused by flexion of the toes may have contributed to the activity of the extensor digitorum longus and extensor hallucis longus muscles, which dorsiflex the ankle joint, resulting in elevation of the distal metatarsal bones to the dorsal foot. Additionally, when the COP is shifted to the hindfoot and the center of gravity line passes behind the ankle joint, it is presumed that the ankle joint will have an increased internal dorsiflexion moment to prevent the body from falling backward, which will also result in a complementary increase in extensor hallucis longus activity. Previous studies demonstrated that the activity of the extensor digitorum longus muscle increases significantly under posteromedial loading. 24 Therefore, we believe that activation of the extensor toe muscles, which are a group of ankle dorsiflexor muscles led to a greater elevation of the FMH compared to that of the FMB. This resulted in a decrease in the MLA.
Focusing on the amount of change in the COP of the TC (Table 2), the COP moved approximately 7 cm backward, which corresponded to approximately 30% of the total movement relative to the foot length. Given that the center of gravity in a resting standing posture typically passes 5–6 cm in front of the lateral malleolus, it is likely that during the TC exercise, the center of gravity shifts to a position behind the lateral malleolus. In other words, it can be interpreted as the toes flexing, resulting in the dorsiflexion of the ankle, and the center of gravity shifting posteriorly. This shift is likely attributed to the influence of postural control in the standing position, a characteristic of exercise, and the need to shift the center of gravity backward to create a space that allows forefoot flexion, resulting in ankle dorsiflexion. In addition, focusing on the kinematic structure of the ankle joint, when dorsiflexing from an intermediate position, the ankle joint becomes wedged, improving stability and exerting a strong toe-gripping force.25,26 Therefore, the occurrence of ankle dorsiflexion not only allows the toes to flex, but attempting to flex the toes with greater force may also impact the movement and the associated shift in the center of gravity. The ankle is forced to dorsiflex and the forefoot is lifted, resulting in backward movement of the COP. We believe this is the mechanism by which the center of gravity shifts backward in the TC.
The MLA in the STC increased during toe flexion compared to that in the TC (Table 2). This may be due to the contraction of the abductor hallucis muscle associated with toe flexion. The MLA decreases under a load.27,28 In the windlass mechanism, which is a foot function, it has been confirmed that the plantar aponeurosis is stretched as the toes are extended and MLA increases. 29 Therefore, toe flexion may cause the plantar aponeurosis to relax, resulting in a decrease in the MLA. However, previous muscle activity analyzes of STC have shown that the muscle activity of the abductor hallucis muscle increases during toe flexion, 8 and MLA increased in this study. These results support the findings of previous studies demonstrating the abductor hallucis muscle's role in maintaining the MLA.4,9,20 These results suggest that increased muscle activity of the abductor hallucis muscle may contribute to the decrease in MLAa. This implies that while the contraction of the abductor hallucis muscle during toe flexion may not support the MLA to the extent that it lifts body weight, it does help maintain the MLA height equivalent to the state where the plantar aponeurosis is not relaxed. In addition, a previous study demonstrated a 1.8 mm decrease in navicular depression after a 4-week intervention of short foot exercises for 3 min per day to strengthen MLA structures. An average decrease of 1.5 mm in navicular depression was observed immediately after 10 repetitions of 5-s of toe abduction followed by 1 s of rest in a sitting position.10,30 The increase in the MLA observed during toe flexion in the STC is similar to the decrease in navicular descent, as compared to the findings of the previous studies. Therefore, toe flexion exercises using the STC may be effective in maintaining the MLA for weight bearing.
On the other hand, although TC did not display an increase in MLA during toe flexion, however, temporary instances of MLA increase were observed (Figure 4). This phenomenon is believed to be caused by the movement of the toe extension that occurs immediately before toe flexion rather than during toe flexion. The windlass mechanism is a widely known process in which the MLA is elevated through toe extension. This mechanism demonstrates how the MLA height increases simply by dorsiflexion of the first ray of the foot. 29 Therefore, the TC may promote an increase in the MLA through the windlass mechanism of toe extension that occurs before and after toe flexion. Therefore, by repeating movements that moderately elevate the MLA through the windlass mechanism, repeated stimulation of the toe flexor muscles may effectively increase the MLA, albeit slightly.
The study has some limitations. First, errors may have occurred because of misalignment between the skin and bone of the marker used to calculate the MLAa. Although the marker was applied after palpation of the landmarks, a possibility exists that the landmarks defining the MLAa associated with toe flexion were not accurately followed. This could be due to the errors in the application position and slippage between the skin and bone caused by stretching of the skin with toe flexion. Second, the hardness of the plantar aponeurosis, which is believed to be involved in the MLA support, was not evaluated. The plantar aponeurosis and flexor digitorum brevis are tightly attached to the bottom of the foot. 31 In addition, given the foot function of the windlass mechanism, 29 it can be inferred that toe movement is related to plantar aponeurosis and MLA. Therefore, evaluating the MLA and some toe flexor muscles of the foot alone may not provide a comprehensive assessment of the detailed exercise effect. Third, as this was a cross-sectional study, the observed changes may have been temporary.
Future studies are needed to elucidate the muscle activities of other extrinsic flexor muscles of the foot during TC and STC, as well as the muscle stiffness of the intrinsic and extrinsic flexor muscles of the foot when stiffness is increased by MLA elevation associated with toe flexion. Furthermore, we believe that conducting research that compares and verifies the effects on MLA height, foot-toe flexor muscles, and performance before and after the intervention is necessary.
Conclusion
We compared the kinematic and kinetic characteristics of the toe flexion exercises under the aforementioned two conditions. During toe flexion in the TC, the MLA decreased with posterior loading and ankle dorsiflexion. On the other hand, similar to TC, STC can increase the MLA through the toe extension phenomenon that occurs with toe flexion, Additionally, the STC exercise can continuously support the MLA even during toe flexion, thereby further elevating the arch. In addition, considering that the load position is closer to the movement scene, we believe that STC is more effective than TC as a toe flexion exercise for the MLA.
Footnotes
Acknowledgments
The authors have no acknowledgments.
Author contributions
CONCEPTION: Yasuyuki Umezaki, Hiroshi Shinohara.
PERFORMANCE OF WORK: Yasuyuki Umezaki, Daichi Kawamura, Riku Sugawara.
INTERPRETATION OR ANALYSIS OF DATA: Yasuyuki Umezaki, Daichi Kawamura, Riku Sugawara, Toshihiro Haba, Hiroshi Shinohara.
PREPARATION OF THE MANUSCRIPT: Yasuyuki Umezaki, Daichi Kawamura, Hiroshi Shinohara.
REVISION FOR IMPORTANT INTELLECTUAL CONTENT: Yasuyuki Umezaki, Toshihiro Haba, Hiroshi Shinohara.
SUPERVISION: Hiroshi Shinohara.
Declaration of conflicting interests
The authors declared no potential conflicts of interest with respect to the research, authorship, and/or publication of this article.
Funding
The authors received no financial support for the research, authorship, and/or publication of this article.
Ethical considerations
This study was approved by the Ethics Review Committee of Aomori University of Health Sciences (approval number: 22013, dated June 21, 2022). The participants received a thorough verbal and written explanation in advance, and their consent was obtained before the study began.