
Abstract
Background
There is limited knowledge about the relationships between concentric and eccentric lower-limb strength and sprint, change-of-direction (CoD), and forward or lateral jump performance in elite youth soccer players.
Objective
This study investigated the associations between knee strength and sprinting, CoD, and single-leg jump performance in youth soccer players (mean age = 16 years; n = 41).
Methods
Maximal isokinetic knee extension and flexion strength (60°/s and 180°/s) and Nordic hamstring strength were assessed and correlated with single-leg forward hop and side-bounce distance, 10 m and 30 m sprint times, and 90° and 180° CoD test times.
Results
Pearson correlations revealed task- and leg-specific relationships. Stronger knee extensors at 60°/s were associated with faster 90° CoD performance, whereas stronger knee flexors and higher flexion-to-extension ratios at 180°/s were linked to faster 10 m and 30 m sprints. When the right leg acted as the inside turning leg, greater knee flexor strength (180°/s) was related to slower 180° CoD performance but faster 10 m and 30 m sprint times. When the right leg acted as the outside leg: (i) higher flexion-to-extension ratios (60°/s) corresponded to slower 90° CoD performance; (ii) stronger knee flexors (180°/s) with slower 180° CoD; and (iii) higher strength ratios at 180°/s with slower 90° and 180° CoD performance. No significant associations were found for the left leg or single-leg jump tests.
Conclusions
These findings highlight the movement- and limb-specific nature of lower-limb strength contributions in youth soccer players. Overall, hamstring strength supported sprint performance, whereas quadriceps strength underpinned CoD ability.
Introduction
Increased muscle strength is associated with improved force-time characteristics (e.g., rate of force development and external mechanical power), general athletic performance (e.g., jumping, sprinting and change of direction) and specific athletic performance, but also with improved potentiation effects and lower injury rates. 1 Sports scientists and practitioners can monitor an individual's strength capabilities with isometric, dynamic and reactive strength tests and variables.
Singh et al. 2 identified several key biomechanical variables that were important determinants of CoD performance, such as shorter ground contact time, higher approach and exit velocities, increased braking and propulsive forces, greater trunk inclination angle, lower centre-of-mass height, and higher strength and power at the hip, knee and ankle. Muscle strength and consequently joint reaction forces present an underpinning factor to achieve desired technical execution for CoD, sprinting or jumping performance. Isokinetic dynamometers are considered the gold standard for strength assessment, 3 and concentric quadriceps strength has been identified as an important predictor of both jumping and sprint performance in top-level soccer players. 4 Greater eccentric isokinetic knee extensor and flexor strength was found to be associated with faster 180° turn CoD performance in female soccer players, as stronger players are better able to decelerate during penultimate contact from faster approach velocities. 5 One of the frequently used test to assess hamstring eccentric strength is also Nordic hamstring exercise, 6 which can be done in field- based settings and was shown as one of the predictors of sprint and CoD performance in male academy soccer players. 6 Therefore, assessment of lower limb concentric and eccentric strength among youth soccer players1,2,7,8 is of importance in practice to mitigate training protocols to improve performance. 9
The transition from junior to senior levels represents a critical period in a youth soccer player's career, during which only a small fraction of players successfully adapt to the increased physical, technical, and psychosocial demands of senior football. This transition often results in high rates of dropout among players who are unable to meet these demands. 3 Research indicates that physical performance such as speed, agility, and explosive strength play a key role in selection and progression in adolescent soccer, with selection processes tending to favor players whose physical performance improves relative to their peers as they age. 10 Adolescent soccer players are also exposed to high physical demands and an elevated risk of injury due to rapid growth, increased training loads, and the repetitive high-intensity actions required by the sport. Identifying the underpinning factors of success (such as strength) in game-specific physical activities, such as sprinting, jumping, and changing-of-direction, 11 is therefore crucial, as these capacities are not only key performance indicators in match play but also important discriminators between players who progress and those who drop out during this transitional phase.
To the authors’ knowledge, there is a lack of studies that have comprehensively evaluated the relationships between concentric and eccentric lower-limb strength and sprint, CoD, and horizontal or lateral jump performance in elite youth soccer players. Therefore, the aim of the present study was to investigate the associations between quadriceps and hamstring strength and measures of sprinting, CoD and single-leg jump performance in youth (adolescent) soccer players. Based on the results of previous studies among elite senior soccer players and woman soccer players,4–6 we hypothesized that greater quadriceps strength would be associated with superior single-leg jump and CoD performance, as the quadriceps are critical for producing propulsive forces during jumps and controlling deceleration during directional changes. In contrast, greater hamstring strength was expected to relate to faster sprinting performance, reflecting the hamstrings’ role in hip extension and knee stabilization during high-speed running.
Methods
Study design
A cross-sectional study design was used to investigate associations between strength (isokinetic knee extension and flexion peak torque at 60°/s and 180°/s and Nordic hamstring peak torque), and field performance variables (single-leg forward hop and side-bounce distance; linear sprint 10 m, 30 m split times and 90° and 180° CoD test times). Participants attended two testing sessions of approximately 45 min each, separated by three days. One session included strength testing and the other field performance testing; the order of the sessions was randomized. Tests within each session were also conducted in a randomized order to minimize learning effects and fatigue-related bias. The study was approved by the Ethics Committee of the Faculty of Sport, University of Ljubljana (No. 34-2022) and adhered to the principles of Oviedo Convention and the Declaration of Helsinki.
Subjects
A total of forty-one youth soccer players participated in the study. Their mean age was 16.10 ± 1.04 years, with an average body height of 1.81 ± 0.07 m and body mass of 70.5 ± 8.1 kg. The mean lower leg length was 0.41 ± 0.04 m, and their average soccer training experience was 9.3 ± 2.0 years. Exclusion criteria were established to ensure participant safety and consistency in performance testing. Individuals with a history of knee injuries (such as ligament tears, meniscus damage, or cartilage deterioration) were excluded due to potential impacts on knee stability and function. Those with a history of lower back pain were also excluded to prevent the exacerbation of existing conditions and to ensure correct execution of test procedures. Finally, individuals who had sustained acute injuries within the previous six months that could affect maximal performance were not included. Sample size was determined a priori using GPower software (GPower 3.1, Faul et al., Universität Kiel, Germany), based on a previous study 12 that analyzed correlations between isokinetic knee extensor strength at different testing velocities (60, 180, and 300°/s), agility T-test performance, and 30 m sprint split times. That study reported statistically significant, moderate correlations between quadriceps strength at 60°/s and agility T-test performance (r = 0.557, p < 0.05). For our design, the required sample size was calculated with β = 0.20 and α = 0.05, yielding a minimum of 23 participants. To be conservative given the larger number of conditions in our study, we doubled the sample size (n = 46). Five participants were excluded from the final analysis because they did not complete all tests. All participants and their parents were informed about the testing procedures and they both provided written informed consent before participation. Participants were instructed to avoid strenuous exercise for at least two days prior to the testing session and to wear soccer shoes for the field tests.
Testing procedures
Before each testing session, participants completed a standardized warm-up protocol consisting of ten minutes of light running, followed by five minutes of dynamic stretching (10 slow repetitions through the maximal active range of motion for the leg and hip muscle groups) and five minutes of dynamic strength exercises (heel raises, lunges, and jumps, each performed for 10 slow repetitions). The warm-up was supervised by a qualified member of the research team. Prior to each test, participants performed one submaximal and one maximal familiarization repetition, followed by three minutes of rest. To ensure maximal effort for the particular testing procedure, participants were given at least five minutes of rest between different tests, and 30 s to 3 min between repetitions of the same test, as outlined for each specific test below.
Linear sprint performance was assessed over a 30 m distance on a soccer pitch with artificial grass, which was completely dry on the testing days. Each trial began from a standing start, with the front foot positioned 0.3 m behind the starting line. Participants initiated the sprint at their own discretion, running in a straight line. Split times at 10 and 30 m were recorded using an electronic timing system (Witty Timing System, Microgate, Bolzano), with sensors positioned at hip height. Each participant completed two trials with three minutes of rest in-between, and the 10 m and 30 m split times corresponding to the fastest 30 m time were used for further analysis.
Change-of-direction tests were conducted on a soccer pitch with artificial grass, which was completely dry on the testing days. Two tests were performed: a 90-degree (90° CoD) turn and a 180-degree (180° CoD) turn. Performance was measured using photocell timing gates (Brower Timing Systems, Draper, UT, USA), placed at hip height. Participants completed two maximal CoD repetitions per side (left and right, randomized order) for each task (90° and 180°). The rest interval between repetitions was one minute, with a three-minute break between tasks. In total, eight trials were performed. For all tests, participants placed one foot on the starting line and initiated the sprint at their own discretion. In the 90° CoD test, participants sprinted 15 m from the starting position to a cone, executed a 90° turn to one side, and then sprinted through the finish line (Figure 1, upper part; two timing gates). Timing gates were first triggered once participants reached 10 m at full speed. In the 180° CoD test, participants sprinted to a marked turning point and returned to the starting gate (Figure 1, lower part; one timing gate). Timing gates were again triggered at the 10 m mark. The turning maneuver in both tests was standardized, requiring participants to change direction using the outer leg. For both tests, the total running distance was 20 m. Performance was expressed as the split time from the initial gate trigger to the final gate trigger, corresponding to the last 10 m of the run, when participants executed the change of direction. The fastest split time was retained for analysis.
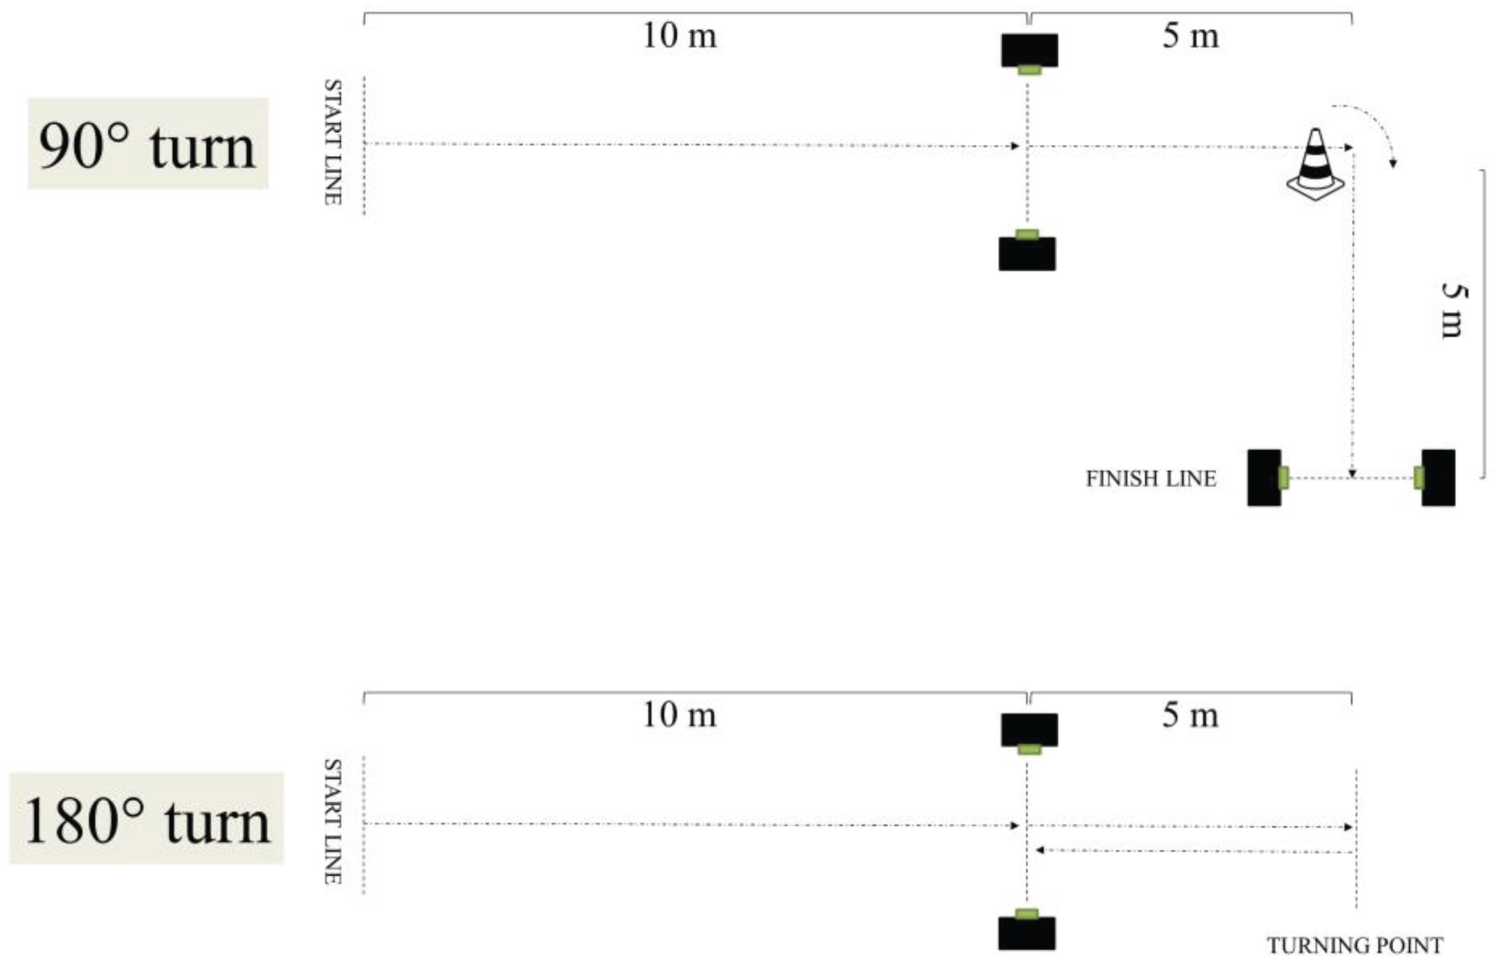
Change of direction testing setup.
Nordic hamstring strength test was conducted using a custom-made frame-stabilized dynamometer system device following the same procedures and using the same equipment as described in previous studies.13,14 Each participant performed three eccentric-only repetitions separated by 30 s of passive recovery. Participants were in a kneeling position on a soft pad, shoulders width apart. Hands were placed behind the back to avoid any artifacts in the signal due to excessive movement of the upper extremities. Ankle position was standardized in a neutral position (90° angle). Each ankle was placed below the load cell sensor pressure pad just above the lateral malleolus. Before the test execution lower leg (shrank) lever arm was measured from lateral femoral condyle to the middle of the load cell pressure pad (distance in meters). When performing a test, participants were instructed to keep the trunk, hips and pelvis tilt in a neutral position and then progressively lean forward at the slowest possible speed as deep as possible while resisting the movement with hamstrings only. The investigators gave verbal encouragement throughout the range of motion to ensure maximal effort. There was no minimum range of motion that participants were required to achieve. Ending position was secured with a soft foam pad placed under the trunk. The height of a soft foam pad at the final position was individually adjusted during a warm-up procedure to avoid touching the pad before reaching the break-point angle (the maximum knee angle when the subject cannot longer support its weight against the gravity). The technical performance of all repetitions was monitored visually by the investigator, and a test was repeated if the participant displayed excessive pelvic tilt movement, increased hip-joint flexion angle during the descent or did not control the descent from the beginning of the movement. 15
Signals from frame-stabilized dynamometer system device were obtained from two load-cell sensors (S-Type 200 kg Steel Weighting Sensor, Changsha TAIHE Electronic Equipment Co., China) mounted horizontally on the firm frame. The sensor assembly provided vertical force-time data concurrently for left and right leg. Raw analog signals were converted using A/D converter (Loadcell sensor 24-bit ADC - HX711, Circuit Systems, India), monitored using Arduino-Uno (ATmega328P, Robot Italy, Italy) microcontroller and, finally, analyzed using custom-developed software (github.com/robert-cv/HipStrengthTesterGUI, Črnomelj, Slovenia). The highest peak force was recorded. The peak force values were multiplied by the shank lever arm and normalized by participants’ body mass to obtain normalized peak torques (Nm/kg) for each of the three repetitions. The highest peak torque values (Nm/kg) for left and right legs were included in further analysis.
Isokinetic strength testing was performed on a Biodex isokinetic dynamometer (Biodex 4, Medical System, NY, USA) with the Advantage BX software. The test was performed with the participants in the sitting position (90° hip flexion), strapped with belts across the chest, pelvis and test leg thigh to minimize body movement and compensations of other muscles. The dynamometer axis of rotation was aligned with the knee's joint axis of rotations using lateral epicondyle as an anatomic mark. 16 The alignment was done in the resting position and then corrected during the warm-up to account for displacements of the knee-joint axis during the test execution. Standard leg attachment was used. The fulcrum was placed approximately 2 cm above the lateral malleoli. The range of motion was 60˚ (from 90˚ to 30˚ of knee flexion with full knee extension being 0˚). 17 The testing procedure consisted of five consecutive unilateral concentric-only knee extension and flexion repetitions at two velocities (60°/s and 180°/s), followed by five eccentric-only knee flexion repetitions. Assessing torque generation at the higher velocity (180°/s) was considered a more relevant metric for evaluating physical performance 3 (e.g., jumping and running) and may be particularly important in soccer, where sprinting and change-of-direction movements occur at high muscle contraction speeds, potentially reflecting performance in the field-based tests conducted in this study. A 2-min break was provided between each velocity. Participants were verbally encouraged by the investigator to perform the movement test as hard as possible. Visual feedback was provided throughout the test on the dynamometer monitor. Before each test, the participant's leg was weighted for gravitational error torque (GET) which was accounted in the final result. The peak torque of the isokinetic phase (starting and ending with the angular velocity of the dynamometer at pre-selected velocity) 16 during the eccentric knee flexion was evaluated for each repetition. The results were normalized to the subject's body mass (Nm/kg). The best repetition peak torque values (Nm/kg) for left and right legs were included in the further analysis for each of the testing velocities (60 and 180°/s) and movement (knee extension and flexion). Furthermore, a) concentric flexion/extension at 60°/s, b) concentric Flexion/Extension at 180°/s and c) eccentric flexion/concentric extension at 60°/s strength ratios were calculated from the best repetitions.
The single-leg forward hop began with participants standing upright on one leg, with the tip of the shoe positioned just behind the jump-start line, marked with adhesive tape on the artificial grass. The non-tested leg was kept slightly flexed at the knee and was not permitted to touch the tested leg. Before performing the hop, participants were instructed to execute a rapid countermovement immediately followed by an explosive take-off. They were required to jump as far as possible, land on the same leg, and maintain the landing position for two seconds. Swinging of the non-tested leg was prohibited, and hands were crossed behind the back to prevent arm swing. Jump distance (in meters) was measured by two researchers using a steel measuring tape, positioned perpendicular to the jump-start line, from the line to the first point of heel contact during landing. The longest jump distance was included in the further analysis.
The single-leg side-bounce test began with participants standing upright on one leg, with the medial edge of the shoe positioned just behind the jump-start line, marked with adhesive tape on the artificial grass. The non-tested leg was kept slightly flexed at the knee and was not permitted to touch the tested leg. Before performing the hop, participants were instructed to execute a rapid countermovement immediately followed by an explosive take-off. They were required to jump as far as possible, land on the opposite leg, and maintain the landing position for two seconds. Hands were crossed behind the back to prevent arm swing. Jump distance (in meters) was measured by two researchers using a steel measuring tape, positioned perpendicular to the jump-start line, from the line to the first point of contact of the medial side of the shoe during landing. The longest jump distance was included in the further analysis.
Statistical analyses were performed using SPSS (version 25.0, SPSS Inc., Chicago, IL, USA). Descriptive statistics are reported as mean ± standard deviation. The normality of the data distribution was assessed using the Shapiro-Wilk test. Results from left and right leg strength, CoD, single-leg forward hop, and side-bounce performance were compared using paired-sample t-tests. Additionally, results were averaged across both legs for strength and performance variables to provide insight into general strength–performance relationships. The strength of linear relationships between quadriceps and hamstring strength and sprinting, CoD, and single-leg forward hop and side-bounce performance was assessed using Pearson's correlation coefficient (r). Correlations were analyzed for: (i) average leg strength and average performance test results, (ii) left leg strength and left-turn CoD performance (left served as an inside leg), (iii) right leg strength and right-turn CoD performance (right leg served as an inside leg), (iv) left leg strength and right-turn CoD performance (left leg served as an outside leg), and (v) right leg strength and left-turn C0D performance (right leg served as an outside leg). The results were interpreted according to Akoglu 18 with the following criteria: 0 indicating no correlation, 0.1–0.29 as small, 0.3–0.49 as moderate, 0.5–0.69 as large, 0.7–0.89 as very large, and 0.9–1 as a perfect correlation. For all analyses, the threshold for statistical significance was set at p < 0.05.
Results
Table 1 shows descriptive statistics of the isokinetic strength and jumping, sprinting and CoD results for left and right legs as well as for average between the two. Paired-samples t-tests revealed differences between sides for flexion and extension strength at 60°/s and 180°/s (t = 2.10–2.71; p = 0.12–0.44) and for CoD at 90° and 180° (t = 2.18–2.59; p = 0.01–0.02), whereas no significant differences were found for single-leg forward hop or side-bounce performance (t = 0.63–0.91; p = 0.18–0.27).
Descriptive statistics of the isokinetic strength, jumping, sprinting and change of direction performance variables.
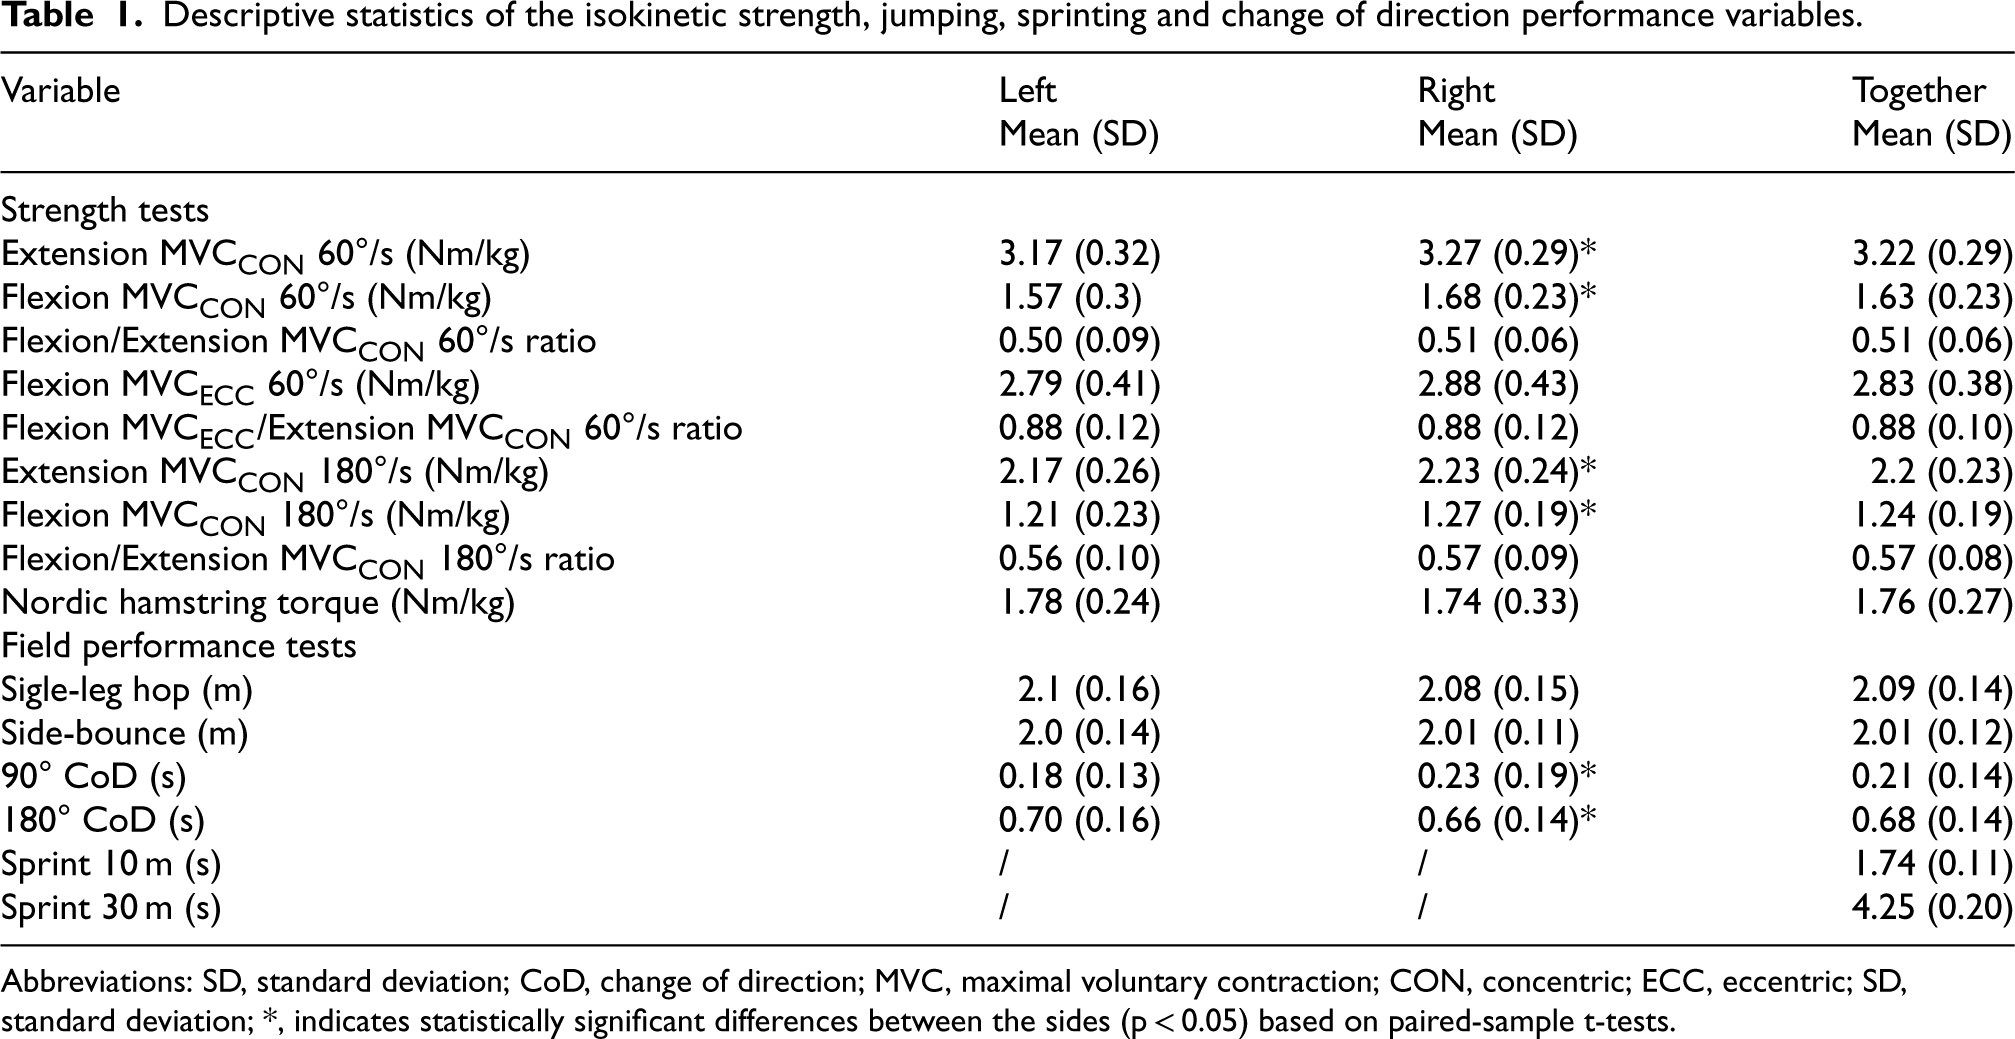
Descriptive statistics of the isokinetic strength, jumping, sprinting and change of direction performance variables.
Abbreviations: SD, standard deviation; CoD, change of direction; MVC, maximal voluntary contraction; CON, concentric; ECC, eccentric; SD, standard deviation; *, indicates statistically significant differences between the sides (p < 0.05) based on paired-sample t-tests.
Table 2 presents the Pearson correlation coefficients between strength (rows) and jumping, CoD, and sprinting performances (columns) for the average values of both legs. A statistically significant moderate negative correlation was found between knee extension strength and 90° CoD performance (r = −0.306, p < 0.05). Knee flexion strength at 180°/s (r = −0.368, p < 0.05) and the flexion/extension ratio at 180°/s (r = −0.318, p < 0.05) were moderately negatively correlated with 10 m sprint split time. Knee flexion strength was also moderately negatively correlated with 30 m sprint performance (r = −0.341, p < 0.05).
Pearson correlation coefficients with 95% confidence intervals of the relationship between strength and jump, change-of-direction, and sprint variables for average values of both legs.
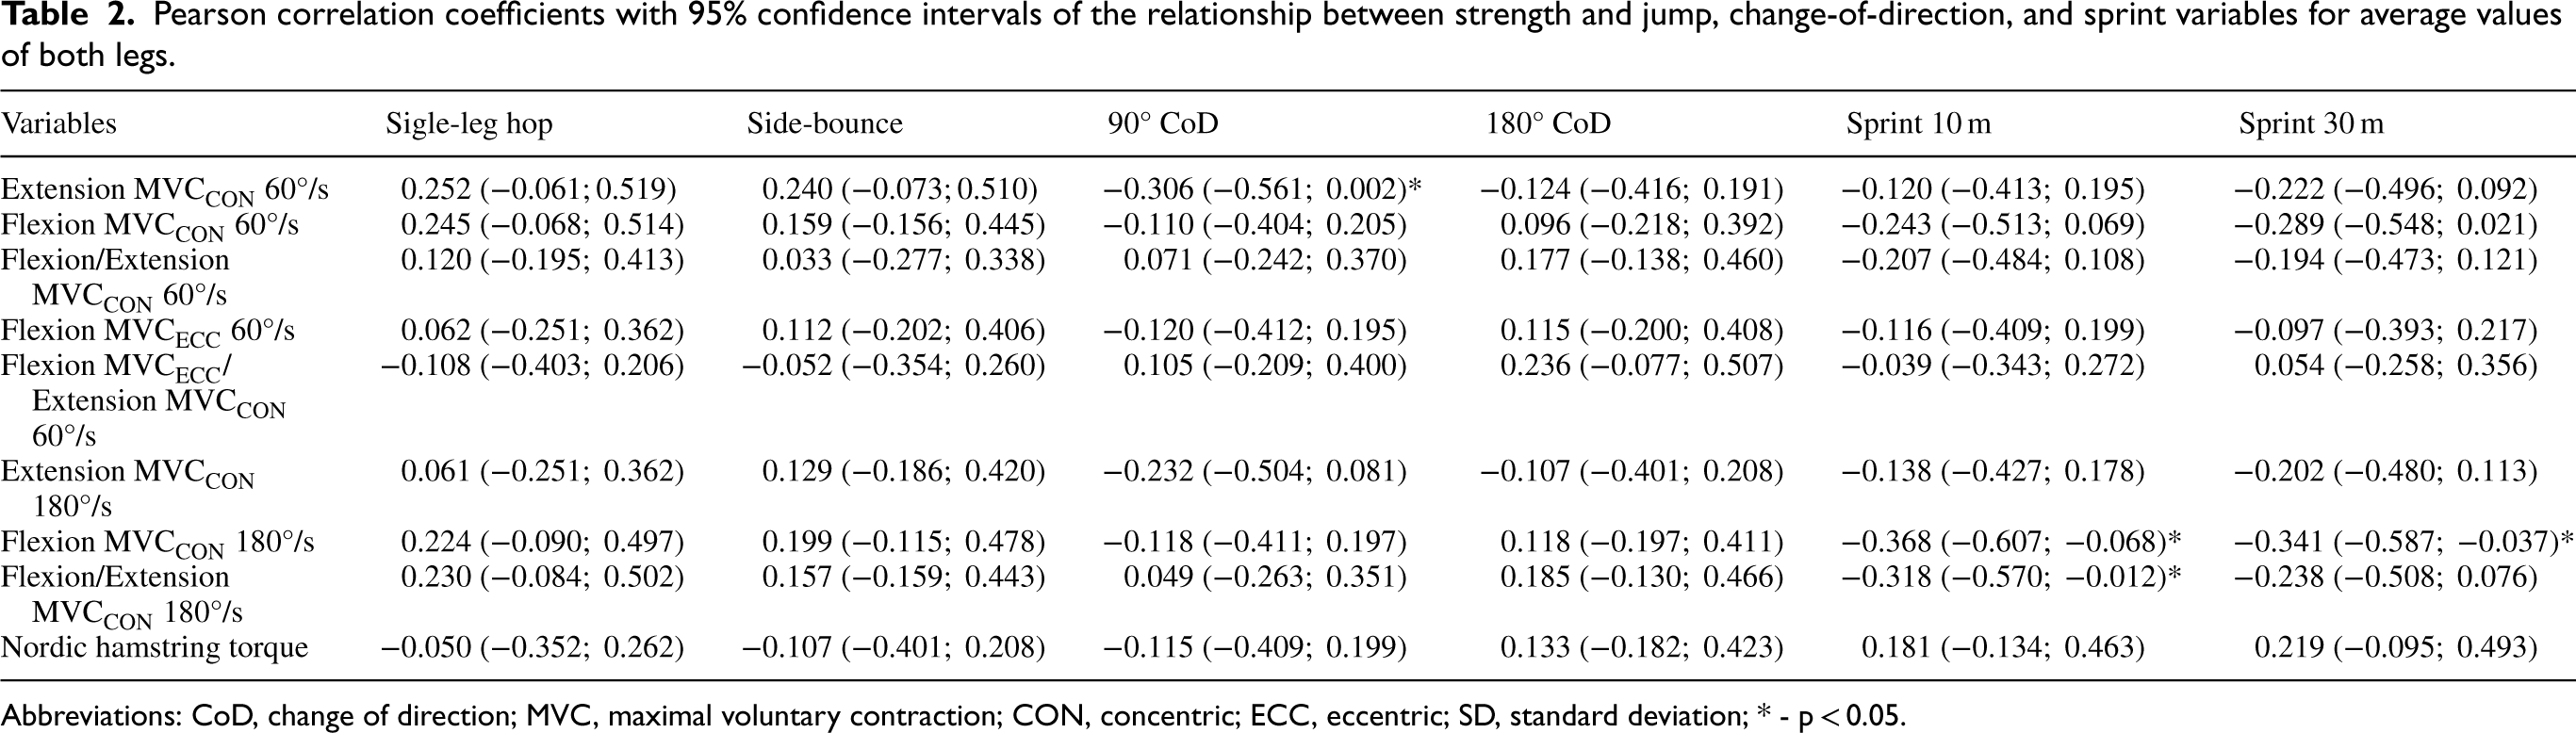
Abbreviations: CoD, change of direction; MVC, maximal voluntary contraction; CON, concentric; ECC, eccentric; SD, standard deviation; * - p < 0.05.
Table 3 presents the Pearson correlation coefficients between right-leg strength variables (rows) and jumping, CoD, and sprinting performances (columns). During CoD testing, the right leg served as the inside leg. Statistically significant correlations were observed between knee flexion strength at 180°/s and CoD 180° performance (r = 0.348, moderate, p < 0.05), as well as negative correlations with 10 m split time (r = −0.414, moderate, p < 0.05) and 30 m split time (r = −0.375, moderate, p < 0.05). Supplementary Material Table S1 presents the Pearson correlation coefficients between left-leg strength variables (rows) and jumping, CoD, and sprinting performances (columns). During CoD testing, the left leg served as the inside leg. No statistically significant correlations were observed (all p > 0.05, |r| < 0.287).
Pearson correlation coefficients with 95% confidence intervals of the relationship between strength and jump, change-of-direction, and sprint variables for the right leg.
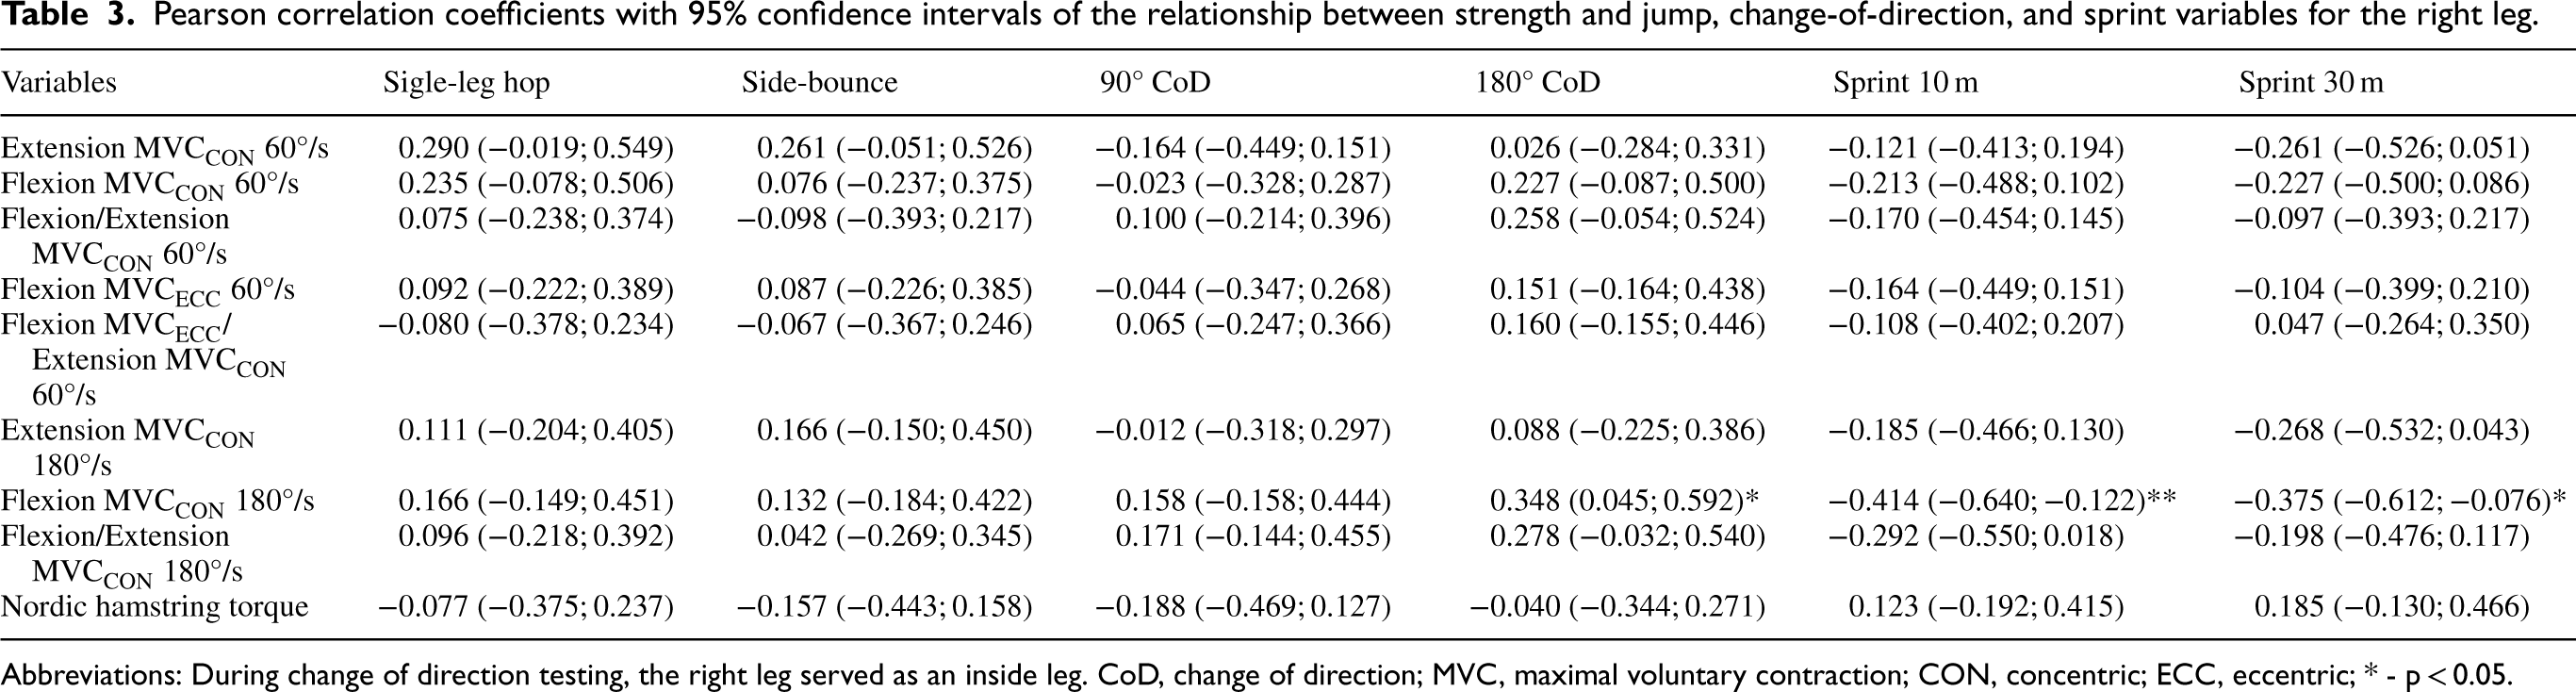
Abbreviations: During change of direction testing, the right leg served as an inside leg. CoD, change of direction; MVC, maximal voluntary contraction; CON, concentric; ECC, eccentric; * - p < 0.05.
Table 4 shows the Pearson correlation coefficients between strength for the right leg (rows) and left-turn CoD performance (columns). During CoD testing, the right leg served as the outside leg. The analysis revealed statistically significant correlations between the flexion-to-extension strength ratio at 60°/s and 90° CoD performance (r = 0.325, p < 0.05, moderate). Knee flexion strength at 180°/s was moderately correlated with 180° CoD performance (r = 0.387, p < 0.05). Additionally, the flexion-to-extension ratio at 180°/s was positively correlated with 90° CoD (r = 0.358) and 180° CoD (r = 0.340) performance. Supplementary Material Table S2 shows the Pearson correlation coefficients between strength for the left leg (rows) and right-turn CoD performance (columns). During change-of-direction testing, the left leg served as the outside leg. The analysis revealed no statistically significant correlations (all p > 0.05, |r| < 0.238).
Pearson correlation coefficients with 95% confidence intervals of the relationship between strength and change-of-direction variables for the right leg as an outside leg.
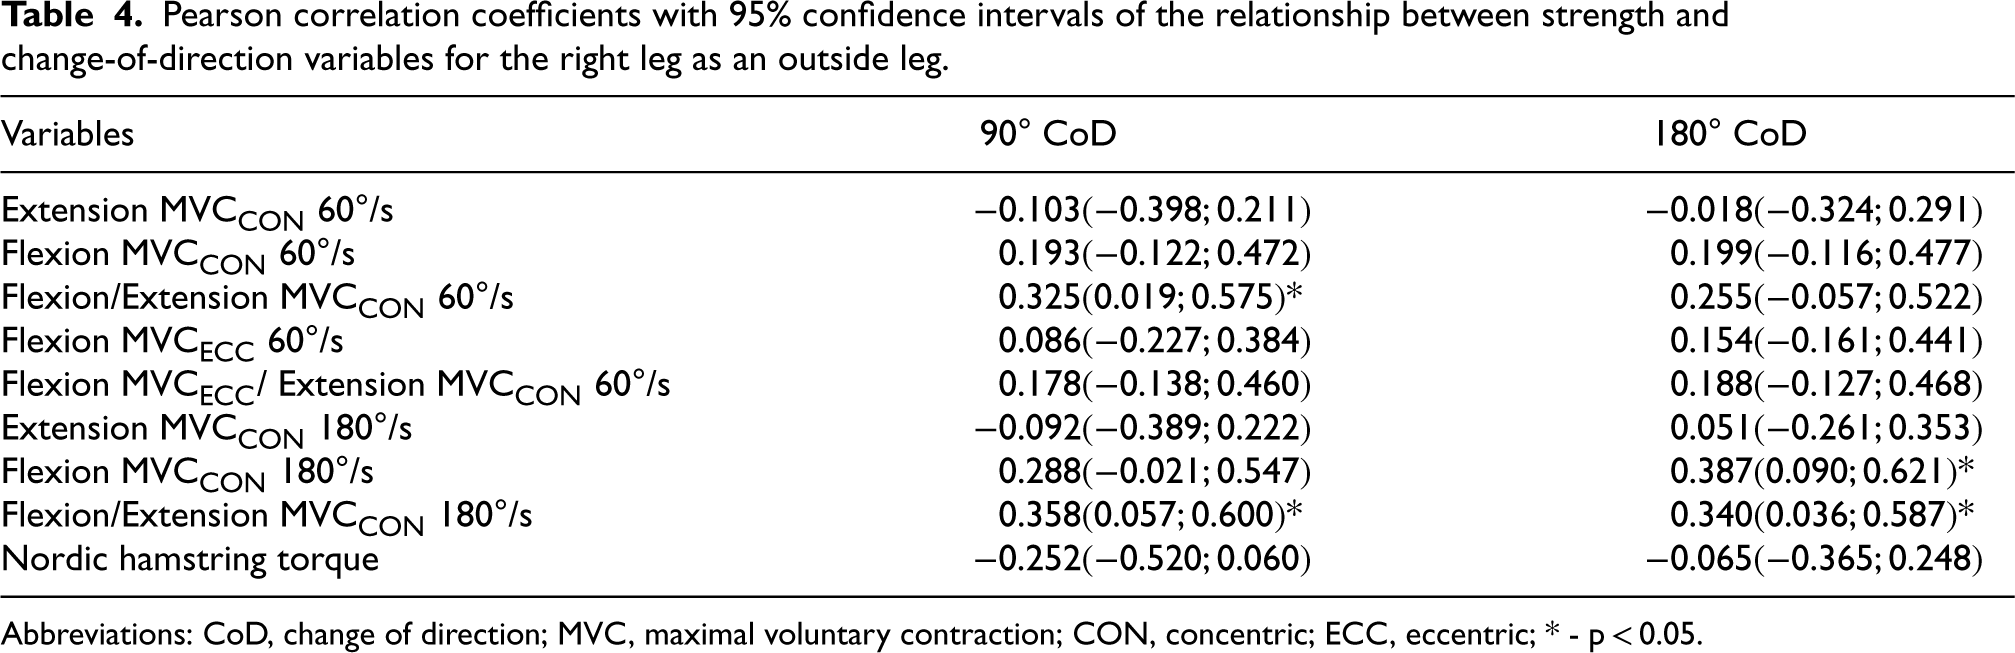
Abbreviations: CoD, change of direction; MVC, maximal voluntary contraction; CON, concentric; ECC, eccentric; * - p < 0.05.
This was the first study comprehensively evaluating the relationship between concentric and eccentric lower-limb strength and sprint, CoD and horizontal or lateral jump performance in elite youth soccer players. We hypothesized that greater quadriceps strength would be associated with superior single-leg jump and CoD performance, whereas greater hamstring strength would be associated with faster sprinting performance.
As expected, our findings suggest that the role of quadriceps and hamstring strength in soccer-specific performance is complex and task-dependent. We can partially confirm our first hypothesis: stronger knee extensors were associated with better CoD performance, but not with single-leg jump performance. Greater knee flexor strength at higher angular velocities (180°/s) and higher flexion-to-extension ratios were beneficial for sprinting performance, as they were associated with faster 10 m and 30 m sprint times, supporting our second hypothesis. Interestingly, these same hamstring strength characteristics appeared to impair performance in CoD tasks, as they correlated with poorer results in both 180° and 90° CoD tests. Moreover, all associations were more pronounced for the right leg, particularly depending on whether it served as the inside or outside leg during directional changes, while no significant associations were observed for the left leg.
Greater knee flexor strength and higher flexion-to-extension ratios at higher velocities (180°/s) were positively associated with sprint performance in our cohort, consistent with previous studies showing that hamstring strength plays a key role in linear sprinting among youth soccer players.19,20 These findings support the notion that high force production at higher contraction velocities, particularly from the hamstrings during hip extension and knee flexion, contributes to effective acceleration and maximal sprinting by enhancing horizontal propulsive capacity during both the swing and stance phases of sprinting. In contrast, the same hamstring strength characteristics were linked to poorer 180° CoD performance for right leg. This aligns with prior work indicating that faster athletes can exhibit larger difference between sprint and CoD task times because elevated linear sprint speeds exaggerate the difference calculation.20,21 The observed result may also reflect the specific CoD test configuration used in our study (Figure 1). Timing gates were triggered once participants reached 10 m at full speed, which may have allowed those with stronger knee flexors to reach higher velocities before changing direction. Consequently, these participants may have required greater deceleration forces to execute the turn efficiently, resulting in comparatively poorer CoD performance. For faster soccer players, as indicated by stronger knee flexors, antagonist muscle strength (i.e., knee extensors) is necessary to counteract these higher deceleration forces, as reflected by the flexion-to-extension strength ratio. This variable was positively correlated with CoD performance, indicating that participants with a higher flexor-to-extensor strength ratio performed worse. These findings suggest that when hamstring strength is high, adequate quadriceps strength is also required to successfully perform both sprinting and CoD tasks.
Stronger knee extensors were associated with better CoD performance but were not related to sprint times, highlighting the role of quadriceps strength in braking and propulsive forces during directional changes.19,22 The leg-specific patterns, with significant associations primarily observed in the right leg depending on whether it served as the inside or outside leg, highlight the importance of limb dominance and task-specific mechanics, as well as the underpinning motor control and neuromuscular factors, a nuance rarely addressed in previous youth soccer research. Although the right leg was statistically stronger (Table 1), it did not achieve longer single-leg hop distances and showed poorer 90° CoD performance. Therefore, future studies should consider the role of leg dominance and its underlying motor and neuromuscular mechanisms in change-of-direction task performance. We have only assessed knee muscle groups and we have might missed muscle groups responsible for pivotal actions. For example, Chen et al. 23 indicated that deceleration performance varies in its demands on knee and ankle strength across different sprint distances and that athletes who frequently decelerate over short distances should focus not only on strengthening their knee strength but also on prioritizing ankle strength. Furthermore, Sašek et al. 24 highlighted the pivotal role of hip strength for curvilinear sprint speed and maximal knee flexion strength as a predictor of linear sprint performance. The later finding is in line with our study. Interestingly, it seems that CoD results do not rely on the specific roles of inside and/or outside legs when performing the turns, which was a surprising finding while turns were intentionally performed with outside leg. Anyway, it could be speculated that not only the last step, but previous steps (decelerations when approaching the cone) play a significant role in final CoD performance, but future studies are required to confirm our claim. Furthermore, previous research show that bilateral strength differences could influence 505 test time 25 and we might speculate that regardless of the turning side, youth soccer players rely more on one leg (not necessary stronger one) at performing the test. This is not optimal for performance during the soccer match25,26 and long term athlete development due to possibility to overload one limb and induce injury and should be addressed in future research.
Our research was comprehensive and conducted on a relatively large sample of elite youth soccer players (n = 41, mean age = 16). Nevertheless, some limitations should be acknowledged. While the participants were all members of the same soccer team, the results might not be generalizable to other teams, elite senior players, or female athletes. Moreover, the external validity of the findings might be limited, as right-angle (90° CoD) and 180° CoD maneuvers are not frequently performed in competition and may not fully represent the physical characteristics relevant to soccer performance. Results may also depend on playing positions, given the different biomechanical demands and associated muscle characteristics. However, our sample size was too small to conduct subgroup analyses, which was beyond the scope of this study but could serve as a valuable direction for future research. Furthermore, although some correlations reached statistical significance, their magnitude was modest, with the strongest being r = –0.414 between knee flexion strength at 180°/s and 10 m split time. These associations should therefore be interpreted with caution due to the relatively wide 95% confidence intervals (–0.640, −0.122). Furthermore, as our results are cross-sectional, future longitudinal research is needed to determine whether increases in strength, as assessed by the tests used in our study, translate into improvements in physical performance. Therefore, causal relationships cannot be definitively established. Our study included youth (adolescent) soccer players and primarily focused on general physical performance variables rather than group-specific characteristics. Therefore, future research should compare our findings with those of other age groups and female soccer players to gain insight into age-related differences in the underlying determinants of performance. Additionally, further studies are needed to establish optimal lower-limb strength reference values that could serve as practical training benchmarks for enhancing performance in youth soccer players.
Conclusions
High-velocity knee flexor strength and higher hamstring-to-quadriceps ratios were associated with faster 10 m and 30 m sprints, highlighting the value of incorporating hamstring-focused exercises into youth soccer training. Stronger knee extensors, particularly at higher velocities, were linked to better CoD performance, indicating the relevance of quadriceps-focused, high-velocity resistance exercise training. The leg-specific findings further emphasize the importance of unilateral performance assessment.
Our results confirm that assessing and addressing knee strength in youth soccer players is critical, as these measures are performance indicators for sprinting and CoD performance. Identification and targeted training of players with lower strength may help them progress more effectively from junior to senior level and prevent the dropout of potentially talented players. Integrating multi-velocity, unilateral, and balanced hamstring–quadriceps strength exercises may optimize both sprinting and CoD performance in elite youth soccer players. Nevertheless, given the cross-sectional design of our study, future research across different age groups is required to determine whether improvements in the assessed strength measures translate differently into enhanced change-of-direction ability, sprint performance, and overall soccer performance across age groups.
Supplemental Material
sj-docx-1-iso-10.1177_09593020261456723 - Supplemental material for Relationships between quadriceps and hamstring strength and sprinting, change-of-direction, and single-leg jump performance in youth soccer players
Supplemental material, sj-docx-1-iso-10.1177_09593020261456723 for Relationships between quadriceps and hamstring strength and sprinting, change-of-direction, and single-leg jump performance in youth soccer players by Darjan Spudić, Kaja Bratina1 and Goran Vučkovič in Isokinetics and Exercise Science
Footnotes
Acknowledgments
The authors would like to thank the participants for their cooperation.
Ethical approval and informed consent statements
The study was approved by the Ethics Committee of the Faculty of Sport, University of Ljubljana (No. 34-2022) and adhered to the principles of Oviedo Convention and the Declaration of Helsinki. All participants and their parents were informed about the testing procedures and they both provided written informed consent before participation.
Author contributions
DS: Conceptualization, Data curation, Formal analysis, Funding acquisition, Investigation, Methodology, Project administration, Resources, Software, Supervision, Validation, Visualization, Writing – original draft, Writing – review & editing. KB: Conceptualization, Data curation, Formal analysis, Investigation, Methodology, Writing – review & editing. GV: Conceptualization, Writing – original draft, Writing – review & editing.
Funding
The authors disclosed receipt of the following financial support for the research, authorship, and/or publication of this article: The Slovenian Research Agency's program ‘Kinesiology of Monostructural, Polystructural, and Conventional Sports (P5-0147)’ provided partial salary support for DS and GV. The funder had no role in the design of the study; in the collection, analyses, or interpretation of data; in the writing of the manuscript, or in the decision to publish the results.
Declaration of conflicting interests
The authors declared no potential conflicts of interest with respect to the research, authorship, and/or publication of this article.
Data availability statement
The data supporting the conclusions of this study are available from the corresponding author, DS, upon reasonable request or from a data repository.
Supplemental material
Supplemental material for this article is available online.
References
Supplementary Material
Please find the following supplemental material available below.
For Open Access articles published under a Creative Commons License, all supplemental material carries the same license as the article it is associated with.
For non-Open Access articles published, all supplemental material carries a non-exclusive license, and permission requests for re-use of supplemental material or any part of supplemental material shall be sent directly to the copyright owner as specified in the copyright notice associated with the article.