
Abstract
The pattern of Holocene palaeoclimatic change in arid-semiarid northern China is debated. The terminal Huangqihai Lake is located at the northern margin of the modern East Asian summer monsoon and sensitive to climate change. We present here a sedimentary section from Huangqihai lake basin which comprises lacustrine and fluvial deposits and is about 8–9 m above the present lake level. Quartz optically stimulated luminescence (OSL) dating was employed to construct the chronology of the section. Based on the OSL chronology and the sedimentological and granulometric analysis, we conclude that (1) the Huangqihai Lake experienced a humid climate during the early part of the Holocene (from c. 10.2 ± 1.0 to 6.7 ± 0.7 ka) with a persistent and stable high lake level; (2) the lake level began to decline indicating aridification between 8.7 ± 0.8 ka and 6.7 ± 0.7 ka, and the climate was drier and variable after 6.7 ± 0.7 ka compared with that of before; (3) from 2.2 ± 0.2 to 0.93 ± 0.07 ka the climatic conditions were highly variable and continuously deteriorating, and the lake was turned into a playa for most of the time. In summary, the climate showed a general drying trend from the early Holocene to the late Holocene.
Keywords
Introduction
Lake level fluctuations of enclosed lake in monsoonal regions are direct indicators of regional moisture variability related to the intensity of monsoon activities, especially monsoon precipitation variations (Gasse, 2000; Street-Perrott and Harrison, 1985). Lake sediments are valuable archives of past climates and environments providing a detailed climatic record of variations in regional and continental moisture and aridity (Smith and Street-Perrott, 1983). Numerous lakes in the monsoonal/arid transitional zone of north China have been investigated to reconstruct the lake evolution and climatic history since the late glaciations (Chen CTA et al., 2003; Chen FH et al., 2003; Li and Wang, 1993; Li et al., 1992; Long et al., 2010a; Shi et al., 2002; Shen et al., 2006; Sun et al., 2009), especially in the Holocene because its climatic boundary conditions are similar to those of today and possibly in the near future (Feng et al., 2005).
Previous results from different researchers show some discrepancies, even conflicts with regard to the climate patterns during the Holocene. Although ice-core oxygen isotope records from Antarctica and Greenland revealed that climate variability was remarkably more subdued during the Holocene than during the last glaciation (Bender et al., 1994; Jouzel, 1994), the evidence from marine records indicates that the Holocene has experienced high variability (Beck et al., 1997; Bond et al., 1997). Some palaeoclimate records from the Asian monsoon area with reliable chronologies revealed a strong monsoon (high precipitation) in the early and mid Holocene (c. 11–5 ka BP), and a weak monsoon (low precipitation and dry climate) during the late Holocene (c. 5–3 ka BP) (Chen et al., 2008a, and references therein). Quite different opinions have been proposed as to the timing of Holocene optimum which is known as a general warm and wet period in different parts of China, defined mainly on the basis of postglacial temperature variations (Winkler and Wang, 1993). In this paper, we treat the Holocene optimum as a precipitation (or effective moisture) maximum without reference to temperature, according to the argument by An et al. (2000). Shi et al. (1993) considered that this special period occurred during c. 8.5–3.0 ka BP with stable warm and wet conditions during c. 7.2–6.0 ka BP in north China. A review by Feng et al. (2006) concluded that the Holocene optimum occurred during c. 8–5 ka BP at all sites in both the Inner Mongolian Plateau and the northwestern part of the Loess Plateau in northern China. However, by summarizing published pollen and other proxy data, An et al. (2000) showed an asynchronous feature of the East Asian summer monsoon during the Holocene optimum across central and northern China and found that the Holocene optimum existed during the early Holocene (10–7.0 ka BP) in northwest China.
In recent years, it has been reported that a mid-Holocene drought event existed in the East Asian monsoon marginal area (Chen CTA et al., 2003; Chen FH et al., 2003; Li et al., 2003). Li et al. (2003) detected a dry interval between c. 7.5 and 4.5 ka BP in a peat section at Midiwan in the loess and desert transitional zone. Chen FH et al. (2003) also observed a mid-Holocene (c. 7–5 ka BP) drought interval in the Alashan Plateau in Inner Mongolia. Chen CTA et al. (2003) reported a dry mid-Holocene climate between 8 and 4.3 ka, based on a multiproxy record from Lake Yanhaizi in the Hobq Desert.
Accurate and reliable dating of lacustrine deposits, especially in arid and semi-arid areas, is of crucial importance for the reconstruction of palaeolake and palaeoclimate evolution. However, most of previous chronological analyses were based on radiocarbon dating in northern China. Owing to the frequent lack of terrestrial organic materials, low total organic carbon contents and radiocarbon reservoir effects in arid areas, it is difficult to establish reliable chronologies for shoreline or lacustrine sediments based on 14C dating (Long et al., 2011). In recent years, luminescence dating has been successfully applied onto lake deposit dating in China (Chen et al., 2008b; Lee et al., 2009; Liu et al., 2010, 2011; Long et al., 2011; Madsen et al., 2008; Sun et al., 2010). In this study, in order to expand our knowledge of the lake evolution and the Holocene climate changes in the East Asian monsoon marginal area, quartz optically stimulated luminescence (OSL) dating was applied to the lake deposit in Huangqihai Lake in Inner Mongolia province in China. Based on the OSL chronology framework and grain size data, the lake level fluctuations are examined and the pattern of Holocene climate changes was also discussed.
Study region
Huangqihai Lake (40°41′–41°43′N, 112°49′–113°40′E, elevation c. 1268 m), a closed-basin lake in Inner Mongolia of China, lies at the northern boundary of East Asian summer monsoon (Figure 1a), which is highly sensitive to the changes of the monsoonal system. The lake basin has a maximum extent of c. 20 km and maximum width of c. 9 km with an area of c. 110 km2, and a drainage area of c. 4510 km2. The catchment basin consists of metamorphic pyrogenic rock, Tertiary basalt and Quaternary clastic sediments, and the elevation of the surrounding hills is about 1350–1700 m a.s.l. (Shi et al., 1989). There are about 19 rivers (including Bawang River, Quanyulin River, etc.) flowing into the lake basin, most of which originate from the mountains in the southeast and north of this lake (Figure 1b). In the past decades, as a result of human impact and climate aridification, most of the rivers are intermittent or even dry.
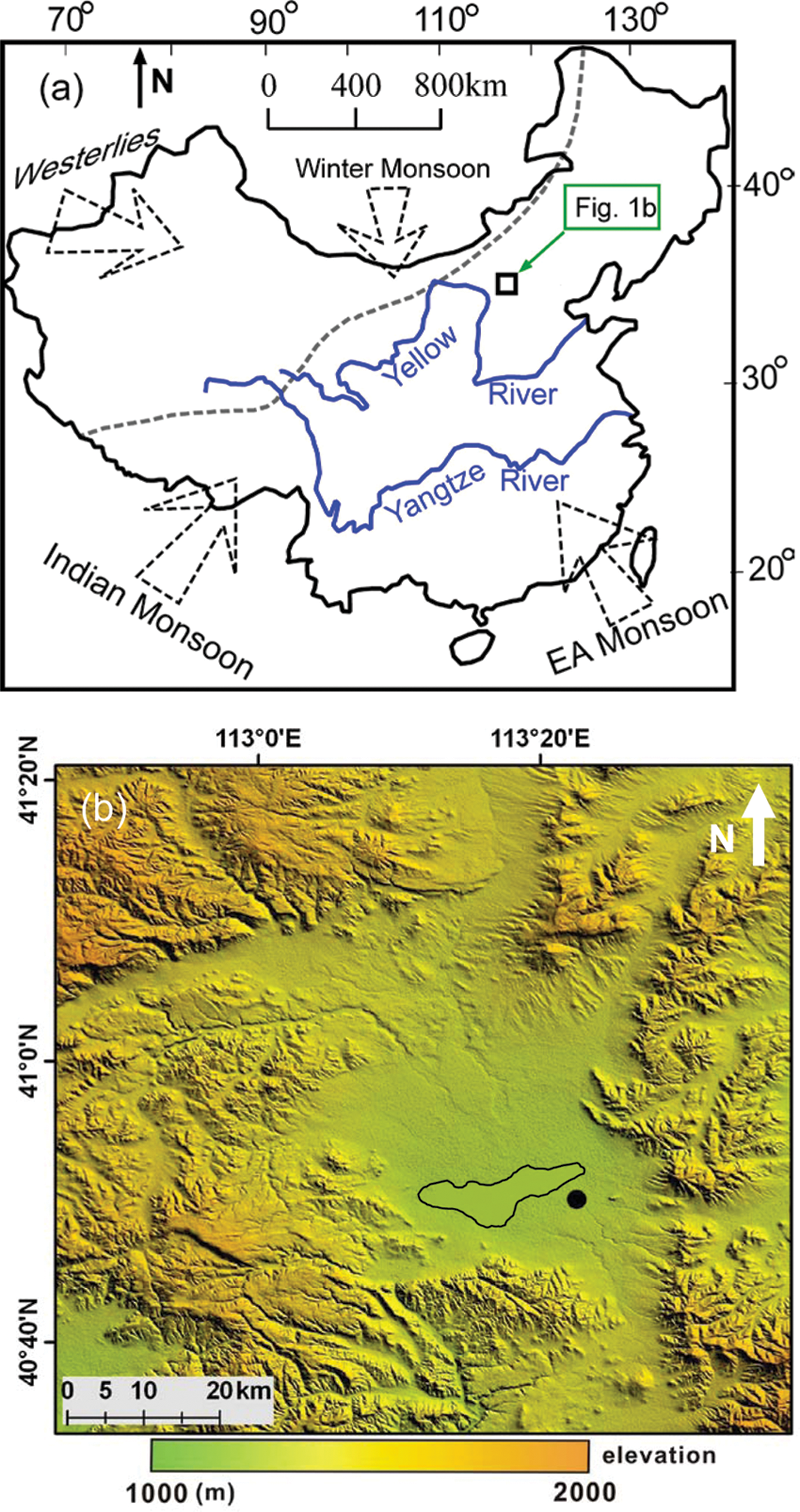
Location of the study area. (a) Map showing the geographical location and the climate system of the study area in China. The four arrows represent the atmospheric systems including westerlies, winter monsoon, India monsoon, and East Asian monsoon. The dashed line shows the present limit of East Asia monsoon influence. The small square is Huangqihai Lake. (b) The relief map of Huangqihai Lake. The enclosed black line is the lake basin area, and the dot is the sampling site with two adjacent sections HJC and H9B
The lake is located at the transition between semi-humid and semi-arid areas in the middle temperate zone of China. The mean annual temperature in the lake drainage basin is c. 4.5°C and the annual precipitation and evaporation is 362 mm and 1927 mm, respectively (Li et al., 1992). The climate in winter is controlled by the cold continent high-pressure system, dominated by the Siberian-Mongolian High. In summer, warm and moist air originating from the low latitude ocean can reach the lake area and brings precipitation together. The rainfall during June to August accounts for 66% of the annual precipitation (Wang, 1990). Vegetation in the lake drainage is dominated by semi-arid shrub grassland (Li et al., 1992).
Materials and methods
Materials
During field surveys in 2008 and 2009, a series of natural outcrops were found to the southeast of the lake basin. The profile Haojiacun (HJC) (N 40°50′2.6″, E 113°22′45.3″) is a few kilometers away from the southeast of Huangqihai Lake (Figure 1b) and was exposed because of the downcut erosion of the Bataigou River. The exposed section is comprised of lacustrine and fluvial deposits. The top surface of the section is about 8–9 m above the present lake level. The section is about 3.4 m thick, of which a depth of 2.7 m is naturally exposed and a further 0.7 m depth was dug. HJC section can be divided into eight stratigraphic units (Figure 2). Unit A (below 3.08 m) is grayish yellow clayey lacustrine and the base of which is not exposed. Unit B (3.08–2.92 m) is composed of dark brown medium-fine beach sand. Unit C (2.92–2.20 m) is grayish green lacustrine silty clay, whose grain size is the smallest in the whole section, indicative of a relatively deep lake environment. Unit D (2.20–1.67 m) is a grayish brown lacustrine sandy silt layer. Unit E (1.67–1.60 m) is a 7 cm thick brown palaeosol. Unit F (1.60–1.48 m) consists of grey brown medium-fine beach sand and also contains coarse sand. Unit G (1.48–1.40 m) is another thin layer of brown palaeosol. Unit H (1.40–0 m) consists of yellowish-brown fine fluvial silt containing coarse sand with a maximum diameter of less than 1 mm.
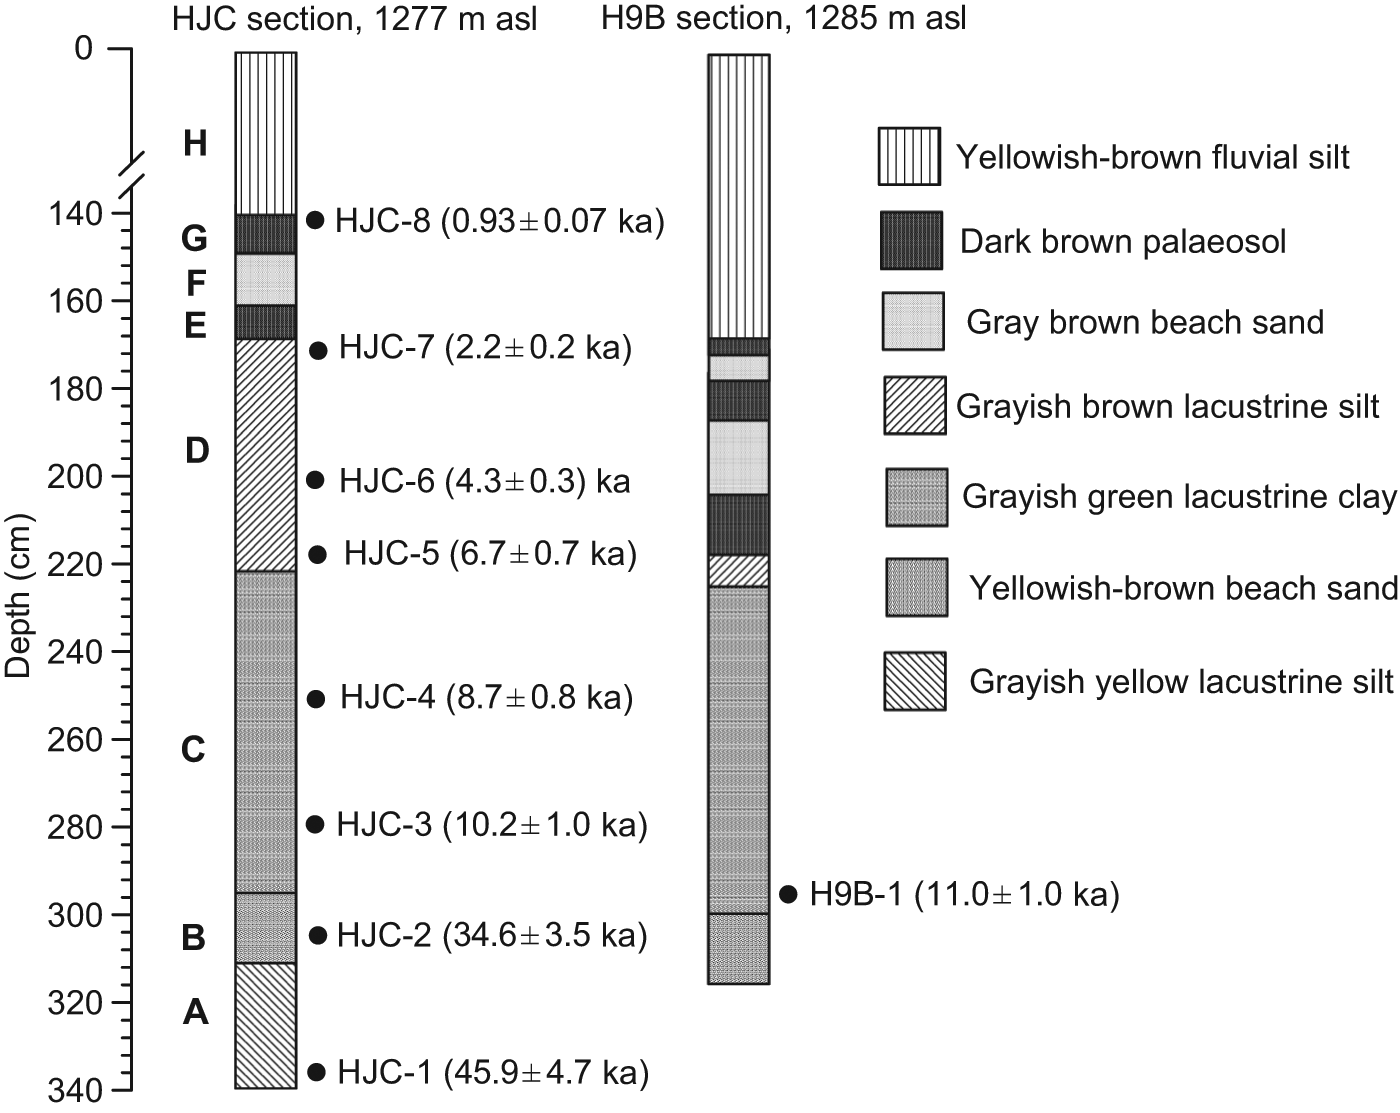
Stratigraphy and the OSL ages of HJC and H9B section
The H9B section is about 300 m to the northeast of HJC section, and its sediment sequence roughly resembles that of the HJC section (Figure 2). This section is about 3.4 m thick and the base of the lacustrine deposits is not exposed.
Nine samples (eight from profile HJC and one from H9B) were collected for OSL dating, by driving stainless steel tubes (6 cm diameter, 20 cm long) into a newly cleaned section face. The tubes were then wrapped in aluminum foil and opaque tapes. 124 bulk samples were also collected from HJC section every 1.5 cm for grain size analysis.
OSL techniques
OSL sampling tubes were opened under subdued red light in the luminescence laboratory and the sunlight-exposed material at each end of the tube was removed. The material in the middle part of the tube was first pretreated with 10% HCl and 30% H2O2 to remove carbonates and organic matter. The 38–63 µm fractions was separated by dry sieving and treated with 30% hydrofluorosilicic acid (H2SiF6) for about two weeks to remove feldspars. Subsequently, the remaining grains (quartz) were treated with a weak solution of hydrochloric acid to remove fluoric components and then rinsed with water. The purity of quartz grains was monitored by infrared stimulation. Samples that showed obvious IRSL signals were treated again with 30% H2SiF6 acid to prevent age underestimation by feldspar contamination (Lai and Brückner, 2008). Then well-treated quartz grains were mounted on the center (0.4–0.5 mm in diameter) of 10 mm diameter stainless steel discs with silicone oil.
Luminescence measurements were carried out using an automated Risø TL/OSL DA-20 reader equipped with a beta source. The single-aliquot regenerative-dose (SAR) protocol (Murray and Wintle, 2000) was applied to the equivalent dose (D e) determination for quartz. The concentration of radioactive elements (U, Th and K) was determined using neutron activation analysis and the cosmic ray dose rate was estimated according to Prescott and Hutton (1994). The alpha efficiency for quartz grains of 38–63 µm was taken as 0.035 ± 0.003 (Lai et al., 2008), and the attenuation of alpha particles within the quartz grains was taken into account when calculating the dose rate.
Before using the SAR protocol, the preheat plateau test and the dose recovery test were carried out for sample HJC-4, and a preheat of 260°C for 10 s, a cut heat to 220°C for 10 s were selected for all samples. The regeneration dose of 0 Gy is to measure recuperation, which was calculated by comparing its sensitivity-corrected OSL signal to the sensitivity-corrected natural signal. Recuperation was in all cases <1% for all samples. For most of the aliquots of all samples the recycling ratios (Murray and Wintle, 2000) fall into the acceptance range of 0.9–1.1, and aliquots with recycling ratios falling outside this range were rejected (only two aliquots from HJC-8). The growth curves can be well fitted using the exponential plus linear function and no saturation was observed in the growth curve (Figure 3a).
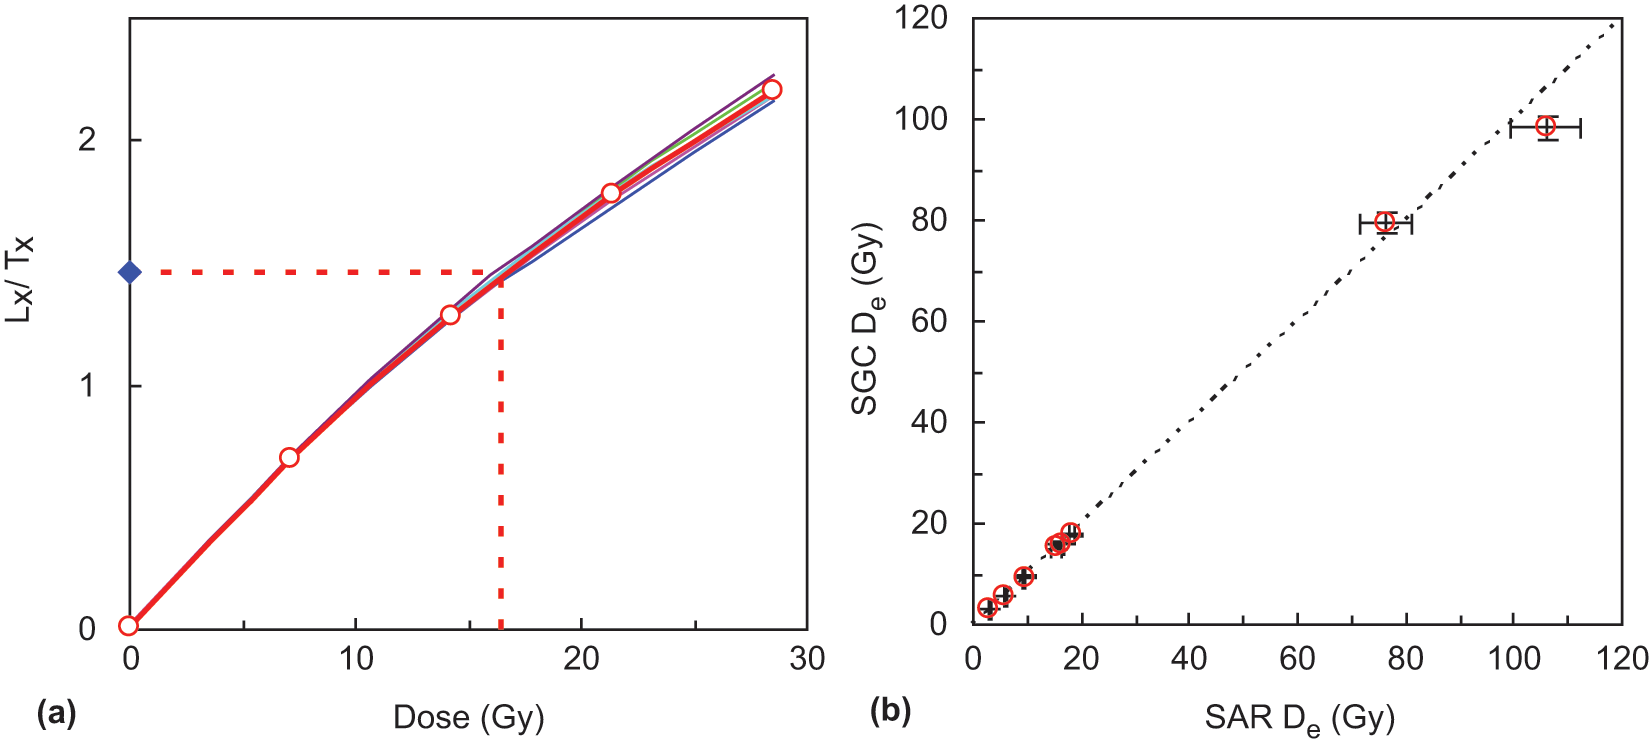
(a) Six growth curves for six aliquots of sample HJC-4, and the SGC (the line with empty circles) for this sample. (b) The comparison of SAR De with SGC De for the eight OSL samples. The ratio of all SAR Des to all SGC De is 1.01 ± 0.02
In the current study, we applied both SAR protocol (Murray and Wintle, 2000) and standardised growth curve (SGC) (Lai, 2006; Lai et al., 2007; Long et al., 2010b; Roberts and Duller, 2004; Stevens et al., 2007) methods for D e determination. First, six aliquots were used for each individual sample for D e determination using SAR. For each sample, a SGC was then constructed using the SAR data of the six aliquots. The six growth curves of six aliquots for sample HJC-4 are shown in Figure 4A, which are identical. For each sample additional aliquots (7–14) were measured for their natural (LN) and test dose (TN), for which the test dose corrected natural OSL signal levels (LN/TN) were then matched in the SGC of the six aliquots for the same sample to obtain a De value. The Des determined by the SGC are in agreement with the Des by the SAR protocol (Figure 3b). The results suggest that the SGC could be used for De determination for these samples. Thus, in this study the final De for each sample is the mean of SAR Des and SGC Des.
The grain size data plotted against depth for section HJC
Grain size measurement
Grain size was measured using a Malvern Master-Size 2000, which measures grain size between 0.02 µm and 2000 µm. Samples were pretreated with 10–20 ml of 30% H2O2 to remove organic matter, washed with 10% HCl to remove carbonate, and rinsed with deionized water. Finally, 10 ml of 0.05 mol (NaPO3)6 was added to the sample to disperse the particles on an ultrasonic vibrator for 10 min before grain-size measurement. 124 samples from HJC section were measured. The contents of clay, silt and sand for the samples from this sedimentary sequence were obtained directly from grain-size analysis data, and the sorting parameter was calculated by the moment methods (Blott and Pye, 2001).
Results and interpretation
Chronology
The OSL dating results of the nine samples are shown in Table 1 and Figure 2. In HJC section, all ages are in stratigraphic order within error and fall within the range of 45.9 ± 4.7 to 0.93 ± 0.07 ka. Sample HJC-1, which was collected from the bottom of the section, gave an age of 45.9 ± 4.7 ka. Sample HJC-2 collected from the beach sand layer (unit B) yielded an age of 34.6 ± 3.5 ka. Sample HJC-3 and HJC-4, collected from unit C that is indicative of deep water deposits, yielded ages of 10.2 ± 1.0 ka and 8.7 ± 0.8 ka. In unit D, we obtained three ages ranging from 6.7 ± 0.7 to 2.2 ± 0.2 ka. In the upper part of the section, the fluvial sediment sample HJC-8 collected at the boundary between unit G and H yielded an age of 0.93 ± 0.07 ka. So, the two paleosol layers were formed between c. 2 and c. 1 ka.
De determination, dose rate and OSL ages
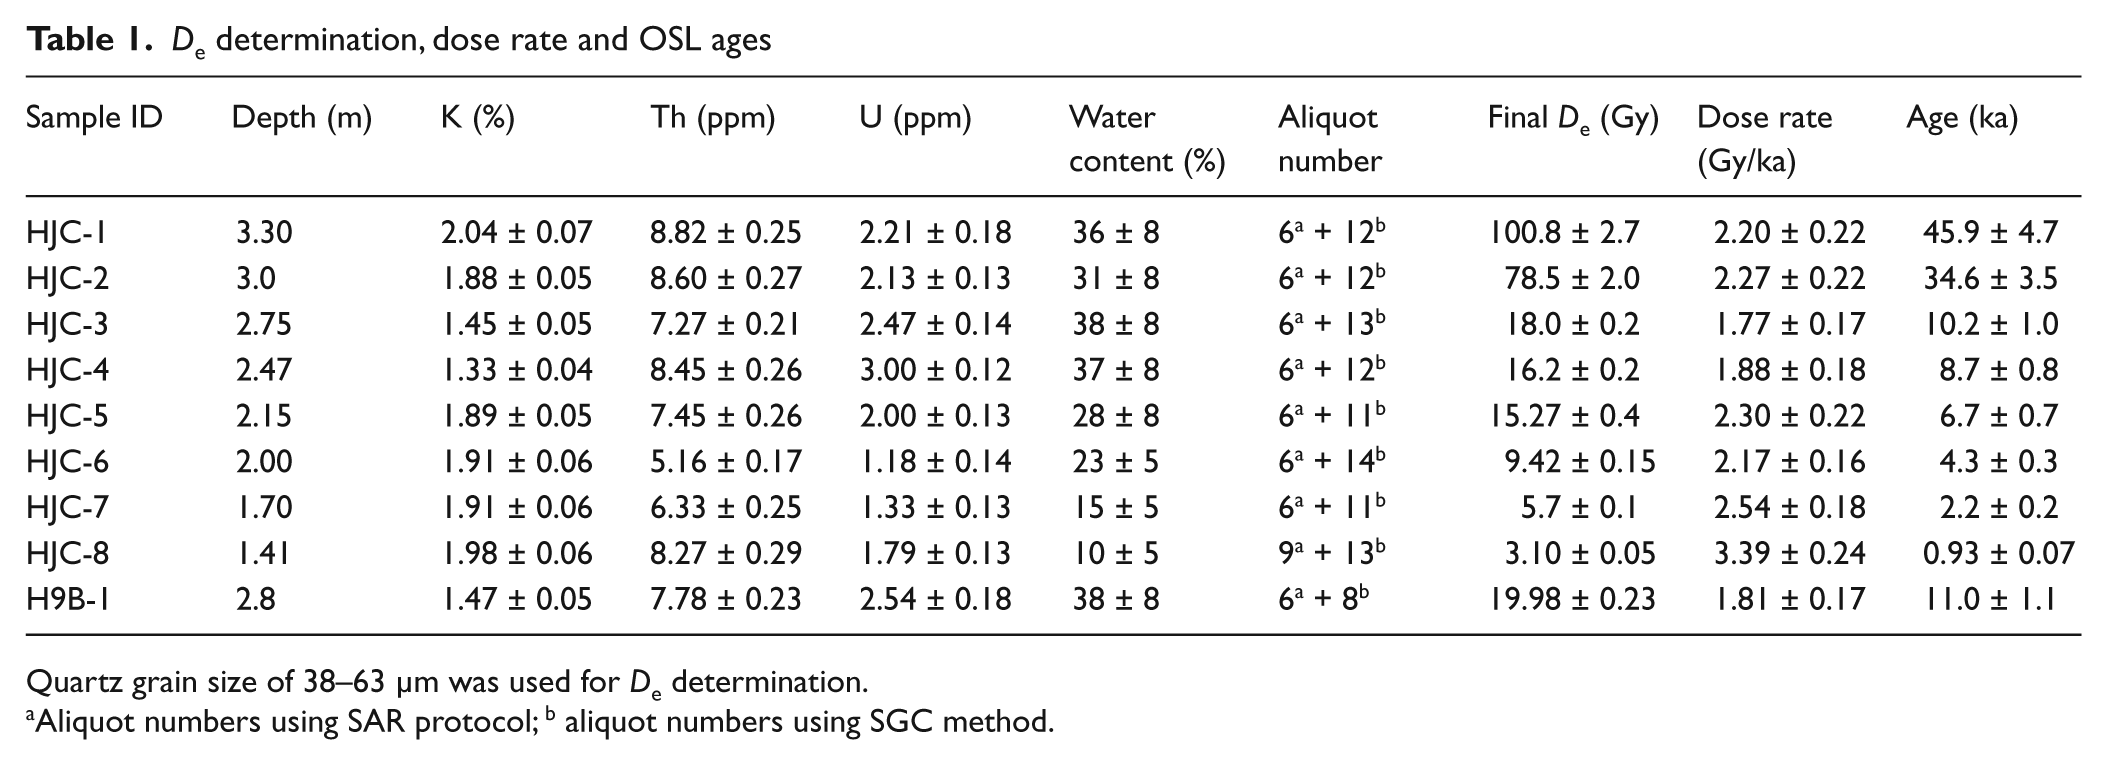
Quartz grain size of 38–63 µm was used for De determination.
Aliquot numbers using SAR protocol; b aliquot numbers using SGC method.
In H9B section, H9B-1 was collected at a depth of 2.8 m from the lower part of the fine-grained deposit, which resembles to the unit C in HJC section. It yielded an OSL age of 11.0 ± 1.0 ka, which is in good agreement with the age data of the HJC section, confirming that the deep water deposit accumulation started at the early Holocene.
Grain size data
Previous studies showed that the sediment grain size is a conventional proxy of climatic changes recorded by lacustrine sediments (Liu et al., 2008; Long et al., 2010a; Peng et al., 2005; Shen et al., 2006). Generally, during dry periods lake level falls, and lake area shrinks. The studied locality is near the bank, so that during a lower lake level period coarser particles are more easily transported and deposited there because of the stronger hydrodynamical disturbance. During wet periods, lake level rises and lake area spreads, and the sampling location will be farther from the bank, in which case coarser particles can seldom be brought there and the weaker hydrodynamical condition is helpful for the sedimentation of finer particles (Chen et al., 2004). As a result, larger grain size can indicate shorter distance of sampling location from the bank, lower lake level, smaller lake area and drier climate, while smaller grain size suggests greater distance of sampling location from the bank, higher lake level, larger lake area and wetter climate (Dearing, 1997; Digerfeldt et al., 2000). Wang et al. (2001) discussed that finer sediments reflect higher lake level and wetter climate, while coarser sediments indicated lower lake level and drier climate, when they pursued studies on the lacustrine sediment records of Dali Nor area on the Mongolian Plateau. Therefore, grain-size distribution could be used to describe changes of the sedimentary environment related to hydrodynamic variations.
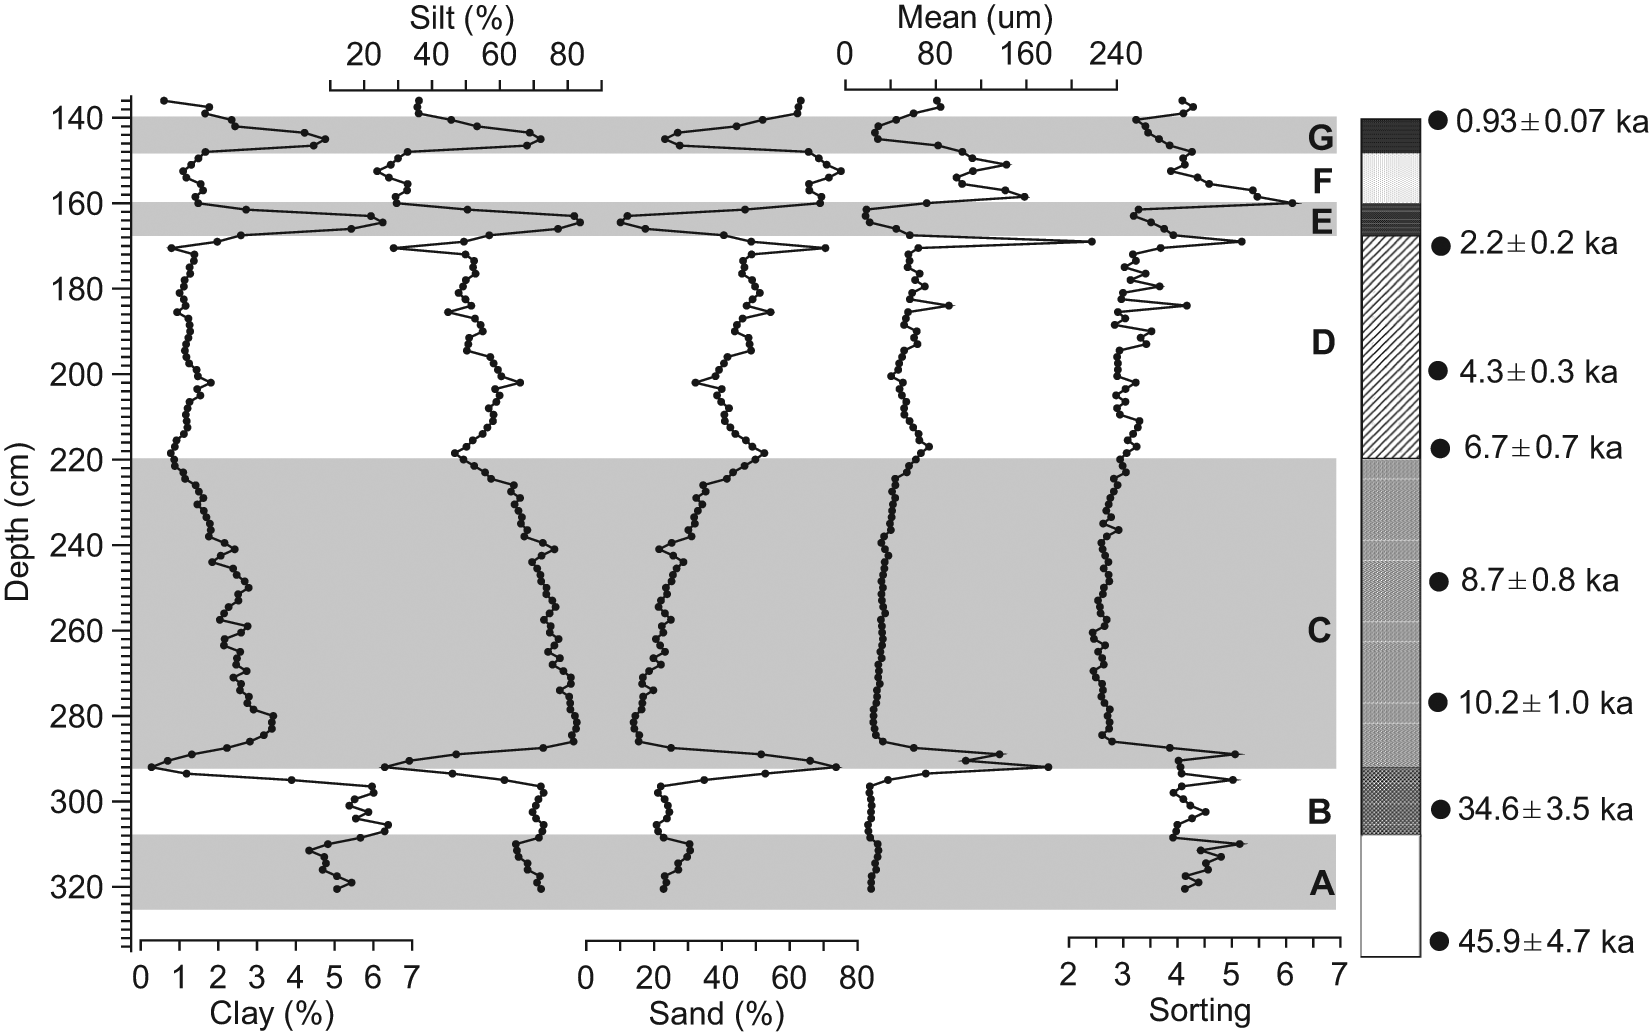
The percentages of the clay (<2 µm), silt (2–63 µm) and sand (>63 µm) fractions, the mean grain size and the sorting parameter of HJC section were plotted against depth in Figure 4.
Below 3.08 m (unit A), the silt fraction dominates, the average mean grain size of this unit is 23.6 µm which is almost lowest in the entire sedimentary sequence, and the sorting is poor. In unit B (3.08–2.92 m), the grain size changes dramatically, and most of the sediment is coarse (80%) with poor sorting. This suggests a shallow lake environment and a high water-energy level, possibly reflecting nearshore or beach condition. Stratigraphically, the grayish green silty clay of unit C shows an unconformable contact with the underlying sand layer (unit B), indicating that deposition between these two layers was not continuous. As a result, combining with the chronology of HJC section (Figure 3), we deduce that there is a depositional hiatus between the late MIS 3 to early Holocene, which was possibly caused by erosion and/or non-deposition during that time.
From 2.92 m to 2.20 m (unit C), the sediments are well sorted and the silt fraction dominates (c. 80%). The mean grain size and proportions of clay and silt show a gradually slight increase, contrary to the sand fraction. It suggests a decreasing distance of sampling location from the bank, a gradually lower lake level and smaller lake area. We conclude that the lake area was at a maximum between 10.2 ± 1.0 ka and 8.7 ± 0.8 ka, when the terminal lake Huangqihai experienced the highest lake level and relatively wettest climate within the Holocene. This would denote that more effective precipitation came into the lake basin by strengthened monsoon activity.
There is a slight transition between unit C and unit D. From 2.20 m to 1.67 m (unit D), the proportions of clay and silt began to decrease and the sand fraction increase. We conclude that the lake level began to decline between 8.7 ± 0.8 ka and 6.7 ± 0.7 ka, implying that the precipitation (or effective moisture) started to decrease, and that the climate was drier and variable after 6.7 ± 0.7 ka compared with that of before.
Unit E (1.67–1.60 m) and unit G (1.48–1.40 m) were two paleosol layers, punctuated by a thin beach sand layer (unit F). The grain size data fluctuated dramatically during this stage. It indicated a variable local environment since 2.2 ± 0.2 ka. Thin paleosol layer of unit E indicates that the lake level had declined and was lower than the sampling site. The overlying beach sand deposit (unit F) shows that the lake level increased slightly again for a relatively short time. The paleosol of unit G shows that the lake level had decreased again. The lake level did not reach this location again after 2.2 ± 0.2 ka. The upper part of the section is 1.4 m thick yellowish-brown fine silt. The age at the bottom of this unit is 0.93 ± 0.07 ka. In consideration of the absence of additional chronological data and the possible effects of human activities, we do not discuss the climate changes after 0.93 ± 0.07 ka.
Discussions of Holocene climate history
Different views exist regarding the pattern of Holocene climatic change in the Huangqihai Lake and the adjacent Daihai Lake (c. 60 km to the west), as well as in northern arid China in general. Previous studies from Huangqihai Lake showed a wet mid Holocene (8–6 ka BP) and dry early and late Holocene based on radiocarbon chronology, pollen, geomorphological and geochemical evidence, and historical documents (Li and Wang, 1993; Li et al., 1992). Shen et al. (2006) reported that in the Huangqihai Lake region the Holocene optimum occurred in the mid Holocene (8–5.1 ka BP) and that two dry events punctuated the humid period between 6.7 and 5.5 ka BP. In the adjacent Daihai Lake, Liu and Li (1992) inferred that the lake maintained a high lake level in the early Holocene and the lake level did not decline until c. 5.0 ka BP, according to the analysis of terrace sections. Based on analyses of geomorphology, sedimentology, and geochemistry of the terrace sections and cored sediments, it was suggested that the lake level was relatively high at c. 13–11 ka BP and much higher at c. 10–4 ka BP (Wang and Feng, 1991; Wang et al., 1990).
However, other authors proposed that the early Holocene was dry in the Daihai Lake area, while the mid Holocene was humid. It has been reported that the most striking feature of the pollen record is a significant increase in tree pollen reaching a maximum of 69.4% of the pollen sum between 7.9 ka and 4.5 ka BP (Xiao et al., 2004). The TOC and TN contents of the sediments correlate well with pollen percentage and pollen flux variations during the Holocene, and both reach their peak values simultaneously between 7.6 and 4.0 ka BP in the Daihai Lake record (Sun et al., 2006). Recently, Sun et al. (2009) reported that the highest lake level of lake Daihai occurred during 7.3–5.7 ka BP revealed by radiocarbon dating of lake terraces.
In Qingtu paleolake in the Tengger desert, Zhao et al. (2008) presented lithological and pollen data from a sediment section and reported that in a generally arid context, climate was extremely dry in the early Holocene, relatively wet at 7.2–5.2 ka BP, highly variable during 5.2–3.0 ka BP, and dry again after 3.0 ka BP. Based on eleven 14C ages, six OSL ages and high resolution palaeoclimatic proxies such as grain size, carbonate content, TOC content, C/N ratios and δ13C values of organic matter, Long et al. (2010a) showed that the early Holocene (9.5–7.0 ka BP) was dry in the Qingtu lake area, the mid Holocene (7.0–4.8 ka BP) was humid, and the late Holocene (since 4.8 ka BP) was increasingly drier. Based on 16 OSL ages and multiproxy records from the Hobq and Mu Us deserts in central Inner Mongolia in China, Sun QL et al. (2006) demonstrated that (1) dry climate prevailed between c. 11.5 ka and 9 ka, (2) a subsequent warm/humid phase occurred between c. 9 ka and 5.6 ka, and (3) the climate became arid again in the late Holocene. At the desert margin of northern China, including the semi-arid Horqin, Otindag, Mu Us dune fields and the arid margin of the Tengger Desert, eolian sand mobility is recorded most extensively between 11.5 and 8 ka, followed by a widespread shift toward reduced mobility and soil development during 8–6 ka, and a widespread late-Holocene reactivation (Mason et al., 2009).
However, Shi et al. (2002) reconstructed the lake evolution of terminal area of the Shiyang River drainage in the Tengger Desert based on the geomorphological investigations and sedimentological analysis of radiocarbon-dated nine sections. Their chronologies were based on conventional radiocarbon dates from bulk carbonate-rich organic matter and carbonate. Their results suggested a coalescent open lake in the area, indicating a humid early Holocene and closed shallow carbonate lakes and swamps during the mid and late Holocene. Chen FH et al. (2003) observed a mid-Holocene (7–5 ka BP) drought interval based on lake desiccation in the Alashan Plateau, Inner Mongolia. Chen CTA et al. (2003) suggested a dry mid-Holocene climate between 8 ka and 4.3 ka, recorded by a multiproxy record from the Lake Yanhaizi in the Hobq Desert.
Herzschuh (2006) provided a detailed review of Holocene effective-moisture changes in the East Asian and Indian monsoon regions and showed that the Holocene climate optimum with high precipitation occurred during the early Holocene in the Indian monsoon region, but possibly occurred during the mid Holocene in the East Asian monsoon region. In a review by Chen et al. (2008a), they concluded that all the selected well-dated monsoon records show a strong monsoon (high precipitation) in the early and mid Holocene, and a weak monsoon (low precipitation and dry climate) during the late Holocene in the Asian monsoon area (include East Asian Monsoon and Indian Monsoon). They argued that during the Holocene the Indian and East Asian summer monsoons show similar changes at orbital timescales. An et al. (2000) also concluded that in northwest China the Holocene optimum existed during the early Holocene (10–7 ka BP).
By comparing the previous results and some reviews in the Asian Monsoon area with that of the current study, the Holocene moisture history in Huangqihai Lake area was in phase with that in the Asian monsoonal dominated regions. It experienced a strong Asian summer monsoon corresponding to a humid climate during the early part of the Holocene (from 10.2 ± 1.0 to 6.7 ± 0.7 ka), and a decreased monsoon and increasing aridity during the mid to late Holocene (since 6.7 ± 0.7 ka).
Conclusions
In the current study, nine samples were dated using a combination of SAR protocol and SGC method and 124 grain size samples were measured for lacustrine sediments from the Huangqihai Lake area. Based on the OSL chronology, lithology, and grain size data, we conclude that the Huangqihai Lake experienced a humid early to mid Holocene (from c. 10.2 ± 1.0 ka to 6.7 ± 0.7 ka) which can be treated as the Holocene optimum. It resulted in a persistent and stable high lake level, marked by the accumulation of finest grained lake sediments. The lake level began to decline between 8.7 ± 0.8 ka and 6.7 ± 0.7 ka, and the climate was drier and variable after 6.7 ± 0.7 ka compared with that before. The mid to late Holocene (from 6.7 ± 0.7 ka to 2.2 ± 0.2 ka) had an increasingly arid climate which resulted in the accumulation of shallow lake sediments characterized by coarser grain size. From 2.2 ± 0.2 to 0.93 ± 0.07 ka conditions were highly variable and continuously deteriorating, and the lake was turned into a playa for most of the time.
Footnotes
Acknowledgements
We thank LingLing Yu for help with the grain size measurement, and ZiCheng Yu, Steffen Mischke and two anonymous reviewers for constructive comments.
This study was supported by a One-Hundred Talent Project of CAS granted to ZPL and China NSF (40901014).