
Abstract
Understanding the processes controlling peatland carbon (C) sequestration is critical to anticipate potential changes in the global C cycle in response to climate change. Although identification of these factors may be relatively straightforward on seasonal timescales, at centennial to millennial timescales complexities arise because of interactions between climate, vegetation, hydrology and long-term ecological processes. To better understand the factors controlling long-term C accumulation, Holocene rates of C sequestration were quantified from three pristine ombrotrophic peatlands in boreal Quebec, northeastern Canada (52°N, 75–76°W). Bulk density and loss-on-ignition analyses, combined with radiocarbon dating and age–depth modelling, were used to estimate long-term apparent rates of carbon accumulation. Past changes in vegetation and water-table depth were obtained from plant macrofossil and testate amoeba analysis. Earliest regional peat accumulation started ~7520 cal. BP, with long-term rates of C sequestration varying between 14.9 and 22.6 g/m2 per yr. High C sequestration rates occurred during the mid Holocene when relatively stable Sphagnum section Acutifolia communities were present, while low rates were found during the cooler late Holocene when Cyperaceae and ligneous vegetation were more dominant. However, C sequestration was highly variable among cores, implying that local topography, geomorphology and hydrology, or disturbance factors such as fire, mediate the influence of climate on C accumulation. Reconstructed water-table depths reveal several dry shifts since 3000 cal. BP, suggesting that episodic cold and dry conditions during the late Holocene may have contributed to lower C sequestration rates. Given the intensity of the water-table shifts at these times, we hypothesize that recurrent episodes of frozen subsurface peat might have intensified surface drying. As projected by climate scenarios, anticipated warmer and wetter conditions may lead to greater stability of hummock Sphagna cover and increased C sequestration potential in boreal peatlands.
Introduction
Peatlands are environments where anaerobic conditions restrict decomposition, leading to the accumulation of organic matter through time. Over millennia, a small net imbalance between net primary production (NPP) and decomposition of northern peatland biomass has resulted in a global stock of organic carbon (C) attaining ~547 Pg (Yu et al., 2010). Peatland C dynamics have affected climate change during the past millennia, by providing long-term positive and negative feedbacks on atmospheric greenhouse gas concentrations (Frolking and Roulet, 2007).
Besides important long-term C sinks, ombrotrophic peatlands constitute high-resolution archives of climatic change because of their sensitivity to variations in atmospheric moisture balance (Charman, 2002). Consequently, stratigraphic surveys of both past C sequestration and reconstructions of past hydroclimate from these systems may provide insight into future projections of C dynamics in response to climatic change. In this study, we quantified long-term C accumulation rates and investigated past variations in hydroclimatic conditions and plant assemblages at three peatlands in boreal Quebec, northeastern Canada.
Factors regulating the strength of the peatland C sink vary at different timescales (Yu, 2006b). Short-term relative rates of NPP and decomposition, quantified by net ecosystem productivity (NEP), are primarily linked to shifts in water-table depth (WTD) and peat surface temperature (e.g. Bubier et al., 2003; Pelletier et al., 2011; Silvola et al., 1996). However, on millennial timescales, changes in peatland vegetation and WTD, and thus C sequestration, are driven by a combination of allogenic and autogenic factors. Globally, climate regime may be the principal allogenic factor having a concomitant effect on both vegetation and hydrology (Barber et al., 1994), although fire, permafrost or geological processes (e.g. isostatic uplift) may be as important in certain regions (Glaser et al., 2004; Pitkänen et al., 1999; Turetsky et al., 2007). Autogenic factors affecting C sequestration may include surface microtopography dynamics (Eppinga et al., 2009; Swanson, 2007) and hydrology-induced limits to vertical peat growth (Belyea and Clymo, 2001; Yu et al., 2003).
Holocene variations in C sequestration have been reconstructed in various peatland types and climatic regimes. Most studies in northern peatlands show a slowdown of net vertical C accumulation towards the late Holocene (e.g. Turunen and Turunen, 2003; Turunen et al., 2001; Yu, 2006a), although one would expect an apparent net acceleration, as the duration of decay processes is higher in older peat (Clymo, 1984). Late-Holocene climatic cooling, affecting peatland ecohydrology and probably NPP, may have been responsible for declining rates of C sequestration. Nevertheless, long-term surface drying driven by autogenic factors associated with peatland development may have also contributed to late-Holocene declines in C sequestration.
In this study, we quantified variations in Holocene C accumulation from three pristine boreal peatlands located in the Eastmain region, northeastern Canada. In addition, by directly quantifying past peatland vegetation and water-table fluctuations, linkages among C accumulation, dominant vegetation and hydrological conditions were investigated. Finally, we also used our data to infer patterns of regional climate change based on replicate variations within cores.
Study region
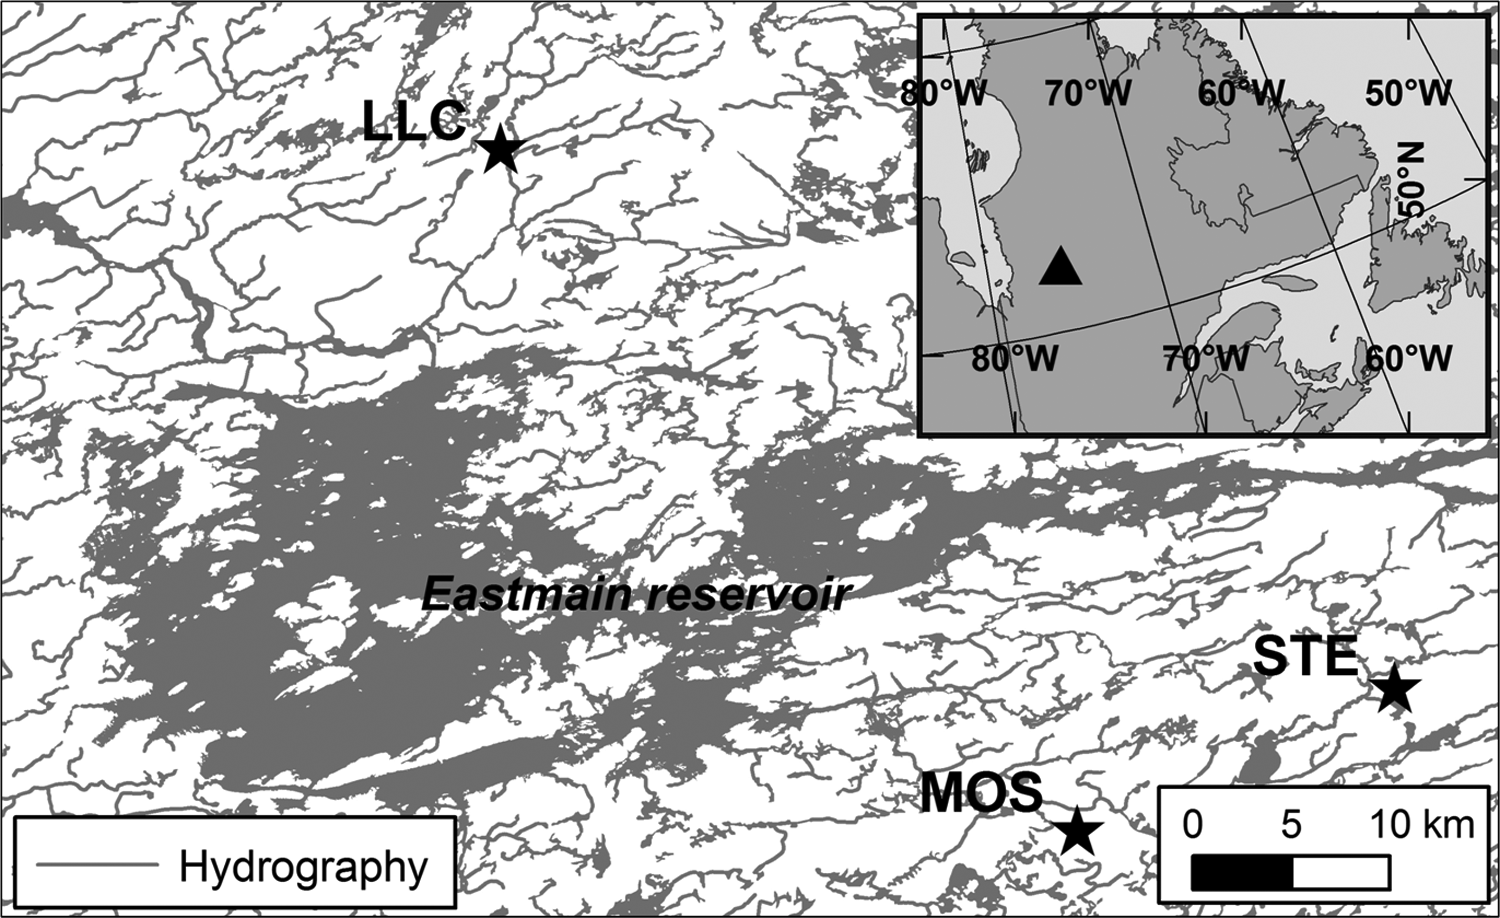
Peat cores were recovered from the deepest parts of the pristine ombrotrophic peatlands Lac Le Caron (LLC; 52°17′15″N/ 75°50′21″W), Mosaik (MOS; 51°58′55″N/75°24′06″W) and Sterne (STE; 52°02′37″N/75°10′23″W), located in the Eastmain river watershed in the boreal region of the James Bay lowlands, Quebec, Canada (Figure 1). Regional mean annual temperature is −2.1 ± 0.2°C (January: −22.0 ± 0.5°C; July: 14.6 ± 0.2°C), mean precipitation is 735 ± 12 mm, of which about one-third falls as snow, and the mean value for growing degree days above 0°C is 1763 (interpolated means and standard errors of 1971–2003 NLWIS data; Hutchinson et al., 2009). Further details on the study region and peatlands can be found in van Bellen et al. (2011).
Study region
Material and methods
The use of multiple proxies
Palaeoenvironmental reconstructions are preferentially based on multiple proxies, as independent records may prevent spurious reconstructions from a single proxy (Blaauw et al., 2010; Charman et al., 1999). Multiple proxies are particularly valuable in retrospective studies of peatland C dynamics, because rates of C accumulation are a product of multiple interacting factors (e.g. climate, vegetation, hydrology). Shifts in peat-forming vegetation are often related to changes in C sequestration, and plant macrofossils allow the identification of these past plant communities. In addition, plant macrofossils constitute an archive of moisture balance conditions, as changes in vegetation are primarily driven by hydroclimatic shifts if disturbance is absent. Likewise, assemblages of testate amoebae are recognized as good indicators of WTD in Sphagnum-dominated peatlands, especially when transfer functions are applied (e.g. Booth, 2008; Charman et al., 2007; Mitchell et al., 2008). Testate amoebae are highly sensitive to short-term (seasonal) and long-term (decadal) variations in WTD (Booth, 2010; Warner et al., 2007).
Fieldwork
One core was recovered from the deepest part of each peatland (van Bellen et al., 2011), using a Box corer (10 cm × 10 cm width) to sample the upper 1 m and Russian peat samplers (4.5 to 7.5 cm diameter) for deeper peat. Sampled monoliths were wrapped in plastic, transferred to polyvinyl chloride tubes and stored at 4°C until analysis.
Laboratory work
Prior to specific treatment, cores were sliced into contiguous 1 cm subsamples. Long-term apparent carbon accumulation rates (LORCA) were calculated from bulk density and loss-on-ignition (LOI) analyses. The amount of organic matter (OM) was defined as the product of bulk density and LOI (Dean, 1974). Bulk density was determined from contiguous 1 cm3 subsamples after drying for 16 h at 105°C. Subsequently, LOI analysis was performed at 550°C for 3.5 h (Heiri et al., 2001). The amount of organic C was calculated assuming a mean of 0.5 g C/g OM (Turunen et al., 2002).
Plant macrofossil analysis was performed at 4 cm resolution. Subsamples (4 cm3) were gently heated in distilled water with addition of 5% KOH and carefully rinsed through a 125 µm sieve. A binocular microscope (×10–×40) was used to identify peat-forming vegetation. Vegetation types were estimated as volume percentages of the 4 cm3 subsample; seeds, charcoal fragments and Cenococcum sclerotia were counted and acarid mite/insect fragments were scaled 1 to 10 (1=rare, 10=abundant). Sphagnum sections were determined using a microscope (×40–×100) based on branch leaf characteristics because stem leaves, which are often essential for the identification to species level, were rarely found. A plant macrofossil reference collection (Garneau, 1995) was used for identification; vegetation terminology is from Marie-Victorin (1995) and Sphagnum taxonomy follows Ayotte and Rochefort (2006).
Testate amoeba assemblages were analyzed at the same resolution as plant macrofossils. Subsamples (1 cm3) were gently boiled in distilled water according to the protocol described by Hendon and Charman (1997) and Lycopodium (or to some samples Eucalyptus) was added as an exotic marker to permit the calculation of test concentrations. The material between 355 and 15 µm was retained after sieving. A total of 150 specimens was counted in most samples, although for a few samples this count total could not be achieved. Samples containing less than 75 tests were considered unreliable, which is broadly consistent with the recommendation of Payne and Mitchell (2008) that counts of 50 may be adequate for some sites and counts of 100 are likely to be sufficient for most sites. Abundance of species was expressed as a percentage of the total tests counted. The common rotifer Habrotrocha angusticollis was included in the percentage calculations. Taxonomy follows Charman et al. (2000) except as modified by Booth (2008). Plant macrofossil and testate amoeba diagrams were created using C2 and plotted against depth (Juggins, 2007). Zones were identified on a visual basis, according to patterns in vegetation, testate amoebae and C accumulation.
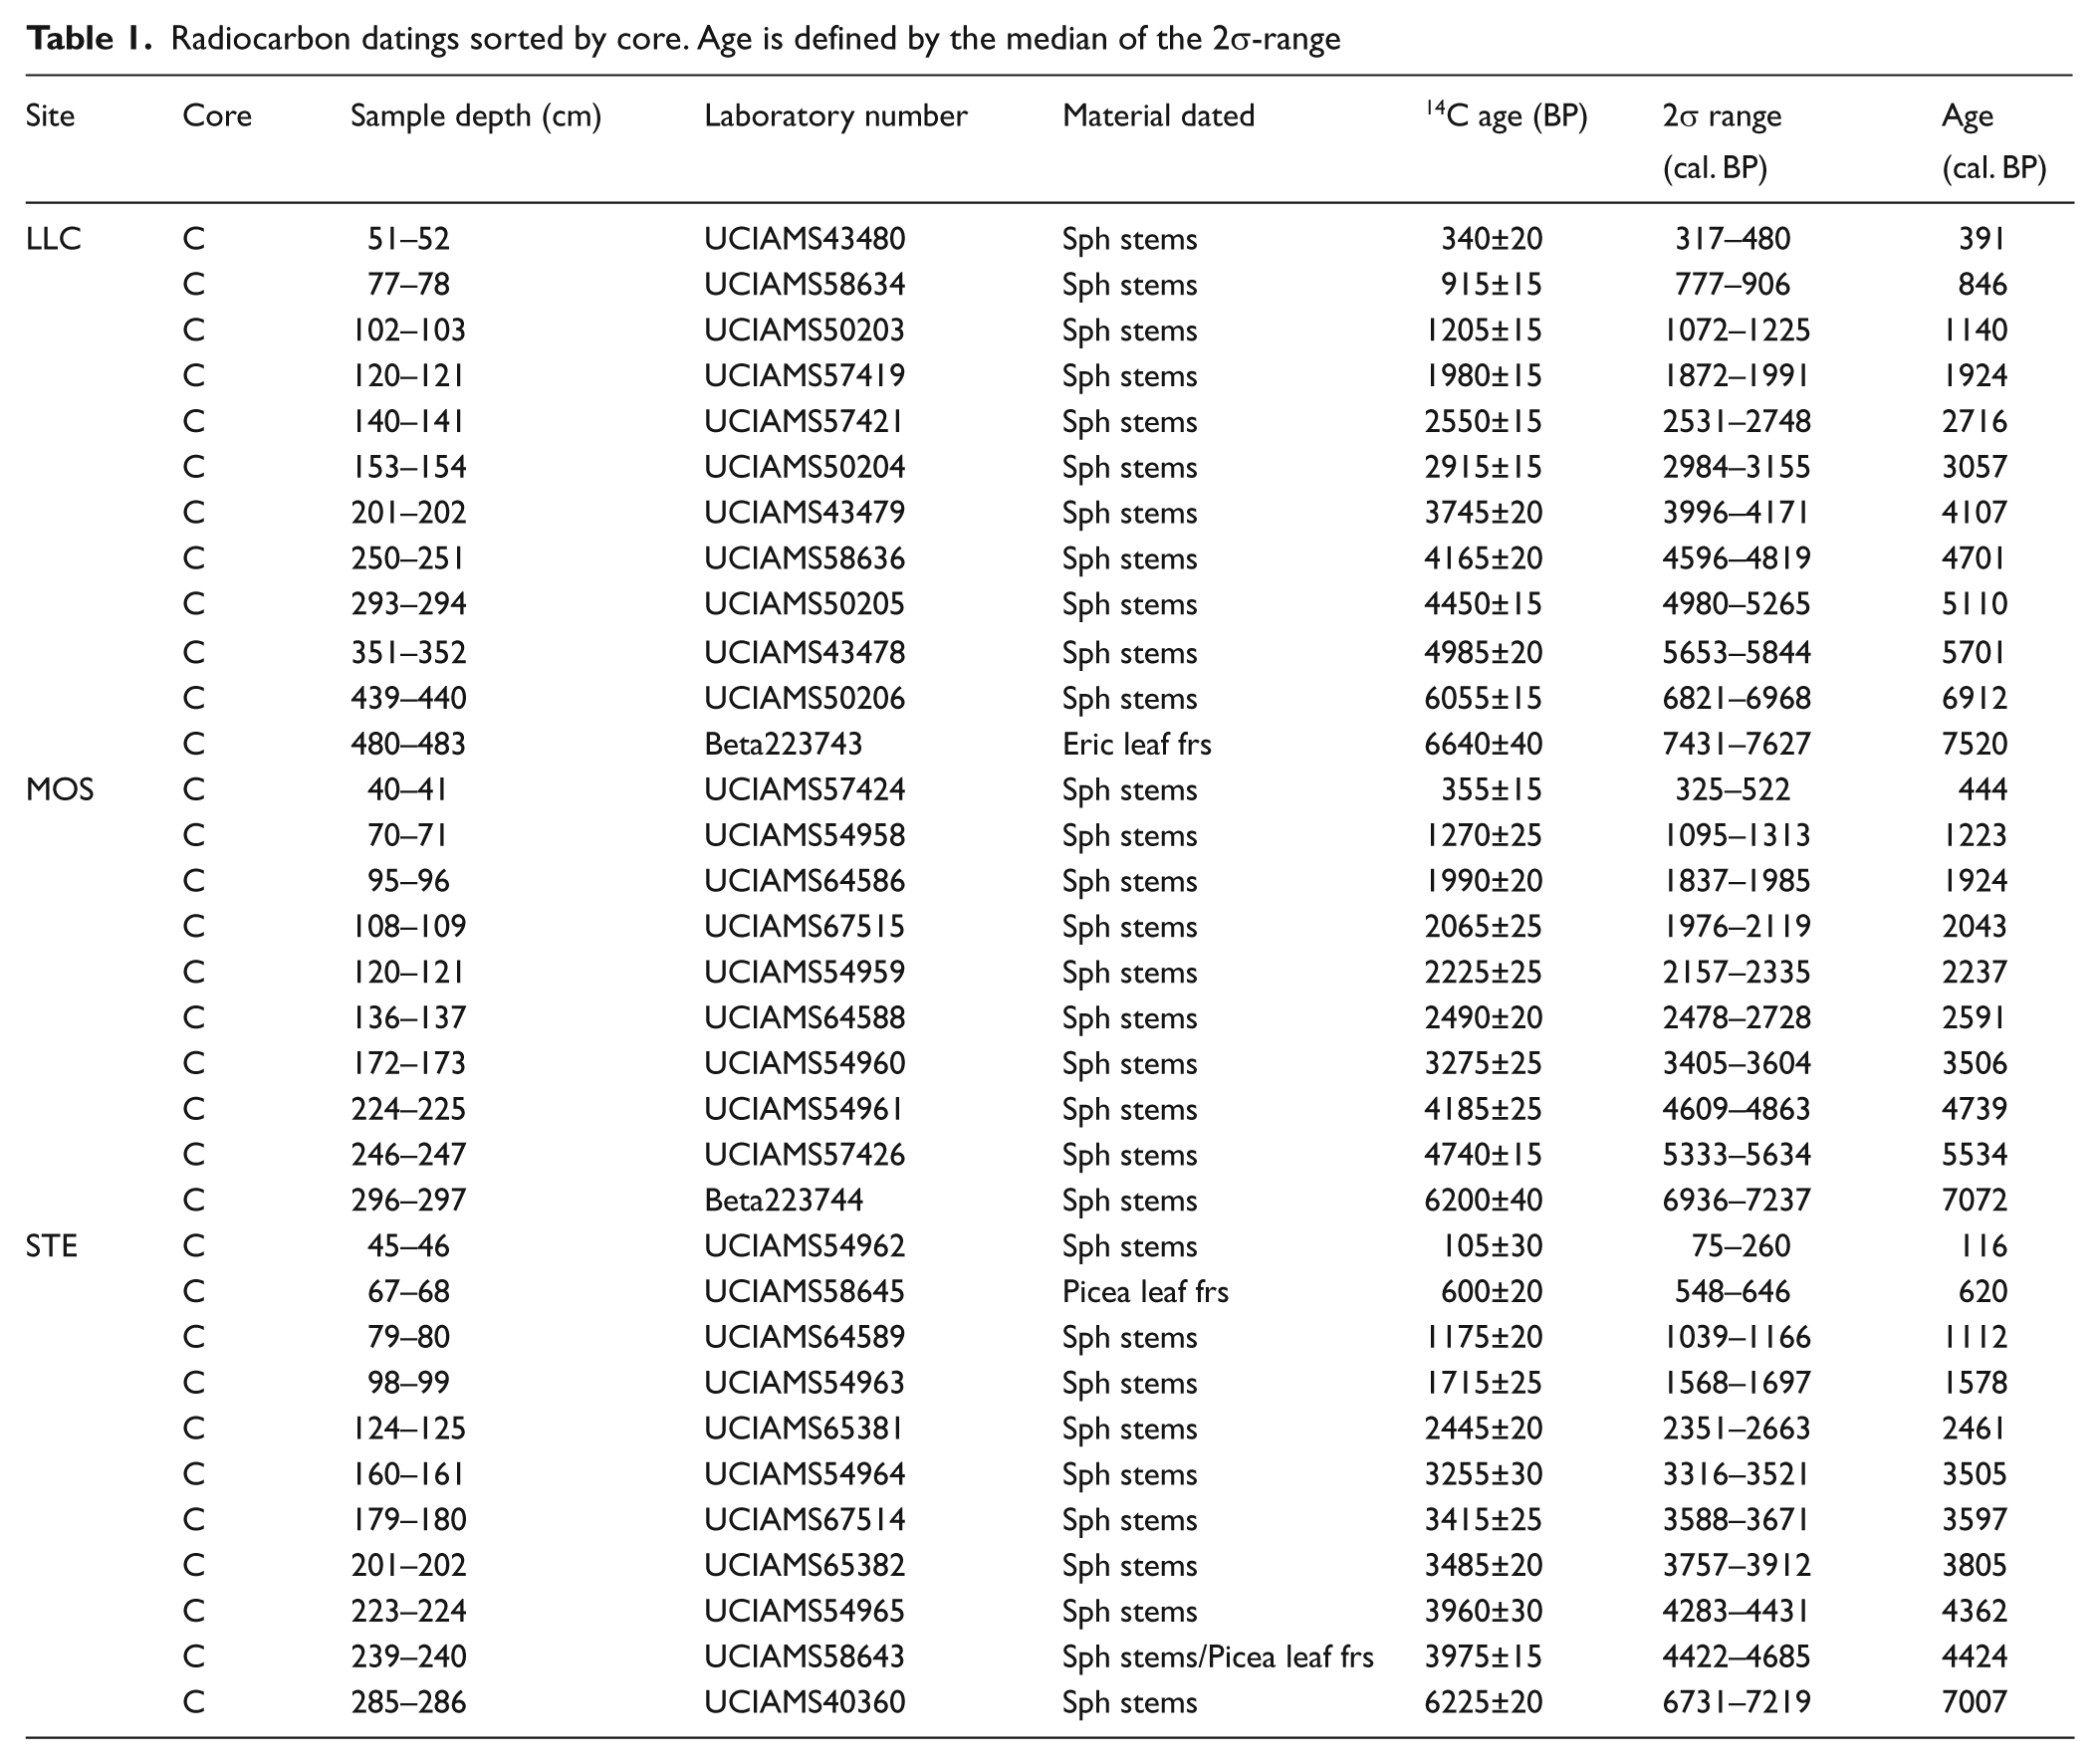
A total of 34 samples were submitted to Keck-CCAMS facility (Irvine, USA) and Beta Analytic Inc. (Miami, USA) for dating by 14C accelerator mass spectrometry (AMS). Sample material was preferentially Sphagnum stems (Nilsson et al., 2001), although in some cases Picea or Ericaceae leaf fragments were dated (Table 1).
Radiocarbon datings sorted by core. Age is defined by the median of the 2σ-range
Data analysis
Radiocarbon ages were calibrated using the IntCal04 calibration curve (Reimer et al., 2004) within the Bchron software package in R (Haslett and Parnell, 2008; http://www.r-project.org; R Development Core Team, 2009). One radiocarbon date on the STE core was identified as an outlier and was therefore omitted when developing the age–depth model. Bchron was further used for age–depth modelling, considering vertical accumulation as a continuous monotonic process applying piecewise linear interpolation. This approach includes creation of the 95% ‘highest density region’ of any level in the sediment record, thereby allowing estimations of the age uncertainty of any horizon within the cores. All ages were expressed as calendar years before present (BP = before
A transfer function based on 650 modern assemblages from peatlands in eastern and mid-continental USA was used to infer quantitative WTD from fossil testate amoeba assemblages (Booth, 2008). The widespread distribution of many testate amoeba taxa, and the similarity in the ecology of taxa among regions, suggests that the calibration data set of Booth (2008) should provide reliable water-table depth estimates in boreal Quebec, particularly along a relative water-table depth gradient (e.g. Booth, 2008; Booth et al., 2008; Charman and Warner, 1997). A weighted average-partial least squares model was used, as it showed optimal r2 and RMSEP values although application of other models resulted in similar reconstructions (Booth, 2008). Water-table depth reconstructions were expressed as raw values and were also detrended by a LOWESS filter with a 50% smoothing factor. Smoothing was performed to remove long-term trends caused by autogenic factors (i.e. lateral expansion and consequential drainage; Charman et al., 2006) to highlight hydrological changes most likely linked to hydroclimate variability. Records from different cores were standardized by calculating the difference from the mean of all observations, divided by its standard deviation (i.e. z-scores). Important events of extremely high or low water-table levels were visually linked, taking account of the uncertainty associated with each chronology.
Apparent C accumulation rates were defined as the product of sample C density and vertical accumulation rate (Tolonen and Turunen, 1996) and plotted as a function of age to facilitate inter-site comparisons. However, short-term shifts in C accumulation rates should be interpreted with caution, as our age–depth models were not highly resolved and thus generally failed to detect decadal to centennial shifts in vertical accumulation rates. Generally, episodes of slow vertical accumulation coincided with the presence of denser peat. As a result, decadal to centennial episodes of slow vertical accumulation not detected by age–depth models may be displayed as unrealistic peaks in C accumulation rate (i.e. post-fire; Kuhry, 1994). To account for these flaws in the age–depth models, C accumulation rates were additionally quantified by the mean rate between subsequent radiocarbon-dated levels.
Results
LLC bog
Ecohydrological reconstructions
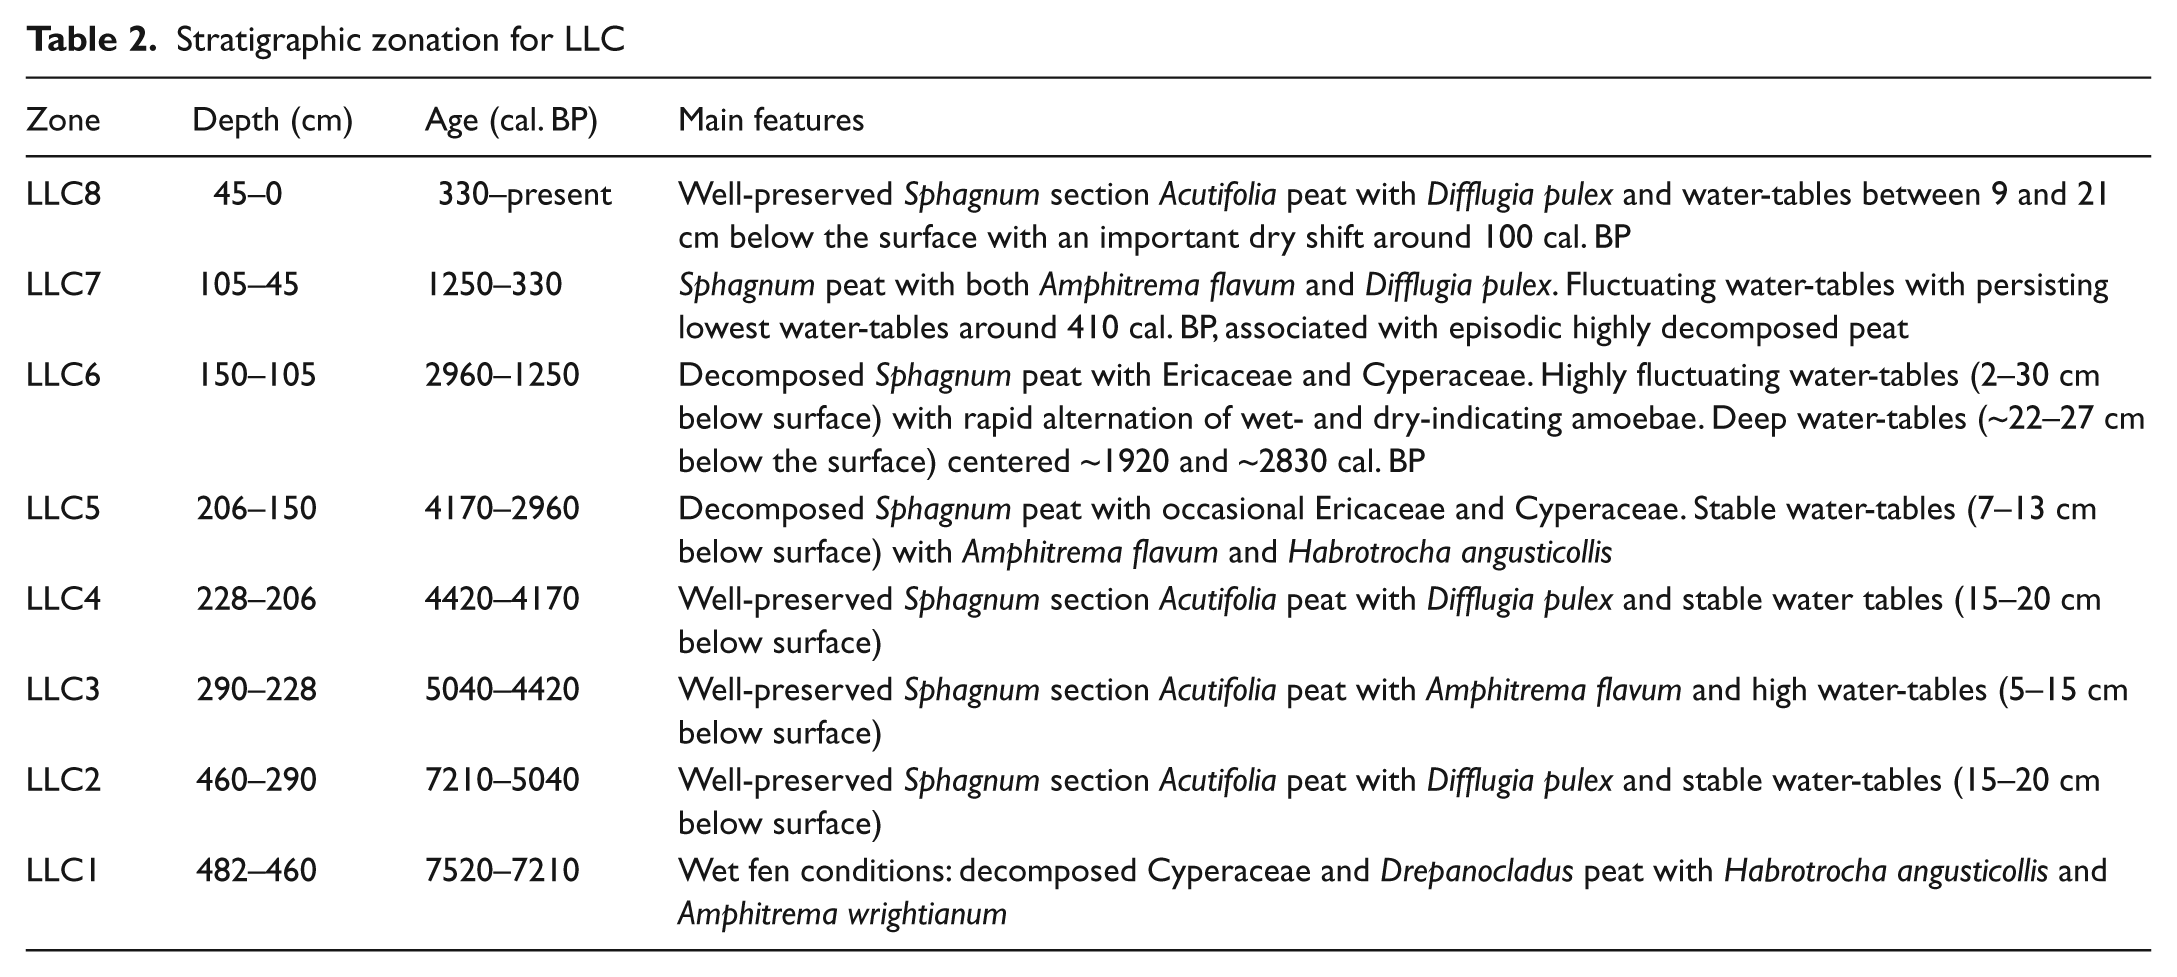
Peat accumulation started around 7520 cal. BP under minerotrophic conditions followed by an early shift to ombrotrophy around 7210 cal. BP (Figure 2, Table 2). Stratigraphic analyses show an important stable presence of Sphagna and high concentrations of testate amoebae throughout the deeper parts of the profile (zones LLC2, LLC3 and LLC4; Figure 2). From 4170 cal. BP vegetation assemblages alternate between Sphagnum, Cyperaceae and Ericaceae dominance (zone LLC5). This trend is accentuated between 2960 and 330 cal. BP, when repeated high-magnitude fluctuations in WTD (2–30 cm below surface) are registered through shifting testate amoeba assemblages of Difflugia pulex, Amphitrema flavum, Amphitrema wrightianum, H. angusticollis, Heleopera sphagni and Hyalosphenia subflava (zones LLC6 and LLC7; Figure 2 and Table 2). In addition, large charcoal fragments (>2 mm) indicate repeated fires on the coring site or in its vicinity, concentrated between 2520 and 390 cal. BP. Well-preserved Sphagnum section Acutifolia peat accumulated since 330 cal. BP, while a shift to more humid conditions is apparent in the uppermost section of the stratigraphy (zone LLC8).
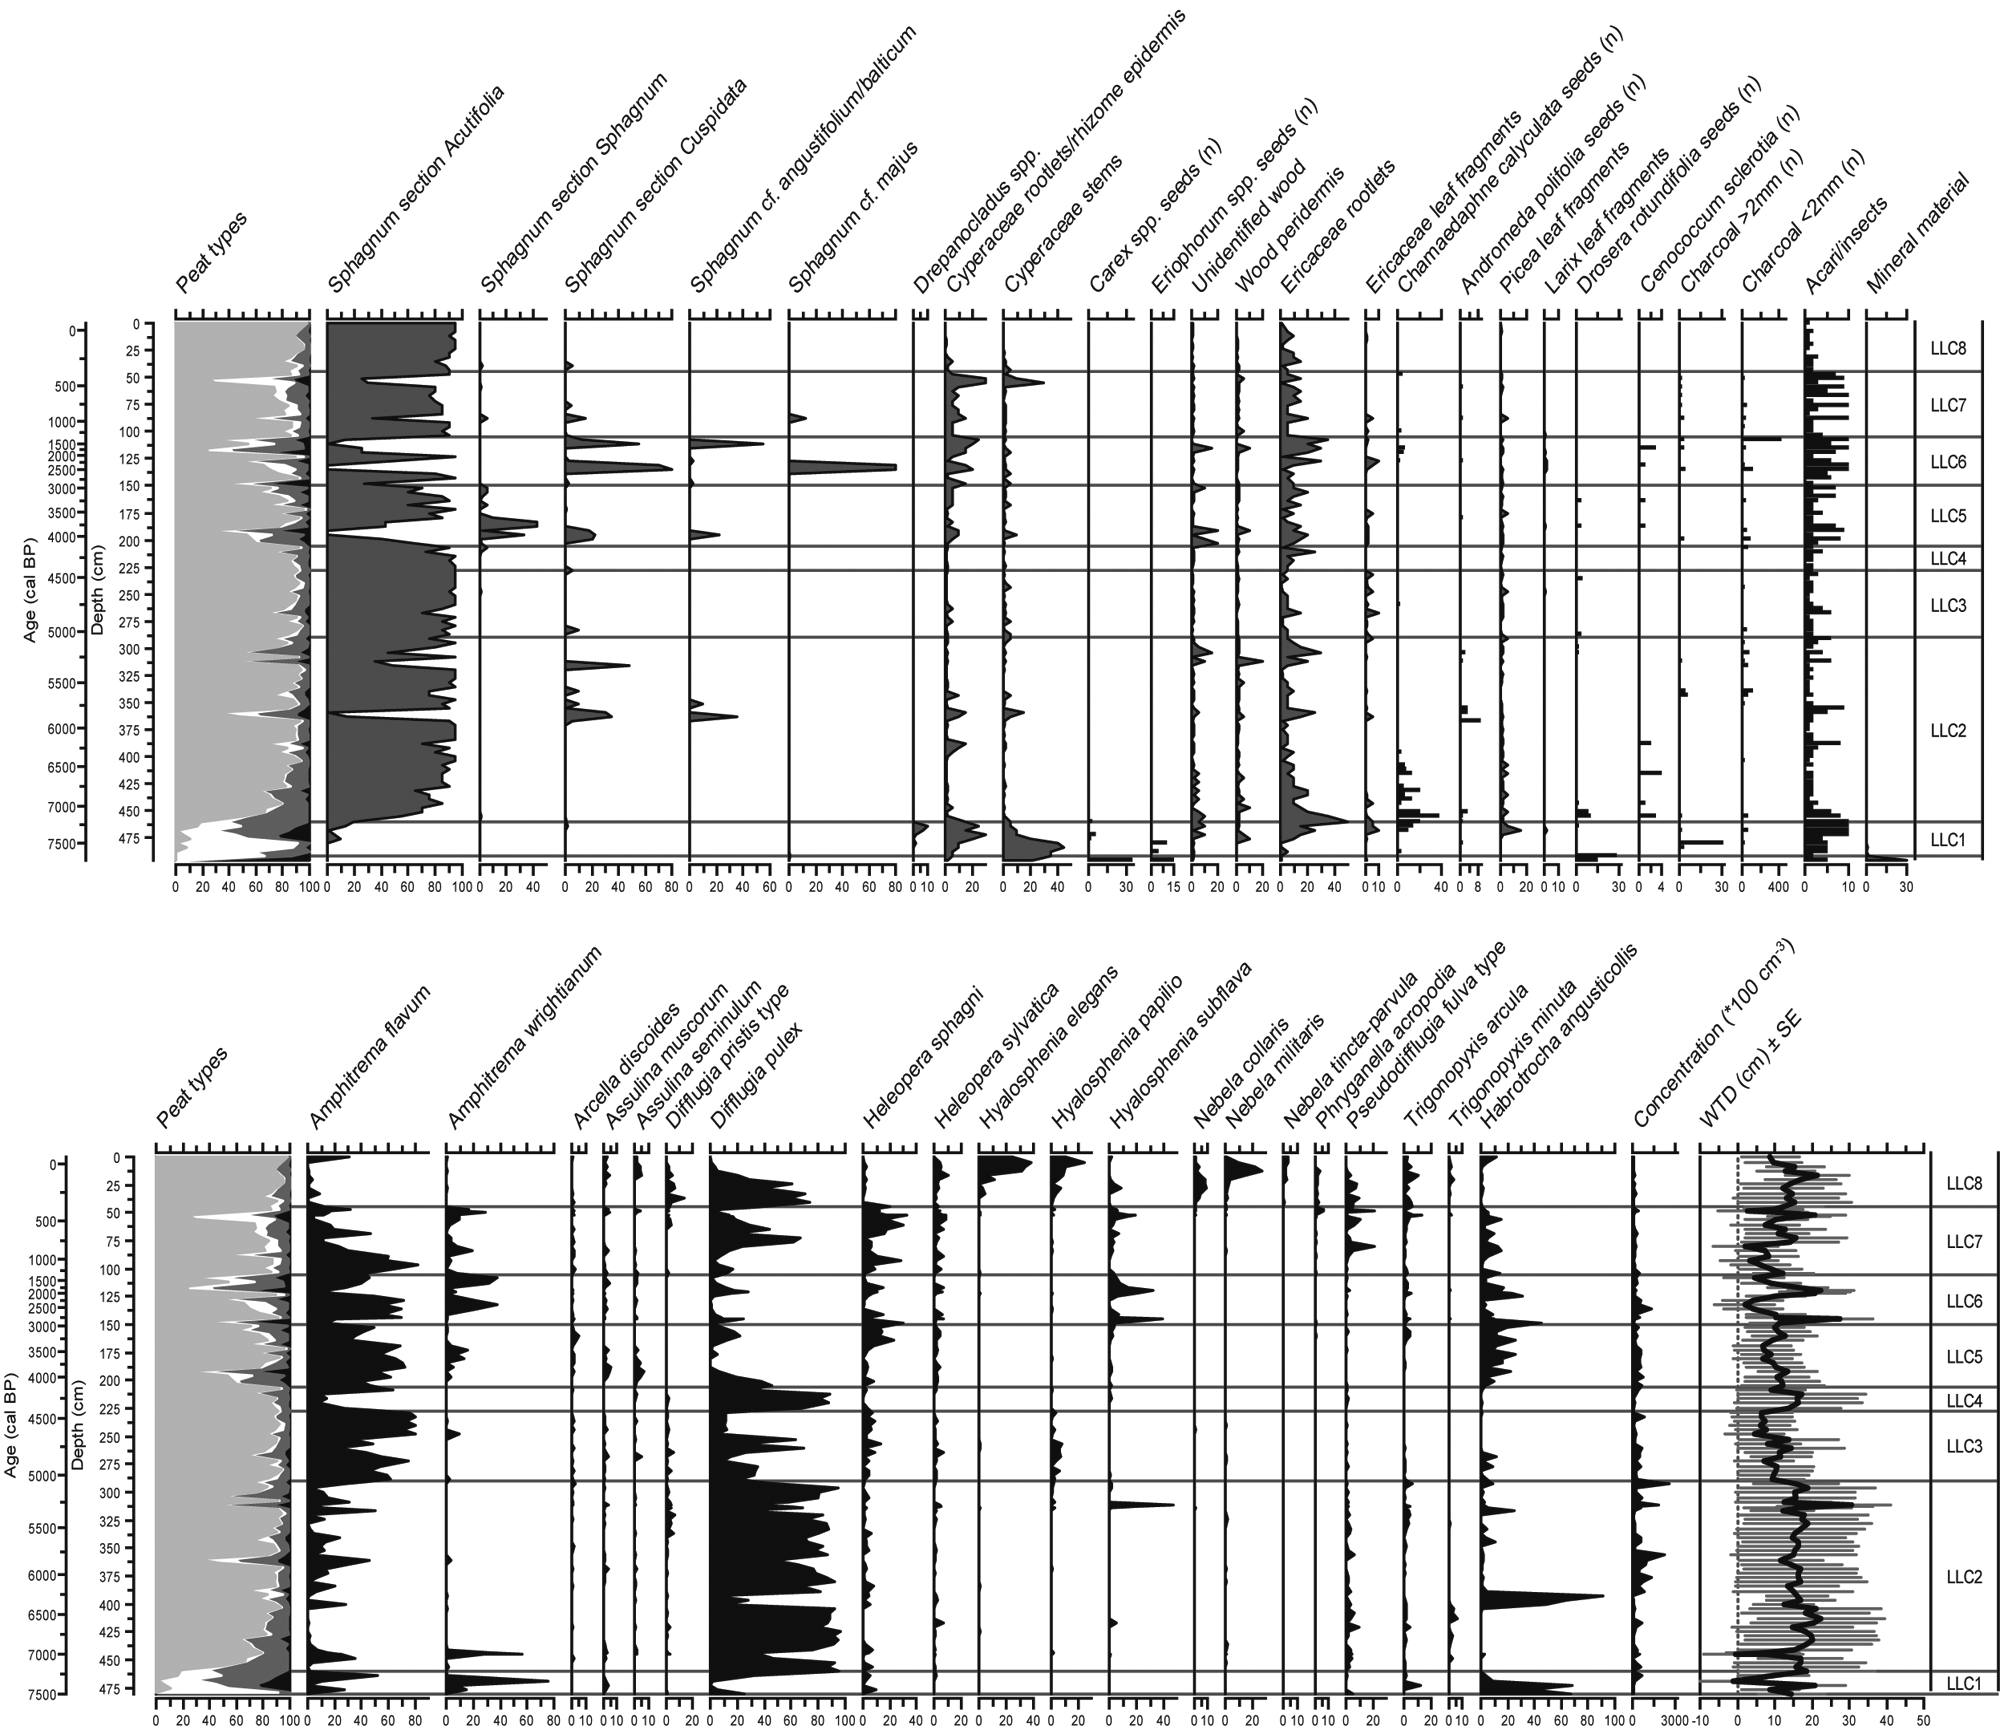
Plant macrofossil (upper) and testate amoeba diagram for LLC. Peat types are subdivided into Sphagnum peat (light grey), sedge peat (white), ligneous peat (dark grey) and unidentified organic matter (black). Amoeba quantities are expressed as percentages
Stratigraphic zonation for LLC
Carbon accumulation and biohydrological proxies
The LLC age–depth model shows a convex shape, indicating that vertical peat accumulation slowed down during the late Holocene, except for the uppermost part that is partially represented by the acrotelm (Figure 3a). The reconstruction of C accumulation in LLC shows that rates have varied considerably during the Holocene (Figure 4) with a mean of 22.6 g/m2 per yr. Despite high decomposition, C accumulation rates were high during the fen phase (zone LLC1; Table 2). Besides this period, rapid C accumulation occurred at the upper part of zone LLC2 (~5700–5040 cal. BP), characterized by moderate water-tables and Sphagnum section Acutifolia. C accumulation slowed down during zones LLC4 and LLC5 (4420–2960 cal. BP), attaining minima of 9–11 g/m2 per yr in zone LLC6 (2960–1250 cal. BP). This period of limited C sequestration was characterized by high mean water-tables interspersed with episodic dry surfaces (Figure 4). The corresponding tendencies of dry-indicating macrofossils and the inferred WTD show that extreme fluctuations in surface hydrology have occurred during the period of slow accumulation, although low temporal sample resolution between 4000 and 1000 cal. BP somewhat complicates the interpretation. A large increase in C sequestration rates started at the onset of zone LLC7 at 1250 cal. BP. The acceleration in C accumulation may well be related to the establishment of Sphagnum section Acutifolia, mediated by a climatic warming enhancing primary production. During the last millennium, C sequestration rates varied only slightly between 25 and 30 g/m2 per yr and, except for diminishing Sphagnum presence around 400 cal. BP, vegetation remained relatively stable.
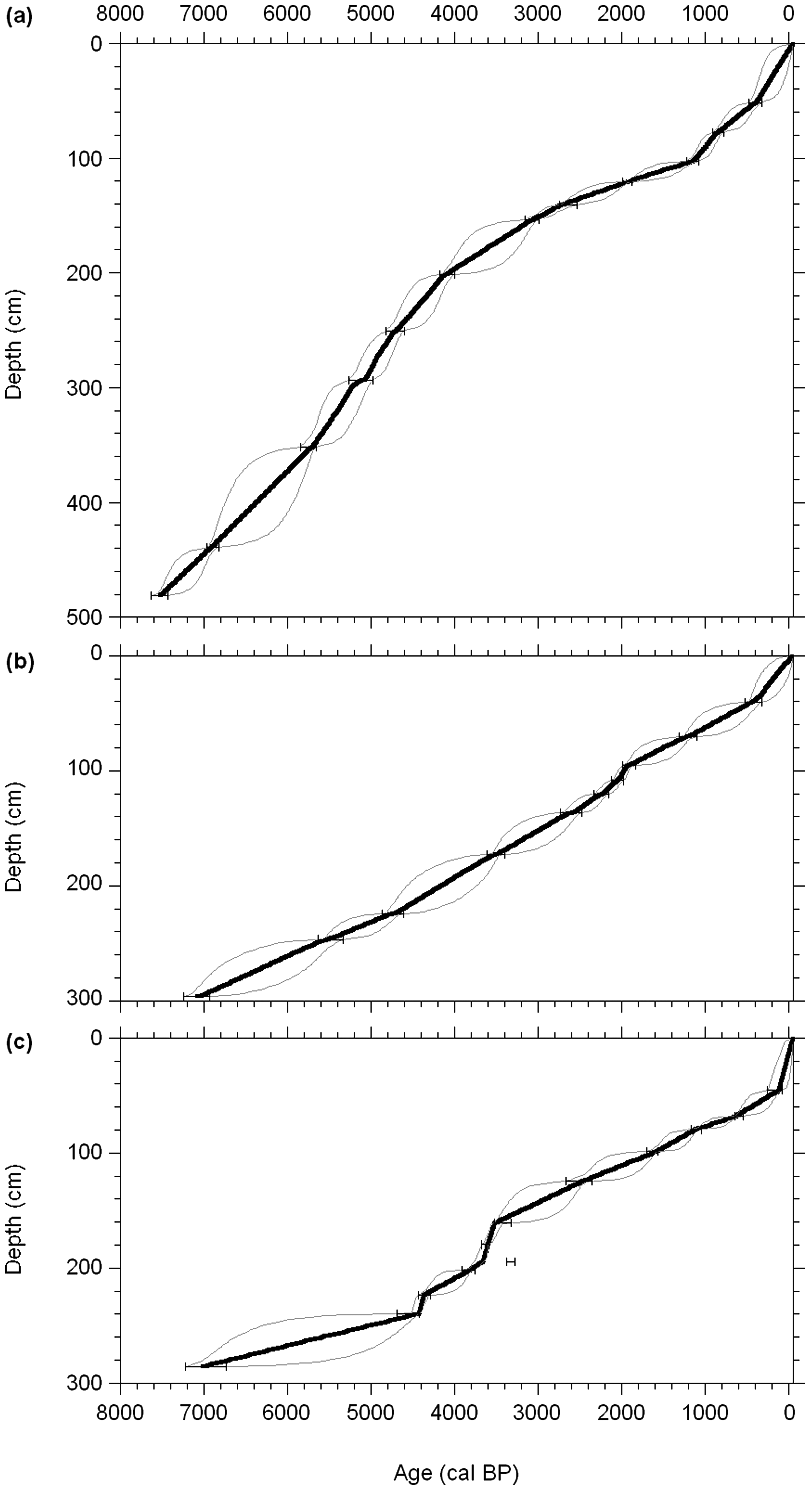
Age–depth models (solid black line). Grey lines mark the 95% confidence interval. (a) LLC; (b) MOS; (c) STE
LLC C accumulation rate, WTD, Sphagna presence and peat types. Sphagna shows Sphagnum sections Acutifolia (dotted line), Sphagnum (dashed line) and Cuspidata (solid line). Peat types are subdivided into Sphagnum peat (light grey), sedge peat (white), ligneous peat (dark grey) and unidentified organic matter (black)
MOS bog
Ecohydrological reconstructions
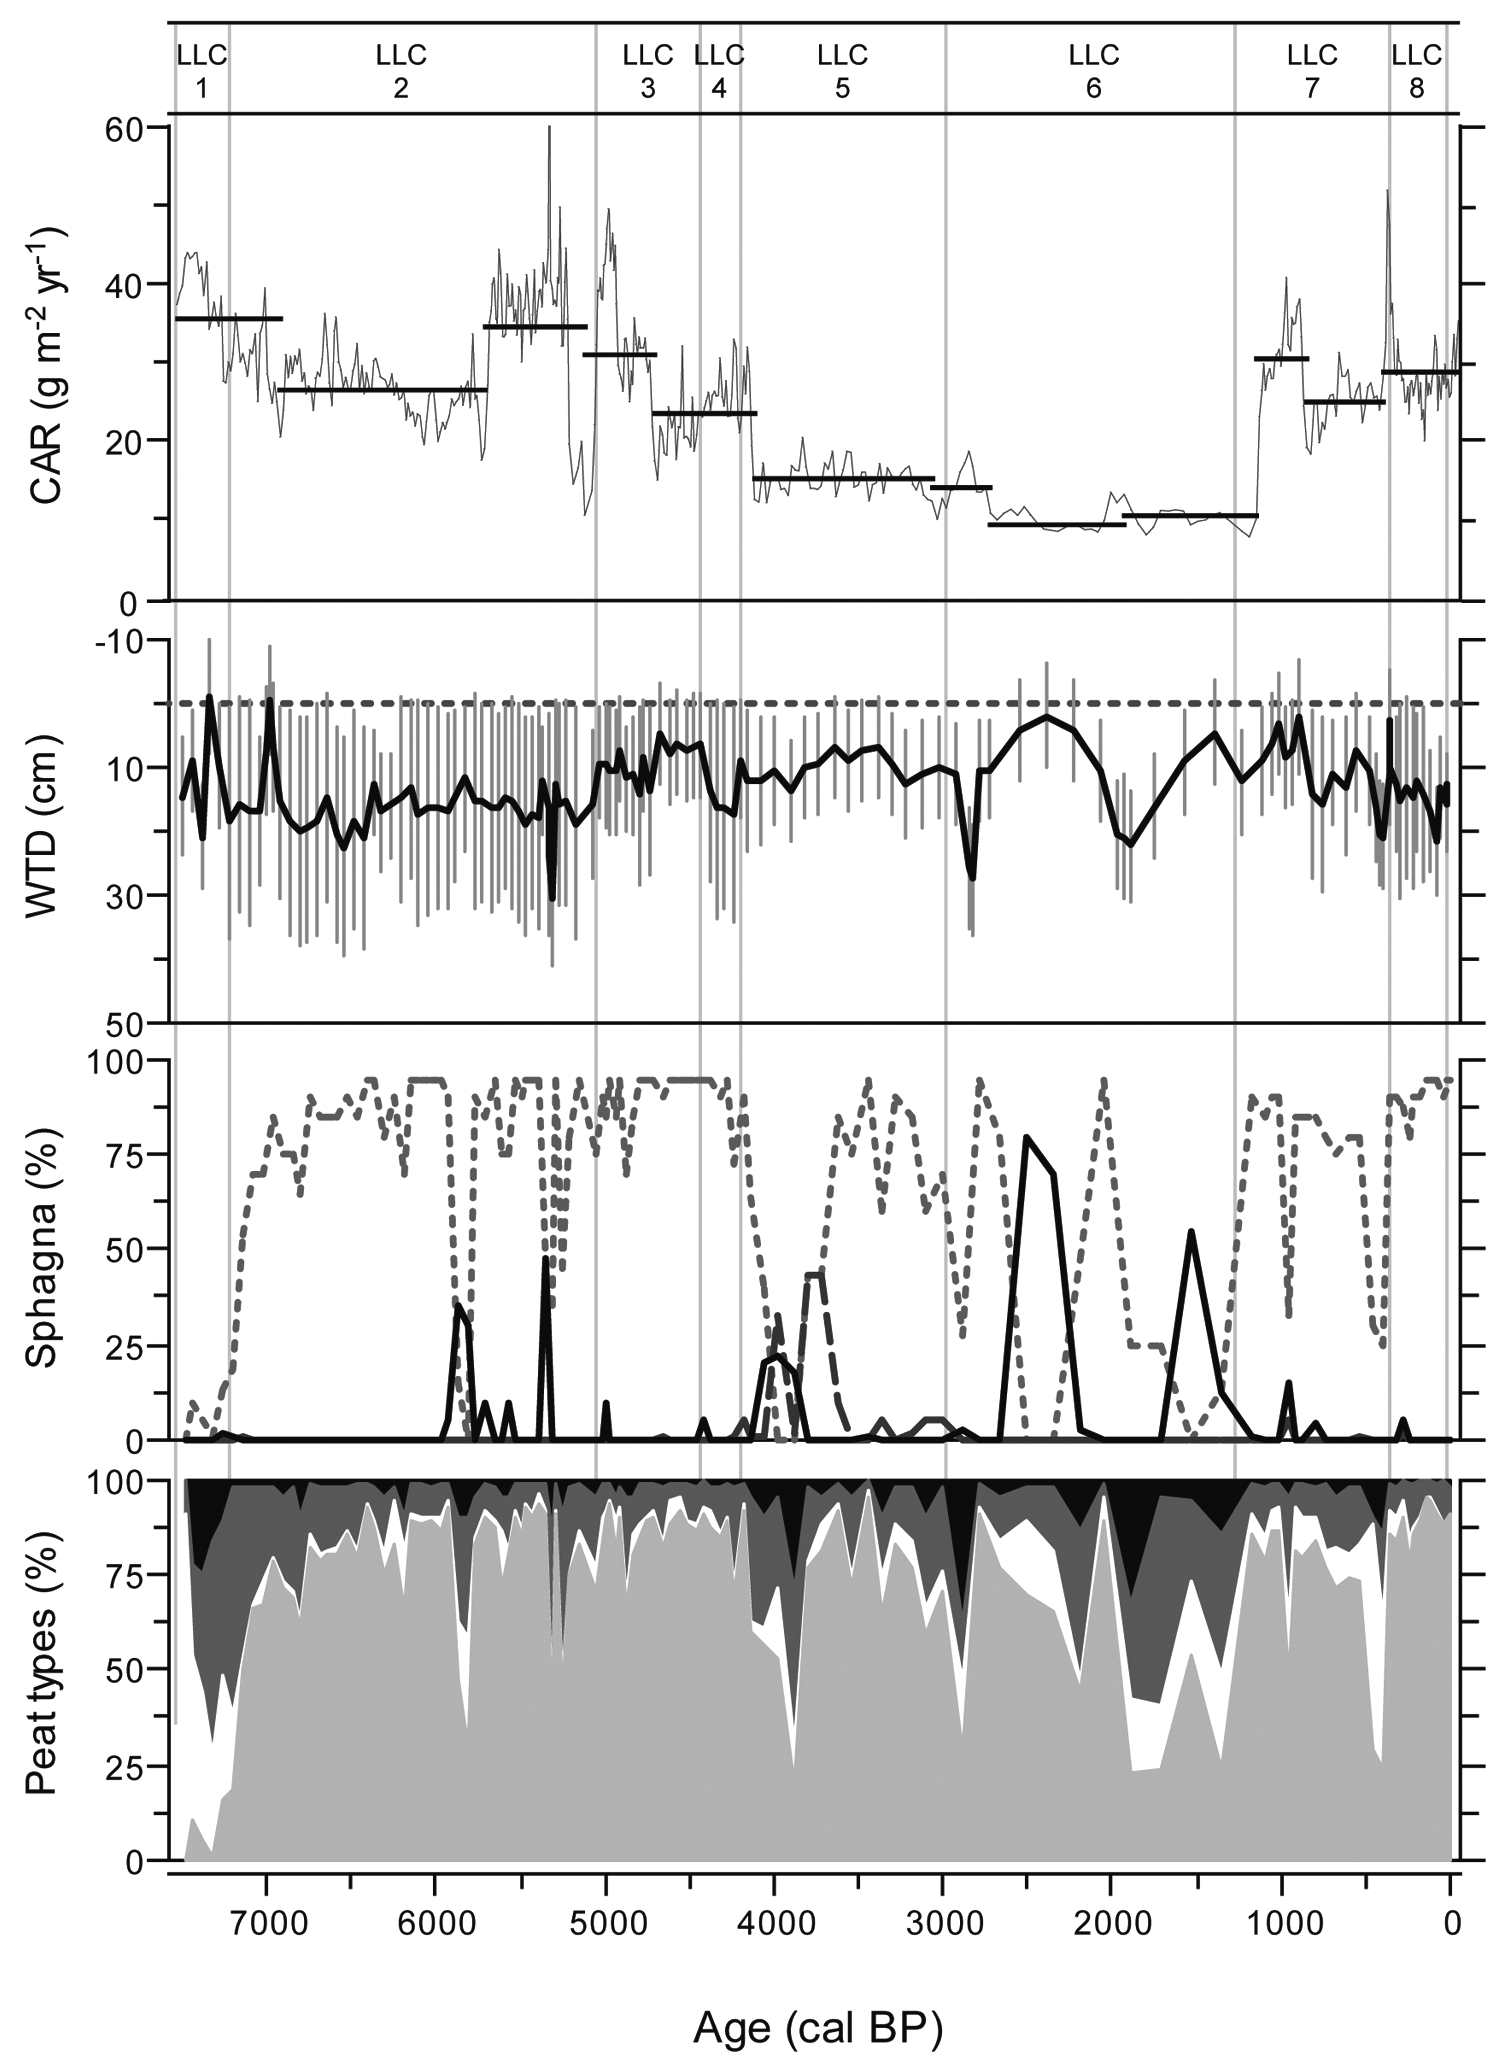
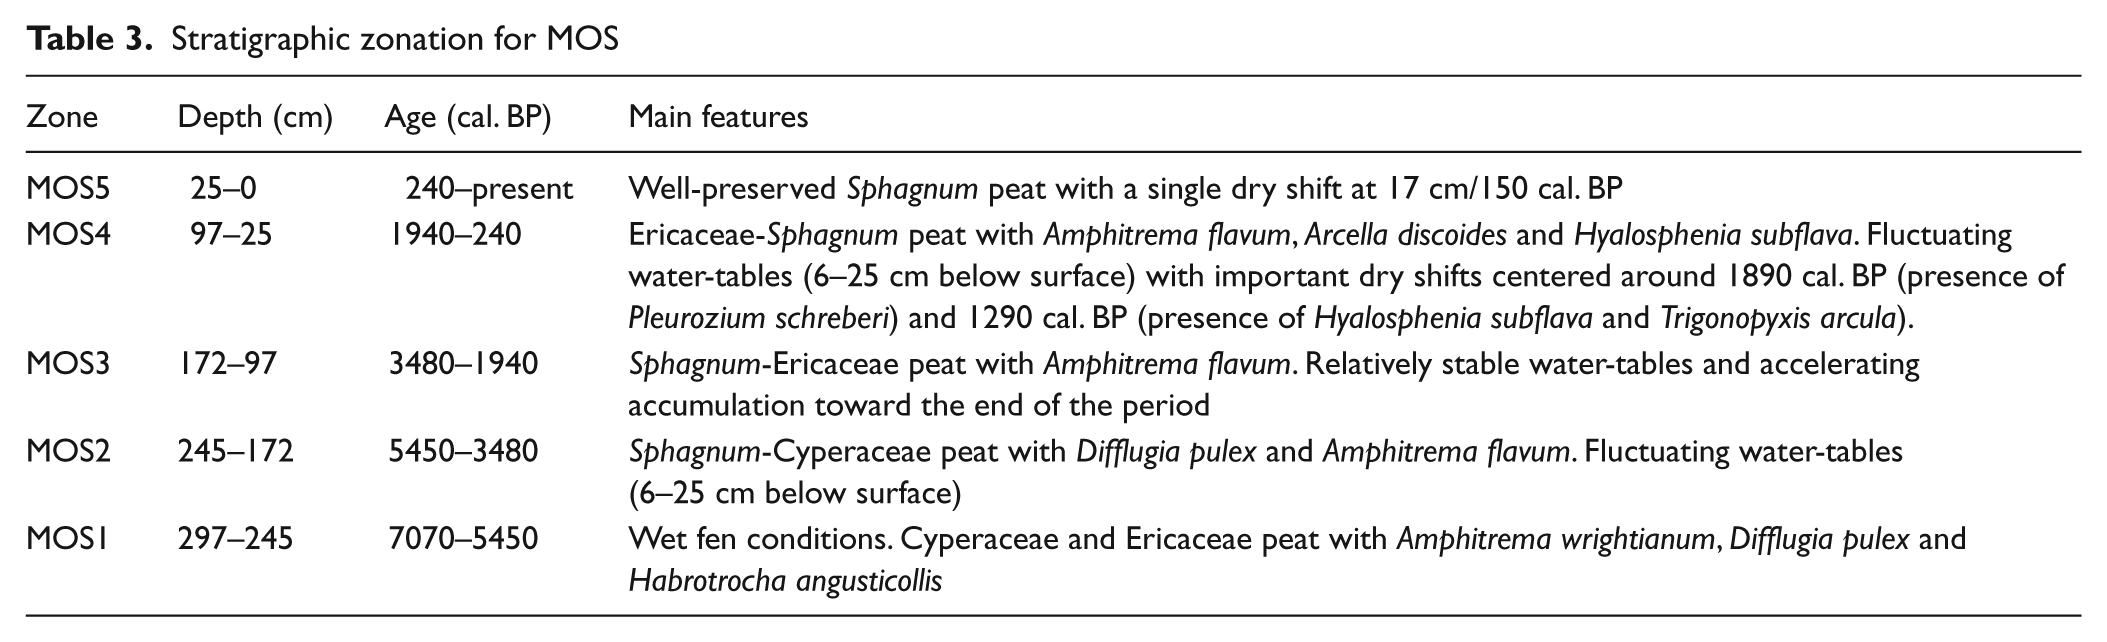
Plant macrofossil analyses suggest that Sphagna were less important in MOS than LLC (Figure 5). Sphagnum section Acutifolia, implying relatively dry local conditions, has been present during the Holocene, yet collapsed frequently at the expense of other Sphagnum sections, Cyperaceae or Ericaceae (Figure 5, Table 3). Following peat inception at 7070 cal. BP, fen conditions persisted until 5450 cal. BP with water-tables at the surface as indicated by high amounts of A. wrightianum, D. pulex and A. flavum (zone MOS1). Nevertheless, WTD reconstructions should be interpreted with caution as less than 75 specimens were counted in some samples. The mid Holocene (zones MOS2 and MOS3) is characterized by Sphagnum-Cyperaceae and Sphagnum-Ericaceae peat with D. pulex and A. flavum. Zone MOS4, starting around 1940 cal. BP, shows a general increase in Ericaceae, less dominant Sphagnum presence and sporadic Pleurozium schreberi around 1890 and 1000 cal. BP. Episodic low water-tables are encountered during this period, identified by H. subflava. Testate amoeba assemblages at these times are unusual, with large amounts of species associated to both rather wet (A. discoides and A. flavum) and dry optima (D. pulex, and H. subflava). Finally, a steady increase in Sphagnum section Cuspidata started ~240 cal. BP continuing until the present day, although a dry shift was marked by H. subflava presence around 150 cal. BP (zone MOS5, Table 3).
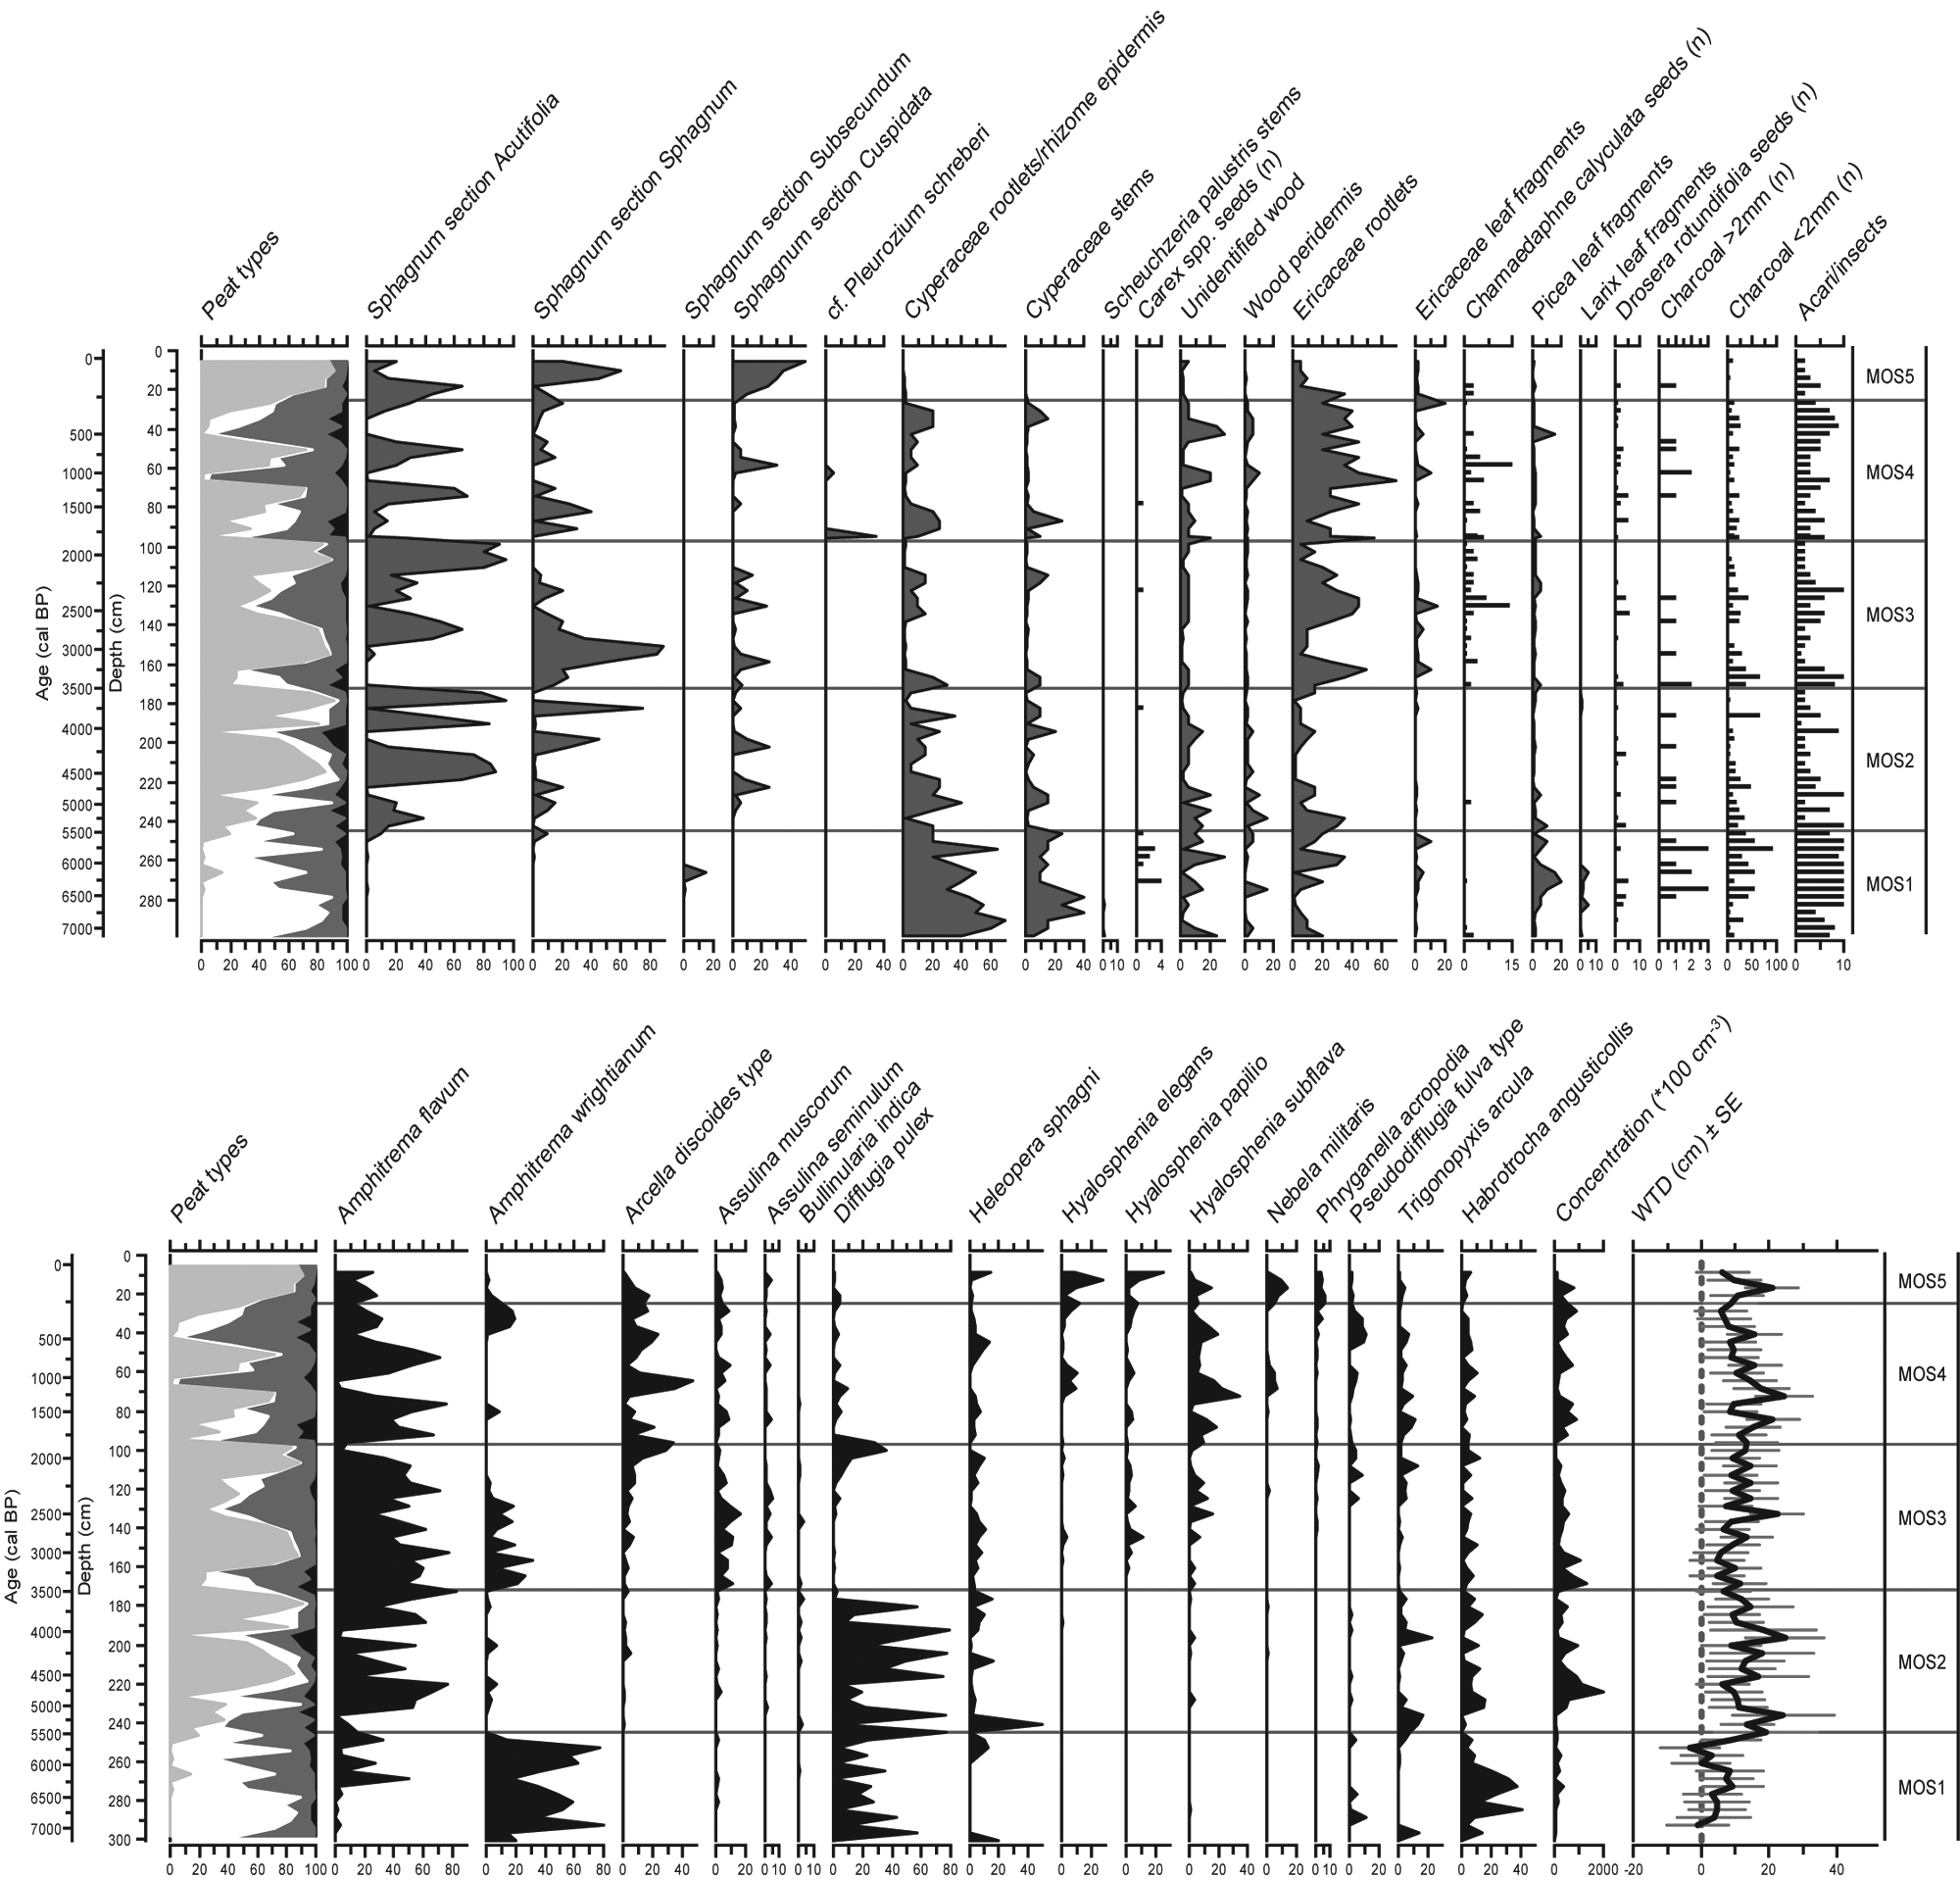
Plant macrofossil (upper) and testate amoeba diagram for MOS. Peat types are subdivided into Sphagnum peat (light grey), sedge peat (white), ligneous peat (dark grey) and unidentified organic matter (black). Amoeba quantities are expressed as percentages
Stratigraphic zonation for MOS
Carbon accumulation and biohydrological proxies
The MOS age–depth relationship is close to linear, lacking the slowdown of vertical accumulation that was evident at LLC (Figure 3b). Nevertheless, mean apparent C accumulation rate for MOS is substantially lower at 15.4 g/m2 per yr. Although MOS shows long-term variations in accumulation rates throughout the Holocene, trends are less clear than in LLC (Figure 6). In accordance, the vegetation record shows no clear long-term tendencies. C accumulation rates remained relatively stable between 10 and 20 g/m2 per yr from the start of local peat accumulation until the first half of zone MOS3 (~2700 cal. BP), followed by highest accumulation rates (17–32 g/m2 per yr) until the start of zone MOS4 at 1940 cal. BP. This peak is associated with an important presence of Sphagnum section Acutifolia and WTD averaging 9–14 cm, while decomposition, indicated by the amounts of UOM, was low. The lowest C accumulation rates of 12 g/m2 per yr and considerably fluctuating water-table levels are reconstructed for the period 1920–1180 cal. BP.
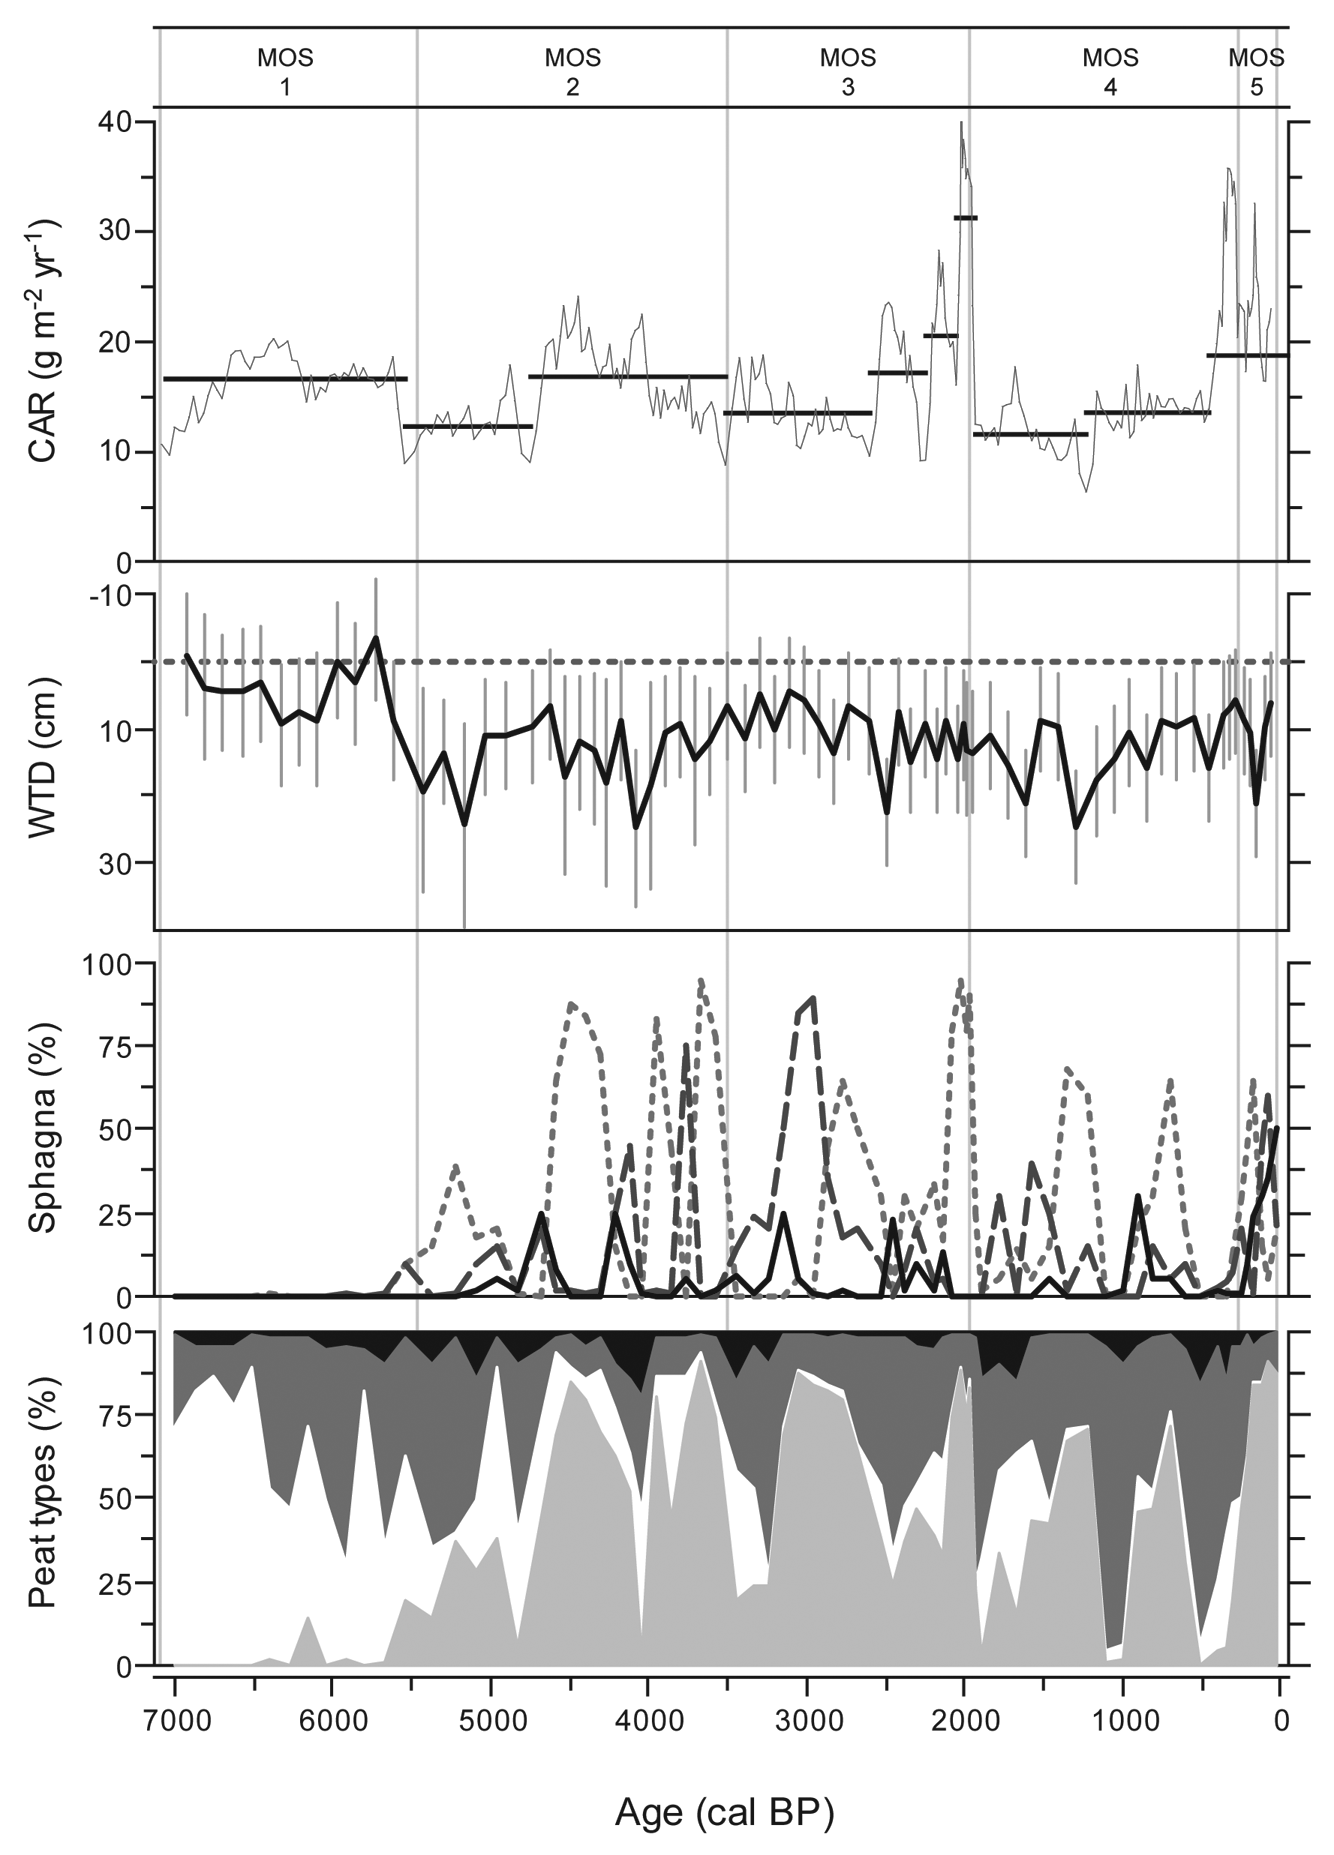
MOS C accumulation rate, WTD, Sphagna presence and peat types. Sphagna shows Sphagnum sections Acutifolia (dotted line), Sphagnum (dashed line) and Cuspidata (solid line). Peat types are subdivided into Sphagnum peat (light grey), sedge peat (white), ligneous peat (dark grey) and unidentified organic matter (black)
STE bog
Ecohydrological reconstructions
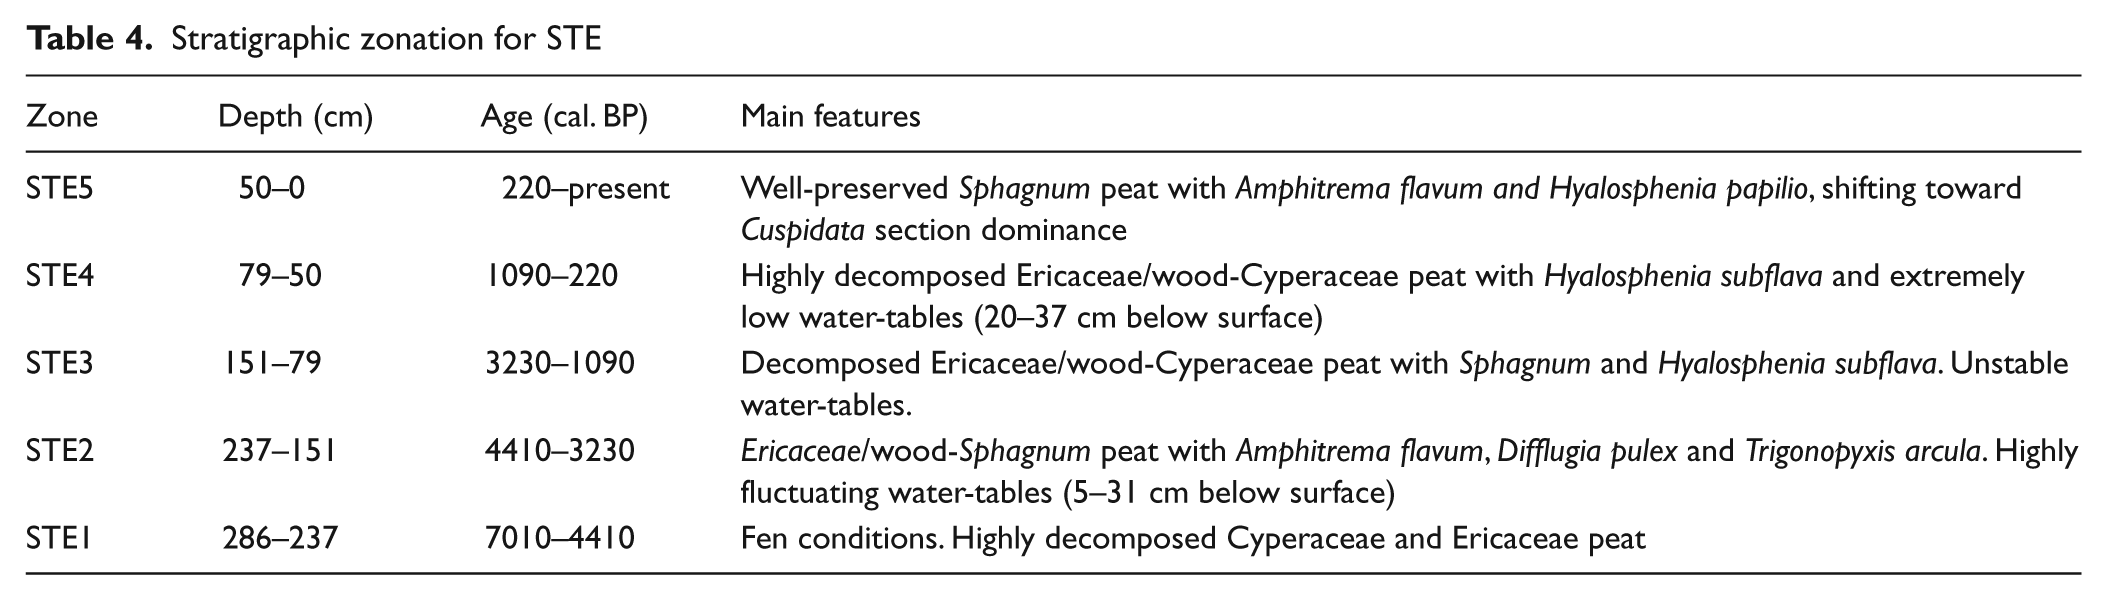
The entire sequence of STE has high amounts of Ericaceae/wood peat and, except for the upper 60 cm, low presence of Sphagna (Figure 7). As in LLC and MOS, A. flavum, D. pulex and H. subflava are the most frequent testate amoebae (Figure 7). In accordance with the dominance of ligneous vegetation, reconstructed water-table depths were generally lower than LLC and MOS and hydrological fluctuations showed high amplitudes. Peat accumulation started from 7010 cal. BP under minerotrophic conditions. High decomposition has resulted in very low countable quantities of testate amoebae for zone STE1 (Table 4). Of the three peatlands, STE shows the latest transition to ombrotrophy around 4410 cal. BP. Sphagnum section Acutifolia established during ombrotrophication and remained relatively important throughout zone STE2 until 3230 cal. BP. At the onset of STE3, Sphagnum section Acutifolia decreased, while Cyperaceae and H. subflava became more abundant. Extremely dry surface conditions, starting 1090 cal. BP, distinguish zone STE4 from adjacent zones, while water-tables remained between 25 and 37 cm below the surface from 990 to 450 cal. BP. During this period, H. subflava and D. pulex dominate the assemblages, and the vegetation cover was characterized by Ericaceae and Picea. A consecutive hydrological shift centered around 220 cal. BP allowed an accumulation of well-preserved Sphagnum peat (zone STE5).
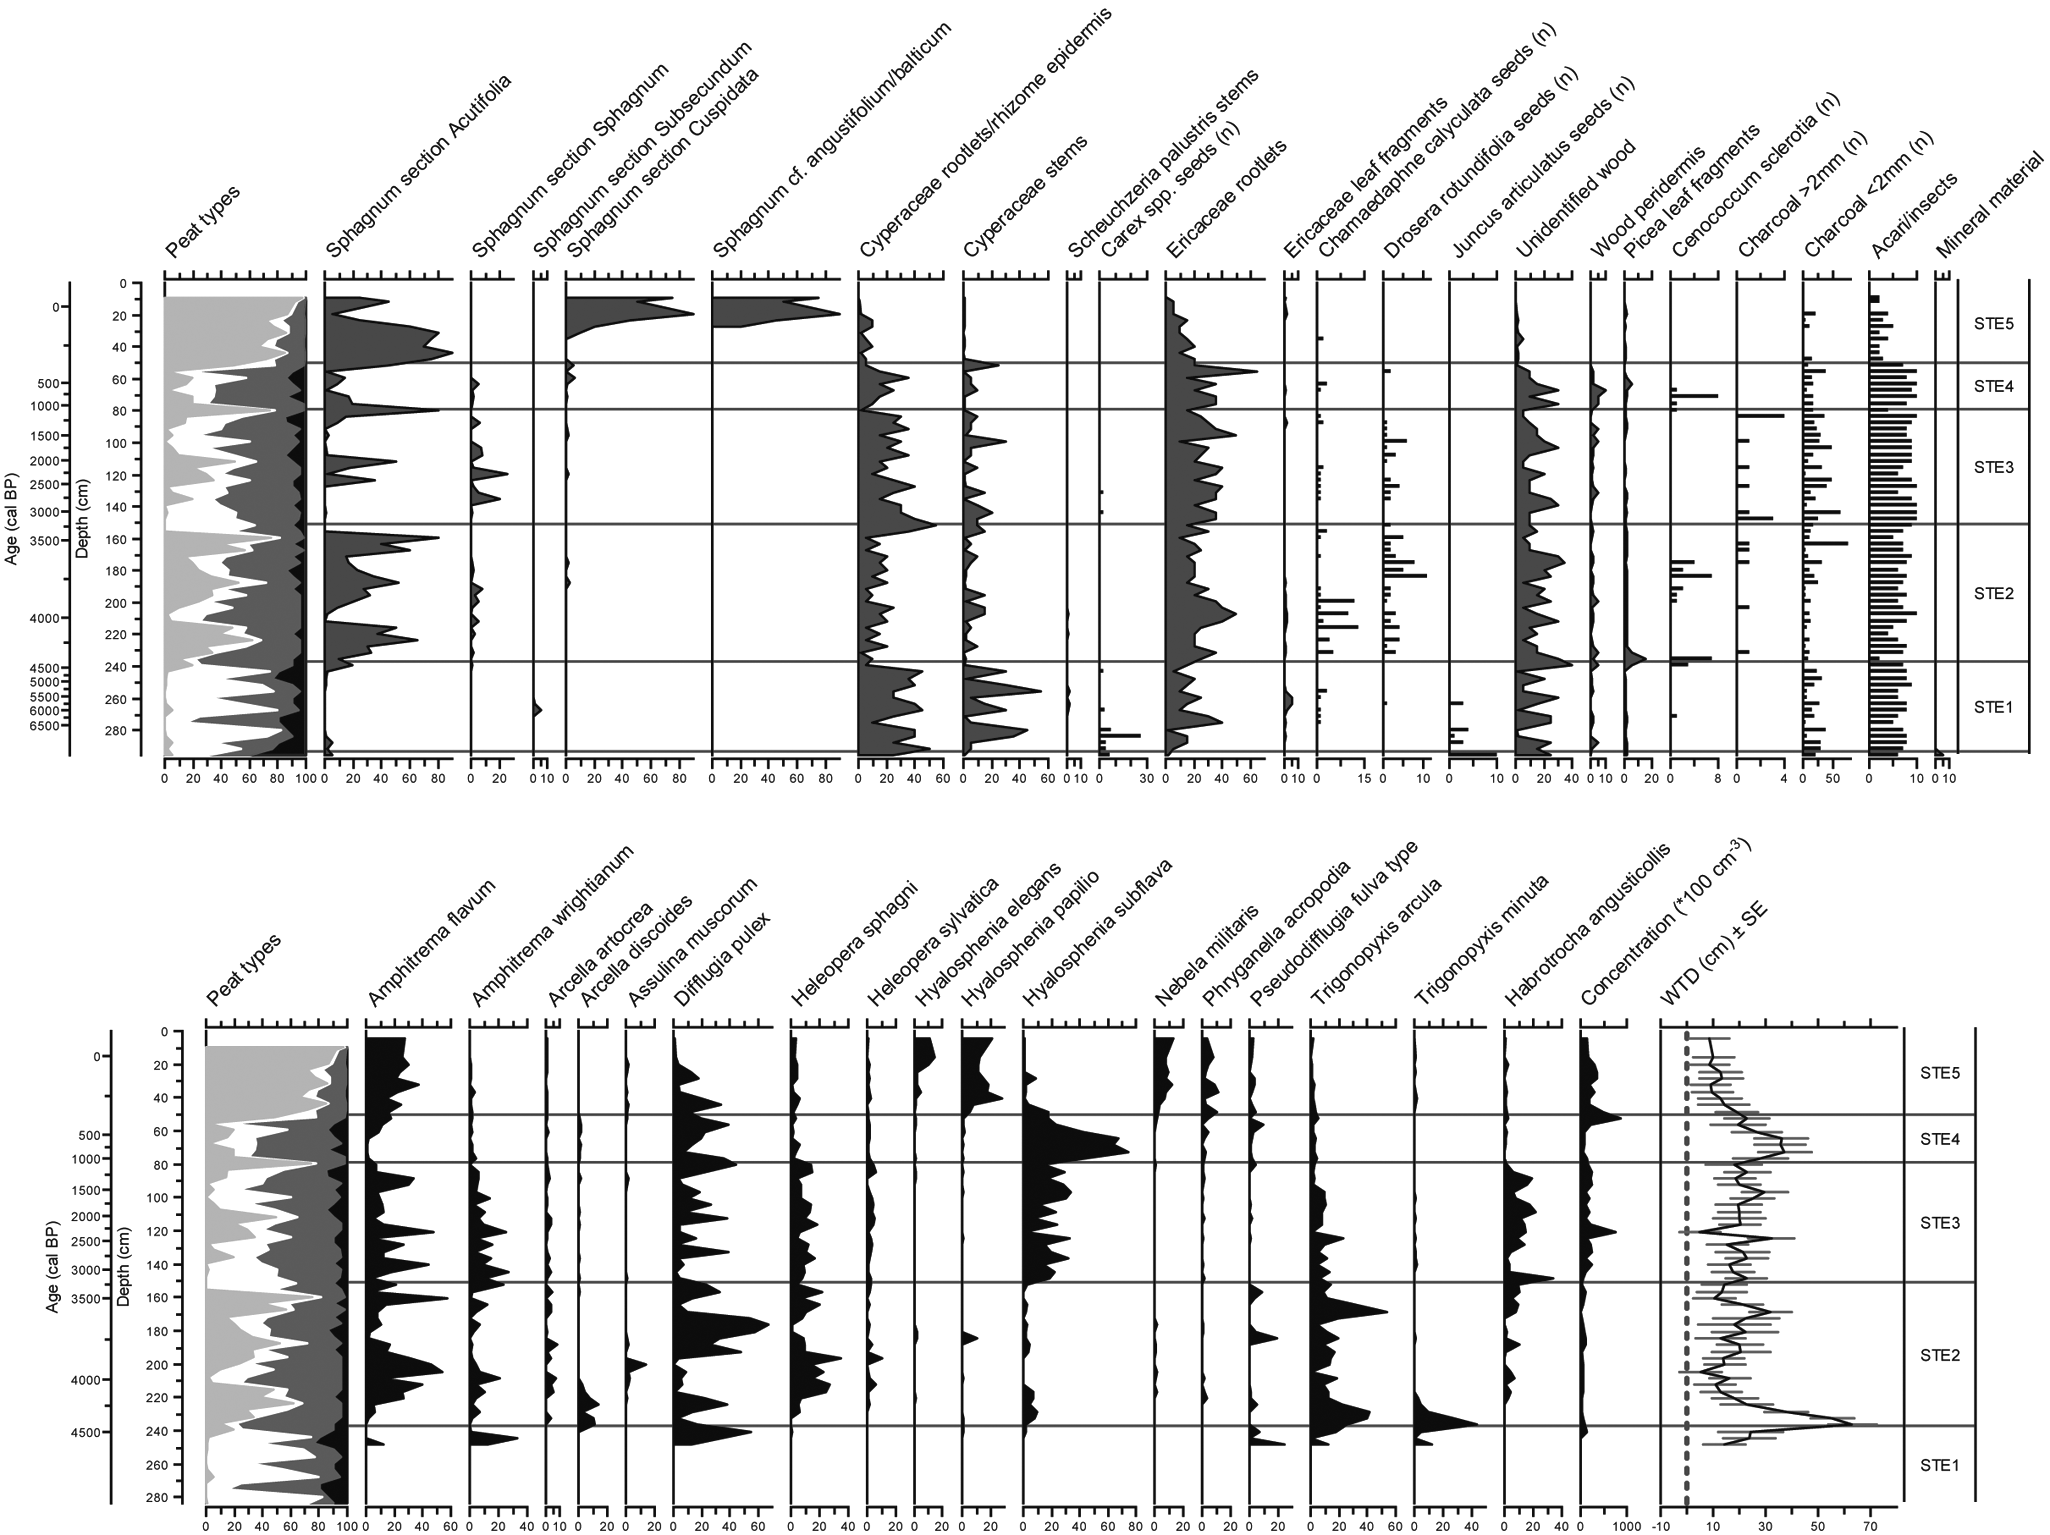
Plant macrofossil (upper) and testate amoeba diagram for STE. Peat types are subdivided into Sphagnum peat (light grey), sedge peat (white), ligneous peat (dark grey) and unidentified organic matter (black). Amoeba quantities are expressed as percentages
Stratigraphic zonation for STE
Carbon accumulation and biohydrological proxies
Peat accumulation in STE shows highly variable rates, with rapid accumulation during the mid Holocene (Figure 3c).With the exception of high rates during the mid Holocene, C has been sequestered continuously at 10–20 g/m2 per yr, resulting in a Holocene LORCA of 14.9 g/m2 per yr (Figure 8). The fen phase is associated with low sequestration rates (zone STE1). The subsequent mid-Holocene period of enhanced C accumulation shows abundance of Sphagnum section Acutifolia (Figure 8; zone STE2). The two peaks observed around 4410 and 3650 cal. BP are principally the result of reconstructed phases of rapid vertical accumulation of peat formed under dry conditions. Improbable sharp increases in C accumulation rates, associated with this highly decomposed peat, is likely the result of flaws in the age–depth model. Nevertheless, C sequestration rates were relatively constant during the major part of the Holocene. The 1110–620 cal. BP period of slow accumulation coincides with declining water-table levels and a persistent extremely dry peatland surface (WTD attaining 37 cm; zone STE4), while Sphagnum presence generally diminished and ligneous vegetation increased.
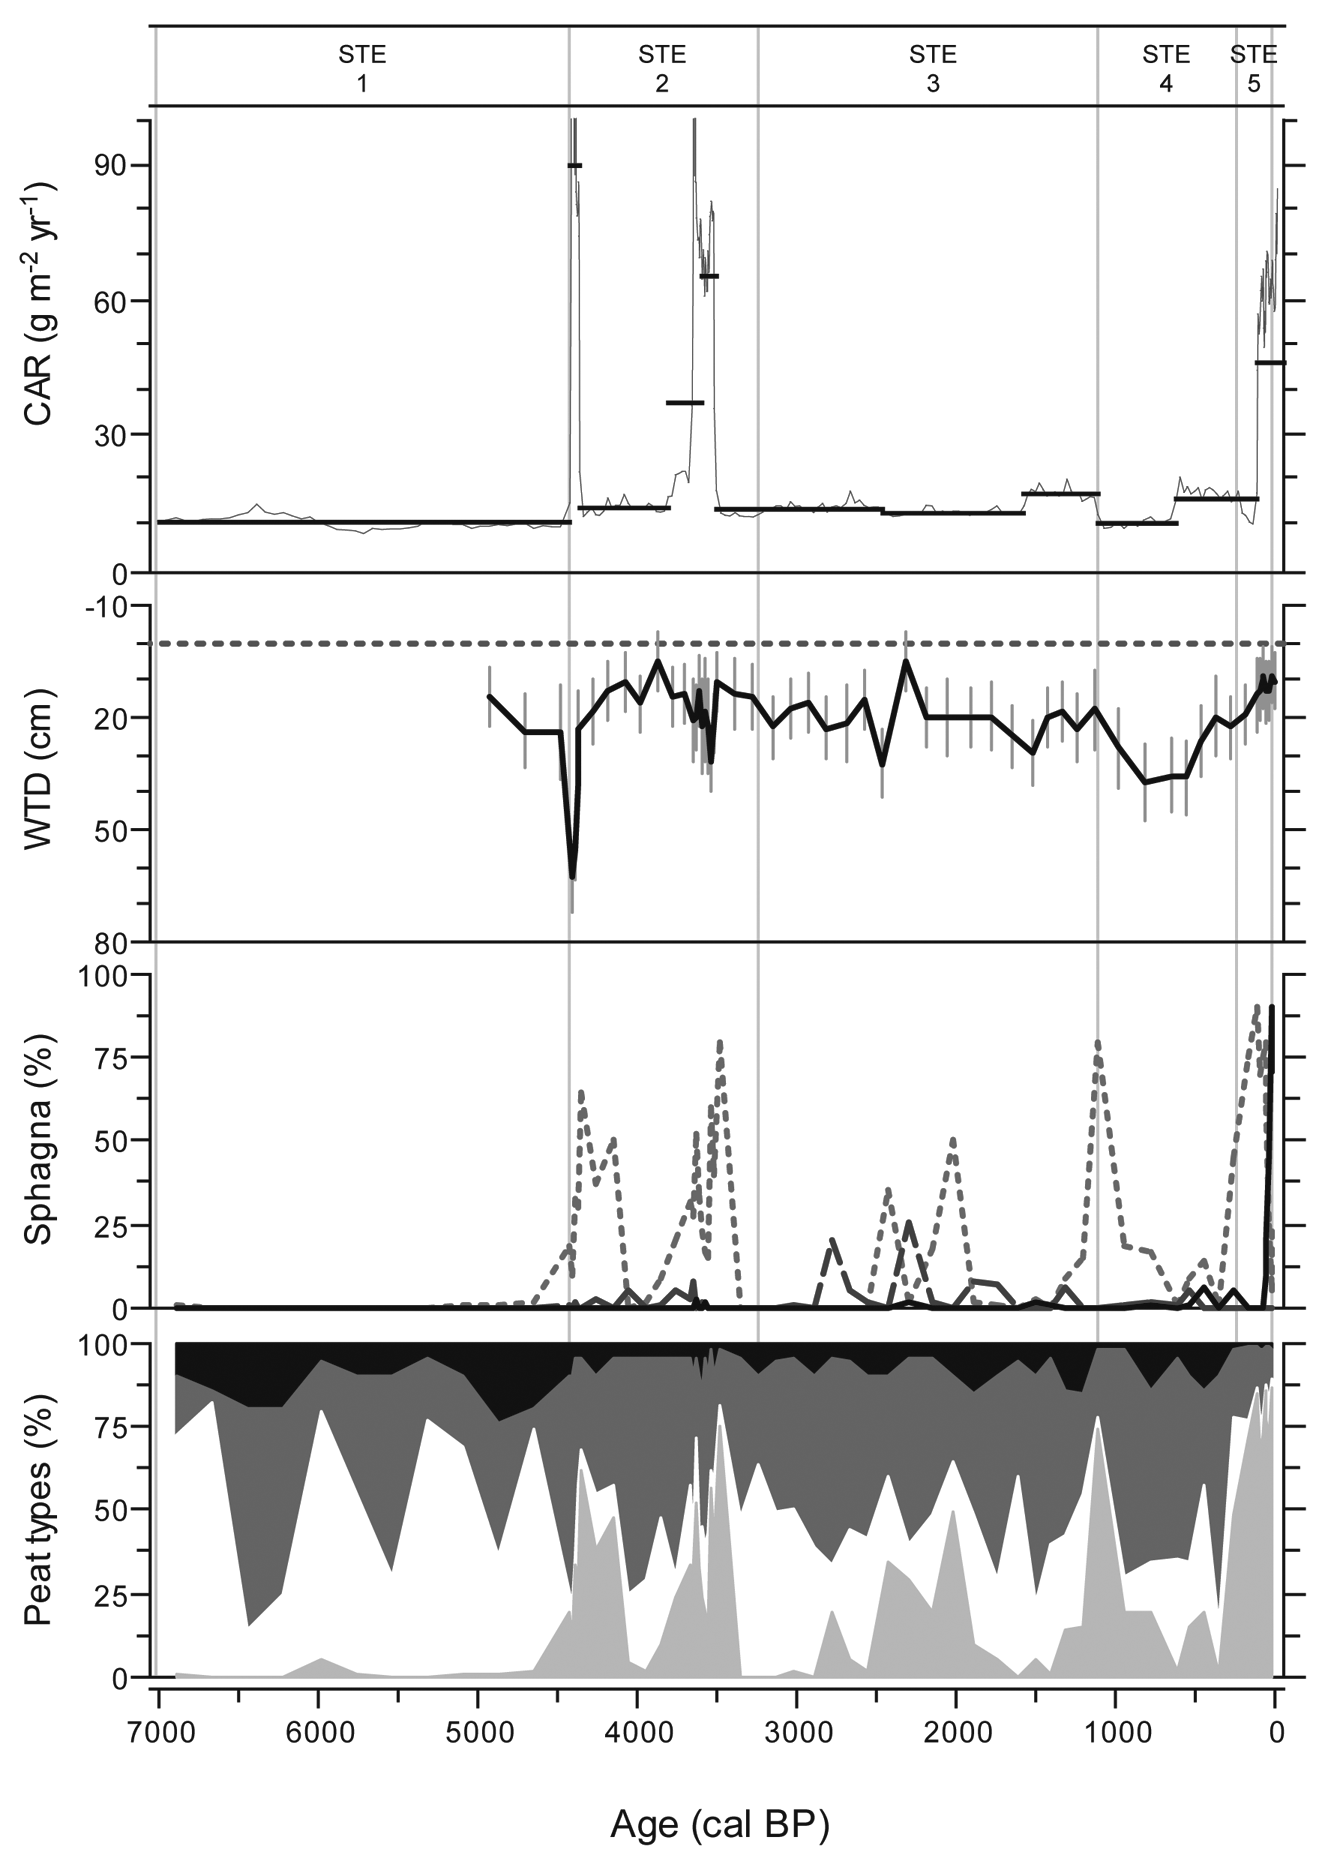
STE C accumulation rate, WTD, Sphagna presence and peat types. Sphagna shows Sphagnum sections Acutifolia (dotted line), Sphagnum (dashed line) and Cuspidata (solid line). Peat types are subdivided into Sphagnum peat (light grey), sedge peat (white), ligneous peat (dark grey) and unidentified organic matter (black)
Regional palaeohydrological variability: climatic influence
The compiled palaeohydrological reconstructions from the ombrotrophic portion of the three sites cover the last 4300 years. Although the uncertainty of our age–depth models complicates precise correlations among the sites, numerous hydrological shifts are observed since 3000 cal. BP at all sites. Within the uncertainty of our chronologies, at least seven dry and four wet events were probably registered regionally (Figure 9). Dry conditions were centered around 2790, 2500, 1910, 1290, 770, 400 and 140 cal. BP, with the dry events at 770 and 400 BP particularly well recorded by the three sites. Regional wet shifts appear to have occurred around 2330, 1390 and 930 cal. BP, and all sites indicate wetter conditions after ~150 cal. BP (Figure 9). In addition, MOS and STE records show increasing Sphagnum section Cuspidata during the last century, strengthening the interpretation of the testate amoeba record.
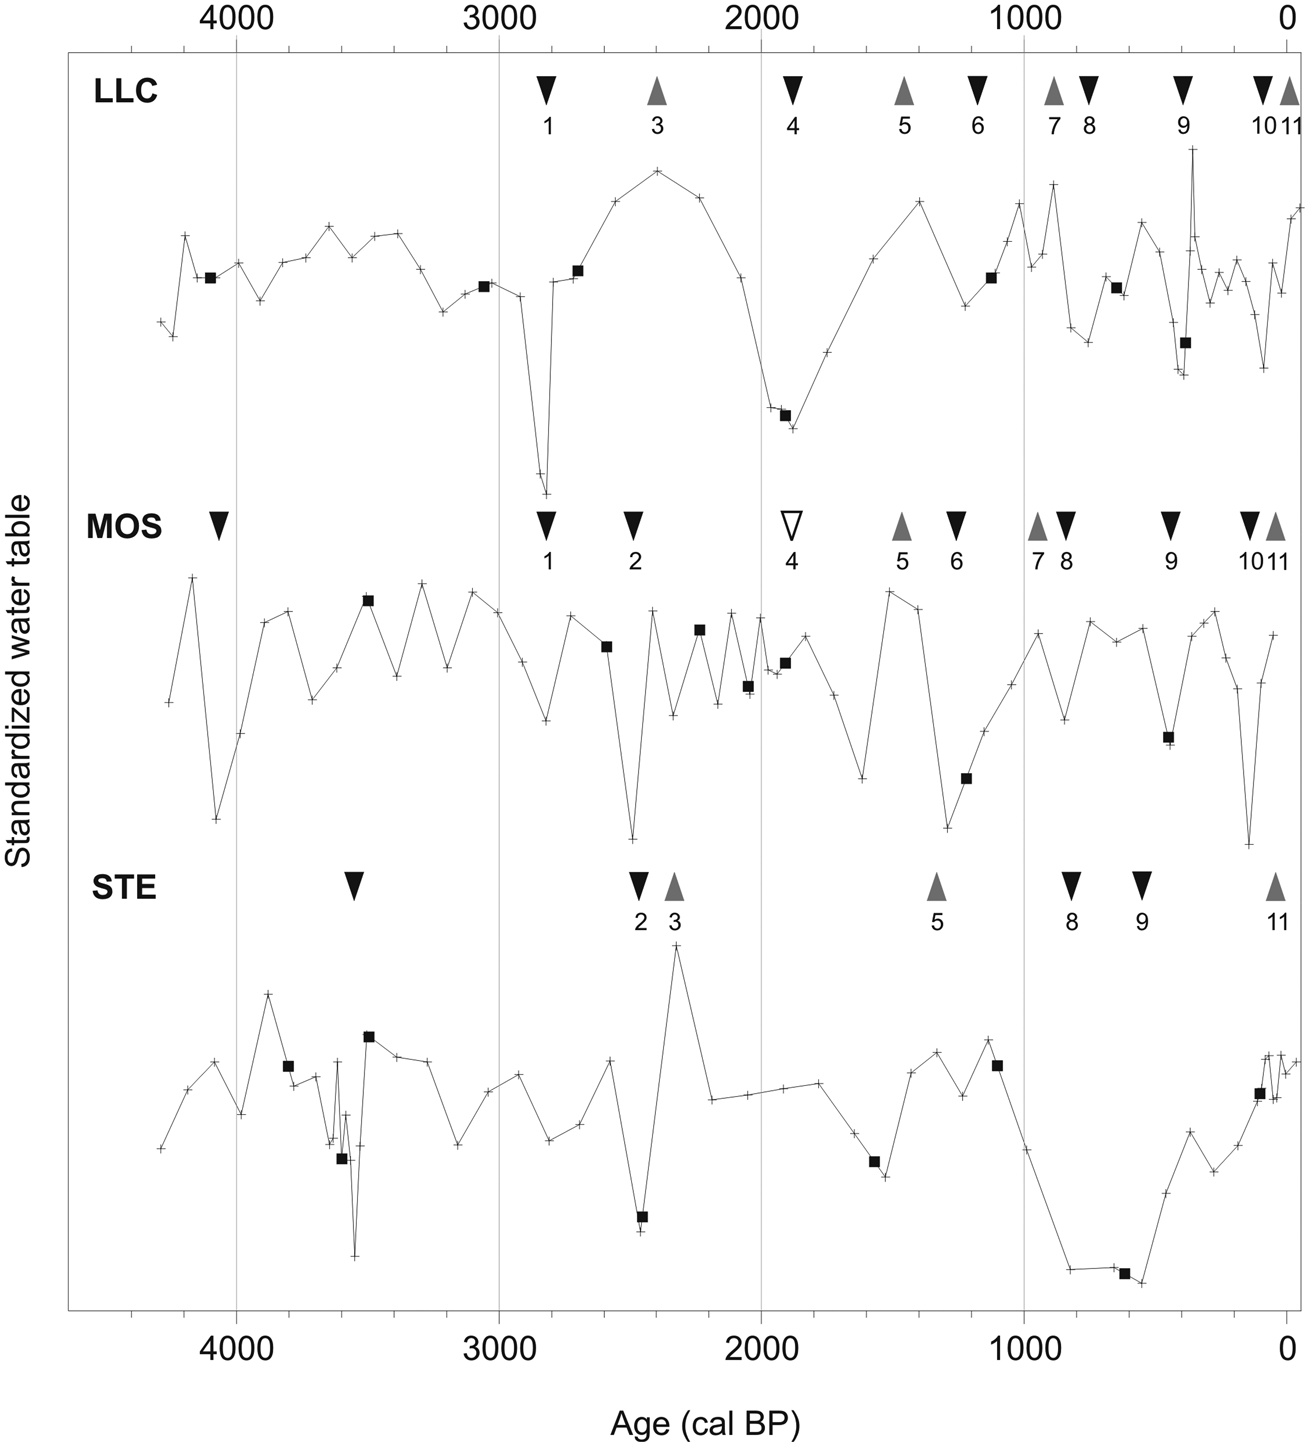
Detrended and normalized late-Holocene WTD reconstructions. Black triangles indicate dry shifts, grey triangles indicate wet shifts and open triangle indicates a dry shift that was observed from plant macrofossils only. Black squares show dated levels. Equally numbered shifts may be corresponding taking into account the 95% confidence interval for the level considered
Discussion
Linkages among long-term C sequestration, vegetation and hydrology
Although we may assume a uniform climatic history for the Eastmain region, the apparent rates and the timing of shifts in C accumulation are highly variable between peatlands. Mean Holocene LORCA has been higher in LLC with 22.6 g/m2 per yr compared with MOS and STE, with 15.4 and 14.9 g/m2 per yr, respectively. To be able to estimate causes for differential C sequestration patterns, the entire accumulation history and environmental context of each core should be taken into account. C accumulation rates have been higher during the early bog phases of LLC (zone LLC2, 7210–5040 cal. BP), when a combination of a persistent Sphagnum section Acutifolia cover and probably favorable mid-Holocene climatic conditions (Kaufman et al., 2004; Viau et al., 2006) allowed a rapid vertical accumulation. High rates of accumulation may have resulted of a limited decomposition because of the decay-resistant nature of Sphagnum section Acutifolia. Although climatic conditions would have been equally favorable for MOS and STE, Sphagnum could not yet become dominant in the local vegetation during this period as minerotrophic conditions persisted until 5450 cal. BP in MOS and 4410 cal. BP in STE. Globally, fens may be less efficient C sinks than bogs (Turunen et al., 2002), although C accumulation under minerotrophic conditions was high in LLC (>30 g/m2 per yr) and low in STE (7–14 g/m2 per yr). The lack of Sphagna during minerotrophic conditions likely contributed to the slow C sequestration in MOS and STE.
Of all the peatlands in this study, the most important temporal variations in C sequestration are observed in LLC (Figure 4), with a mid-Holocene (5790–4170 cal. BP) period of rapid accumulation and a late-Holocene (4170–1250 cal. BP) period of slow accumulation. The vegetation record shows a similar subdivision with a relatively stable Sphagnum cover that collapsed repeatedly between 4000 and 1300 cal. BP. The compilation of all stratigraphic data shows that C accumulation rates declined simultaneously with a rise in mean water-table of ~10 cm at the onset of LLC3 (5040 cal. BP), although vegetation composition remained stable until 4170 cal. BP (Figure 6). This may indicate that diminishing C sequestration was driven primarily by a shift in WTD, that was exacerbated when Sphagna finally collapsed after 4170 cal. BP. An initial persistence of relatively high water-tables may have exerted a stress on Sphagnum section Acutifolia, followed by a replacement by other Sphagnum sections and Cyperaceae and a continued slowdown of C accumulation.
Furthermore, slowest C sequestration in LLC between 2960 and 1250 cal. BP was characterized by fluctuating water-tables (zone LLC6). Extremely low water-tables cause a slow passage of organic matter through the acrotelm, resulting in a high decay potential. Moreover, hummock Sphagna NPP may decrease as a result of shading as Ericaceae cover increases (Heijmans et al., 2001). On the other hand, extremely high water-tables may enhance microtopographical gradients by expanding wet hollows and increasing hummock height (Swanson, 2007). In addition, wet bog surfaces are associated with bryophytes that are sensitive to decomposition. Fluctuating water-tables may have caused testate amoeba assemblages consisting of H. subflava and A. discoides as observed in MOS4. A. discoides is typically most abundant in wet habitats whereas H. subflava is characteristic of drier habitats (Booth, 2008), but the co-dominance of the two has been observed in several studies and may be the result of high seasonal-to-interannual variability in moisture (Booth et al., 2008; Charman et al., 2007; Sullivan and Booth, 2011). Indeed, maximum C accumulation has been associated with an acrotelm thickness of 10–15 cm, typical for lawns or low hummocks (Belyea and Clymo, 2001).
Different vegetation and fluctuating water-tables may partially explain the differences in C sequestration during the bog stages within LLC as well as differences between the sites. Previous research showed that LLC bog has a strong surface topography gradient at ~5 m/km that may have supported efficient general drainage (van Bellen et al., 2011), which may have contributed to more stable ombrotrophic conditions and hummock Sphagna cover.
Neoglacial cold conditions could have further limited accumulation in LLC by lowering primary production and limiting the duration of the growing season (Mauquoy et al., 2002a). Cooling conditions leading to decreased NPP have been reported from tree stands close to the Eastmain region after 4650 cal. BP (Arseneault and Sirois, 2004). Although decreasing C accumulation rates are perceptible between 1430 and 1180 cal. BP in MOS and 1070 and 660 cal. BP in STE, climate-driven depressed primary production may have been less important in these peatlands, as C sequestration was already limited because of the absence of an important Sphagnum cover.
The long-term effect of climate on NEP may be illustrated by large spatial patterns of peatland C storage (Yu et al., 2009). C accumulation rates have an optimum in the ‘temperature-precipitation space’ at 0–2.5°C mean annual temperature (Yu et al., 2009) and generally diminish following nordic and oceanic gradients in Quebec, i.e. from a cool and moist to a cold and dry regime. Thus, it is likely that Neoglacial conditions have limited C sequestration in peatlands within the northern Quebec climatic context. Studies on boreal and subarctic Quebec peatland C accumulation indeed show a general slowdown of accumulation during the Neoglacial cooling. Beaulieu-Audy et al. (2009) showed declining rates of peat accumulation starting around 4000 cal. BP in northern Quebec. Providing late-Holocene records, Loisel and Garneau (2010) obtained minimum C accumulation of <10 g/m2 per yr from two cores in MOS peatland during the 2500–1000 cal. BP period.
Corresponding dry and wet shifts registered in Eastmain region peatlands may imply a climatic forcing that limited C sequestration. However, inconsistencies between the studied sites show that internal factors are likely to have mediated external forcing of C sequestration at varying intensities. Reconstructions of Eastmain peatland C accumulation at the ecosystem scale have already shown that long-term peatland development is affected by site-specific factors such as basin topography (van Bellen et al., 2011).
Late-Holocene climate change in the Eastmain region
The replicated shifts in peatland WTD may indicate an enhanced climatic influence on ecosystem functioning since 3000 cal. BP. Ombrotrophic peatland hydrology is directly linked to the balance between precipitation and evapotranspiration, although the respective importance of precipitation and temperature to this balance may vary between regions and climatic regimes and even in the course of peatland development (Booth, 2010; Charman et al., 2009). The combined records of water-table fluctuations show that during the late Holocene (3000 cal. BP–present) hydroclimatic conditions may have been less stable than during the mid Holocene (7000–4000 cal. BP) (Figure 9). However, comparison of the two periods is complicated for several reasons. First, we do not have a combined record that covers the entire mid Holocene. In addition, different stages in long-term peatland development may have differential sensitivities to external factors. Finally, the comparison of the frequency, duration and timing of hydrological shifts between mid and late Holocene is complicated by lower temporal resolution of the late-Holocene record and the larger age uncertainty for mid-Holocene shifts. Relatively low-resolution analyses, with one sample each 4 cm, may imply that some dry shifts may have been missed. In an eastern Newfoundland peatland, Hughes et al. (2006) found high-frequency hydrological variability during the mid Holocene, possibly related to global climatic instability. However, regional differences in hydroclimatic context and concomitant differential sensitivity to climatic driving factors likely hamper direct comparisons of Newfoundland and James Bay region records.
In northeastern Canada, cooling climatic conditions are associated with the intrusion of dry Arctic air masses (Carcaillet and Richard, 2000; Girardin et al., 2004). Hence, past cooling events may have been concomitant with a decrease in both annual precipitation and potential evaporation, resulting in contrasting effects on peatland water-tables. Eastern Canadian climate history can be summarized by a mid-Holocene thermal maximum (Kaufman et al., 2004; Viau et al., 2006) and a gradual cooling trend that started between 5000 and 4000 cal. BP (Arseneault and Sirois, 2004; Filion, 1984; Kerwin et al., 2004). This Neoglacial period affected the distribution of boreal ecozones with more severe fire events (Ali et al., 2008, 2009; Arseneault and Sirois, 2004; Asselin and Payette, 2005; Payette and Gagnon, 1985), whereas permafrost gradually developed in subarctic Quebec peatlands (Bhiry and Robert, 2006; Bhiry et al., 2007; Lamarre, 2010). This period may have been characterized by humid climatic conditions as shown by regional increases in lake levels (Miousse et al., 2003; Payette and Filion, 1993). In addition to Neoglacial cooling, the ‘Medieval Warm Period’ (MWP), centered around 1000 cal. BP (Filion, 1984) and subsequent LIA cooling have been registered in northern Quebec ecosystems (Bhiry and Robert, 2006; Viau and Gajewski, 2009). Recurrent LIA cold/wet shifts have been observed in peatlands in northern Europe (De Vleeschouwer et al., 2009; Mauquoy et al., 2002b), coinciding with solar activity minima centered around
Given the solid indications for long-term regional late-Holocene cooling and assuming that summer precipitation is more important to bog surface moisture than winter precipitation, the replicated dry surface events may be interpreted as forced by cold-dry climatic shifts. Indeed, the reconstructed dry shifts 8, 9 and 10, dated around 770, 400 and 140 cal. BP, correspond to reported northern Quebec LIA cooling episodes. Previous research in LLC showed similar dry shifts between 1370–1070, 870–560 and 530–350 cal. BP (Loisel and Garneau, 2010), while cooling-associated wet shifts were reconstructed in a peatland in Newfoundland around 600 and 200 cal. BP (Hughes et al., 2006). The 1370–1070 cal. BP shift from Loisel and Garneau (2010) corresponds to dry shift 6 (Figure 9), whereas the subsequent events coincide with shifts 8 and 9. Given the replicability and the extent of drying, we hypothesize that dry events have been amplified by a decadal persistence of frozen peat horizons. Some of the rapid shifts to near-surface water-tables that followed these dry episodes (e.g. observed around 2400 cal. BP in STE, 360 cal. BP in LLC, as well as the ongoing rising water-table in MOS), might thus be triggered by a collapse of frozen horizons. Melting effects may have been amplified by an autogenic effect: an anterior dry bog surface caused enhanced decomposition that concomitantly decreased hydraulic conductivity of the acrotelm peat, resulting in a potential for rapidly rising water-tables and an extremely wet peatland surface. For instance, this autogenic effect may have amplified the effect of wetter climatic conditions causing high water-tables (wet shift 11) since the end of the last LIA episode (Girardin et al., 2006; Payette et al., 2004).
Peatland thermokarst features are presently close to the Eastmain region, whereas the actual southern limit of sporadic peatland palsas is located ~140 km northward (Thibault and Payette, 2009). Although these residual palsas are not in equilibrium with present-day climate, past climatic variability might have been large enough to have caused episodic frozen peatland surfaces in the Eastmain region. Nevertheless, except for testate amoeba-inferred extremes in WTD, associated dry-indicating vegetation assemblages and horizons of highly decomposed peat, we have no evidence for the past occurrence of persisting frozen peat in the Eastmain region. It is likely that LIA cooling resulted in declining C sequestration rates (Mauquoy et al., 2002a), although high-resolution dating control is essential for confirmation.
Conclusion
Holocene peat C accumulation rates in three peatlands of the Eastmain region have been spatially and temporally highly variable, with Holocene averages between 14.9 and 22.6 g/m2 per yr. Rapid sequestration is associated with phases of important Sphagnum section Acutifolia presence during the warmer mid Holocene, whereas low rates occur during the late Holocene, when Cyperaceae and ligneous vegetation were abundant and water-table levels showed high-amplitude fluctuations. However, high variability in C accumulation patterns implies a complex ecosystem response to driving factors and thus understanding of the interaction between climate, water-table levels and vegetation mediated by local factors is essential in explaining differential tendencies. Varying patterns of C sequestration within the climatically uniform Eastmain region show that differential timing in ombrotrophication between coring sites may have been critical for patterns of long-term C sequestration.
Coinciding extremes in WTD may indicate the presence of seven cold/dry events in the region since 3000 cal. BP. Possibly a result of a more accurate chronology towards the present, three LIA cooling events may be best represented in the stratigraphy as indicated by (extremely) dry peatland surfaces. Given the past proximity of peatland palsas, episodes of persisting frozen peat might have contributed to the important water level drawdown in the studied peatlands.
Footnotes
Acknowledgements
We thank H. Asnong, P.-L. Dallaire and C. Vaillancourt for field assistance and D. Charbonneau, N. Cliche Trudeau, M. Hayes and A. Tadros for assistance in the laboratory. Thanks to the hydroclimatological scenarios team of the Ouranos consortium for providing climate data by manipulation of 1971–2003 NLWIS data. We thank P. Hughes and an anonymous reviewer for comments on a previous draft. We appreciate the moments of discussion with Les Tourbeux.
Funding was provided by Hydro-Quebec Production through the EM-1 Project Reservoirs’ net greenhouse gas emissions research project (2005–2009).