






Abstract
An automated layer counting technique is developed to estimate the chronology of a marine sediment core and this technique is validated with Pb210 chronology. The marine sediment core was sampled in front of the delta of Mittivakkat Glacier meltwater river in the Sermilik Fjord, SE Greenland, and is a proxy of the sediment delivery from a glacial drainage basin to a fjord. The estimated time series was based on automatic lamination detection (varves) on a line scan of the core using gray scale intensities, and covered the last two centuries. The estimated time series of sediment accumulation rates was coupled to modelled runoff from the Mittivakkat Glacier and compared with local climatic parameters (air temperature and precipitation) and with the Atlantic Multidecadal Oscillation (AMO) index. Maxima in the sediment accumulation rate at the bottom of the side-fjord, about 1 km from the delta, mostly depended on glacier ablation and consequently on changes in river runoff, which were initiated by the air temperature. This was especially the case during transition from colder periods towards warmer, where short-lived maxima in sediment accumulation rates were followed by lower rates, even though the temperature remained high. This suggested a quite rapid glacial response to changes in climatic forcing, and/or a hysteresis effect, where sediment stored in the glacier/valley system was evacuated soon after a temperature dependent increase in discharge. The air temperature was in turn controlled by the AMO index.
Keywords
Introduction
Greenland has experienced a significant warming during the past decades (e.g. Box et al., 2010; Comiso, 2006), and mass loss from the Greenland Ice Sheet and smaller Arctic glaciers contributes significantly to global sea level rise (e.g. Intergovernmental Panel on Climate Change (IPCC), 2007). The exact level of glacial mass loss is still under debate, but the Greenland Ice Sheet has a negative mass balance and the rate of mass loss has been increasing over the last decade (Wake et al., 2009). Meanwhile, local arctic glaciers have receded markedly in recent years. Average retreat rates of the Mittivakkat Glacier in SE Greenland were about 14.4 m/yr between 1900 and 2009 or 18 m/yr since 1933 (Mernild et al., 2011a). However, it is uncertain if the recent accelerated mass loss is exceptionally high in comparison with the rates in the last centuries, or if it owes its origin to quasi-cyclicity in climatic forcing.
This paper investigates the sediment delivery to the marine realm from a glaciated catchment. It uses an automated layer counting technique to estimate the chronology of a marine sediment core and this technique is validated with 210Pb chronology. The sediment core is sampled in the Sermilik Fjord (SE Greenland) in the proximity of the river delta that is fed by meltwater from the Mittivakkat Glacier. The coastal zone of many fjords in the arctic region of southeastern Greenland has this kind of delta (e.g. Kroon et al., 2010; Nielsen, 1994) that form the transition between the land and sea and act as temporary sediment traps for terrestrial material. Loss of sediments occurs through further transport by the river on the delta towards the fjord. Fine material is carried in suspension and the suspended sediment flux from the river into the fjord is often concentrated in the upper layer of the water column above a prominent halocline. Deposition of this sediment in the adjacent fjord produces a record that reflects the changes in sediment discharges from delta areas on a long-term (centennial fluctuations) scale. Such changes may be coupled to changes in the mass balance of the discharging glacier, and thus to the variability of the local or regional climate, and may be considered a proxy for past glacial behaviour.
We present an automatic layer counting (varves) technique that we applied on a line-scan of a sediment core sampled in front of the delta of Mittivakkat Glacier meltwater river. This technique enables us to estimate a high resolution record of sediment accumulation rates. Grey Scale Intensity (GSI) changes in the sediment core are used to quantitatively determine the succession of laminas. The laminas are compared with and validated as varves by means of conventional 210Pb dating and used to estimate the sediment accumulation rates at the sampling site with a high resolution (in depth and time). The automatic layer counting technique may also be used beyond the timescale of 210Pb dating. The estimated fluctuations in sedimentation rates within the sediment core are finally coupled to modelled changes in annual river runoff discharge from the Mittivakkat glacier, and to climatic parameters such as the local measured annual temperatures, the local measured annual precipitation and the Atlantic Multidecadal Oscillation (AMO) index.
Regional setting
The study site is located at the eastern side of the Sermilik Fjord in southeast Greenland (65.5°N, 37.5°W; Figure 1). The climate in the area is low arctic (Jakobsen et al., 2008). The mean annual air temperature is −1.7°C. The coldest month is March with a mean temperature of −8.1°C and the warmest month is July with a mean temperature of 6.4°C. The mean annual precipitation is 984 mm (1961–1990 climate data of Tasiilaq 15 km southeast of Sermilik; Cappelen et al., 2001; Hasholt et al., 2008; Mernild et al., 2008a, 2008b). Snow melt starts in May and freezing at daylight hours starts in October (Hasholt et al., 2008). The Sermilik Fjord is c. 100 km long and connects the Helheim Glacier in the north with the Irminger Sea (Atlantic Ocean) in the south. Three water masses are present in the central part of the 600 to 900 m deep fjord (Straneo et al., 2010). The upper fjord water is a 10 to 20 m thick layer of glacial meltwater. This water flows on top of an intermediate layer of polar water. The thickness of this layer is typically between 100 and 150 m and the horizontal velocities can reach maximum values of 0.5 m/s (Straneo et al., 2010). The lowest layer consists of Atlantic water with a subtropical origin (temperature of 3.5–4°C) that flows into the fjord. The tidal regime is meso-tidal with spring tide range of c. 3.8 m and neap tide range of c. 1.0 m (Danish Maritime Safety Administration, 2007). The delta of the Mittivakkat Glacier is located in a side-fjord at the eastern side of the Sermilik fjord in a semi-enclosed embayment. The mean water depth in this embayment is 100 to 200 m and the water layers are also vertically stratified: the upper layer close to the delta mouth is maximum 0.5 m deep and is fresh at ebb and brackish at flood. The water body below this upper layer is saline. There is some tidally driven exchange between the water masses in the central part of the fjord and the side-fjord. However, the lateral velocities in the upper part of the saline water mass are small (below 0.5 m/s). Shore-fast sea-ice is abundant in the fjord from November to April, restricting the open water period from May to October. The fetch is limited by the shape of the fjord and only between 1 and 10 km for westerly wind directions. The maximum fetch occurs for southwesterly direction. Pack ice carried within the East Greenland Current and icebergs from Helheim Glacier in the fjord further limit the wave activity.
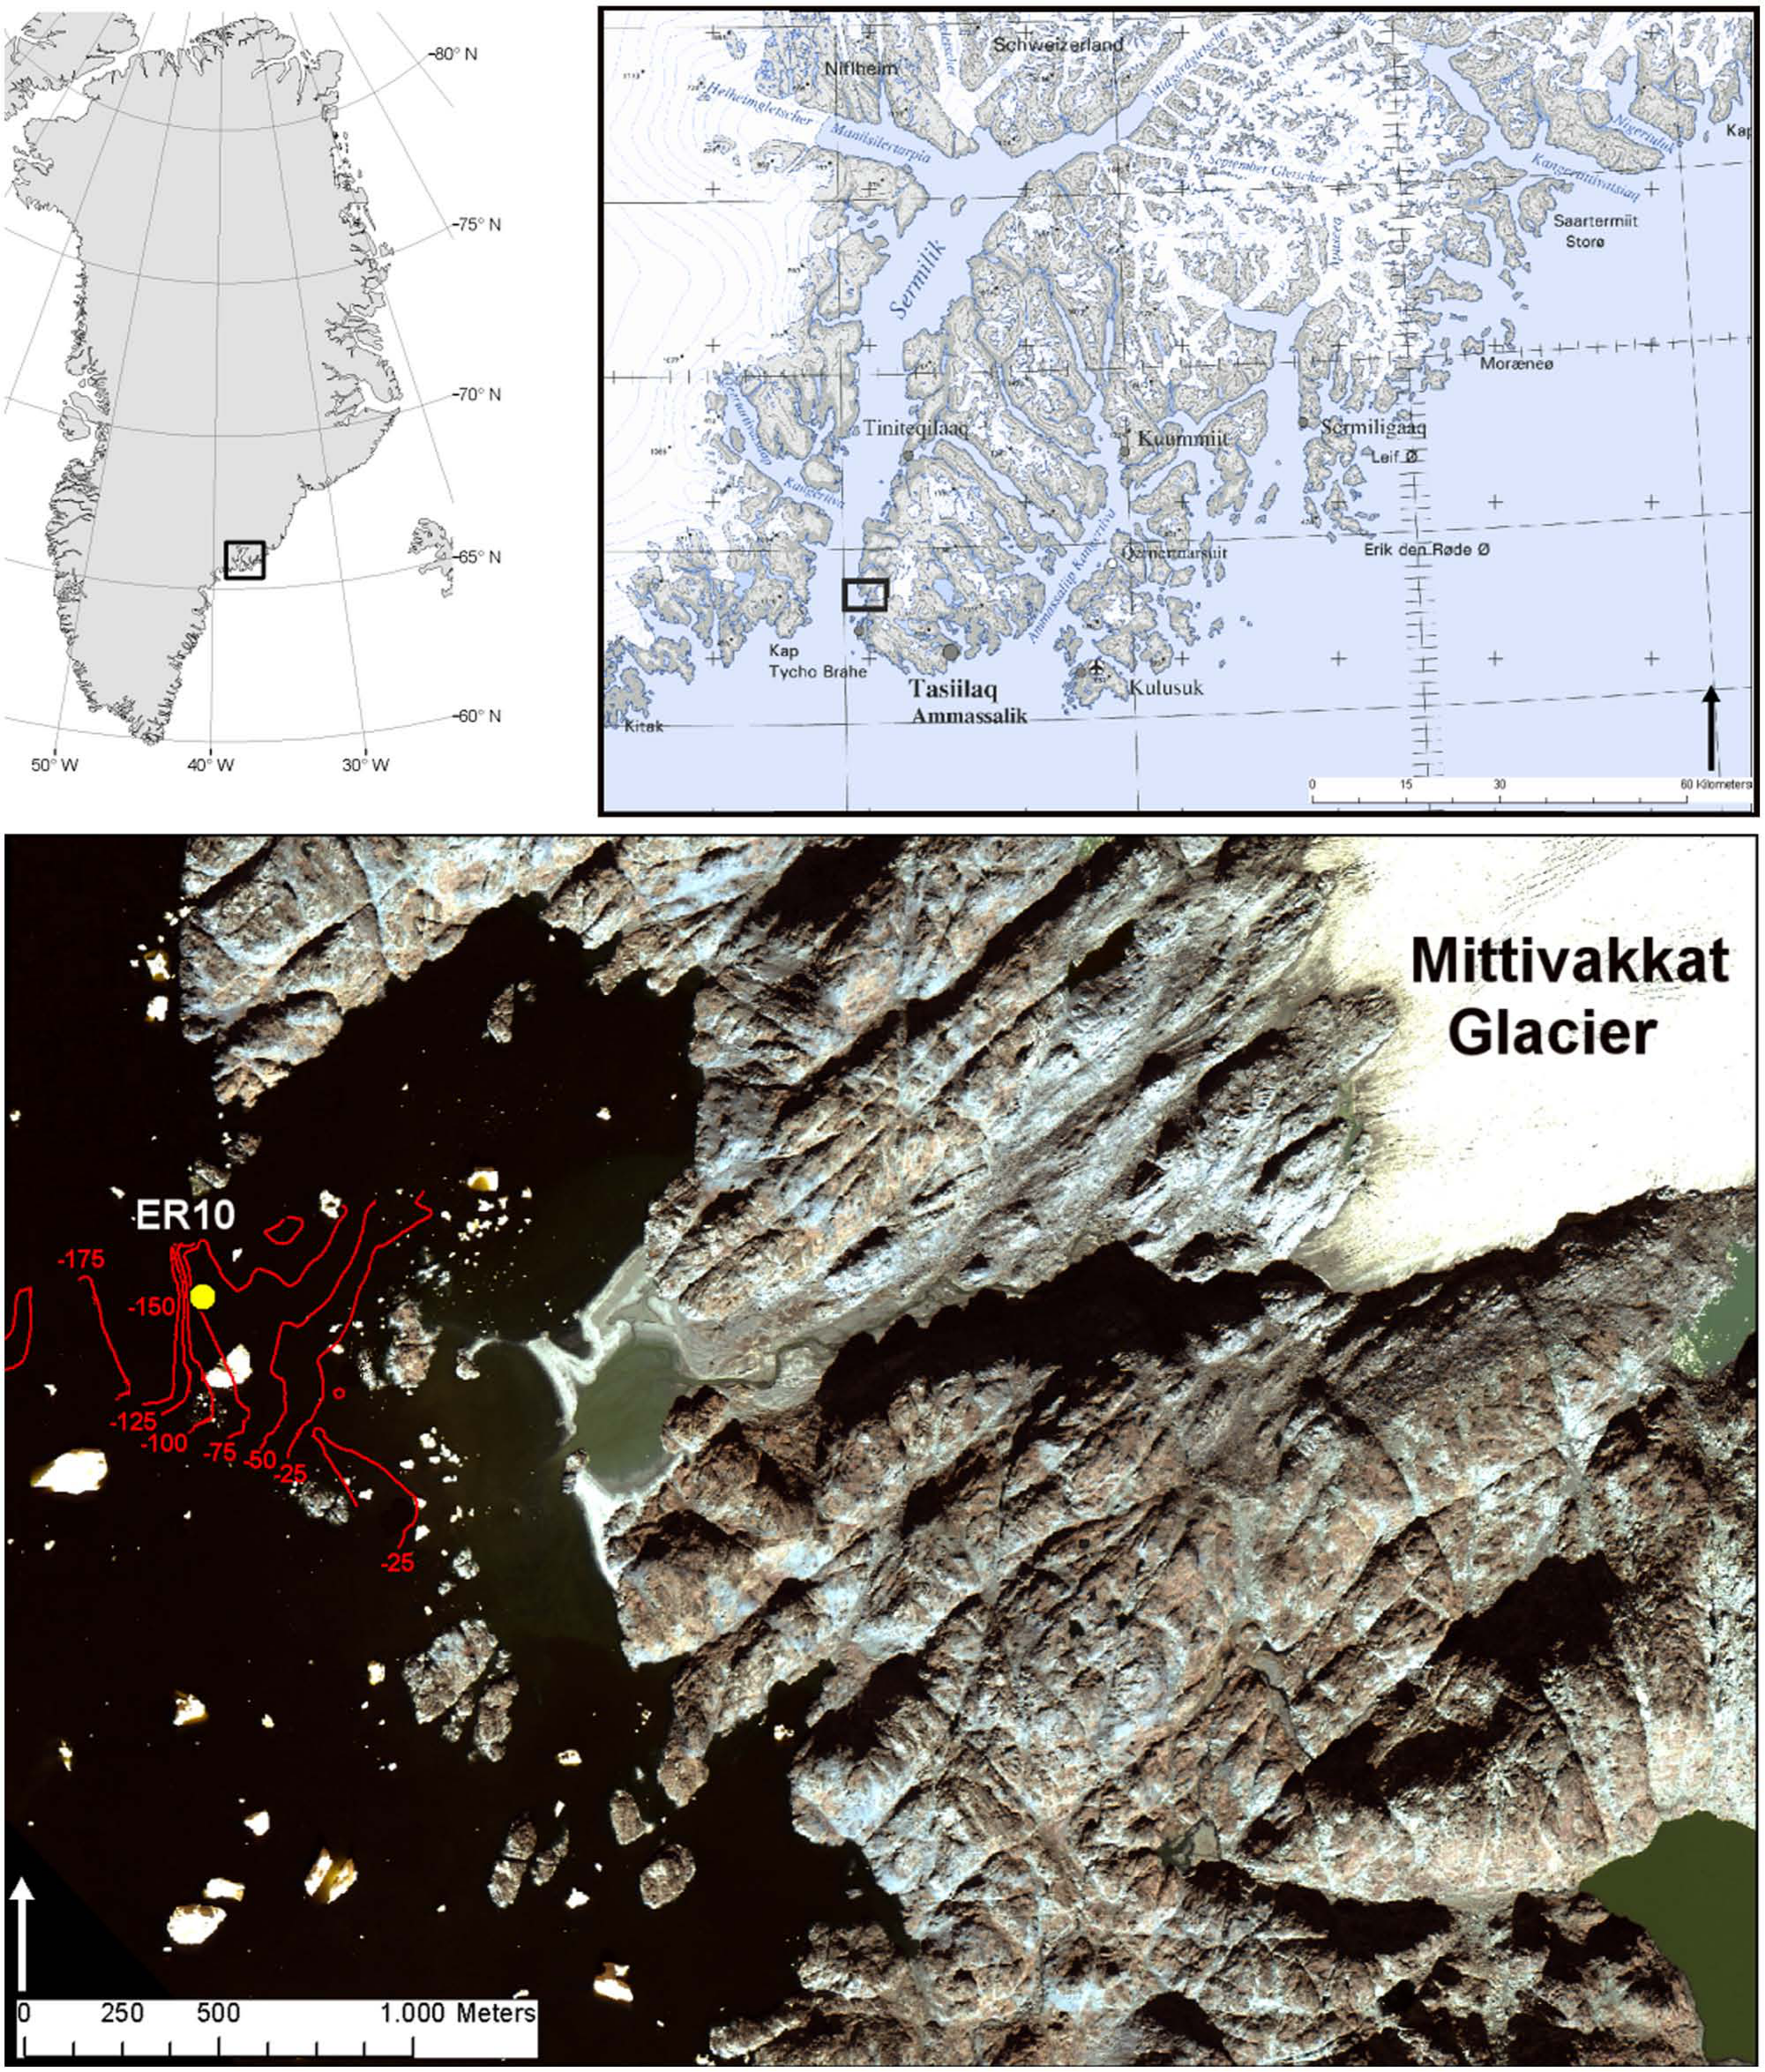
The study site in southeast Greenland. Top left: Map of Greenland. Top right: Regional setting around the Sermilik Fjord. Below: Quick Bird satellite image acquired September 2005, with sampling site (core number ER10) and bathymetry.
The Sermilik delta receives its sediments from the Mittivakkat glacier. The Mittivakkat glacier covers an area of 31 km2 and ranges in elevation from approximately 160 to 930 m above sea level (m a.s.l.). It is a temperate glacier, and has its present terminus located at c. 2 km from the coastline. The discharge from the glacier is directly delivered to the fjord through a braided river system without intervening lakes. Lagrangian observations of salinity and suspended sediment concentrations show that the meltwater plume extends several kilometres into the fjord (Hansen et al., 2010). The Mittivakkat Glacier retreated at a rate of 18 m/yr since 1933 (Mernild et al., 2011a). The actual catchment’s area (i.e. the part of the Mittivakkat glacier that drains towards the delta) is c. 18.4 km2 (Mernild et al., 2011a). The river discharge is normally between 2 and 12 m3/s, and the annual sediment transport from the river to the delta in the order of 5000 m3/yr (Hasholt et al., 2008; Mernild et al., 2006). The sediment core (code ER10) was taken at the flat bottom of the side-fjord at a local water depth of about 80 m. This location is about 800 m seaward of the delta of the Mittivakkat glacier drainage river (Figure 1).
Methods and materials
Sediment coring was performed from a vessel with a Rumohr lot corer. Core ER-10 was 0.62 m long and consists of quite homogeneous finely bedded layers of clay and silt. The core was vertically split in two parts. One half was used for further sediment sampling and one half was used for scanning. The core part for sediment sampling was cut in 0.5 cm slices in the upper 5 cm and 1.0 cm slices in the lower part. The wet and dry bulk densities were determined for each slide by weighing individual sediment slices before and after freeze drying to constant weight and dividing by its sediment volume. Grain size analysis was performed on centimetre scale on a Malvern MasterSizer 2000 (www.malvern.com) after ultrasonic treatment in a solution of Na4P2O7.
The chronology in the upper part of the core was found by 210Pb-dating using a combined CRS and CIC-model (Appleby, 2001). Gamma-essays were measured by ultra-low background gamma spectrometry on a Canberra system using coaxial Ge(Li) detectors. Activities of 210Pb, 214Pb and 137Cs were determined. 210Pb was measured by way of its gamma-peak at 46.5 keV, 226Ra by way of the granddaughter 214Pb (peaks at 295 and 352 keV) and 137Cs by way of its peak at 661 keV. A total of 32 slices of either 0.5 cm or 1 cm thickness from the upper 35 cm of the core were counted for a minimum of 80,000 s. The age-indicative unsupported 210Pbxs content was found after correction for the supported part by means of 226Ra analysis, assuming secular equilibrium between 226Ra and supported 210Pb. The chronology in the part of the core older than the upper 210Pb dated interval was sought established on the basis of 14C AMS datings, however, organic material was very sparse and only three fragments of sufficient size for radiocarbon dating were encountered. AMS 14C ages were obtained at the Leibniz-Laboratory for Radiometric Dating and Isotope Research of the Christian-Albrechts-Universität in Kiel (Germany). Conventional 14C ages were calculated according to Stuiver and Polach (1977). Radiocarbon ages were reported as calibrated years (cal. yr) before present (BP = 1950) following calibration with the terrestrial IntCal04 calibration curve (Reimer et al., 2004).
The other half of the core was line scanned on an Avaatech system at the Royal Netherlands Institute for Sea Research (NIOZ). The line scan utilised a commercial Jai CV-L107 camera with RGB channels at 630 nm, 535 nm and 450 nm with very good channel separation. It had 3 × 2048 pixels and each individual pixel was calibrated on a white ceramic reference tile. The system was capable of scanning objects of 1500 mm long and 150 mm wide. The Avaatech line-scan software produced visual colour images as well as colour data in RGB. The down-core as well as cross-core resolution was better than 0.1 mm (www.avaatech.com). This other half of the core was also x-ray scanned using a digital x-ray scanner.
The line scans were used to describe the vertical variation in sediment bedding structures (layers) using light intensities. Grey scale intensities (GSI) on the line scan were extracted with a vertical step size of 0.09 mm. This was done with Chips for Windows software along the full length of the core in six separate profiles (our ensemble of profiles). The individual profiles were spaced 1 cm apart and were used to compare the representativeness of a single profile within the ensemble. The GSI signal showed a wavy nature over depth where bedding alternately consisted of darker and lighter sediments. Small-scale noise in the original data was first reduced by applying a moving average filter. The moving average filter size that returned the minimum standard deviation of the GSI values in each profile was computed and applied, followed by a high-pass filter that created residual profiles with a mean value of zero. This was done to ease the peak identification. The peaks were now computed as the maximum values between two successive zero-crossings in the residual profile. Finally, the highest one-third of all peaks in the residual profile were selected and called significant, in analogy with the determination of significant wave height in a wave record (e.g. Holthuijsen, 2007). This level corresponded well with the visual detection of the major peaks in the residual profile. Using the highest one-tenth of all peaks was giving too few significant peaks and using half of all peaks was giving too much noise because minor peaks were also included.
The runoff from the Mittivakkat glacier was modelled with the SnowModel (Liston and Elder, 2006; Mernild et al., 2006) and the specific model setup for this study was described in details in Mernild et al. (2011b). The model simulated first-order effects of atmospheric forcing on snow, glacier ice, and runoff, and included a spatially distributed snow-evolution, ice melt, and runoff modelling system (Mernild and Liston, 2010; Mernild et al., 2006).
Results
Stratigraphy of the sediment core
The line scan, the x-ray scan and the vertical distribution of sediment properties of the core such as mean grain size, sorting, and dry bulk density are presented in Figure 2. The line scan showed some changes in colouration over depth that could be coupled to successive depositional layers with a thickness of some millimetres. However, a detailed GSI profile of the core was needed to highlight the fine laminations more accurately (Figure 3). The fine laminations did not appear on the x-ray scan where the sediment core seemed to be homogeneous with a few larger pebbles (drop stones). The abrupt change in intensity at a depth of 28 cm in the x-ray scan is an artefact: the scan was performed in two steps because the x-ray scanner was too small to cover the whole core in one step. The presence of fine laminations in digital images of a sediment core, such as the line scan in Figure 2, and the absence of these structures in the corresponding x-ray scan were also observed by Nederbragt and Thurow (2004). The mean grain size of the sediments in the core was between 13 and 34 μm (silt fraction) and rather constant over depth (Figure 2). The sorting of sediments and the bulk density over depth also showed no large fluctuations over depth. However, the vertical resolution of the series in Figure 2 was not sufficient to detect the vertical variability of these variables in relation to the detailed lamination in Figure 3. The lack of lamination in the x-ray scan and the homogenous sediment sizes further suggested that variations in the colouration in the line scan did not originate from differences in sediment density. Prokoph and Patterson (2004) reported that variability in redox conditions can influence sediment colour. We stated that changes in light intensity owed their origin to differences in reduction-oxidation potential between winter and summer. Thus, we interpret the lamination of successive darker and lighter sediments on the line scan as varves.

Line scan, x-ray scan, mean grain size, sorting, and dry bulk density as a function of depth below the bed of sediment core ER-10.
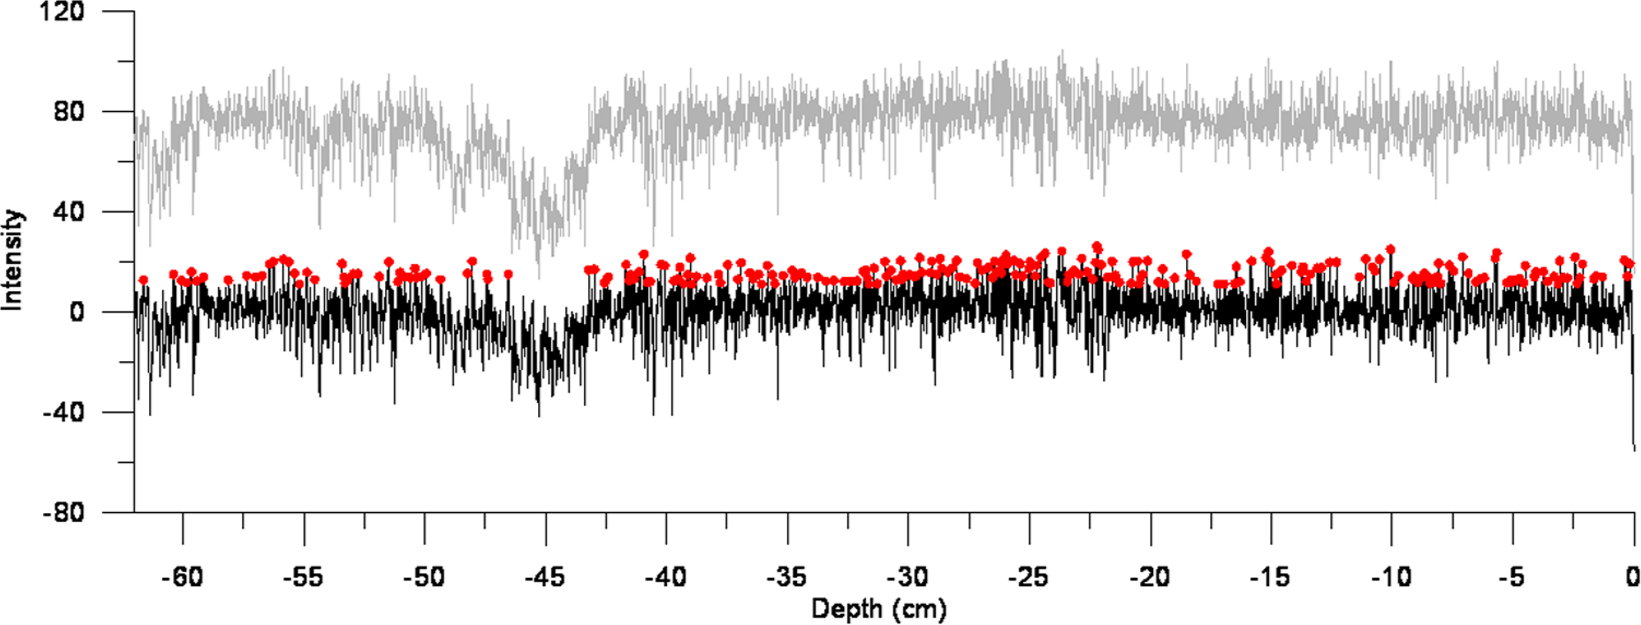
Intensity of grey scale values along ER10. Original data (grey line – top), high pass filtered data (black line – bottom) and detected peaks (dots on black line).
The grey scale intensity (GSI) of one of the six profiles of the sediment core is presented in detail in Figure 3. The original light intensity fluctuated between values of 13 and 105 with a mean value of 73 and a standard deviation of 13. After applying the high pass filter, the mean was removed and the values fluctuated between −56 and 26. A drop in grey scale intensity was observed at depths between 42 and 47 cm in both the original and filtered series. This corresponded to a dark part of the core in Figure 2. The high pass filter removed the overall (long-term) fluctuation in intensity, but the filter was not able to transpose the intensity of the dark part of the core into a variation around 0. This was observed in all six profiles and the peak detection method was therefore not used beneath the depth of 42 cm.
We state that intensity peaks of maximum GSI define varves and that the duration between two successive peaks is 1 yr. Intensity peaks are marked as dots in Figure 3. Similar automatic varve detection from grey scale time-series of colour images of sediment cores has previously been performed by e.g. Nederbragt and Thurow (2001) and Prokoph and Patterson (2004).
Chronology of the sediment core
The 210Pb-chronology was used to calibrate the stratigraphy of the core over the last decades. The 210Pbxs profile of the sediment core ER-10 showed an exponential decrease with depth (Figure 4, left panel). The initial 210Pb-chronology was calculated on the basis of this exponential decrease. Using this chronology, 137Cs activity showed low values until the late 1960s when a major peak occurred. This peak corresponded well with the time of maximum atmospheric testing of nuclear weapons (Eakins et al., 1984), although it showed an offset of about 6 years. The chronology was adjusted and recalculated for this offset by ascribing the lower sample in the broad 137Cs-peak to the year 1963, using the method of Appleby (2001) . The 137Cs activity of all gamma counted sediment slices is plotted against this adjusted 210Pb chronology in the right panel in Figure 4.
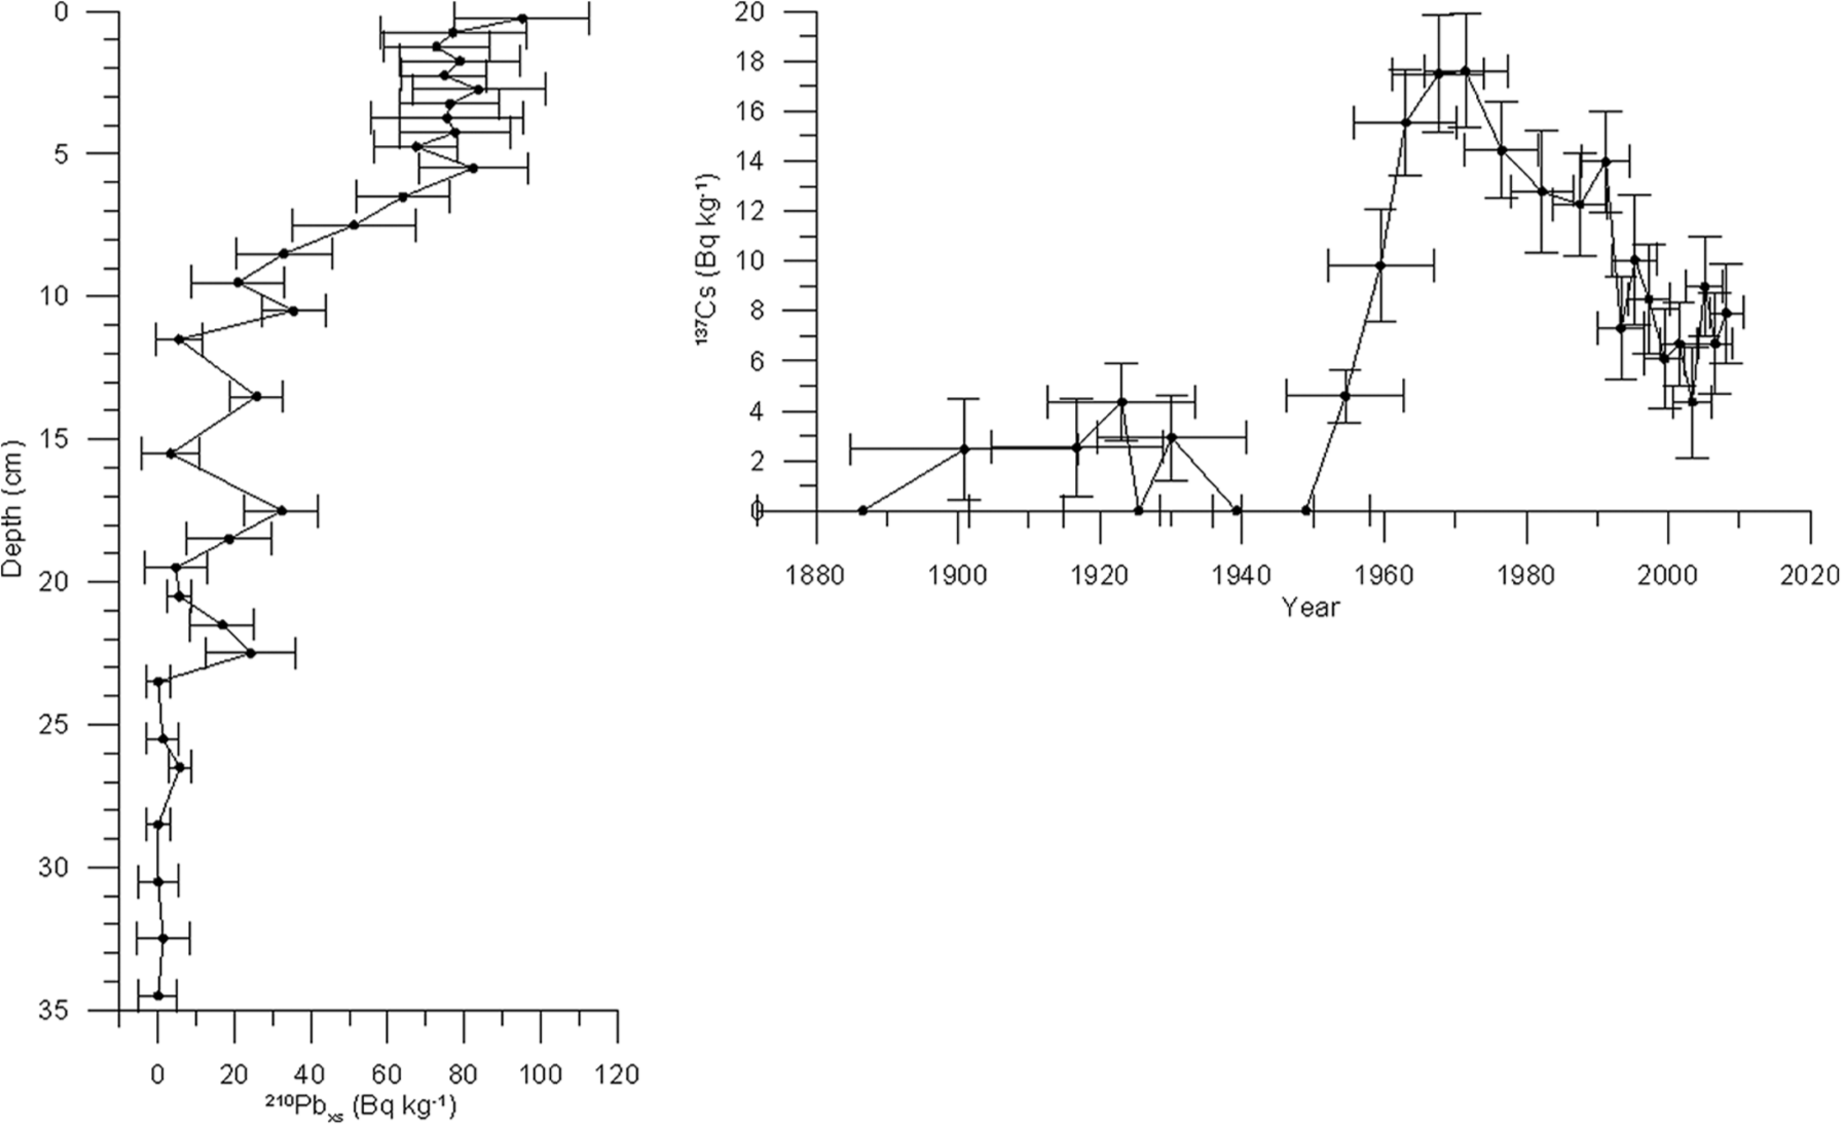
210Pbxs profile of core ER-10 (left) and 137Cs activity as function of 210Pb derived year of deposition (right). Error bars indicate one standard deviation.
From the mid 1960s until the mid 1980s the 137Cs activity decreased until a second peak occurred. This minor peak may be ascribed to the Chernobyl accident in 1986 (Naidu et al., 1999). Since then, the activity experienced a general decreasing trend.
Three 14C datings, based on marine shells and a terrestrial twig fragment, were used to calibrate the stratigraphy of the core on a centennial scale (Table 1). The calibration and estimation of the marine shells (No. 1 and 2 in Table 1) was impossible. The marine reservoir age in this region was not exactly determined. The only dated sample in the CALIB Marine Reservoir Correction data base in the vicinity of the study site originated from the open sea east of the Island Angmassalik, approximately 60 km east of the sampling site of core ER10 (www.intcal.qub.ac.uk). This sample (No. 669 in the CALIB Marine Reservoir Correction data base) had a reservoir age of 545 yr, which exceeded the 14C age of both marine samples (No. 1 and No. 2 in Table 1). The small twig fragment of terrestrial origin (sample No. 3 in Table 1) yielded a calibrated age of 385 ± 110 yr BP, corresponding to the year 1565
Summary of samples for 14C age determination.

Coupling between stratigraphy and chronology of the sediment core
The depth and age derived from the 210Pb analysis is related to the depth–age relationship based on GSI peak identification method for all six profiles (including mean and standard variation) in Figure 5. The standard deviation on 210Pb ages all felt within the standard deviation on the mean age of the six profiles based on GSI values. Thus, the peak detection method was able to (1) extend the age–depth relation further back in time compared with the 210Pb method and (2) establish the age of sediments that was not gamma counted with the 210Pb method. However, the standard error on ages estimated by the described lamina method was quite large and larger than those obtained using the 210Pb-method for sediments older than c. 40 years. The reconstruction of sediment accumulation rates based on the mean age–depth relationship of the six profiles is shown in Figure 6a. The accumulation rate in the period
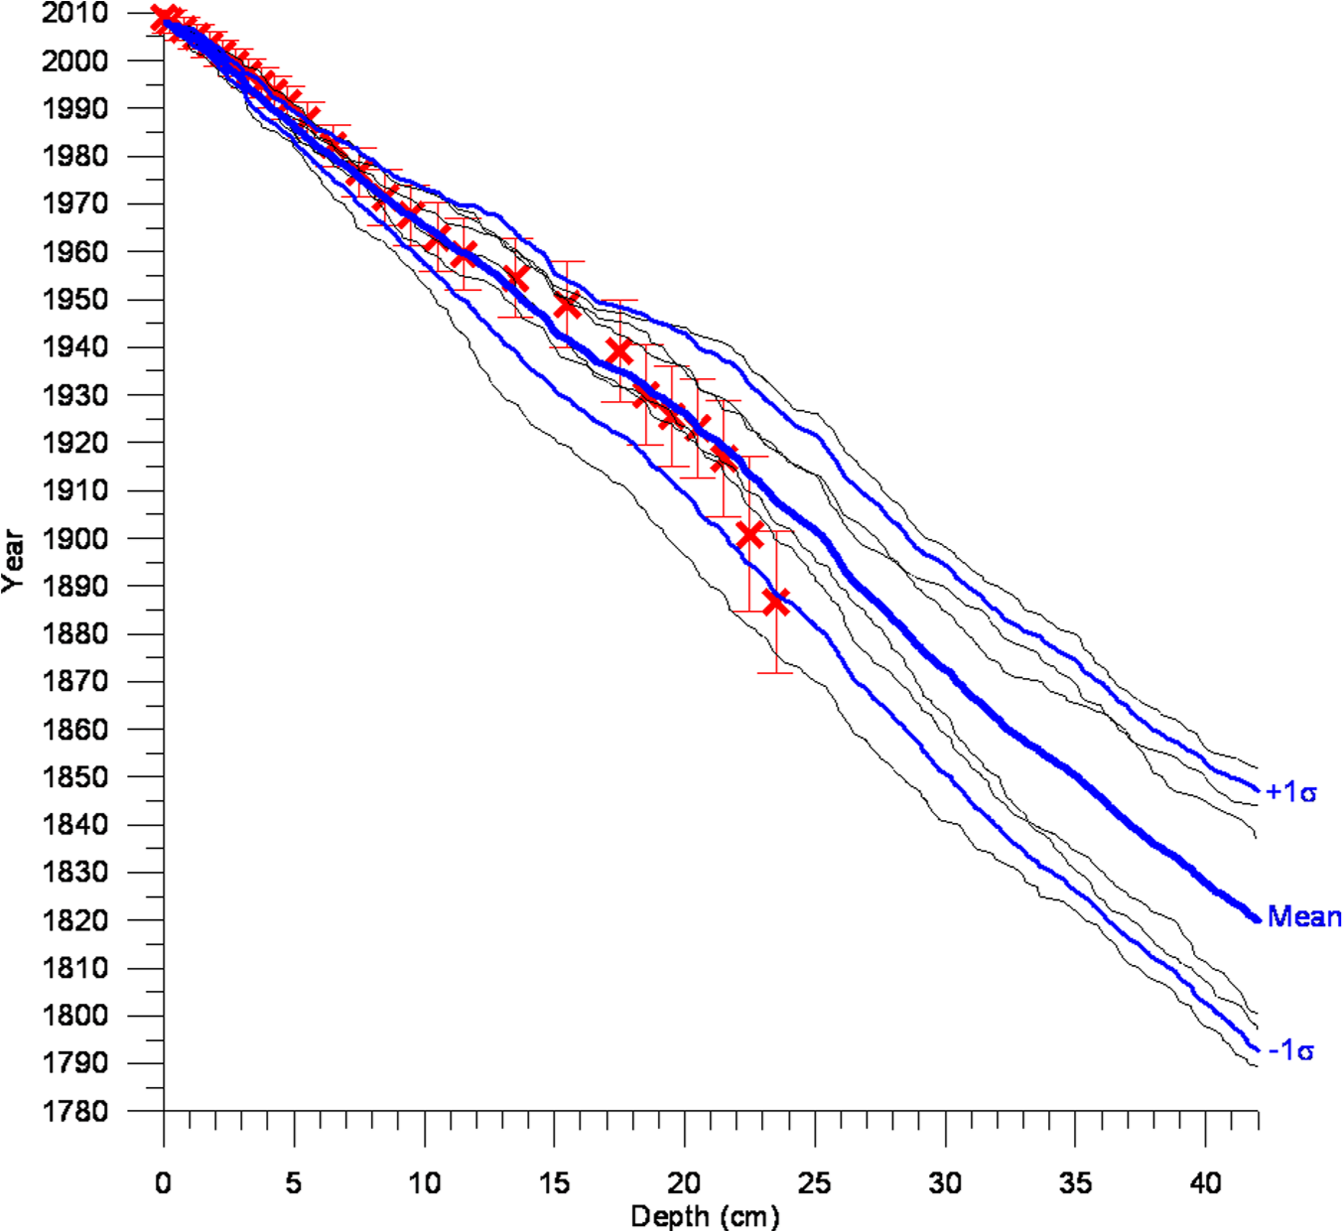
The grey scale intensity peak identification age–depth relationship extracted in six profiles (thin grey lines), their average (thick black line) and standard deviation (thin black lines) as well as the 210Pb age–depth relation (grey crosses), all based on the sediment core ER10.
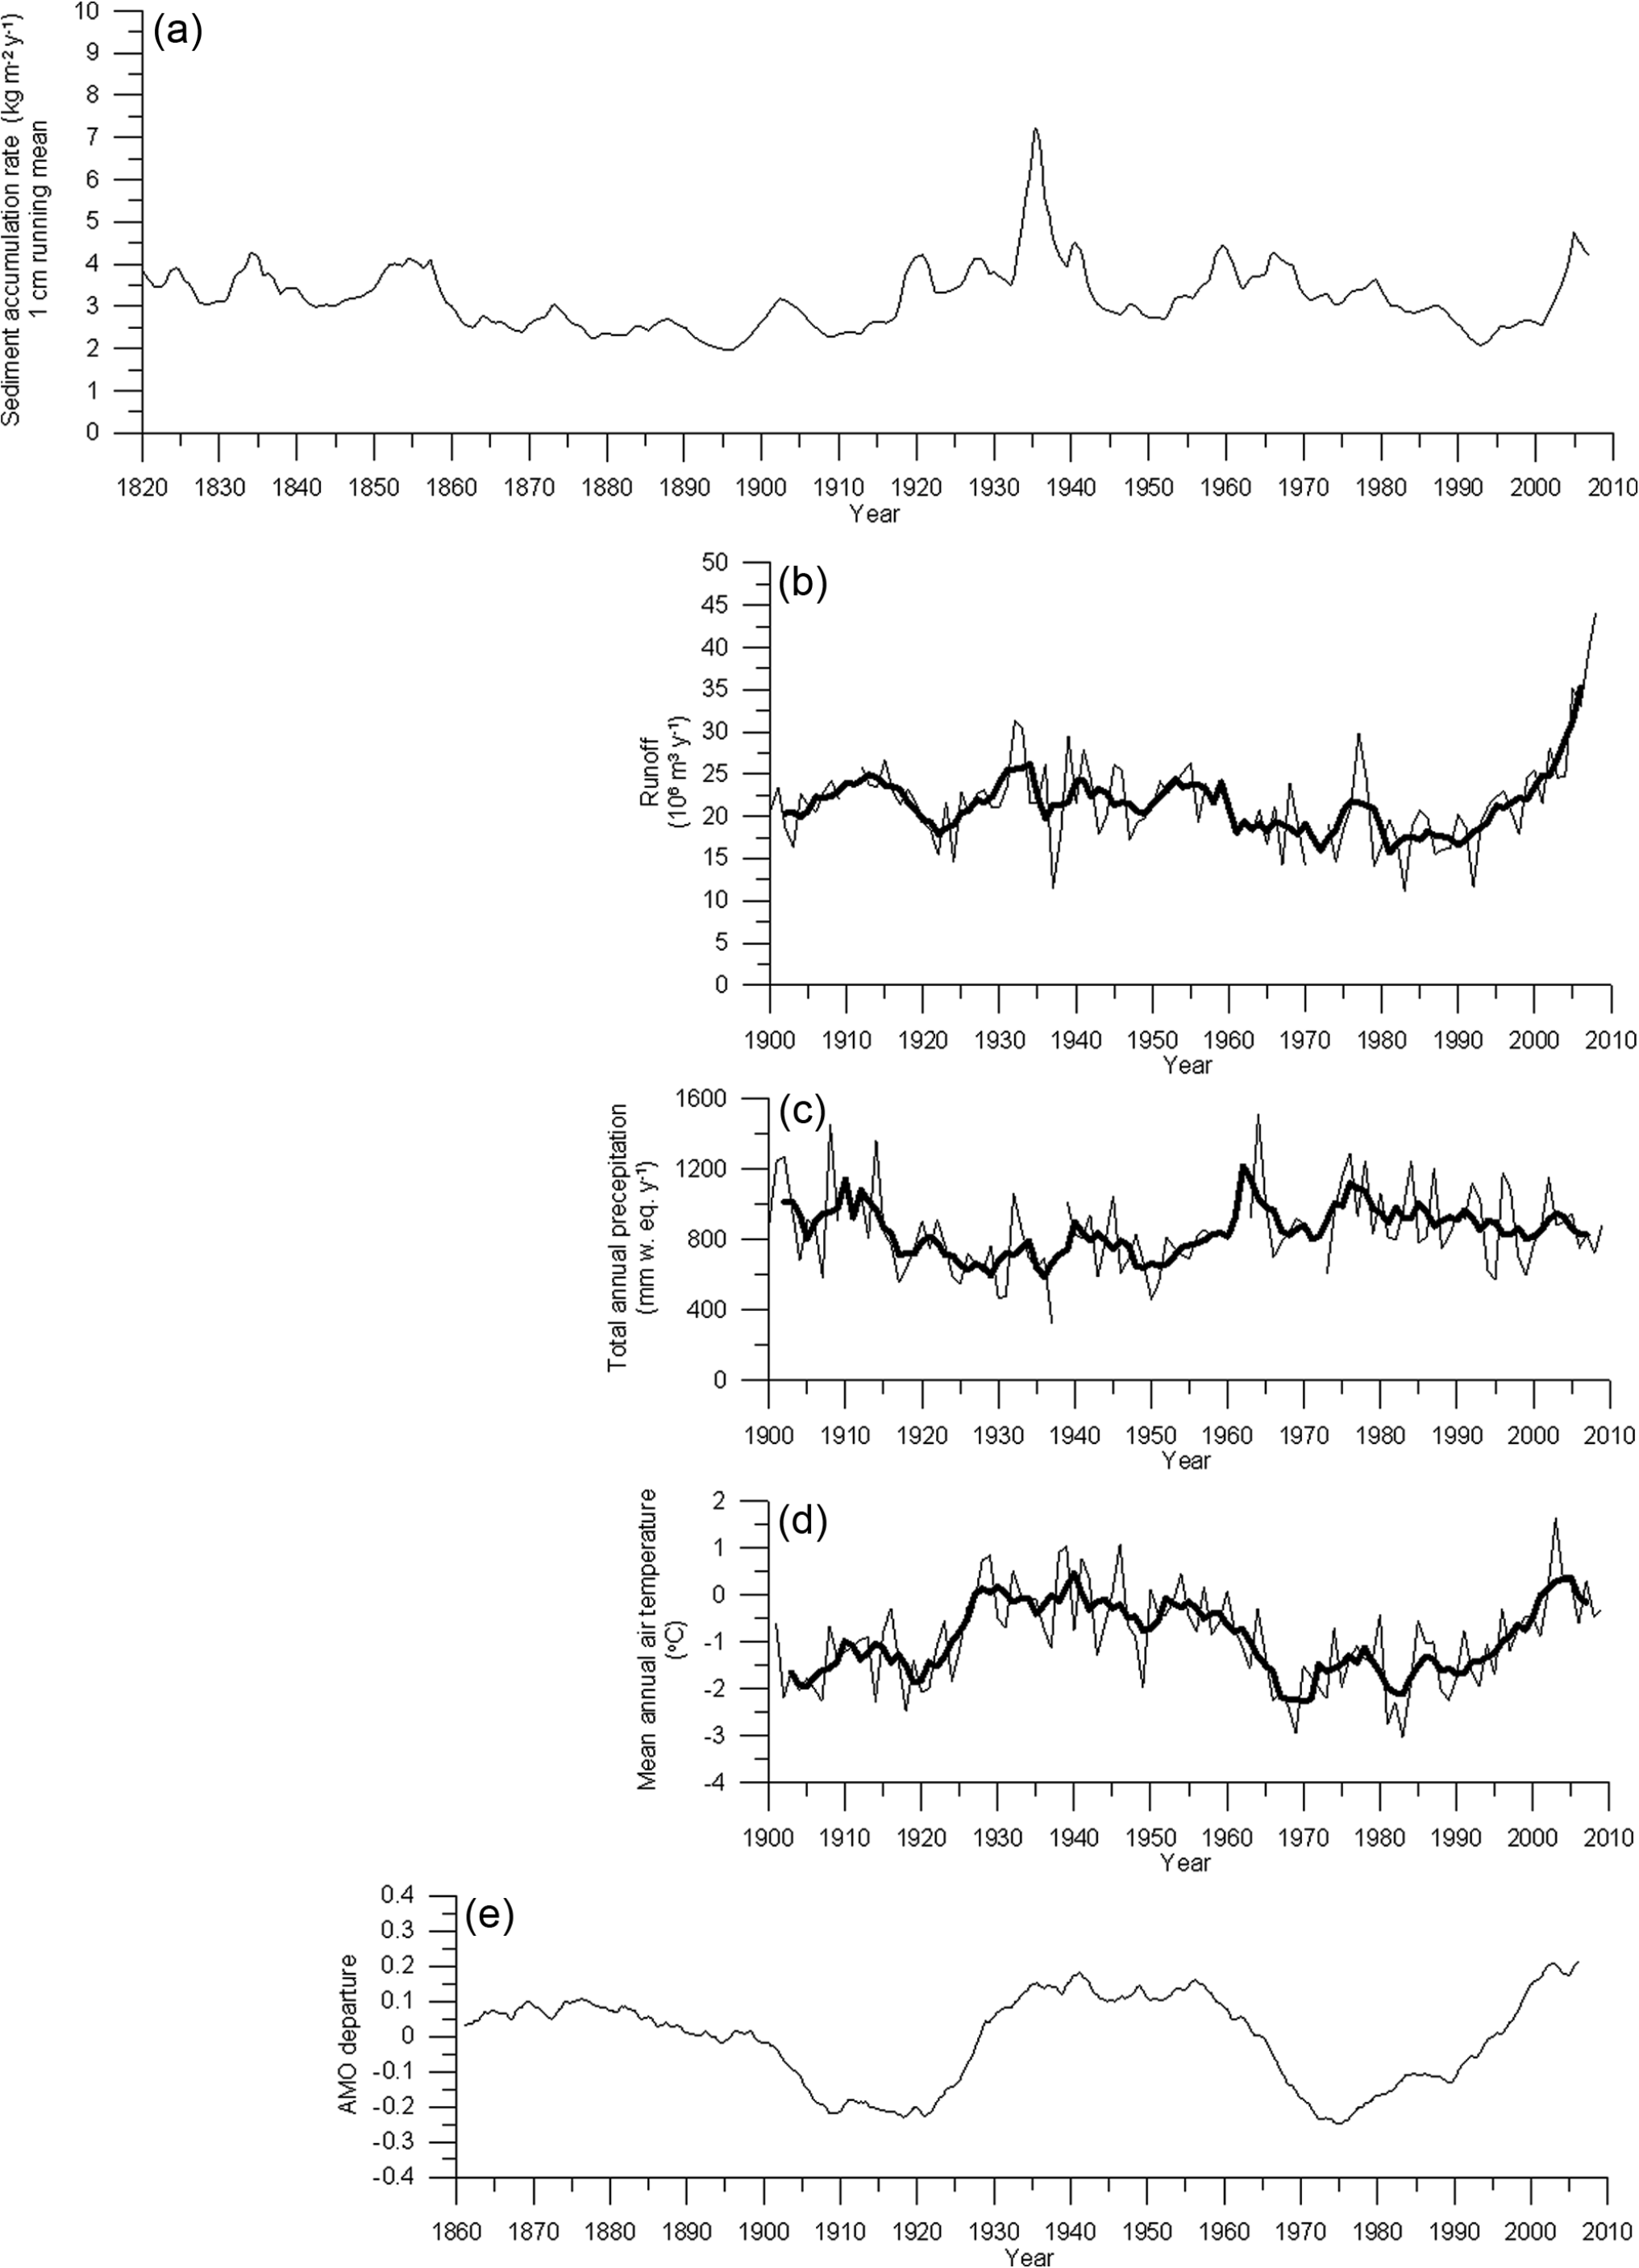
(a) Sediment accumulation rate determined on the basis of peak dating, (b) modelled annual runoff from the Mittivakkat glacier and 5 yr running mean (thick line), (c) mean total annual precipitation at Tasiilaq and 5 yr running mean (thick line), (d) mean annual air temperature at Tasiilaq and 5 yr running mean (thick line), and (e) the Atlantic multidecadal oscillation (data from www.esrl.noaa.gov/psd/data/timeseries/AMO).
Discussion
The automated layer counting technique was used for the upper part of the sediment core (from the top until 42 cm) and validated with Pb210 chronology. The very dark part of the core between 42 and 47 cm hindered the automated procedure because it supressed the mean of the GSI and thus suppressed the maximum values of the peaks in this area. However, the technique could even be applied in this area and further down the core when we adjusted the criteria to define a peak more locally. The lower parts could then be validated with 14C dating. However, we were especially interested in the upper part of the core and liked to solve the accumulation pattern on a decadal and centennial scale.
The coupling between the stratigraphy and the chronology based on two geo-chronological methods looked very promising (Figure 5). Similar good results between laminations and 210Pb and 137Cs derived age models for proglacial lacustrine sediment cores were observed in Icefall lake in the vicinity of the Mittivakkat Glacier (Hasholt et al., 2000). They interpreted the laminations as varves.
The sediment accumulation rate fluctuated without a significant rising or falling trend (Figure 6a). This was also documented in two lakes that were located north of the study area and fed by the Mittivakkat Glacier; for Icefall lake over the last 24 yr and for Kuutuaq lake over the last 100 to 150 yr (Hasholt et al., 2000). However, the sediment accumulation rate over the last centuries rose substantially. This increase in sediment accumulation rate after the termination of the ‘Little Ice Age’ maximum was also reported in lakes around the Mittivakkat Glacier (Mernild et al., 2011b), from the Billefjorden on Svalbard (Szczucińskia et al., 2009) and from the Patagonian San Rafael Glacier (Koppes et al., 2010).
Major peak in sediment flux in the mid 1930s was observed for the Muir Glacier, Alaska (Koppes and Hallet, 2002) who modelled the retreat rate and sediment output for this glacier during the period 1900–1980. The timing of both the mid 1930s peak and the general rising trend from the early 1990s onwards corresponded well with the results of Wake et al. (2009), who computed the surface mass-balance changes of the Greenland ice sheet since 1866. They found high runoff rates during the periods 1923–1933 and 1995–2005 and concluded that the present-day changes were not exceptional within the last 140 yr. Likewise, glacier retreat during the 1930s of the same magnitude as during the early 2000s has also been documented in the SE Greenland region (Bjørk et al., 2012) and by Helheim Glacier (Andresen et al., 2012). This agreement in timing supported our interpretation of the sediment accumulation rate as a good proxy for glacial runoff. The rising trend towards the present was also apparent from the modelling of runoff from the Mittivakkat glacier (Figure 6b) and corresponded with the recent increase in temperature in the area (Figure 6d). The annual precipitation was poorly and slightly negatively correlated with the sediment accumulation rates (Figure 6c). However, the temperature which is primarily controlled by the AMO index (Figure 6b) was the driving force that controls the sediment accumulation rate at the location of the core in the side-fjord. The correspondence between the sediment accumulation and temperature records suggested a wider regional climatic forcing on melting of local glacier caps in eastern Greenland where Tasiilaq air temperature was affected by the AMO index as in many other Atlantic regions (Schlesinger and Ramankutty, 2004). A weak but significant correlation 180 degrees out of phase was also found between the AMO index and glacial mass-balance in the Swiss Alps (Huss et al., 2010) and for the Greenland ice sheet (Mernild et al., 2011c) and Helheim Glacier (Andresen et al., 2012). This suggested that oscillations in the temperature of the surface North Atlantic Ocean widely influence the surrounding glaciers.
The relationship between the AMO index, and hence the temperature and sediment accumulation on the bottom of the side fjord about 1 km seaward of the delta, was especially strong during periods where colder climates transformed towards warmer. This was the case in the 1930s and in recent years (Figure 6). Sediment accumulation rate rose during warming periods. However, the pulse of sediment accumulation quite rapidly returned to lower rates in the 1930s, even though the temperature remained high into the 1950s. This suggested a rapid glacial response to contemporaneous climate and a quick melt of ice that was built up during the cold period. Besides, a hysteresis effect may have occurred, where sediments stored in the glacier/valley system were quickly evacuated soon after a temperature-dependent increase in discharge. However, the correlation coefficients between the sediment accumulation rates and the other variables were small (< 0.2) and insignificant. The best correlation was found by correlating the sediment accumulation rates with the mean temperatures in spring (March–April–May; correlation coefficient of 0.19). Correllograms of sediment accumulation rates and the other variables were computed to see if one series was lagging behind the other, but most correllograms showed the maximum correlation at a lag of 0.
The peak in accumulation rate in the mid 1930s was not pronounced in the modelled runoff, but corresponded well with the warm period in the 1930s and 1940s. The runoff was modelled using a combination of temperature and precipitation data in Figure 6c and d. Apparently, the actual sedimentation rate in front of the delta was more dependent on temperature and less on precipitation than the modelled runoff indicated. Moreover, the retreat of the Mittivakkat glacier since the 1930s, where surveys in the area began, resulted in a longer transport route of sediment from the glacier to the delta with a higher potential for deposition in the meltwater valley. This may explain the relation between a very high sedimentation rate in the mid 1930s, where the distance between source and sink was low, and a relatively low modelled runoff in the same period. An alternative explanation for the large peak in accumulation rate in the 1930s was that it may result from the drainage of a large ice-dammed lake (a Jökulhlaup). Jökulhlaups occurred in the area and one was actually observed in 1958 (Valeur, 1959). While Jökulhlaups could not be simulated by the SnowModel, they may deliver large discharge in a short period with a resulting large accumulation of sediments at the delta.
Conclusions
A sediment core sampled in the Sermilik Fjord c. 800 m seaward of the Mittivakkat Glacier delta was used to determine sediment accumulation rates over the last c. 200 years and compare the temporal variation in accumulation rates to modelled variation in glacier runoff. The core consists of homogeneous silty material. An x-ray scan of the core did not show laminations resulting from differences in sediment bulk density, but a high resolution line scan revealed lamination in colouring on a millimetre scale that presumably originated from seasonal alternation in redox potential at the sea bed. A method to identify peaks (corresponding to laminas) in the grey scale intensity of the line scan was developed and the results of this lamination dating compared with conventional 210Pb dating. The agreement between the two methods was high and supported the rationale behind the peak identification method. On this basis, a time series of sediment accumulation rates was determined and compared with climatic data (temperature, precipitation and AMO index) and modelled glacier runoff. Peaks in sedimentation rates were coupled with periods with transitions from low temperatures towards warmer. The temperature which, in turn, was primarily controlled by the AMO index seemed to be the driving force that controlled ablation. With an increased ablation, the river runoff will increase and the sediment accumulation rate on the bottom of the side fjord in front of the delta front will increase. The relationship between climate parameters and sedimentation rates was, however, non-linear and local circumstances such as the proximity of the sampling site to the delta mouth, configuration of the delta morphology and sudden drainages of large ice dammed lakes may influence this relationship.
Footnotes
Acknowledgements
We would like to thank Rineke Gieles (NIOZ, The Netherlands) and Husum Dyreklinik (Denmark) for conducting the line scan and x-ray scan, respectively. The Sermilik Station of the Department of Geosciences and Natural Resource Management of the University of Copenhagen provided logistic support for this study.
Funding
This study was conducted as part of the SEDIMICE – Linking sediments with ice-sheet response and glacier retreat in Greenland – project financed by Geocenter Denmark.