
Abstract
The reconstruction of past pastoral activities based on microscopic methods (pollen and coprophilous fungal ascospores) does not accurately identify the domestic species involved. In contrast, source-specific DNA markers, commonly employed in water quality microbial source tracking (MST) studies, may represent a promising tool for retrospectively identifying species-specific fecal contamination in sediment deposition. In the present study, molecular methods were used to quantify Bacteroidales and identify ovine and bovine mitochondrial DNA extracted from sediment cores from two forest hollows comprising 2000 years of deposition. The DNA marker abundance was contrasted with the abundance of ascospores and plant-specific pollen throughout the sediment chronosequence. The distribution of DNA markers indicated an agro-pastoral practice transition from pasture/crop production to forested landscape from the second Iron Age/classical Antiquity to the end of the Roman period/modernity, in correlation with microscopic markers. During the second Iron Age/classical Antiquity, hollows were likely used to water herds, whereas during the late Antiquity, low Bacteroidales abundances and the sporadic detection of bovine and ovine DNA markers confirm the progressive afforestation observed using pollen data. For the end of the Roman period and modern times, reforested areas are characterized by the absence of ovine and bovine DNA markers while low Bacteroidales abundances suggest the presence of wild herbivores. The present study has established that in tandem with microscopic methods, sediment-archived fecal-specific bacterial and mitochondrial DNA are extremely useful for reconstructing agricultural practice over timeframes of millennia.
Introduction
Over the last two decades, more sophisticated and reliable methods for the analysis of sedimentary ancient DNA (sedaDNA) have yielded new perspectives in our understanding of past environments (Anderson-Carpenter et al., 2011; Coolen et al., 2008, 2013; Epp et al., 2010, 2012; Parducci et al., 2013; Pedersen et al., 2013; Rawlence et al., 2014; Willerslev et al., 2003). However, few studies have investigated the potential of sedaDNA to reconstitute and characterize ancient anthropogenic practices related to animal husbandry (Giguet-Covex et al., 2014). Through defecation, animals shed into the environment large amounts of sloughed intestinal epithelial cells (Martellini et al., 2005) and fecal bacteria (Santo Domingo et al., 2007). DNA released from these cells is fragmented by various physical or chemical processes and is rapidly adsorbed onto the charged surfaces of clays, amorphous hydroxides and organic compounds in soils (Poté et al., 2007, 2009). Soil-bound DNA washed from the watershed into lacustrine systems can accumulate, thereby creating a vertically stacked temporal sediment archive. The accuracy of the sediment archive will be affected by the residence time of DNA in the watershed and by the deposition heterogeneity in the sedimentary basin. Further work is required to validate and refine sedaDNA methodology, referenced to commonly accepted methods such as plant pollen and fungal spore analysis.
Forest hollows (or closed depressions – CDs) are ponds used for stand-scale palynology (Bradshaw, 2007), fire regimes (Higuera et al., 2005) and plant sedaDNA (Anderson-Carpenter et al., 2011) reconstructions. Forest hollows are potentially interesting to test and implement sedaDNA methodology because of their small depositional and catchment areas, and propensity to accumulate large amounts of sediment. CDs are quite frequent in low altitude oak–beech–hornbeam forests of north-eastern France, Belgium and Luxembourg (Etienne, 2011; Hérault and Thoen, 2009). Morphological, archaeological and palaeoenvironmental investigations have suggested that these CDs were dug or reworked by humans during the second Iron Age (450–50 BC) or the classical Antiquity (50 BC to 200 AD), in an open landscape (Etienne et al., 2011). Pollen analysis has revealed the presence of extended grasslands during the second Iron Age/classical Antiquity periods, and a large expansion of croplands during the Middle Ages (AD 950–1700) (Etienne et al., 2010, 2013a; Ruffaldi et al., 2007). The abundance of Sporormiella-type ascospores confirmed the presence of herbivores and variation in grazing pressure (Etienne et al., 2011, 2013a) in the watershed of these depressions during the antiquity. These proxies are limited in that they cannot distinguish species of domestic or wild herbivores presence, or quantitatively estimate their relative abundance. A variety of animal or human host-specific gene targets have been developed for use as ‘microbial source tracking’ tools to help elucidate sources of fecal pollution in surface water. At a landscape-scale, potential sources of fecal pollution in mixed-activity watersheds can include humans, livestock and wildlife. In order to distinguish and quantify the potential relative contributions of each, PCR methods have been developed using host-specific mitochondrial DNA and Bacteroidales DNA markers specific for a variety of mammals (Martellini et al., 2005; Marti et al., 2011, 2013; Mieszkin et al., 2009; Reischer et al., 2006).
In the present study, we explored the utility of these MST markers for establishing host-specific fecal pollution in sedimentary chronosequences. Sedimentary DNA was extracted and short fragments of host-specific bovine (Bos taurus) and ovine (Ovis aries/Capra hircus) mitochondrial DNA and fecal bacterial DNA (Bacteroidales) was quantified. Results were compared with pollen and Sporormiella-type records. The specific objectives were to (1) optimize and compare molecular tools for the analysis of sedaDNA and (2) use the information to identify local anthropogenic practices dated from about 2000 years ago.
Materials and methods
Experimental site and sampling methods
The study area is located in the eastern part of the Parisian basin (France), on the Lorraine Plateau, 60 km southeast of Metz (Figure 1(a)). Two CDs, defined as small, isolated wetlands filled by rain water where the sediment infill is encircled by hillslopes, were studied (Figure 1(b)): (1) in the forest of St Jean (STJ; 48°47′36.85″N-006°43′34.15″E), near the city of Dieuze, and (2) in the forest of Sarrebourg (SAR; 48°47′00.28″N-006°57′04.19″E), near the city of Sarrebourg (Figure 1(b)). Both CDs are 400–500 m2 large, have a bathtub shape and are about 3 m deep. The surrounding terrain is flat, and their catchment area is no more than a few hectares. They are now located within a forested context, distant from the forest edges with pastures and croplands (80 m for SAR CD and 420 m for STJ CD).
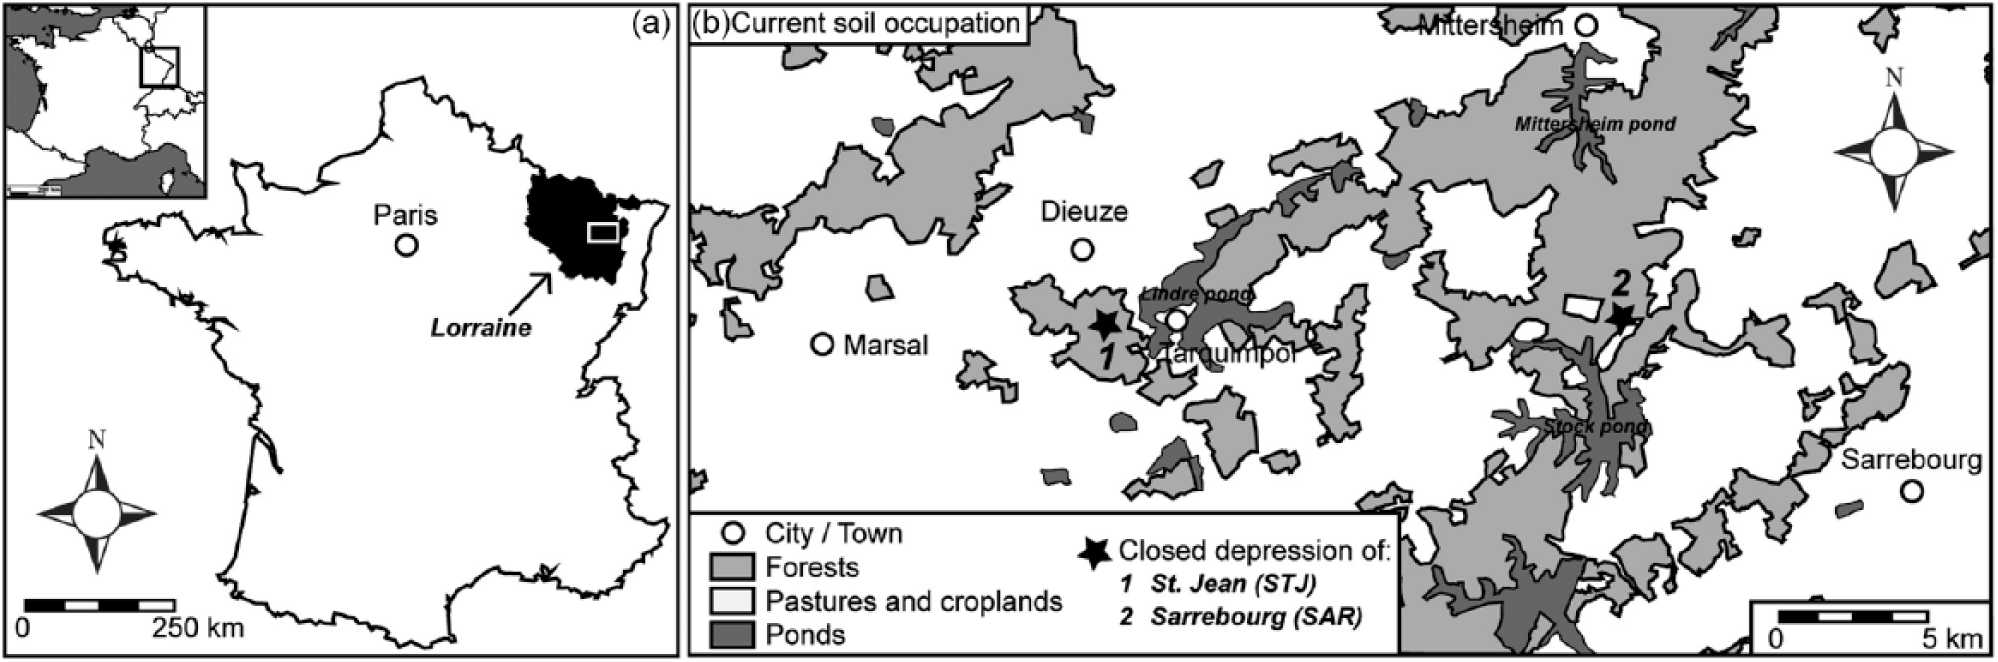
(a) Geographical location of the study area in Lorraine (Northeastern France) and (b) location of the two closed depressions studied near the cities of Dieuze and Sarrebourg.
Sediment cores were extruded manually with a peat sampler (50 cm long and 8 cm diameter) from the centre of CDs, wrapped in plastic film and transported to the laboratory where they were stored at 4°C (Etienne, 2011). Bulk sediment subsamples were taken from the centre of the sediment cores rather than from the core edge, where exogenous DNA could more easily contaminate the sediments, and immediately frozen (−20°C).
All collection instruments were DNA free (NaOH 0.1 N) and subsamples were collected in a room dedicated for rare environmental and ancient DNA analyses (Plateforme d’Analyses de Biologie Moléculaire, Université de Savoie, Le Bourget-du-Lac, France). This laboratory is physically distant from any other molecular laboratory spaces, especially from post-amplification spaces, to prevent the dissemination of modern amplified DNA. This space is equipped with an air cabinet and the staff access is controlled.
The chronological frame for both sequences was established by several AMS radiocarbon dates on isolated plants remains (leaf, seed or charcoal). An age–depth model was constructed for each sequence, in order to present the data along a chronological scale, as described elsewhere (Etienne et al., 2013a). The time scale BP (Before Present years) used is a standard practice in palaeoenvironmental studies and defined 1 January 1950 as commencement date of the age scale. Molecular analyses are focussed on sediments dated from cultural periods where intense (SAR1 and STJ1: 2150–1650 cal. BP) or low (SAR2 and STJ2: 1650–1500 cal. BP) pastoral pressure is suspected on the basis of pollen and coprophilous fungal spore analysis (Etienne et al., 2011, 2013a), and the present period without any pastoral pressure (SAR3 and STJ3: 50 to −50 cal. BP).
DNA extraction
DNA was extracted from 0.5 g (fresh weight) portions of sediment using the NucleoSpin soil kit (Macherey Nagel Hoerdt, France) using lysis buffers SL2 and SX according to the manufacturer protocol. The elution volume was 50 µL. The integrity of extracted DNA was verified by electrophoresis (20 min at 9.35 V cm−1) on a 1% agarose gel using GeneRuler 1kb Plus DNA Ladder (Fermentas; Saint Rémy les Chevreuses, France). DNA concentration was determined by fluorimetry using the QuantiFluor™ dsDNA Dye Systems (Promega; Charbonnières, France).
PCR amplification of mitochondrial markers
Bovine and ovine mitochondrial markers were amplified from sediment DNA using a nested PCR protocol modified from the (Martellini et al., 2005). Bovine mitochondrial markers were first amplified using the primers Bomito2-G (CATAGCAATTGCCATAGTCC) and Bomito2-D (TTTTCGATTGTGCCGGCCGTT) generating amplicons of 554 bp, and then using the primers BomitoN2-G (CCCTCTTACTAATTCTAGCTC) and BomitoN2-D (TTAGCACTAGGATGAGGAGA) generating amplicons of 440 bp, targeting cytochrome b genes (24). Ovine mitochondrial markers were first amplified using the primers Ovmito2-G (GGAACCGTTACCACATGTtAC) and Ovmito2-D (GGCTAGTAGGAAGATTAGGAGAAGA) generating amplicons of 689 bp, and then using the primers OvmitoN2-G (TACACTGTTACAGGCATCAG) and OvmitoN2-D (CGTGAAGTTAGTTAGGAGAGTA) generating amplicons of 370 pb sizes, targeting cytochrome c oxidase subunit 3-ND3 genes (Kortbaoui et al., 2009). Initial and nested PCR final reaction mix (25 µL) consisted of 1 × PCR Buffer (Promega), 1.5 mM MgCl2, 0.5 mg mL−1 bovine serum albumin (except for the bovine PCR; Sigma-Aldrich, Lyon, France), 0.2 mM of each primer (Eurogentec; Seraing, France), 0.2 mM of each deoxynucleoside triphosphate (Eurogentec) and 0.5 U of Taq polymerase (Promega). The initial PCR reaction mix contained 60 ng of extracted DNA for all samples except SAR 268/269, SAR 272/273, SAR 276/277 and SAR 277/278 for which only 26, 28, 45 and 54 ng of template DNA was available for the reaction mixes. A volume of 10 µL of the initial PCR reaction was added to the nested reaction mix. Amplification was performed in a Veriti Thermal Cycler instrument (Applied Biosystems; Courtaboeuf, France) under the following conditions: after an initial denaturation at 94°C for 5 min, 35 cycles of denaturation (94°C, 40 s), annealing (initial PCR: 60°C for bovine and 59°C for ovine; nested PCR: 55°C for both mitochondrial markers, 1 min) and extension (72°C, 2 min) were performed, followed by a final extension (72°C, 10 min). The presence and size of amplified products from initial and nested PCR were verified by electrophoresis (20 min at 9.35 V cm−1) on a 1.65% agarose gel using Mass Ruler Express LR Forward Ladder (Fermentas). Gels were stained with ethidium bromide and gel images were captured using Image Lab software (Bio-Rad; Marnes-la-Coquette, France) and a ChemiDoc XRS + digital gel documentation system (Bio-Rad). Images were analysed using Image Lab software (Bio-Rad) to accurately determine the size of the amplified fragments.
To ensure the specificity of the nested PCR reaction, amplified DNA fragments from samples SAR 283/284 and SAR 264/265 cm deep were purified using NucleoSpin® Gel and PCR Clean-up kit (Macherey Nagel) according to the manufacturer protocol. Purified DNA fragments were cloned using the pGEMt Easy Vector System II (Promega) according to the manufacturer’s protocol. Five white colonies were randomly chosen for each tested sample, and inserts were sequenced using the SP6 primer at a dedicated facility from Université Lyon I (Laboratoire Biofidal-DTAMB). Sequences were analysed using BLAST (Altschul et al., 1990).
Quantitative PCR analysis
The possible presence of inhibitors of the PCR reaction in DNA extracts was verified using an Internal Positive Control (IPC, Applied Biosystems). DNA samples were tested with the IPC at 1/10 and 1/100 dilutions. Samples were diluted if inhibitors were present in the undiluted extract. Negative controls (no template DNA) were performed in triplicate for each run. All samples were tested in triplicate. PCR amplification was performed using a Bio-Rad CFX96 Real-time PCR instrument with Bio-Rad CFX Manager software, version 2.0. Total Bacteroidales were quantified using the primers BacUni-520f (CGTTATCCGGATTTATTGGGTTTA) and BacUni-690r2 (AATCGGAGTTCCTCGTGATATCTA), and the probe BacUni-656p ((FAM)-TGGTGTAGCGGTGAAA-(BHQ-1)) (Sigma-Aldrich) (Kildare et al., 2007). Mix preparation, PCR reactions and standard curves for quantification have been described (Marti et al., 2011). The limit of quantification of the Real-time PCR method was five target copies per reaction.
Data analyses
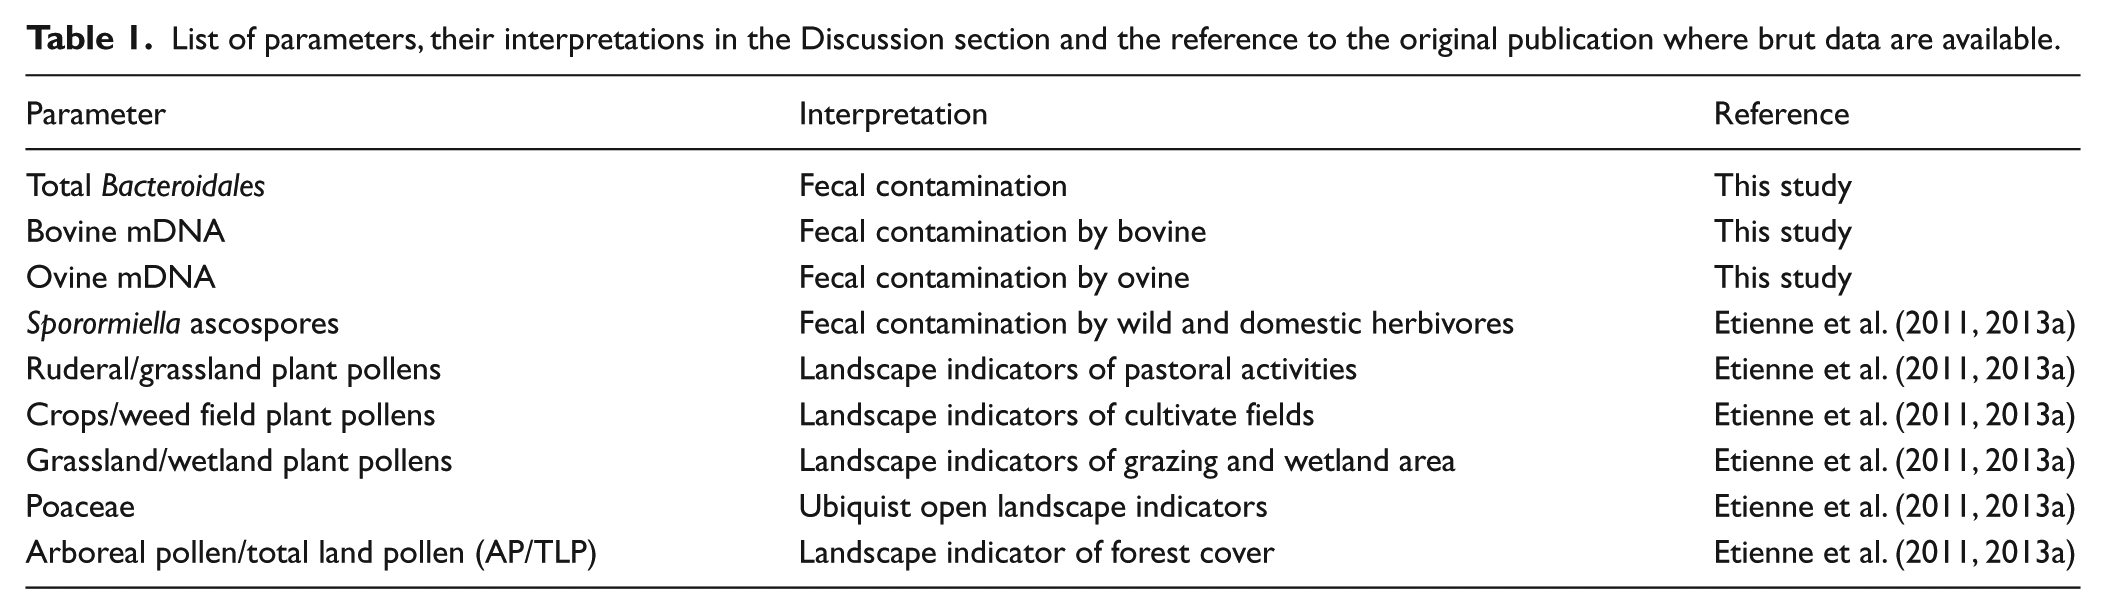
Sediment content (organic/mineral), pollen analysis and Sporormiella abundances of both sediment chronosequences are published elsewhere (Etienne et al., 2011, 2013a). These data were re-analyzed in the present study along with the new molecular results (Table 1). A Principal Component Analysis (PCA) allowing a mixed analysis of quantitative and qualitative variables to identify global trends in assemblage variations (Hill and Smith, 1976) was applied to the 31 subsamples from the CDs (14 subsamples for SAR and 17 subsamples for STJ) for which all of the following parameters were available: ‘cropland’ (% of crops/weed fields) and ‘grassland’ pollen indicators (% of ruderal/pastoral, pastoral/ubiquist and grasses), ‘forest’ pollen indicator (AP/TLP: arboreal pollen/total land pollen), Sporormiella accumulation rates (spores cm2 yr−1), total amount of extracted DNA (ng cm−3) and total Bacteroidales abundances (gene copy number g−1 Dry Mass; DM). Sporormiella fungal ascospores reflect more precisely the local soil occupation at the watershed scale because of their low dispersion ability (Davis and Schafer, 2006; Gill et al., 2013), than do pollen assemblages which represent the vegetation at a regional scale (Calcotte, 1995; Sugita, 1994).
List of parameters, their interpretations in the Discussion section and the reference to the original publication where brut data are available.
Correlations and levels of significance were investigated using Spearman test, both sites (SAR + STJ) treated together. Total Bacteroidales abundances (gene copy number g−1 Ash Free Dry Mass; AFDM), pollen indicator percentages and Sporormiella abundances were compared in samples with or without ovine and bovine mitochondrial DNA using a Wilcoxon test. PCA analysis and statistical tests were performed under the R open source statistical environment (R Core Team, 2013).
Nucleotide sequence accession numbers
A total of three partial bovine cytochrome b genes and three partial ovine cytochrome c oxidase genes subunit 3-ND3 have been deposited in the GenBank sequence database under accession numbers KM507194 to KM507199.
Results
Detection of bovine and ovine mDNA in sediments
The specificity of mitochondrial analysis for sediments samples archived deposited over 2200 years was validated by sequence analysis of cloned representative amplified DNA fragments. Cloning was carried out on PCR amplicons of sample SAR 283/284 cm deep for ovine mDNA, and SAR 264/265 cm deep for bovine mDNA. Four clones for each molecular marker were sequenced and all of them presented homologies with ovine or bovine mDNA; for bovine cytochrome b gene, homologies ranged between 99% and 100% with Bos taurus cytochrome b gene, and for ovine cytochrome c oxidase gene subunit 3-ND3, homologies were of 100% with Ovis aries cytochrome c oxidase gene subunit 3.
In SAR, ovine mDNA was detected in six samples and bovine mDNA in four samples out of the 25 tested (Figure 2). During SAR1, 6 out of the 18 tested samples were positive for the detection of ovine mDNA and 4 were positive for the detection of bovine mDNA. No ovine or bovine mDNA was detected in the samples from SAR2 or from the present period (SAR3).
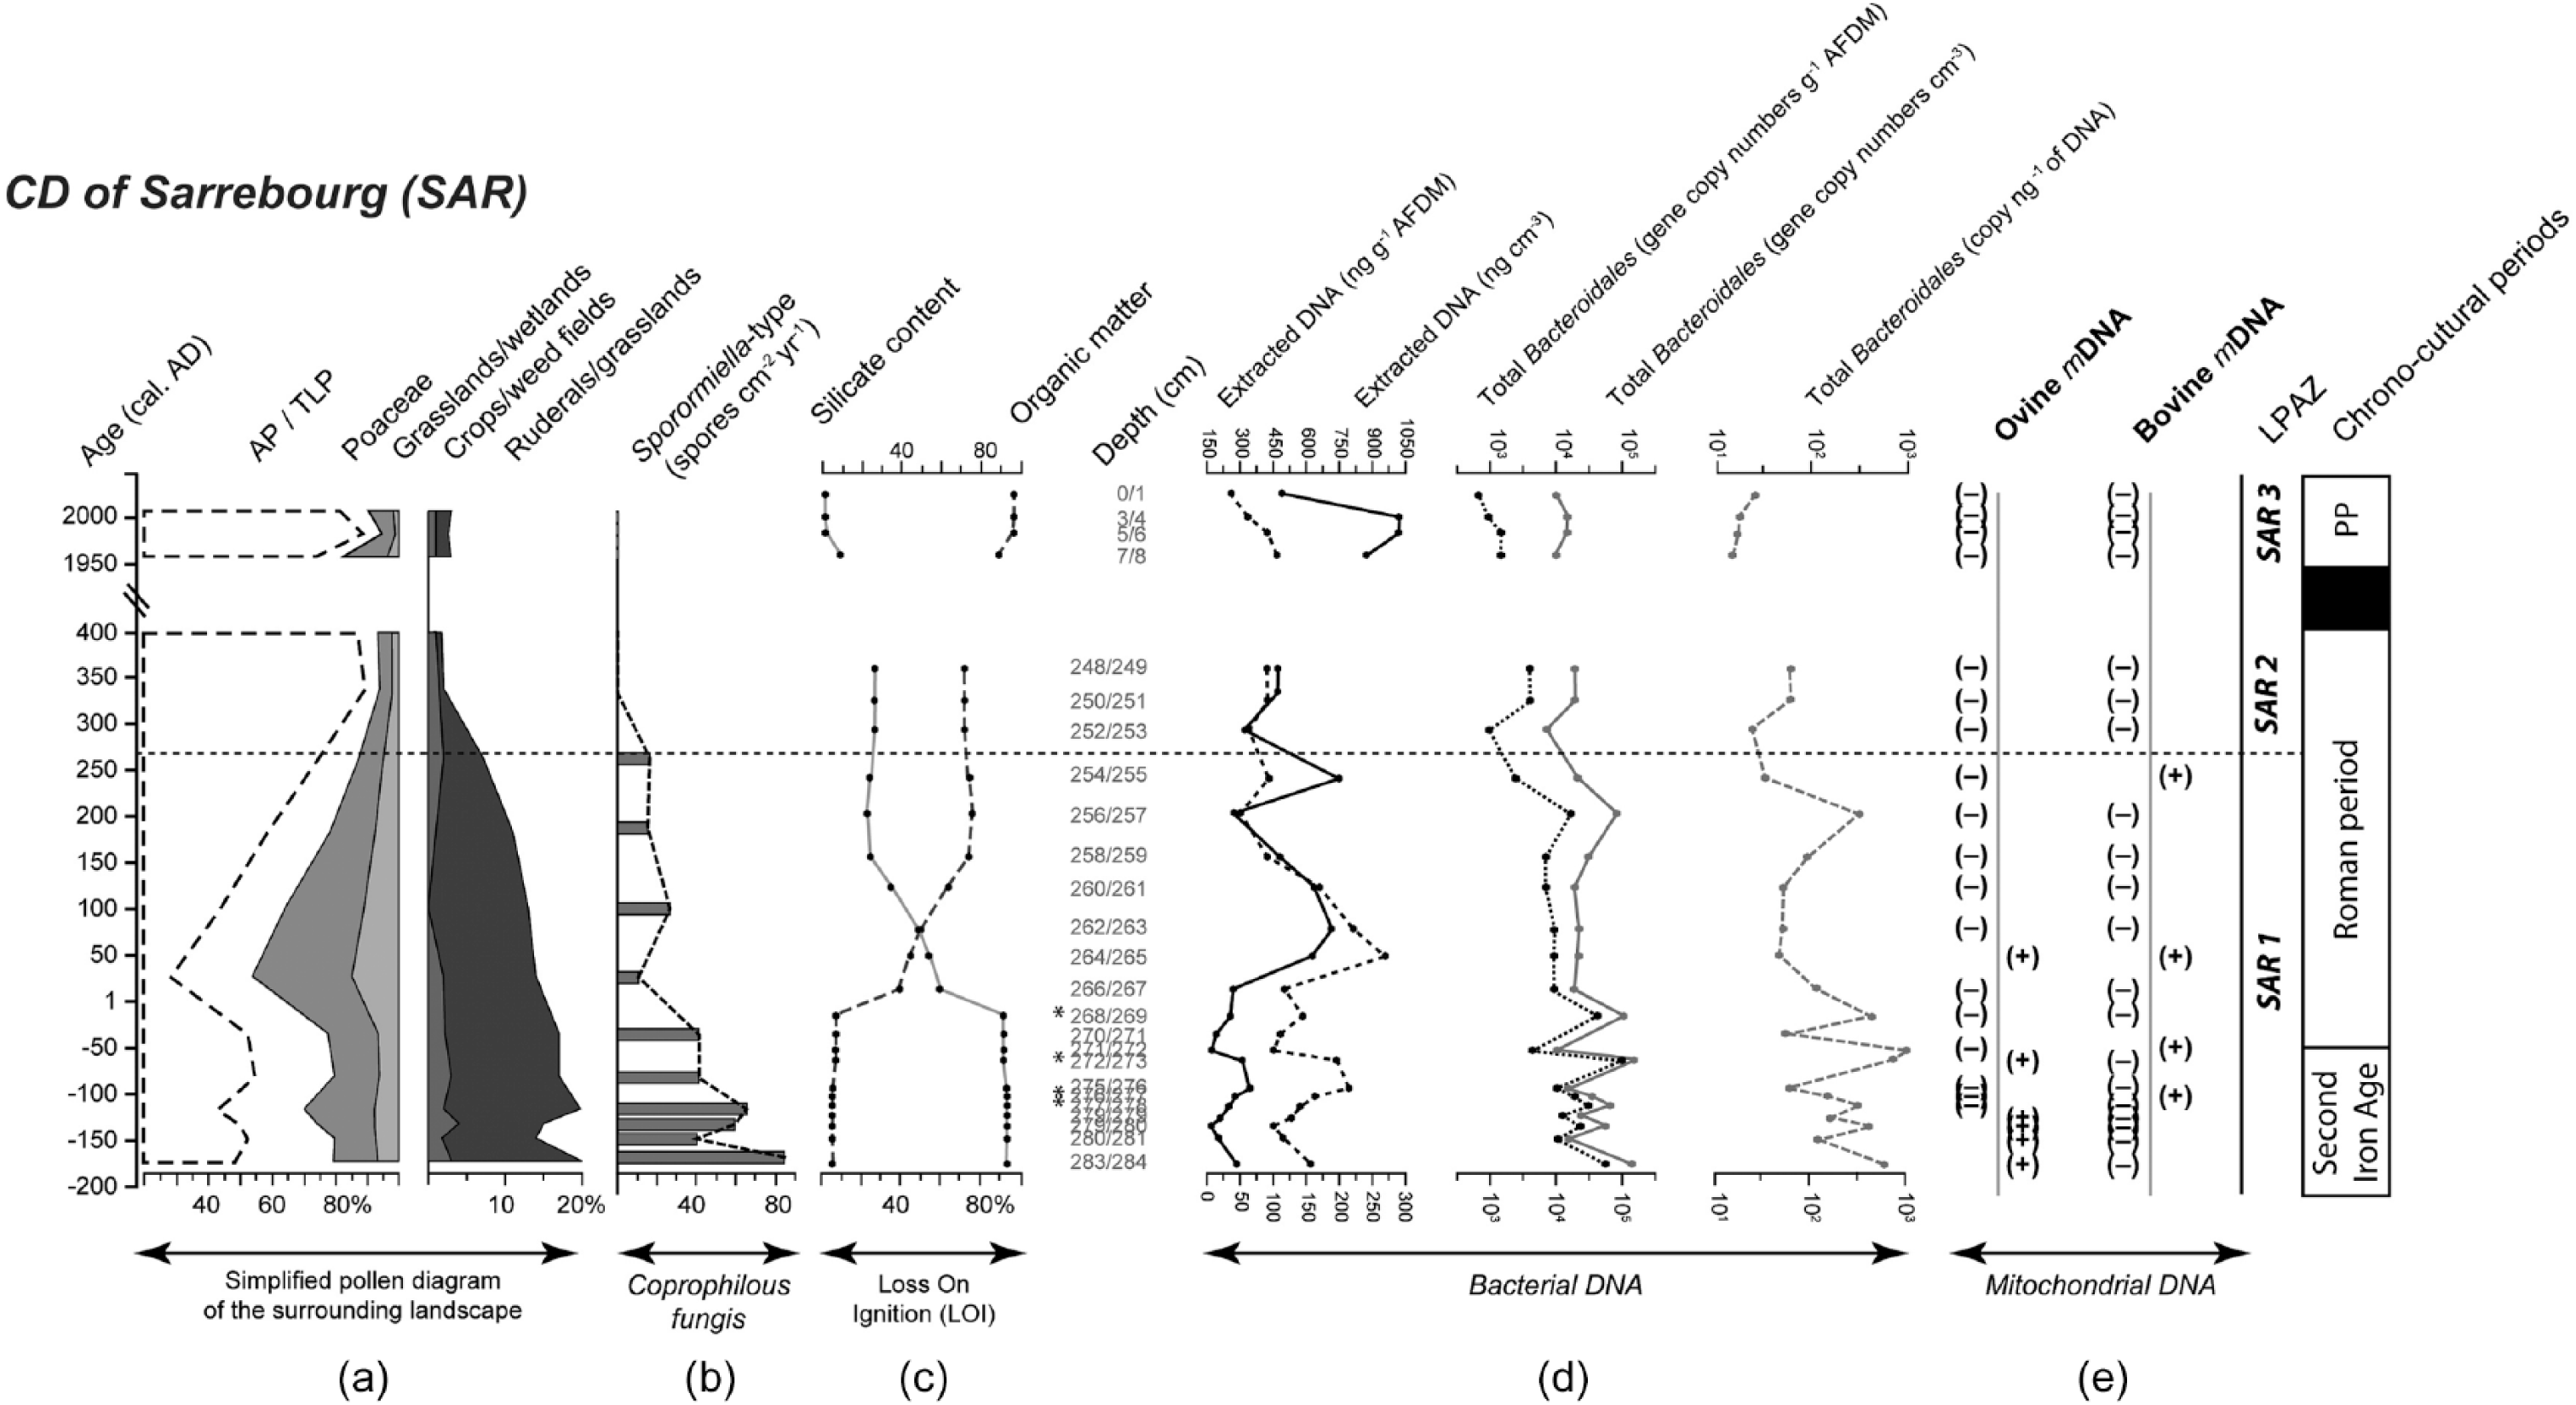
(a) Simplified pollen diagram of the vegetation surrounding the CD of Sarrebourg (SAR) with tree pollen (Arboreal Pollen/Total Land Pollen; AP/TLP); grassland/wetland (Apiaceae, Brassicaceae, Campanulaceae, Caryophyllaceae, Potentilla-type and Scrophulariaceae), grass pollen (Poaceae), ruderal/grassland (Anthemideae, Artemisia, Centaurea jacea, Chenopodiaceae, Cichorioideae, Plantago lanceolata, P. major/media, Rubiaceae, Rumex acetosa/acetosella and Urticaceae) and crop/weed field (Cannabis/Humulus, Centaurea cyanus, Cerealia-type, Papaver, Polygonum aviculare and Secale-type) pollen indicators; (b) abundances of Sporormiella-type spores (spores cm2 yr−1); (c) proportions of organic matter and silicates; (d) total amount of extracted DNA (expressed as ng g−1 AFDM and ng cm−3) and total Bacteroidales abundances (expressed as gene copy numbers g−1 AFDM, copy cm−3 and copy ng−1 extracted DNA); and (e) presence (+) or absence (−) of ovine and bovine mitochondrial DNA. The pollen diagrams are divided in Local Pollen Assemblage Zone (LPAZ). The acronym of the Present Period is PP. The asterisk (*) identifies samples for which the quantity of DNA template used in the initial PCR was below 60 ng. The dashed horizontal line represents separations between SAR1 and SAR2-SAR3 local pollen assemblage zones.
In STJ, ovine mitochondrial DNA was detected in 8 samples and bovine mitochondrial DNA in 1 sample out of the 23 tested (Figure 3). During STJ1, 5 out of the 7 samples were positive for the detection of ovine mDNA but no bovine mDNA was detected. During STJ2, 3 out of the 12 samples were positive for the detection of ovine mDNA and 1 was positive for bovine mDNA detection. No ovine, bovine or porcine mDNA was found later than 1530 cal. BP, nor in samples from the present period (STJ3).
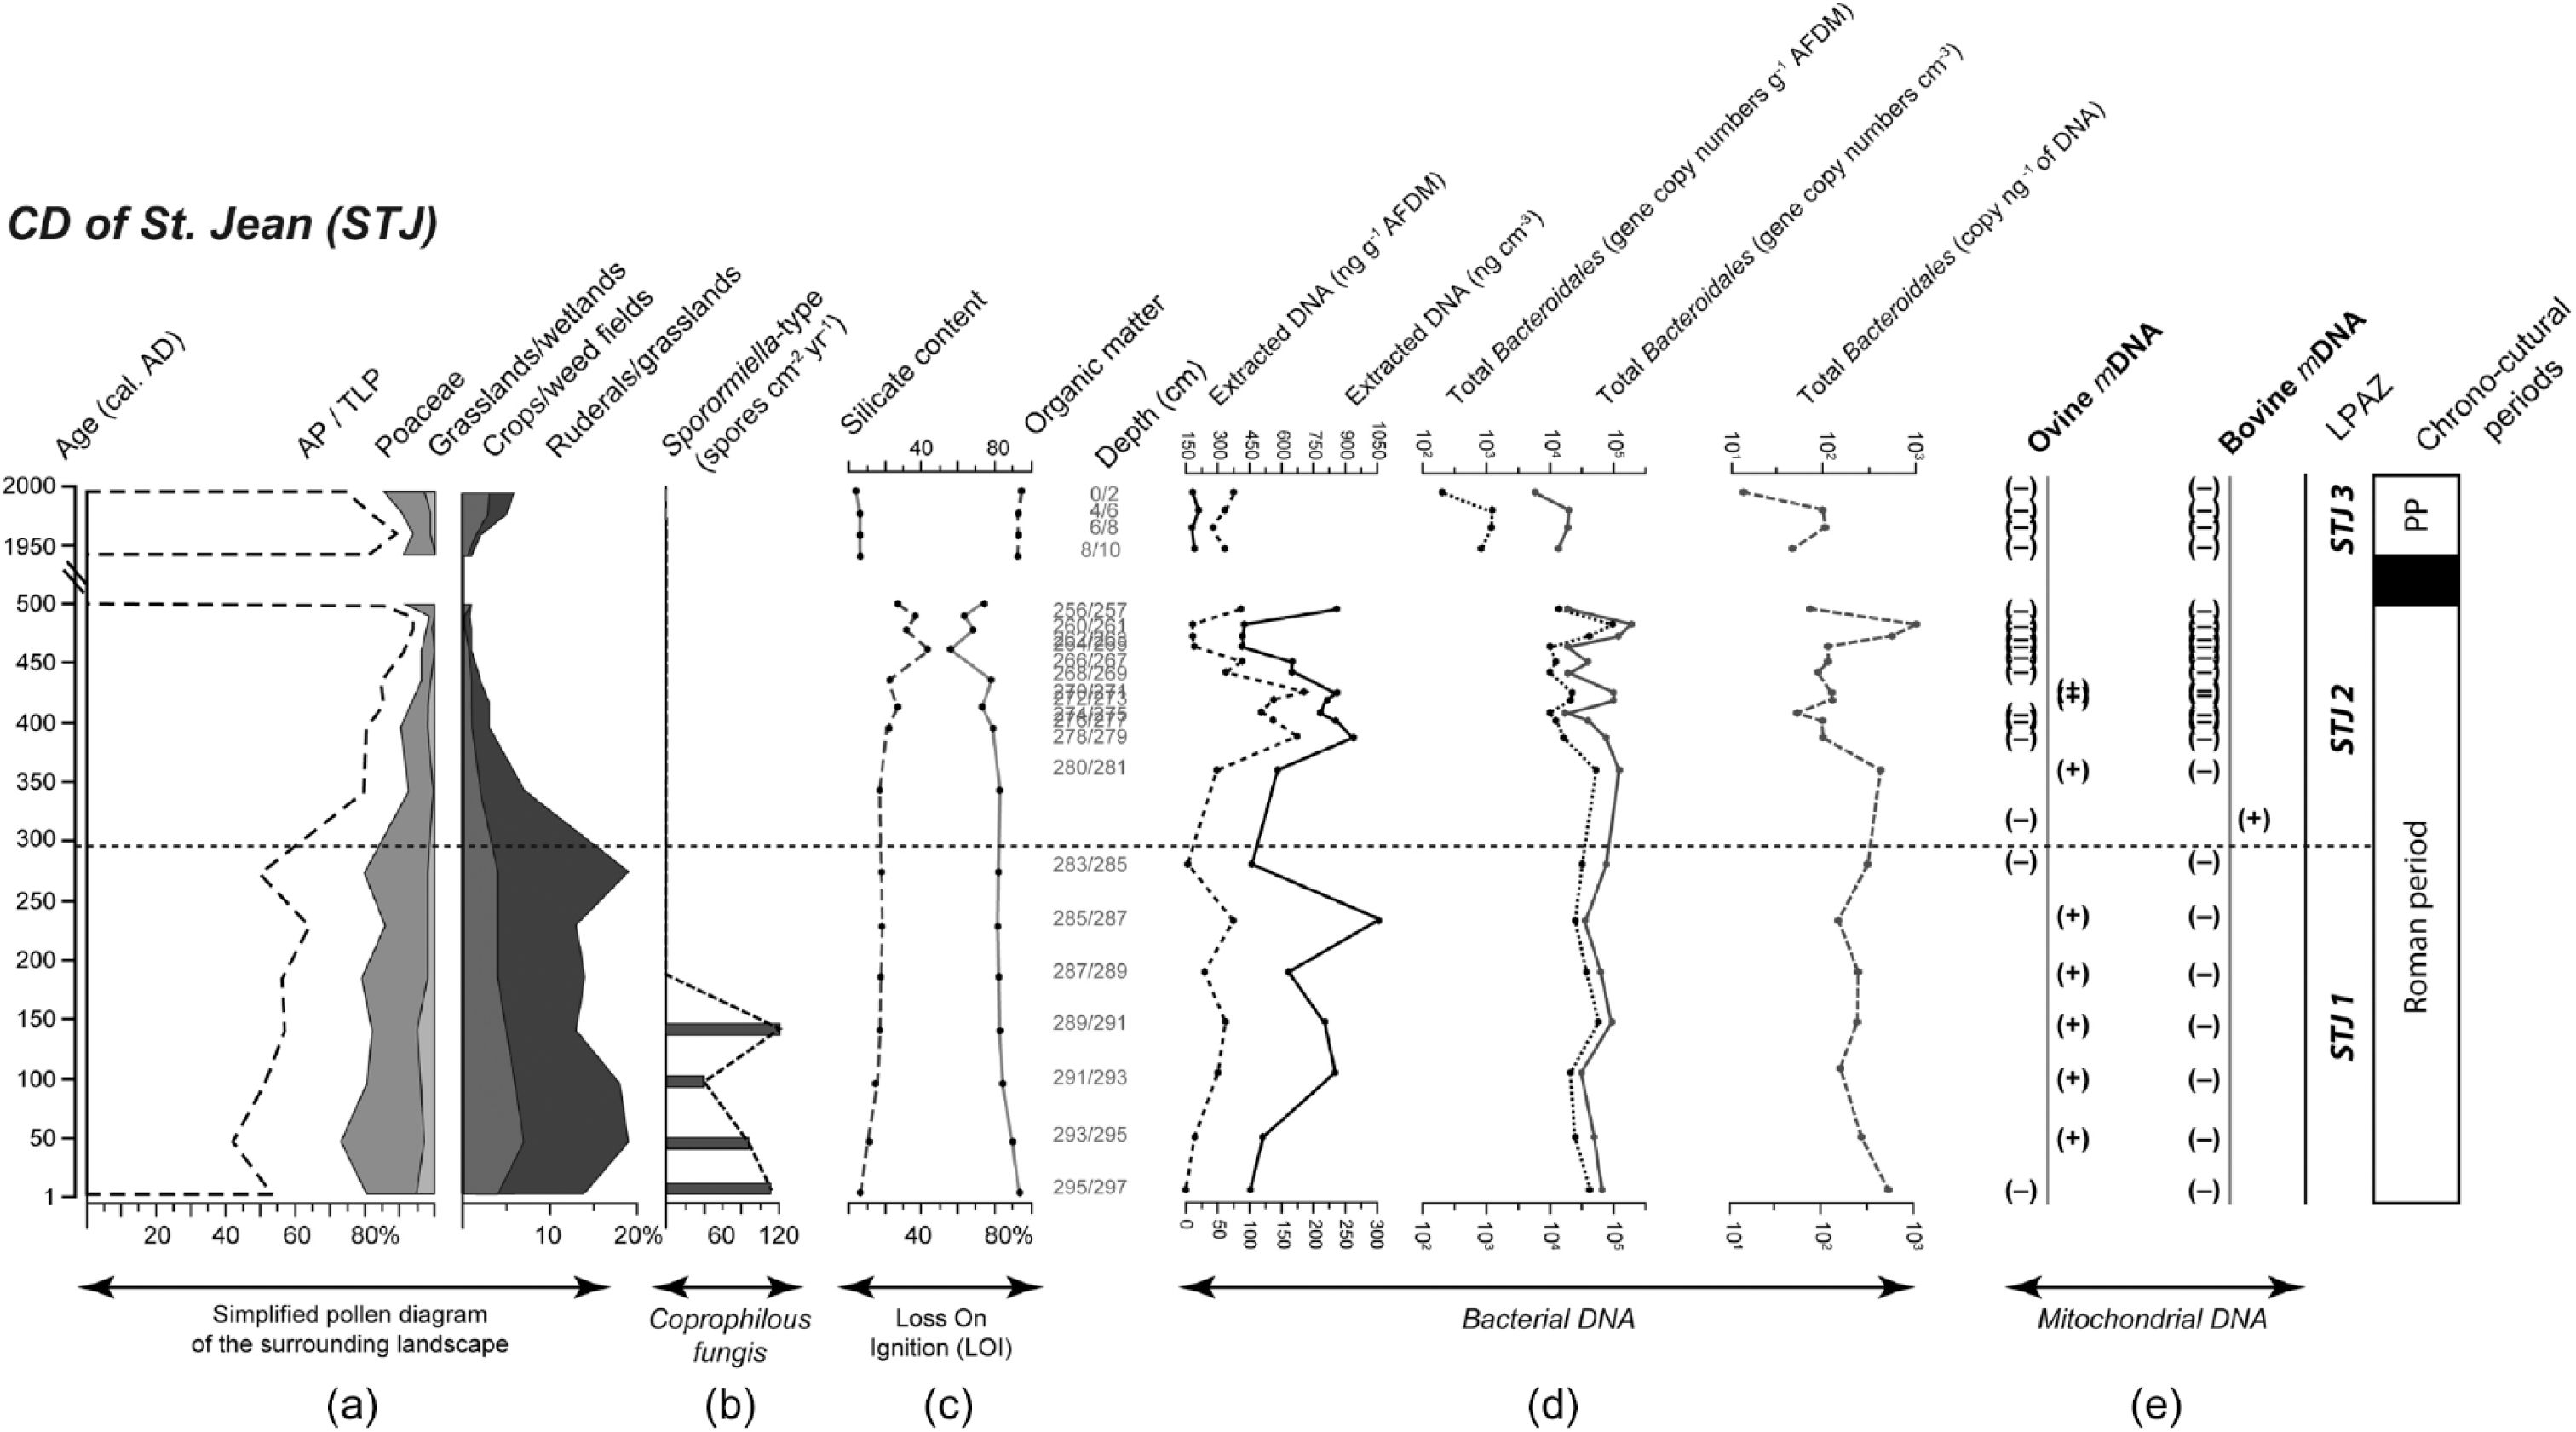
(a) Simplified pollen diagram of the vegetation surrounding the CD of St Jean (STJ) with tree pollen (Arboreal Pollen/Total Land Pollen; AP/TLP); grassland/wetland (Apiaceae, Brassicaceae, Campanulaceae, Caryophyllaceae, Potentilla-type and Scrophulariaceae), grass pollen (Poaceae), ruderal/grassland (Anthemideae, Artemisia, Centaurea jacea, Chenopodiaceae, Cichorioideae, Plantago lanceolata, P. major/media, Rubiaceae, Rumex acetosa/acetosella and Urticaceae) and crop/weed field (Cannabis/Humulus, Centaurea cyanus, Cerealia-type, Papaver, Polygonum aviculare and Secale-type) pollen indicators; (b) abundances of Sporormiella-type spores (spores cm2 yr−1); (c) proportions of organic matter and silicates; (d) total amount of extracted DNA (expressed as ng g−1 AFDM and ng cm−3) and total Bacteroidales abundances (expressed as gene copy numbers g−1 AFDM, copy cm−3 and copy ng−1 extracted DNA); and (e) presence (+) or absence (−) of ovine and bovine mitochondrial DNA. The pollen diagrams are divided in Local Pollen Assemblage Zone (LPAZ). The acronym of the Present Period is PP. The asterisk (*) identifies samples for which the quantity of DNA template used in the initial PCR was below 60 ng. The dashed horizontal line represents separations between STJ1 and STJ2-STJ3 local pollen assemblage zones.
Bacteroidales gene abundance in sediments
The Bacteroidales gene abundances in sediments reflect the transfer of fecal pollution from the watershed, we assume related to the presence and potentially the abundance of livestock and wildlife in the catchment area. The specificity of Bacteroidales analysis for sediments samples archived was validated by sequencing representative cloned amplified DNA fragments. Cloning was carried out on PCR amplicons of sample SAR 271/272 cm deep and STJ 278/279 cm deep.
In SAR, total Bacteroidales gene copy numbers ranged from 9.2 × 10² (copies g−1 AFDM) to 1.4 × 10⁵ (copies g−1 AFDM). The average (± standard deviation) gene copy numbers were 1.6 × 10⁴ ± 3.7 × 10⁴ (copies g−1 AFDM) in SAR1, 5.8 × 10³ ± 2.6 × 10³ (copies g−1 AFDM) in SAR2 and 1.3 × 10³ ± 4.0 × 10² (copies g−1 AFDM) in SAR3. Abundances of Bacteroidales were significantly different between SAR1 and SAR2 and between SAR1 and SAR3, but not between SAR2 and SAR3 (Wilcoxon test: p < 0.01, p < 0.005 and p = 0.23, respectively).
In STJ, total Bacteroidales gene copy numbers ranged from 8.6 × 10² (copies g−1 AFDM) to 1.3 × 10⁵ (copies g−1 AFDM). The average (± standard deviation) gene copy numbers were 5.0 × 10⁴ ± 1.2 × 10⁴ (copies g−1 AFDM) in STJ1, 2.7 × 10⁴ ± 3.5 × 10⁴ (copies g−1 OM) in STJ2 and 1.2 × 10³ ± 6.9 × 10² (copies g−1 AFDM) in STJ3. Abundances of Bacteroidales were significantly different between SAR1 and SAR2, between SAR1 and SAR3 and between SAR2 and SAR3 (Wilcoxon test: p < 0.005 for all three).
Associations between the presence of mDNA markers and abundance of Bacteroidales with sediment characteristics and pollen indicators
The percentage of variance explained by the first two factorial axes were 48% (axis 1) and 19% (axis 2), respectively. The first axis illustrated an opposition between Sporormiella, total Bacteroidales, ovine mDNA, bovine mDNA, crops/weed field and grassland/wetland pollen indicators, on the one hand, and total extracted DNA, AP/TLP and OM, on the other hand (Figure 4(a)). The second axis illustrated an opposition of AP/TLP, Sporormiella, total Bacteroidales, ovine mDNA and crops/weed field pollen indicators versus extracted DNA, OM, ruderal/grassland, grassland/wetland and grass pollen indicators and bovine mDNA (Figure 4(a)). The projection of individual samples through PCA axes (Figure 4(b)) illustrated a similar temporal evolution for both sites.
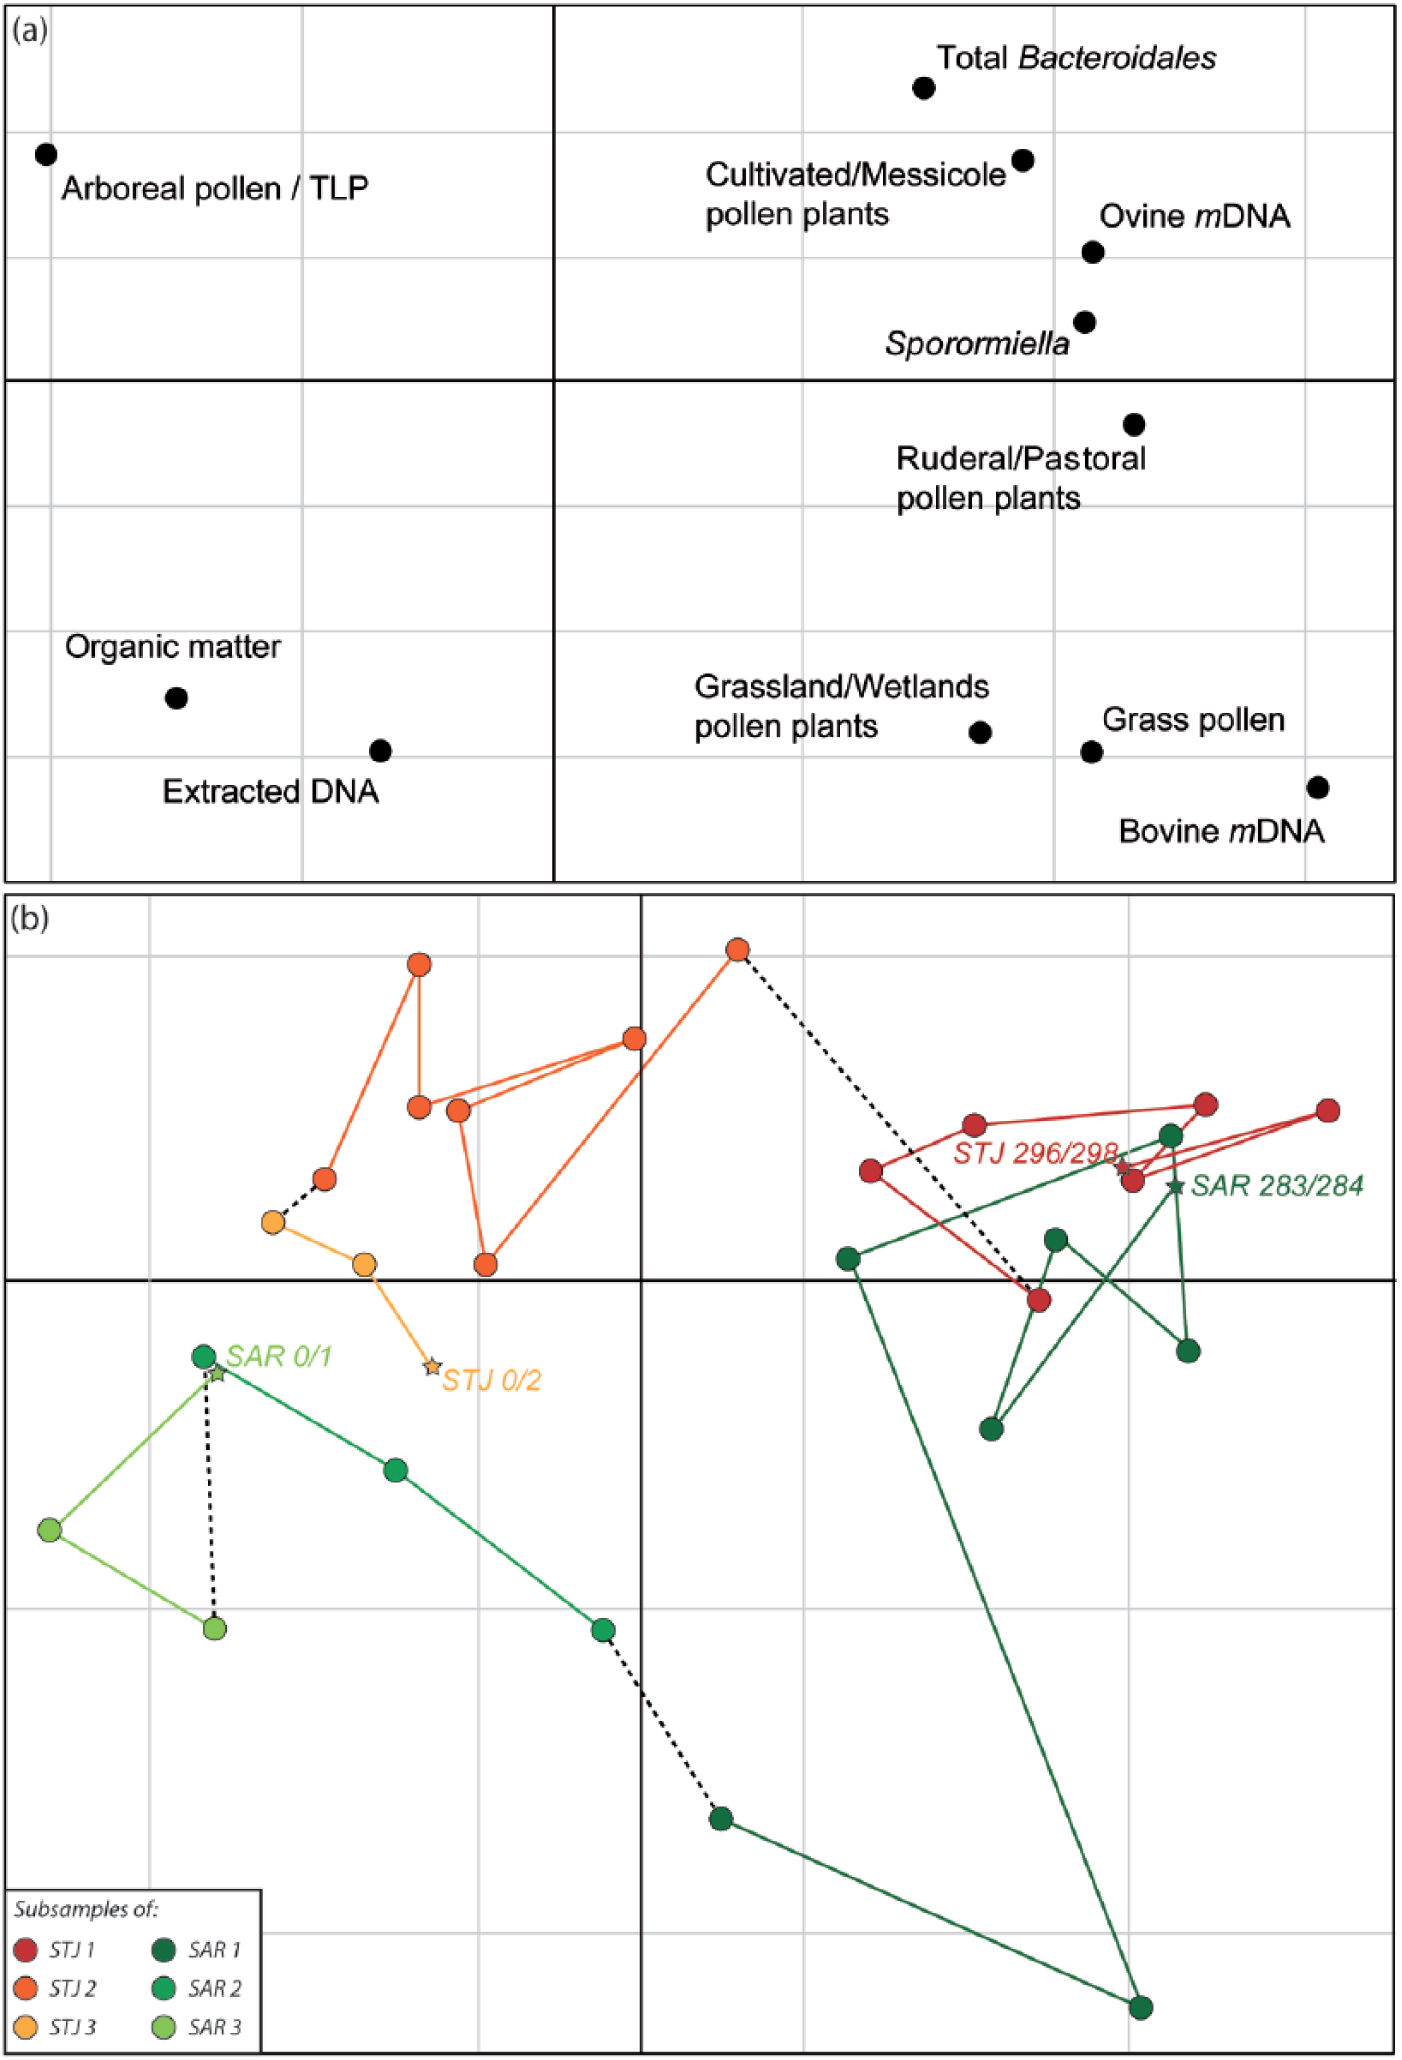
Principal component analysis of variables studied on both sites, showing (a) environmental variable projection and (b) individual sample projections on the first two axes of the analysis. The first two axes explain 48% and 19% of the variability, respectively.
Correlations coefficients (r) were calculated between all of these parameters at both sampling locations, but only those between total Bacteroidales/total DNA and organic matter (r = −0.72), AP/TLP (r = −0.38), crops/weed fields (r = 0.55), ruderals/grasslands (r = 0.59) and Sporormiella (r = 0.58) were statistically significant (Table 1). Total Bacteroidales/total DNA ratio (p = 0.002) and Sporormiella abundances (p = 0.03) for samples with ovine and bovine mDNA were significantly higher than for samples without these targeted mDNA (Figure 5). Organic matter (p = 0.0004) and arboreal pollen (p = 0.002) contents were significantly lower for samples where ovine and bovine mDNA were detected than in other samples, while percentages of grass pollens (p = 0.016) and ruderal/pastoral (p = 0.0002) and crop/weed field (p = 0.00009) plants were significantly higher. No significant difference for pollen indicators of pastoral/ubiquist plants (p = 0.08) were observed between both types of samples.
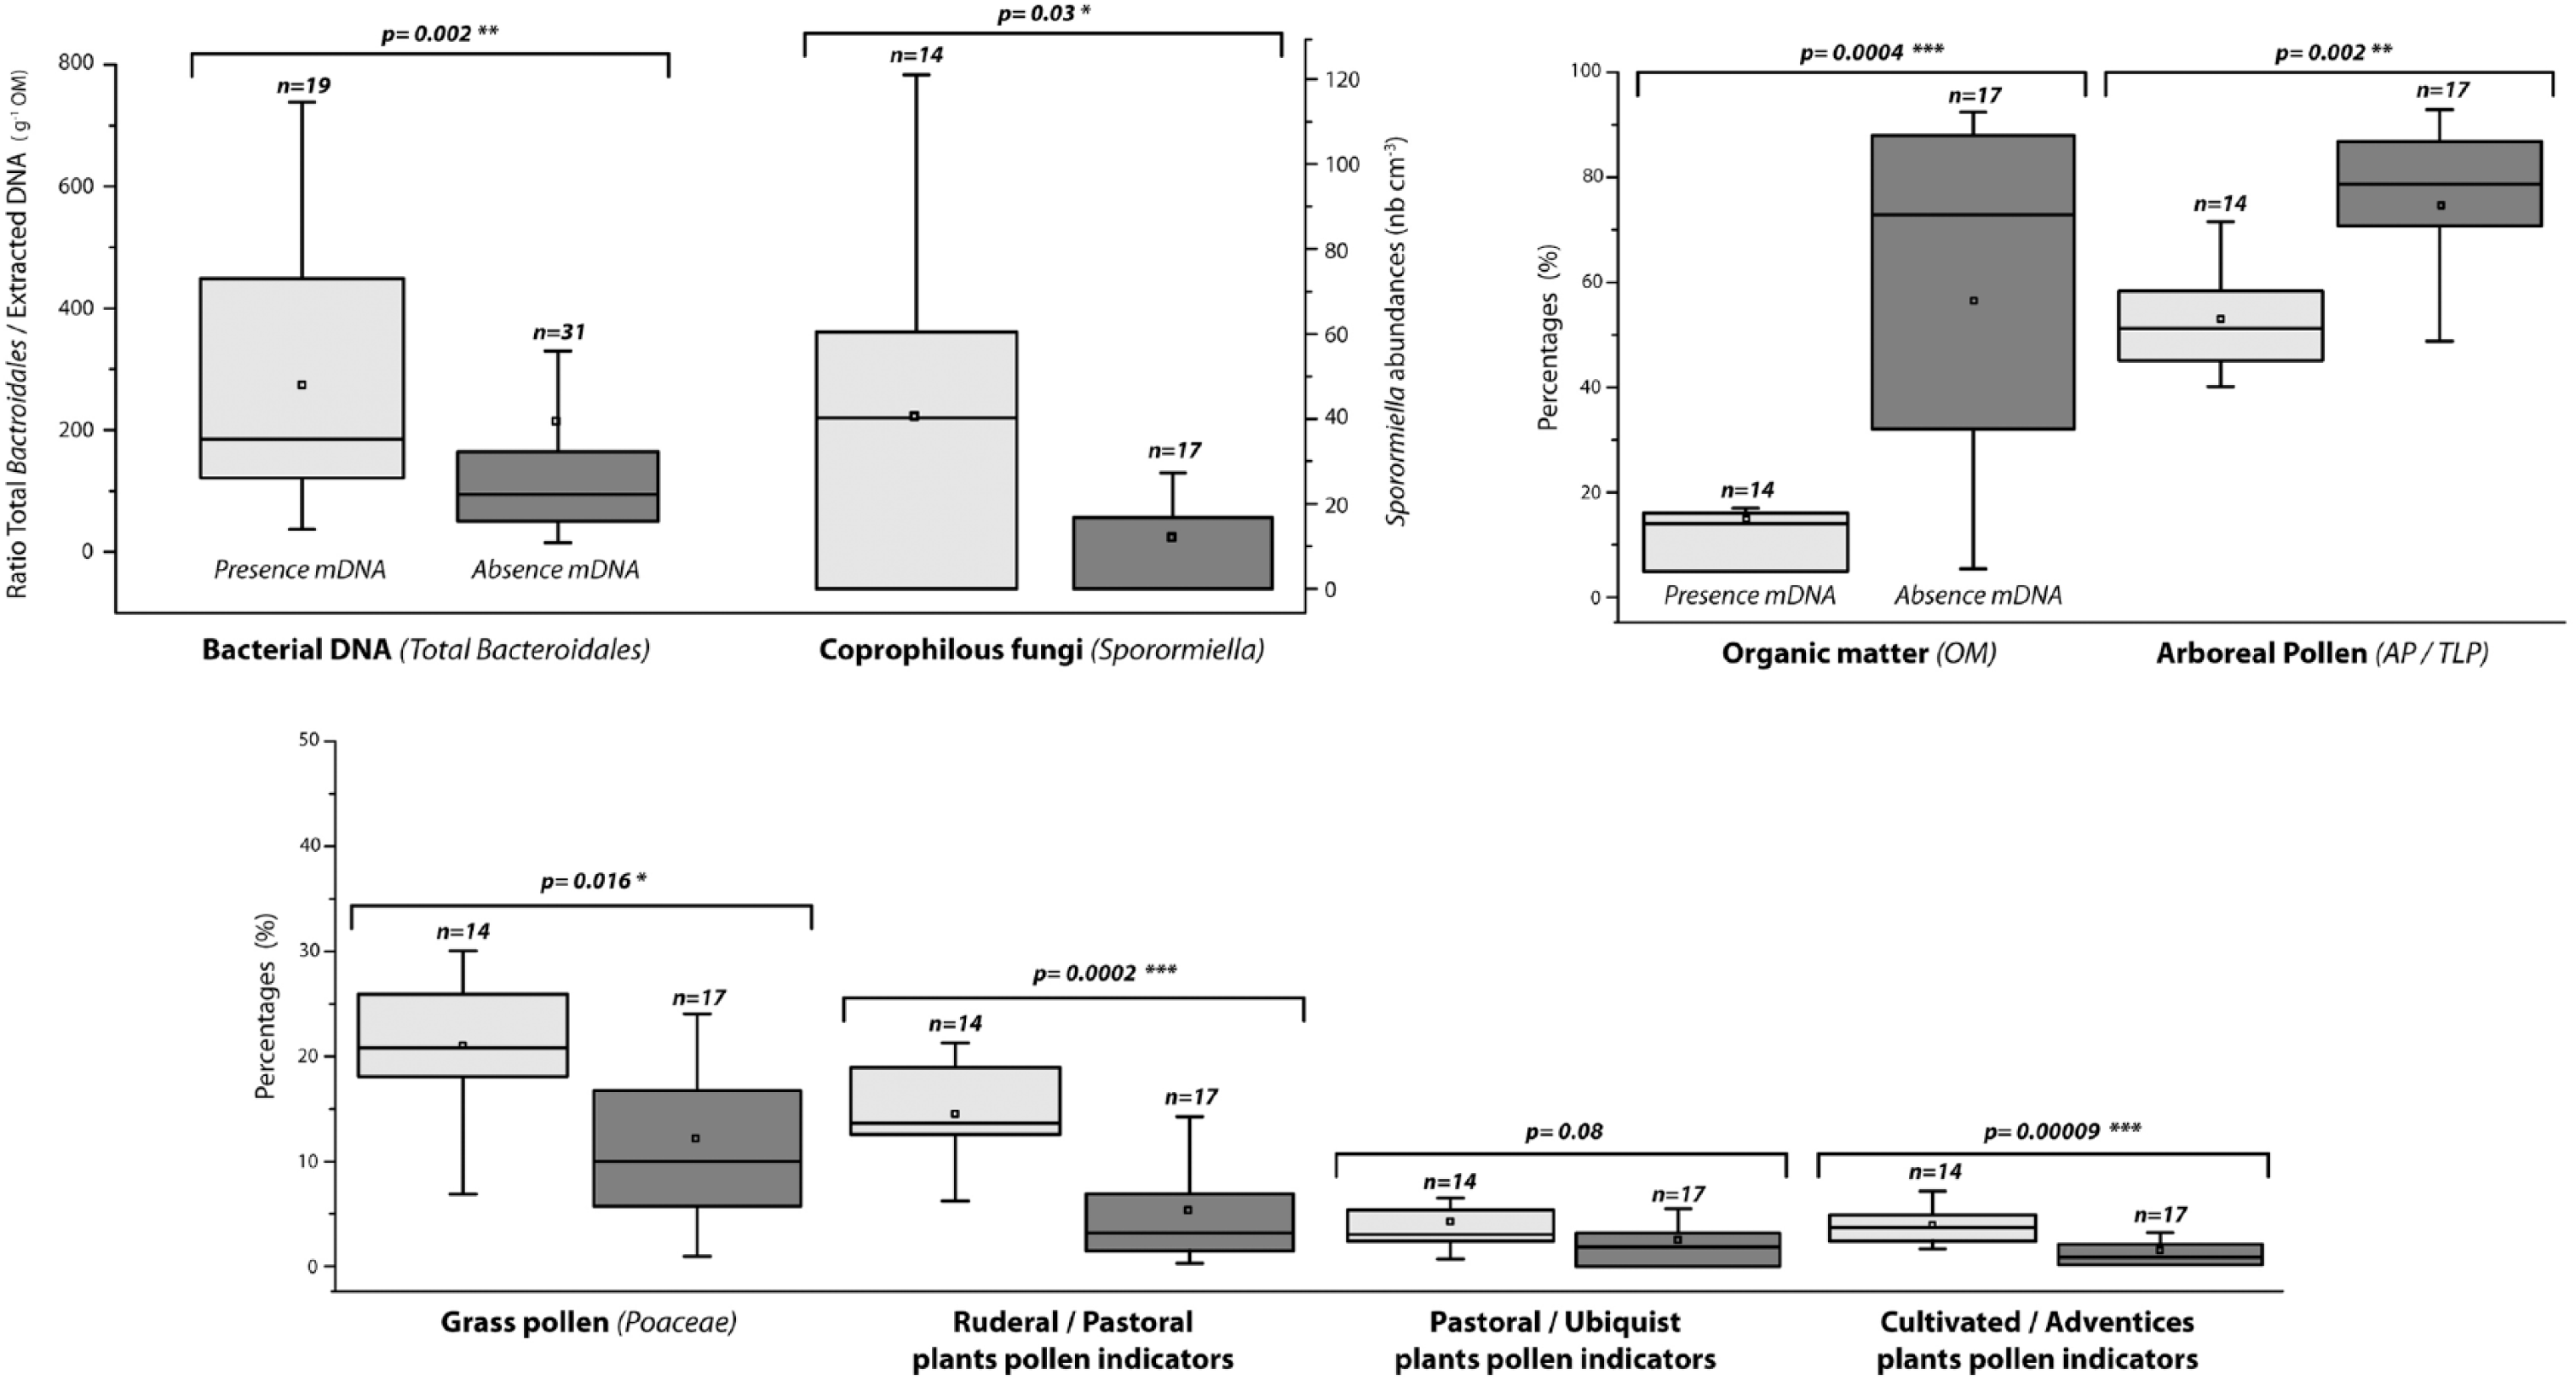
Comparison of total Bacteroidales/extracted DNA ratio, Sporormiella abundances, organic matter content, percentages of arboreal pollen, anthropogenic pollen indicators and grass pollen in samples with ovine and bovine mDNA detected (grey boxes), and in samples without mDNA detected (dark boxes). Boxes enclose 50% of the data with the median value for variable displayed as a line. Vertical lines display 1.5 times the interquartile distance from the box. Closed squares = means. Levels of significance (***p < 0.001; **p < 0.01; *p < 0.05) were determined using a Wilcoxon test.
Discussion
Determining whether herds are composed by ovine or bovine is not anecdotal but can be a reflection of the ancient local landscape shaping. Cattle farming requires large areas of suitable forage for grazing, and the harvest of hay for over wintering animals. In contrast, sheep can simply graze fallow land and stubble after harvest (pastoralism associated to agrarian practices). Historical written information about livestock species and agrarian practices during the Iron Age and the Roman periods are sparse (see Pliny the Elder, Caius Plinius Secundus or Columella, Lucius lunius Moderatus Columella). In France, bone remnants collected in archaeological sites indicate that herds comprised bovine, ovine and porcine (Sus scrofa domesticus) animals (Malrain et al., 2002; Matterne, 2001; Méniel, 2001).
During the second Iron Age and the classical Antiquity periods (2150–1750 BP; SAR1 and STJ1), pollen analyses suggest the presence of open mires in an open landscape (Figures 2–4), whereas they are nowadays peaty depressions in a forested context. Microscopic (pollen and ascospores) and molecular (fecal bacteria and mitochondria) methods demonstrate the presence of herbivores around mires and suggest they are used as watering hole by domestic herbivores in an agrarian/pastoral landscape. The presence and the abundance of ascospores and molecular fecal markers in sediments are linked to their initial production by animal husbandry in the watershed. This is modulated by several processes such as their degradation in the environment linked to their residence time in the watershed, their transfer to the lake system and their conservation in the sediment column. These processes will be different if ascospores or molecular fecal markers are considered but also depending on the targeted molecular markers. Sporormiella ascospores are released close to the ground (Ahmad and Cain, 1972; Davis and Schafer, 2006), and a fraction is transported to the lake on soil particles through runoff and streams (Etienne et al., 2013b; Parker and Williams, 2012) and preserved in the sediment column under anaerobic conditions. Molecular markers (fecal bacterial and mitochondrial) are more prone to degradations and certainly have a lower residence time in the watershed. Their mode of transport is still not well defined, and their preservation in the sediment column is a key point still not established. Moreover, some fecal bacteria have also the ability to multiply after their release into the secondary environment and potentially in the sediment.
Mitochondrial DNA indicates that it was only (STJ, Figure 3) or especially (SAR, Figure 2) ovine that was present around these ponds. It could suggest that cereal production was established in the watershed despite the low percentages of cereal pollen grains recorded in pollen diagrams for these periods (Figures 2 and 3) (19). Indeed, Sporormiella ascospores and molecular markers can reflect the presence of husbandry animals in the watershed, but also manure spreading (Graf and Chmura, 2006; Van Geel et al., 2003) to enrich soils and improve the production of crops fields. These combined pastoral and agrarian origins are perfectly illustrated in our statistical analyses (Figures 4 and 5 and Table 2). Moreover, each analysed subsample covers a range of time from 10 to 20 years, required for pollen analysis to limit the annual variability of pollen production. During this range of time, a combined pasture/crop picture in the same analysed subsample could be created by time shift in agronomic practices, such as crop rotation with successive grain farming and livestock pasturing on the same soils, and/or by synchronous agronomic practices, such as cereal production and then the grazing of livestock on crop stubble after harvest.
Correlation coefficients (r) for relations between ratio Total Bacteroidales/Total DNA, and organic matter, AP/TLP, crops/weed fields, ruderal/grassland, grassland/wetland and Poaceae percentages, and Sporormiella abundances in both sequences.
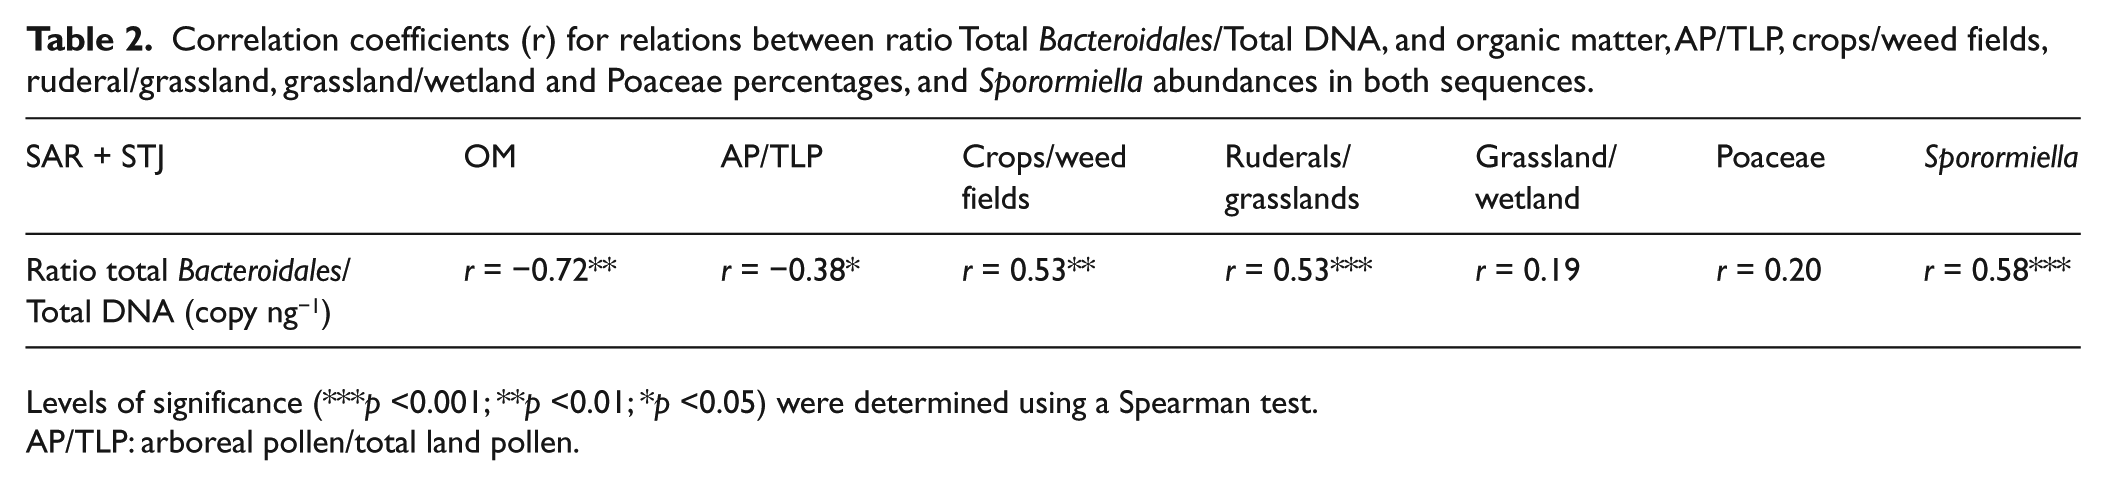
Levels of significance (***p <0.001; **p <0.01; *p <0.05) were determined using a Spearman test.
AP/TLP: arboreal pollen/total land pollen.
In the second part of the Roman period (1750–1500 BP; SAR2 and STJ2), microscopic and molecular methods demonstrate a progressive afforestation of the hollows and their surroundings. The detection of livestock DNA is less frequent and suggests a more sporadic occupation of the hollow’s surroundings. At the end of the Roman Empire (since 450 AD) and during the last century, the CDs are small peatlands within forests and no ovine or bovine mDNA was detected. Total Bacteroidales abundance could suggest that these intra-forested ponds are still used as watering hole by wildlife species, not evaluated in the present study.
The relations and correlations observed between molecular (sedaDNA) and microscopic (pollen, coprophilous fungal ascospores) methods illustrate the relevance to combine these proxies to identify and reconstitute past anthropogenic practices. Taken together, these results indicate that molecular methods applied to sedimentary archives appear extremely powerful to document former landscapes, anthropogenic impacts and potentially agronomic practices. Because of their small size, small catchment area and large sediment accumulation rate, ensuring an accurate recording of local information, these forest hollows represent a highly valuable source of information on landscape changes over the Holocene.
Footnotes
Acknowledgements
We thank Nathalie Tissot for the molecular biology experiment assistance.
Funding
The authors express their gratitude to the Agence de l’Eau Rhin Meuse, the DIREN and the Parc Naturel Regional de Lorraine for the funding provided for this study.