
Abstract
Sedimentary variation within and between annual moraine ridges formed at Storbreen and Styggedalsbreen, Jotunheimen, during the 1980s and 1990s is investigated with a focus on processes and mechanisms of moraine-ridge formation. Tops and bottoms of sediment slabs, deposited either as single annual moraines or incorporated into composite moraine ridges formed of several annual increments, were analysed and compared with possible source sediments with a view to sediment fingerprinting. Clast roundness and shape indicated mainly subglacial sediment origins while textural variability was mainly inherited from proglacial sediment sources, and macrofabrics and micromorphological characteristics revealed overprinting by various glaciofluvial, glaciolacustrine and periglacial processes. The evidence suggests one dominant mechanism of moraine-ridge formation involving the annual freeze-on and subsequent melt-out of overridden proglacial sediment slabs. This mechanism provides the basis of a simple model encompassing both singular and composite annual moraine-ridge formation, which appears appropriate for temperate glacier snouts characterized by deep seasonally frozen ground, close to the lower altitudinal limit of the zone of alpine permafrost.
Keywords
Introduction
The formation of moraine ridges is an important theme in glacial geomorphology, glaciology and Quaternary science. Ice-marginal moraine ridges, in particular, reflect the behaviour and dynamics of glaciers, provide evidence of environmental change and are useful in palaeoenvironmental reconstruction (Benn and Evans, 2010; Evans, 2013; Knight, 2006). Mechanisms of moraine-ridge formation remain controversial, however, because of the diversity of moraine-ridge forms produced in different glacial environments, the wide range of processes potentially involved either singly or in combination and the existence of relatively few detailed studies of modern analogues. The study of modern analogues has been hindered, moreover, by the global trend of glacial retreat since at least the mid-20th century (Meier et al., 2007; Zemp et al., 2008), which has led to comparatively few opportunities to observe moraine-ridge formation at advancing glacier margins (e.g. Evans and Hiemstra, 2005; Krüger, 1993, 1995; Winkler and Nesje, 1999).
Annual moraine ridges, which form during winter advances of otherwise retreating glaciers, in some ways provide the exception that proves the rule. Various studies have investigated the formation of annual moraines at glacier fronts in different parts of the world, and several mechanisms of formation have been proposed, including push, squeeze and freeze-on (Andersen and Sollid, 1971; Beedle et al., 2009; Birnie, 1977; Boulton, 1986; Bradwell, 2004; Krüger, 1995; Lukas, 2012; Ono, 1985; Reinardy et al., 2013; Sharp, 1984; Worsley, 1974). Evidence for these mechanisms has derived from both the surface form of the ridges and their subsurface structure and sedimentology. Understanding of the mechanisms has been promoted by the fact that formation of each annual moraine takes place during one annual cycle of glacier advance and retreat. This produces a moraine ridge with a relatively simple morphology and structure and an opportunity for sediment fingerprinting in the absence of the more complex process interactions that might obscure how the moraine was formed (Lukas, 2012; Reinardy et al., 2013). Furthermore, the possibility of relatively large moraines being built up incrementally by superposition, stacking or otherwise incorporating much smaller annual moraines has been recognized (Evans and Hiemstra, 2005; Krüger, 1993, 1996; Matthews et al., 1995; Winkler and Matthews, 2010). Thus, the study of annual moraines can make a contribution to understanding relatively large, composite moraine-ridge deposition.
The present paper builds on this tradition at two southern Norwegian glaciers, Storbreen and Styggedalsbreen, where the chronology of the annual ridges and annual increments of sediment can be firmly established. The overall aim is to improve understanding of the interplay of processes operating at, or close to, the margin of glaciers during till deposition and moraine-ridge formation. Specific objectives are (1) to analyse the variation within and between the annual increments (slabs) of sediment (till units), (2) to test the possible mechanisms of annual moraine-ridge formation using sediment fingerprinting (i.e. using sedimentological indicators as clues to the sources and transport and depositional processes involved in moraine formation) and (3) to develop a mechanistic model linking singular annual and/or composite annual moraine formation to glacier dynamics and thermal regime.
Study sites, glacier-front variations and annual moraine-ridge chronology
The moraine-ridge complexes under investigation are on the forelands of two small N-NE facing glaciers in the Jotunheimen mountain range of central southern Norway: Storbreen (c. 5 km2, front at an altitude of 1420 m a.s.l.) and Styggedalsbreen (<2 km2, front at 1280 m a.s.l.) (Figure 1; Andreassen and Winsvold, 2012; Østrem et al., 1988). The geology of the region consists mainly of pyroxene granulite gneiss with small peridotite intrusions (Lutro and Tveten, 1996). The closest meteorological station (Sognefjell, 1413 m a.s.l.; see Figure 1) indicates a climate that is transitional between maritime and continental with a mean annual air temperate (MAAT) of −3.1°C (July mean +5.7°C; January mean −10.7°C) and mean annual precipitation of 860 mm (Aune, 1993; Førland, 1993). The present regional lower altitudinal limit of discontinuous permafrost in southern Norway lies at c. 1500 m a.s.l. (Etzelmüller and Hagen, 2005; Etzelmüller et al., 2003; Isaksen et al., 2002; Lilleøren et al., 2012). Thus, the sites lie c. 80 m and c. 220 m below this limit at Storbreen and Styggedalsbreen, respectively. However, the permafrost limit may be lower than this at Styggedalsbreen because of a decreasing altitudinal trend from east to west in Jotunheimen and because the glacier foreland topography at Styggedalsbreen is less conducive to snow accumulation than that at Storbreen.
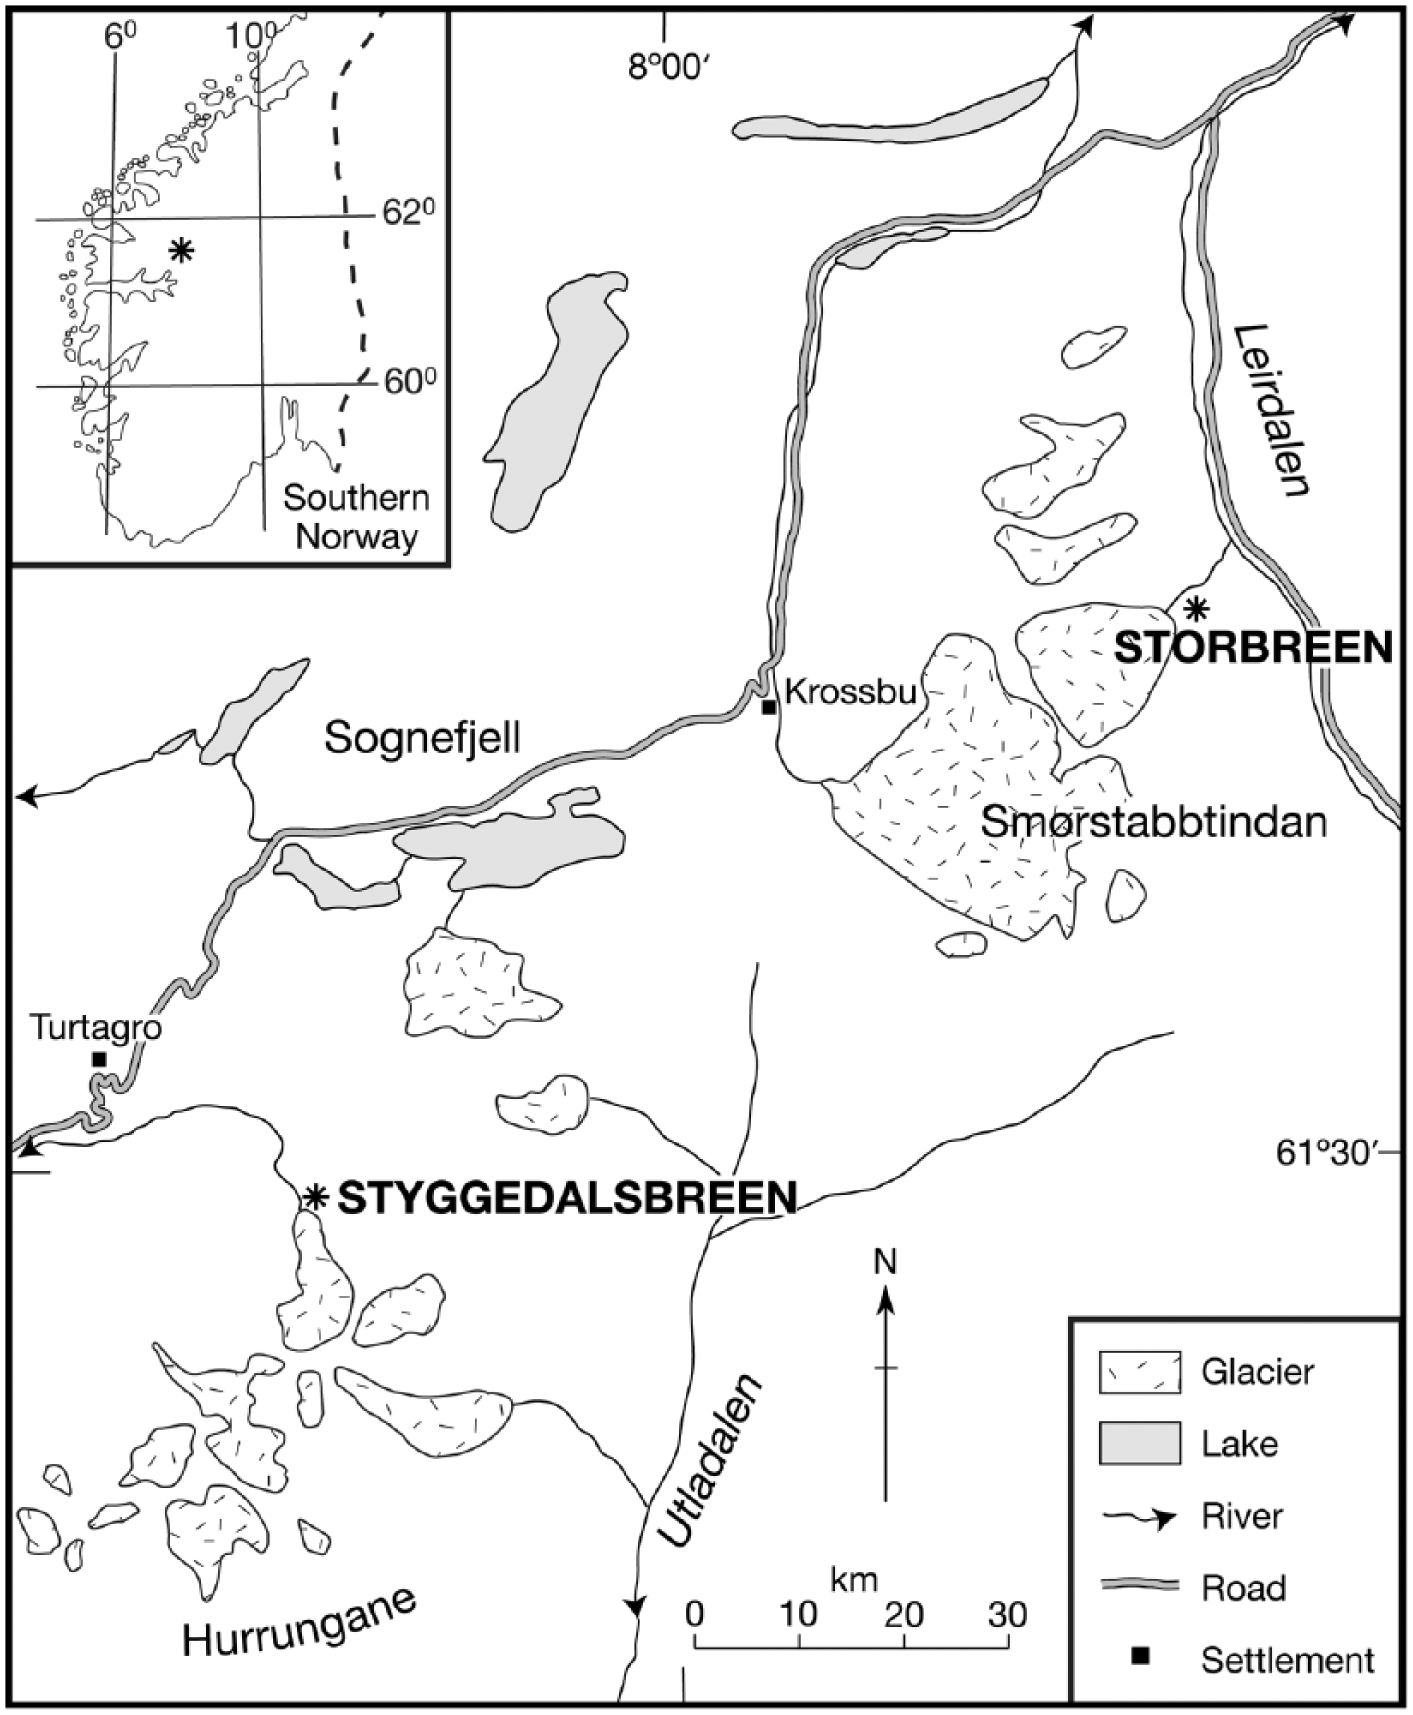
Location of Storbreen and Styggedalsbreen, Jotunheimen, southern Norway.
Glacier-front variations of Storbreen from 1975 to 2007 are summarized in Figure 2. Apart from six missing years, 1982, 1991–1993, 2000 and 2002, the position of the glacier snout has been recorded annually by the Norwegian Polar Institute and the Norwegian Water Resources and Energy Directorate (e.g. Kjøllmoen, 2008). In addition, photogrammetric maps of the glacier as a whole (scale 1:10,000) were made in 1984 and 1997 (Andreassen, 1998). Distance from a single fixed point to the glacier margin was measured at the end of the ablation season. During most years from 1975 to 2007, there was net retreat of the glacier. Cumulative retreat over this period totalled 120 m, but between 1983 and 1999 it was only 12 m: indeed, the annual measurements show that the glacier was stationary or advancing for five of these years.
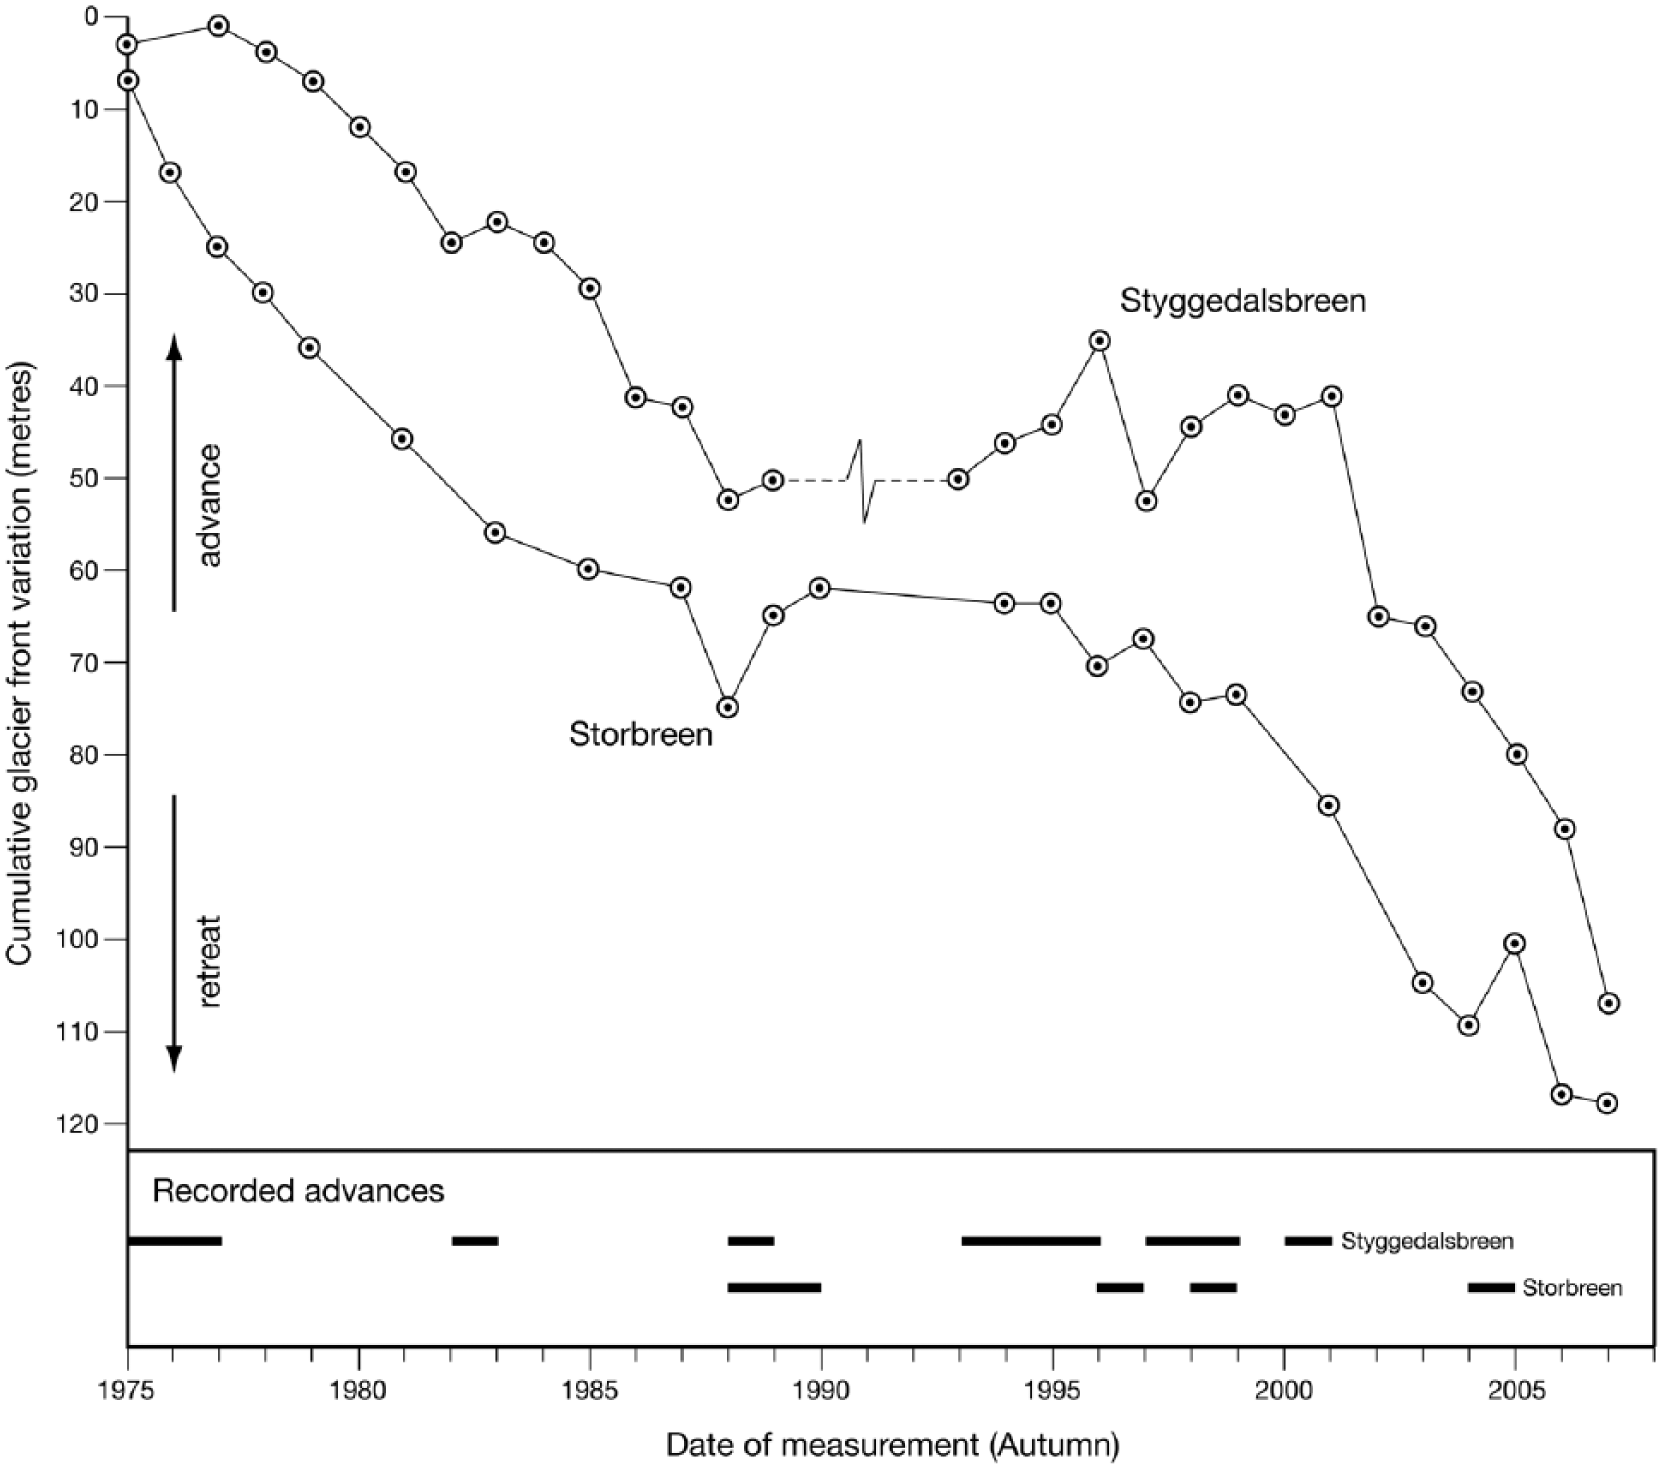
Cumulative glacier-front variations of Storbreen and Styggedalsbreen, 1975–2007 (after Andreassen and Winsvold, 2012).
Annual moraine ridges at Storbreen (Figure 3) fall clearly into two series: a degraded distal series (the ‘1980s series’) of at least eight discrete ridges, which are <0.5 m high and relatively well separated in space, and a fresher, proximal series (the ‘1990s series’) of at least eight ridges, which are up to 2 m in height and exhibit greater overlap within a narrow zone. The proximal series overlaps the distal series towards the south-east. The pattern of ridges traces the outline of a distinct lobe of the Storbreen snout, which shifted southwards through time. The number and ages of the ridges are consistent with a single ridge being formed in most years, and hence, they may be termed annual moraines.
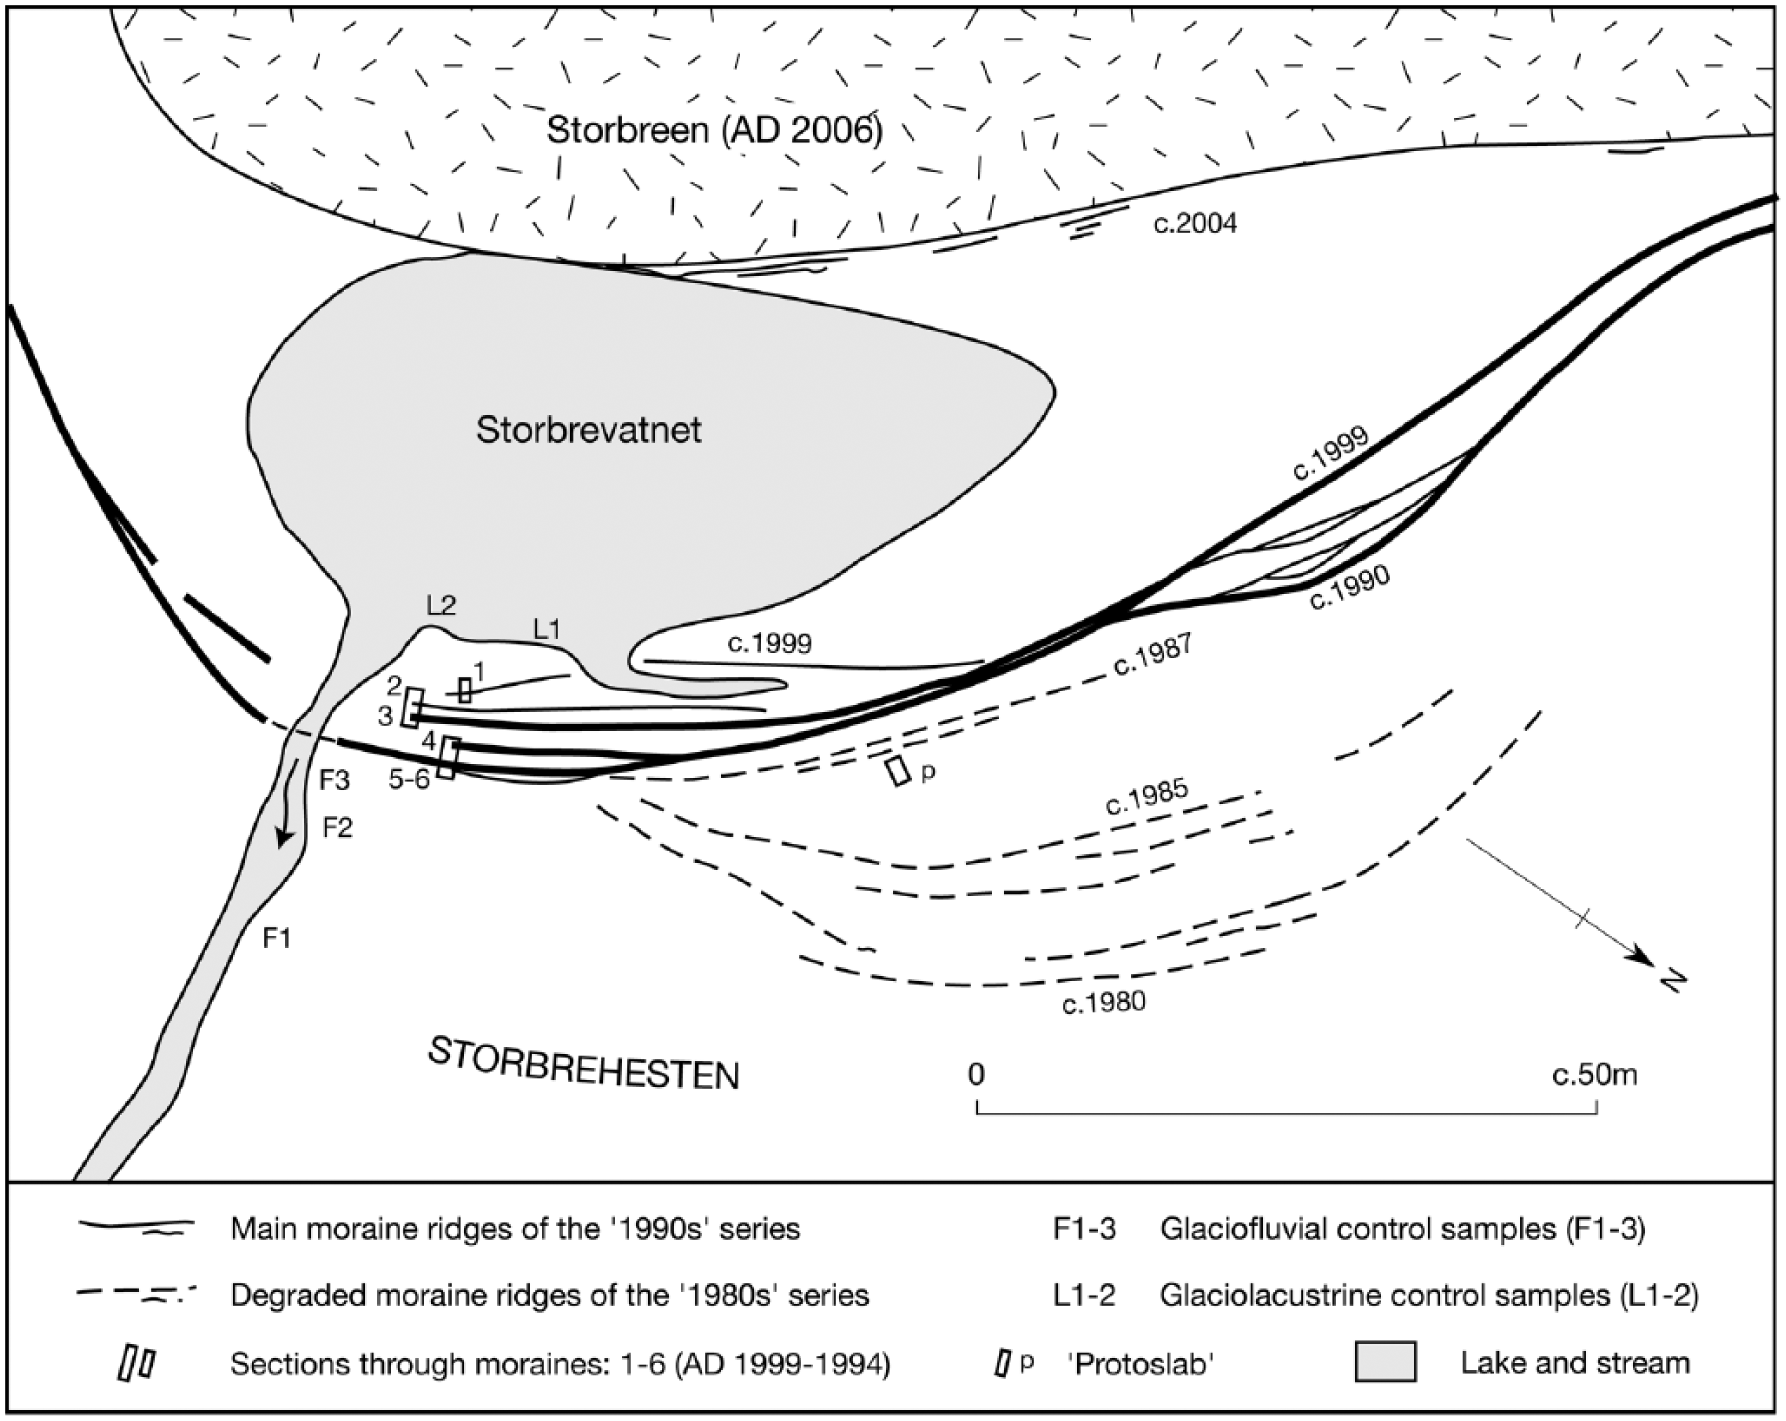
Sketch map of the moraine ridges and sampling sites in the proglacial area of Storbreen.
Dates for individual ridges in Figure 3 have been assigned by ‘counting back’ using the measurements in Figure 2. Although never observed in the winter, it is known that the ridges were formed during seasonal (late winter–spring) advances of the glacier snout because several have been seen to appear between successive summer observation periods. The degraded series corresponds with a period of net annual retreat when the rate of retreat was slowing down. The most prominent ridges of the proximal series towards the north-west dating from 1990 and 1999 correspond with the net annual advances of up to 10 m recorded in 1989 and 1990 and in 1997 and 1999, respectively. The year of relatively large retreat (13 m) in 1988 separates the two series, while the relatively rapid retreat of >30 m between 2000 and 2003 (which has continued since) ended the formation of the proximal moraine-ridge series. The latter period of strong retreat of a thin glacier snout can also be inferred to have produced the fluted till plain proximal to the 1999 ridge in Figure 3.
The focus of the study at Storbreen is on the south-east part of the 1990s series, where the annual ridges are stacked against each other forming one relatively large, composite moraine (Figure 4a). Thus, six annual increments to the larger moraine were made between 1994 and 1999.
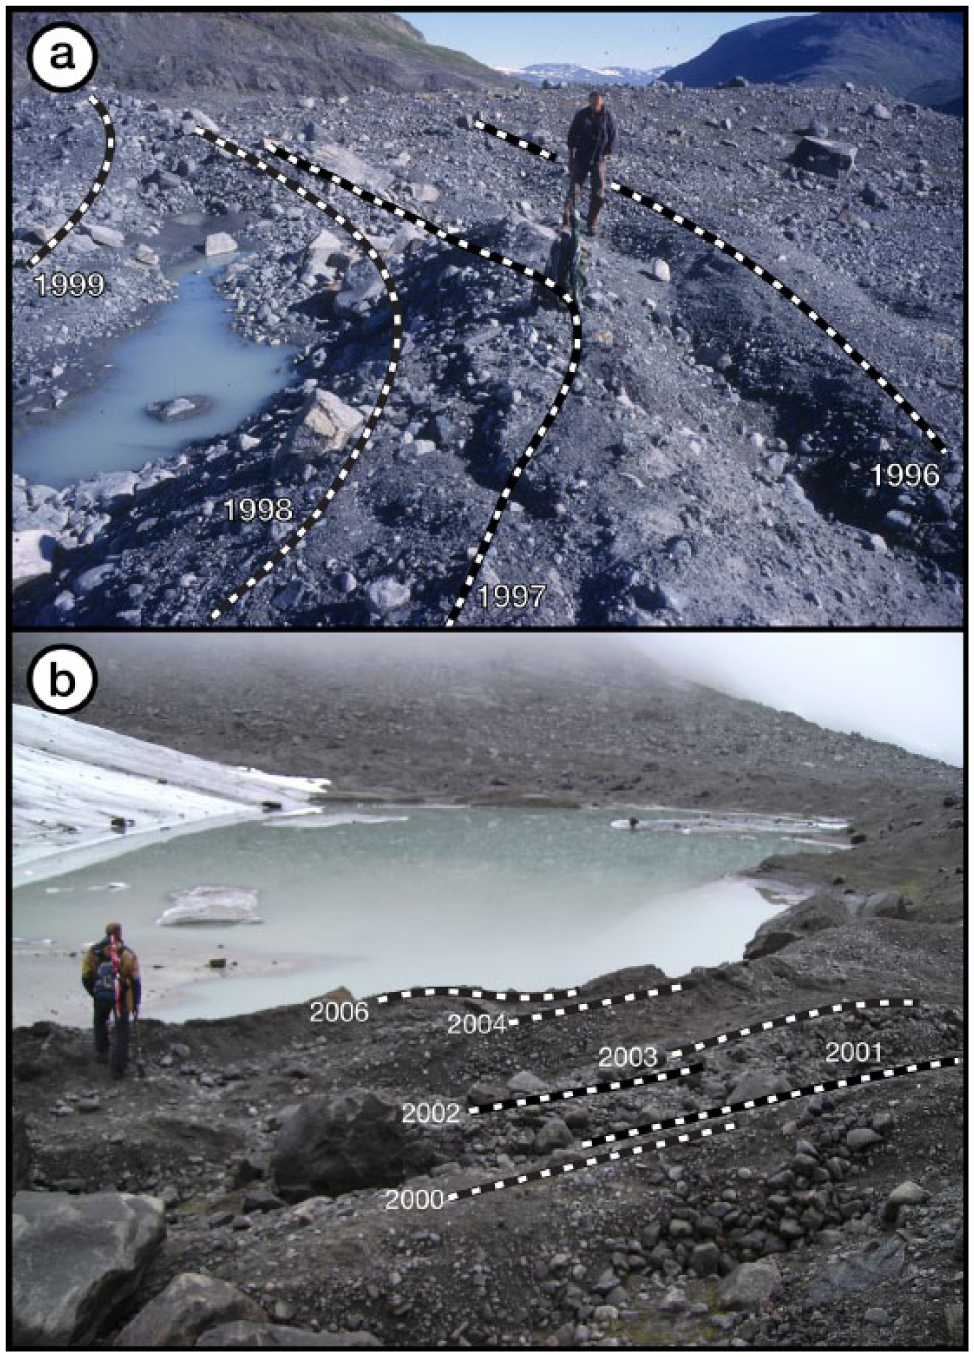
Photographs of the singular and composite annual moraine ridges: (a) composite moraine at Storbreen showing stacked annual sediment increments deposited between 1996 and 1999 – the glacier lies to the left; (b) annual moraine ridges deposited between 2000 and 2006 at Styggedalsbreen – note the extensive proglacial lake.
At Styggedalsbreen, the cumulative retreat since 1975 has a similar magnitude to that of Storbreen, but frontal variations have been more pronounced and net advances have tended to be larger and more frequent (Figure 2). These measurements were made close to the axial line of the glacier in the centre of the proglacial area, where a major, 5- to 10-m-high moraine-ridge complex began forming in the 1970s and major increments were added in the 1980s and early 1990s (Matthews et al., 1995). In the eastern part of the proglacial area, 0.5–1.5 m high, mostly discrete annual moraines continued to form during the late 1990s and 2000s (Figure 5).
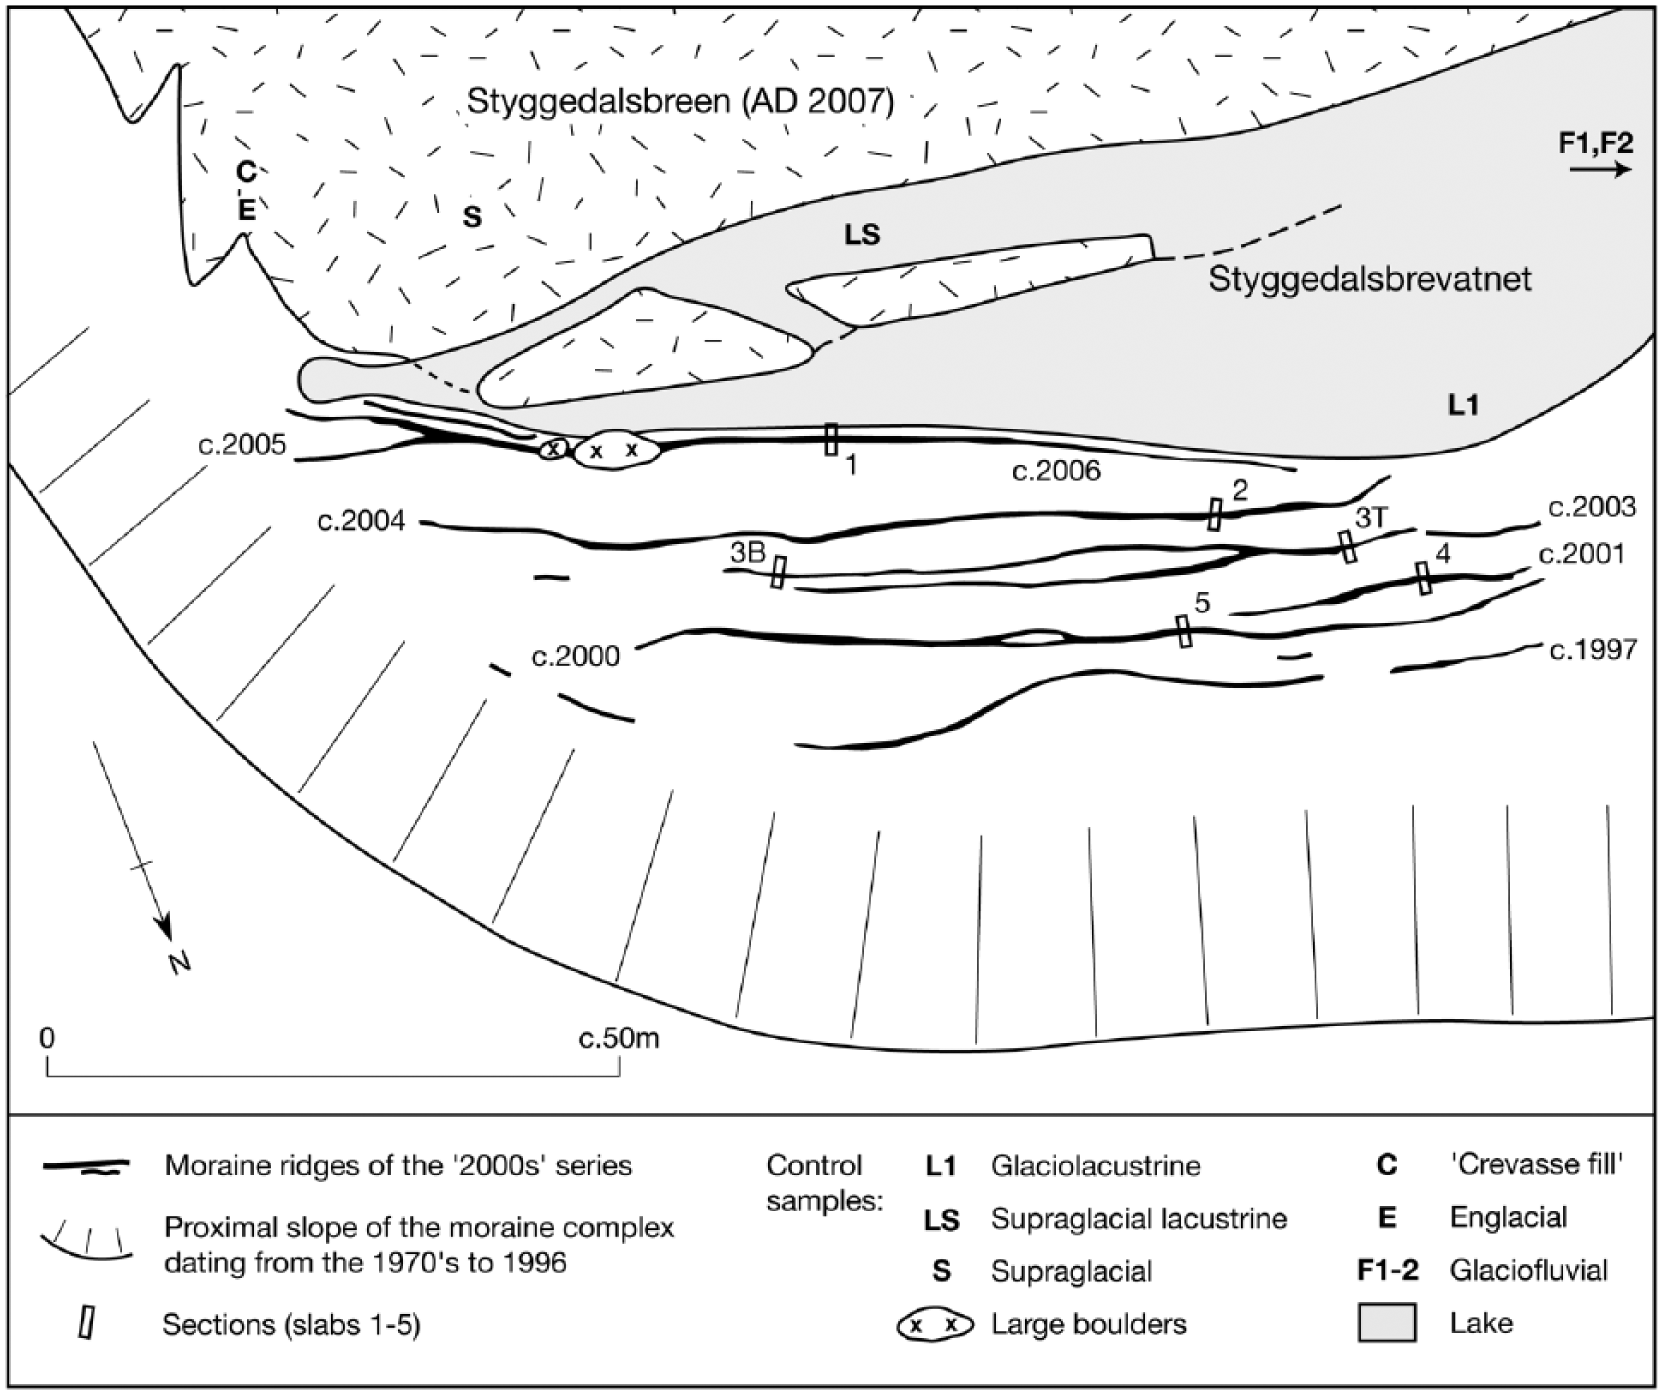
Sketch map of the moraine ridges and sampling sites in the proglacial area of Styggedalsbreen.
Counting back from the short 2007 ridge at the extreme eastern end of the semi-permanent proglacial lake (Styggedalsbrevatnet), the 10 relatively fresh ridges indicate that the oldest of these annual moraines date from spring 1997. This is consistent with the crest of the eastern end of the main moraine complex dating from 1996, when the glacier-front variations along the axial line saw the culmination of a short-term net glacier advance of 15 m from 1993 to 1996 followed by a retreat of 17 m during the following year (Figure 2). The six separate annual moraine ridges of the ‘2000s series’, on which this study is focused (Figures 4b and 5), therefore correspond with a period when glacier frontal variations saw a net advance of 11 m (1997–2001) followed by a net retreat of 66 m (2002–2007). In the centre of the proglacial area, the former advance appears to have led to the final increment of growth to the main moraine complex, while the latter retreat led to considerable enlargement of Styggedalsbrevatnet.
Research design and methods
The technique of sediment fingerprinting is based on the assumption that one or more of the characteristics of the moraine sediment will reflect its origins and can be used as a tracer to track the sediment back to its source(s). This information may then be used to make inferences about processes in relation to mechanisms and processes of moraine-ridge formation, glacier dynamics and glacier thermal regime.
Systematic sampling of tops and bottoms of consecutive annual increments (slabs) was carried out at Storbreen (the ‘1990s’ composite moraine; see Figures 3 and 4a – labelling: S1 (youngest)–S6 (oldest), t(op), b(ottom)) and Styggedalsbreen (the ‘2000s’ annual moraine series; Figures 4b and 5– labelling: S1 (youngest)–S5 (oldest), t(op), b(ottom)). Sampling difficulties were encountered on the top of S4 at Storbreen because of partial collapse leading to loss of some information (see below). For all other positions, the following were recorded: (1) clast roundness and clast shape, (2) clast long-axis fabrics, (3) matrix texture and (4) micromorphological characteristics of the sediment (selected samples at Storbreen only).
To provide the means for the sediment fingerprinting of the moraine slab data, reference samples were taken to represent known sediment sources and processes. At both locations, glaciofluvial (F) and glaciolacustrine (L) sediments were sampled (two or three from each environment at each location; see Figures 3–5), while supraglacial (LS), englacial (E) and crevasse-fill (C) sediments were sampled at Styggedalsbreen (Figure 5). At Storbreen, samples (including two for micromorphology) were taken at three depths (PT: 0–0.25 m, PM: 0.25–0.5 m and PB: 0.5–0.75 m) from a pit excavated in the till plain between the 1990s and mid-1980s moraines (indicated as p (‘protoslab’) in Figure 3).
Clast roundness and clast shape (c/a and b/a axial ratios) were recorded to derive information about modification of clasts during transport and deposition (see Ballantyne and Benn, 1994; Evans and Benn, 2004; Powers, 1953). These data were interrogated through covariance analysis of C40 (the percentage of clasts with c/a ⩽ 0.4) and RA (the percentage of angular and very angular clasts). Given the overall low number of rounded clasts across all samples, we opted for RA rather than the alternative RWR (percentage of rounded and well-rounded clasts), which would have had a lower discriminatory power (cf. Lukas et al., 2013).
Fabric data (orientation of clast a-axes) provide information on preferred ‘flow’ or shear in deforming media and, when combined with other sedimentological criteria, on the mode of deposition (see Carr and Rose, 2003; Evans and Benn, 2004; Evans et al., 2007; Krüger and Kjær, 1999). In this study, the directional data were plotted on lower hemisphere equal area stereo-nets and analysed statistically using the tried and tested eigenvalue PCA method. Strength of fabrics and degree of clustering (or deviation from isotropy) were further investigated by plotting eigenvalue ratios λ3/λ1 and (1 − λ2/λ1) in fabric shape diagrams (see also Evans and Benn, 2004; Evans et al., 2007; Mark, 1974).
Although matrix texture analysis as a stand-alone technique is rarely reliable in investigations of processes of transport, erosion or deposition (Evans and Benn, 2004), it can provide important information on whether, as in this study, (1) the geology of source materials in the small catchments is fairly homogeneous, (2) the input of exogenous sediment is minor and (3) possible inherited characteristics can be identified in the grain-size distributions. Here, laser diffraction was used to analyse particle size distributions in the 0.375–2000 µm range.
Micromorphological analysis was carried out on two moraine samples (one from a slab top and one from a slab bottom) and two comparable samples from the pit in the till plain at Storbreen (all undisturbed). Using a Leica™ transmitted-light petrographic microscope (magnifications 4×–40×), texture, structure and other micro-scale features of undisturbed, impregnated sediment samples were analysed in both plane- and cross-polarized light. Unlike other methods, micromorphology allows for a detailed study of interrelations between matrix and coarse grains and clasts. In previous studies of glaciogenic sediments, this has proven to be invaluable in genetic interpretations (for overviews, see Evans and Benn, 2004; Hiemstra, 2013).
Results
Moraine configuration and sedimentology
Figures 3–5 show the composite moraine ridges (up to 4–5 m high) in both locations. The inclined slabs or increments are clearly visible as parts of ‘stacked’ sequences. Although crests may be en echelon and/or undulating, and although parts of slabs have (partially) collapsed (e.g. S5 at Storbreen), the thicknesses of individual slabs appear fairly uniform, irrespective of where measurements were taken; slab thicknesses range from 0.45 to 1.00 m (see Table 1). Azimuths and dips of the ice-proximal, ‘upper’ surfaces of the slabs, which represent ‘average’ orientations, and facies characteristics, using facies codes according to Evans and Benn (2004), are also given in Table 1.
Summary of geometry and sediment facies recognized in the slabs, differentiating between t(ops) and b(ottoms).
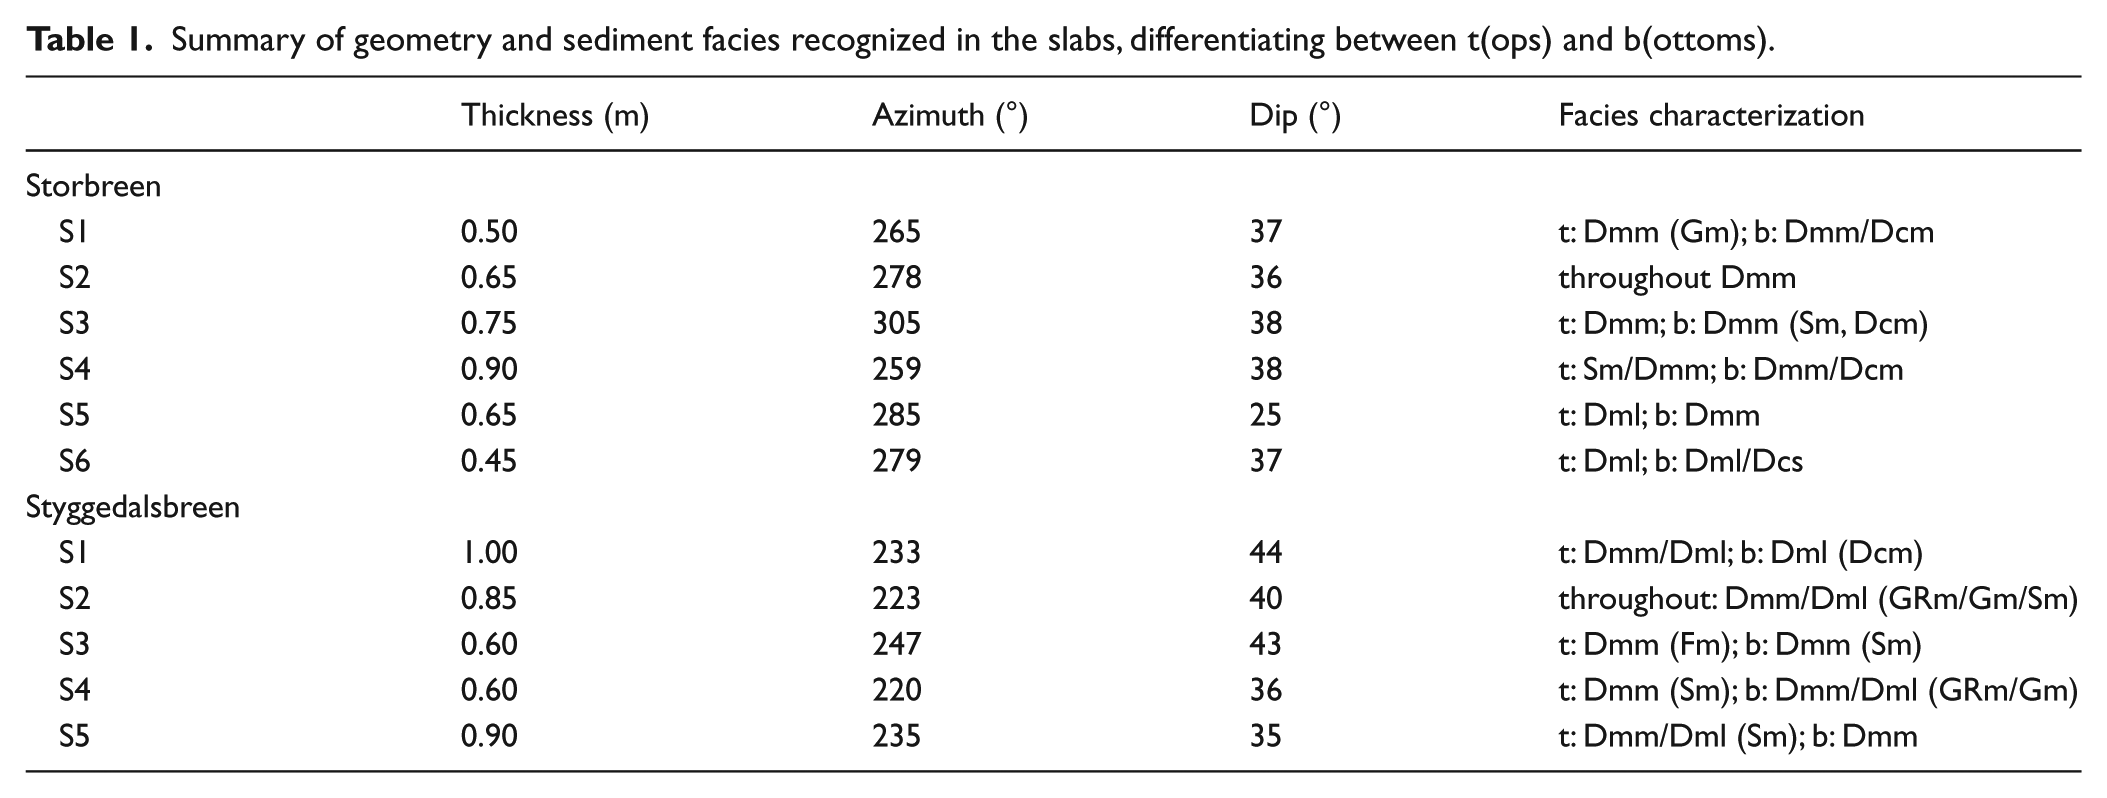
The moraine slabs at both locations consist of medium grey to brownish grey fine-grained diamicton, which is mostly massive and matrix-supported (Dmm). In some places, Dmm ‘grades into’ a (subtly) stratified or laminated diamicton (Dml). The stratified character is mostly because of the occurrence of elongated pods or lenses of silt (Fm), sand (Sm) or granules/gravel (GRm/Gm). Where such gravelly inclusions occur, the overall nature of the diamicton is best characterized as Dcm or Dcs. There are obvious differences between and within slabs in the firmness or compactness of the sediment. These appear to be most closely related to the texture of the matrix (see below).
Clast roundness and shape
The covariance (RA-C40) diagrams in Figure 6a summarize the clast roundness and shape characteristics of annual increments in the moraines. RA values of 3–40% and 0–27% and C40 values of 7–23% and 13–37% are characteristic at Storbreen and Styggedalsbreen, respectively. Although moraine clasts from Storbreen tend to be blockier than those from Styggedalsbreen and also show a greater range in RA, moraine samples from both locations have relatively small proportions that are angular or slabby or elongated. Thus, they differ markedly from the supraglacial control samples (Figure 6a) and other gneissic supraglacial control samples (see Figure 5c in Lukas et al., 2013), which typically show high to very high RA and C40 values.
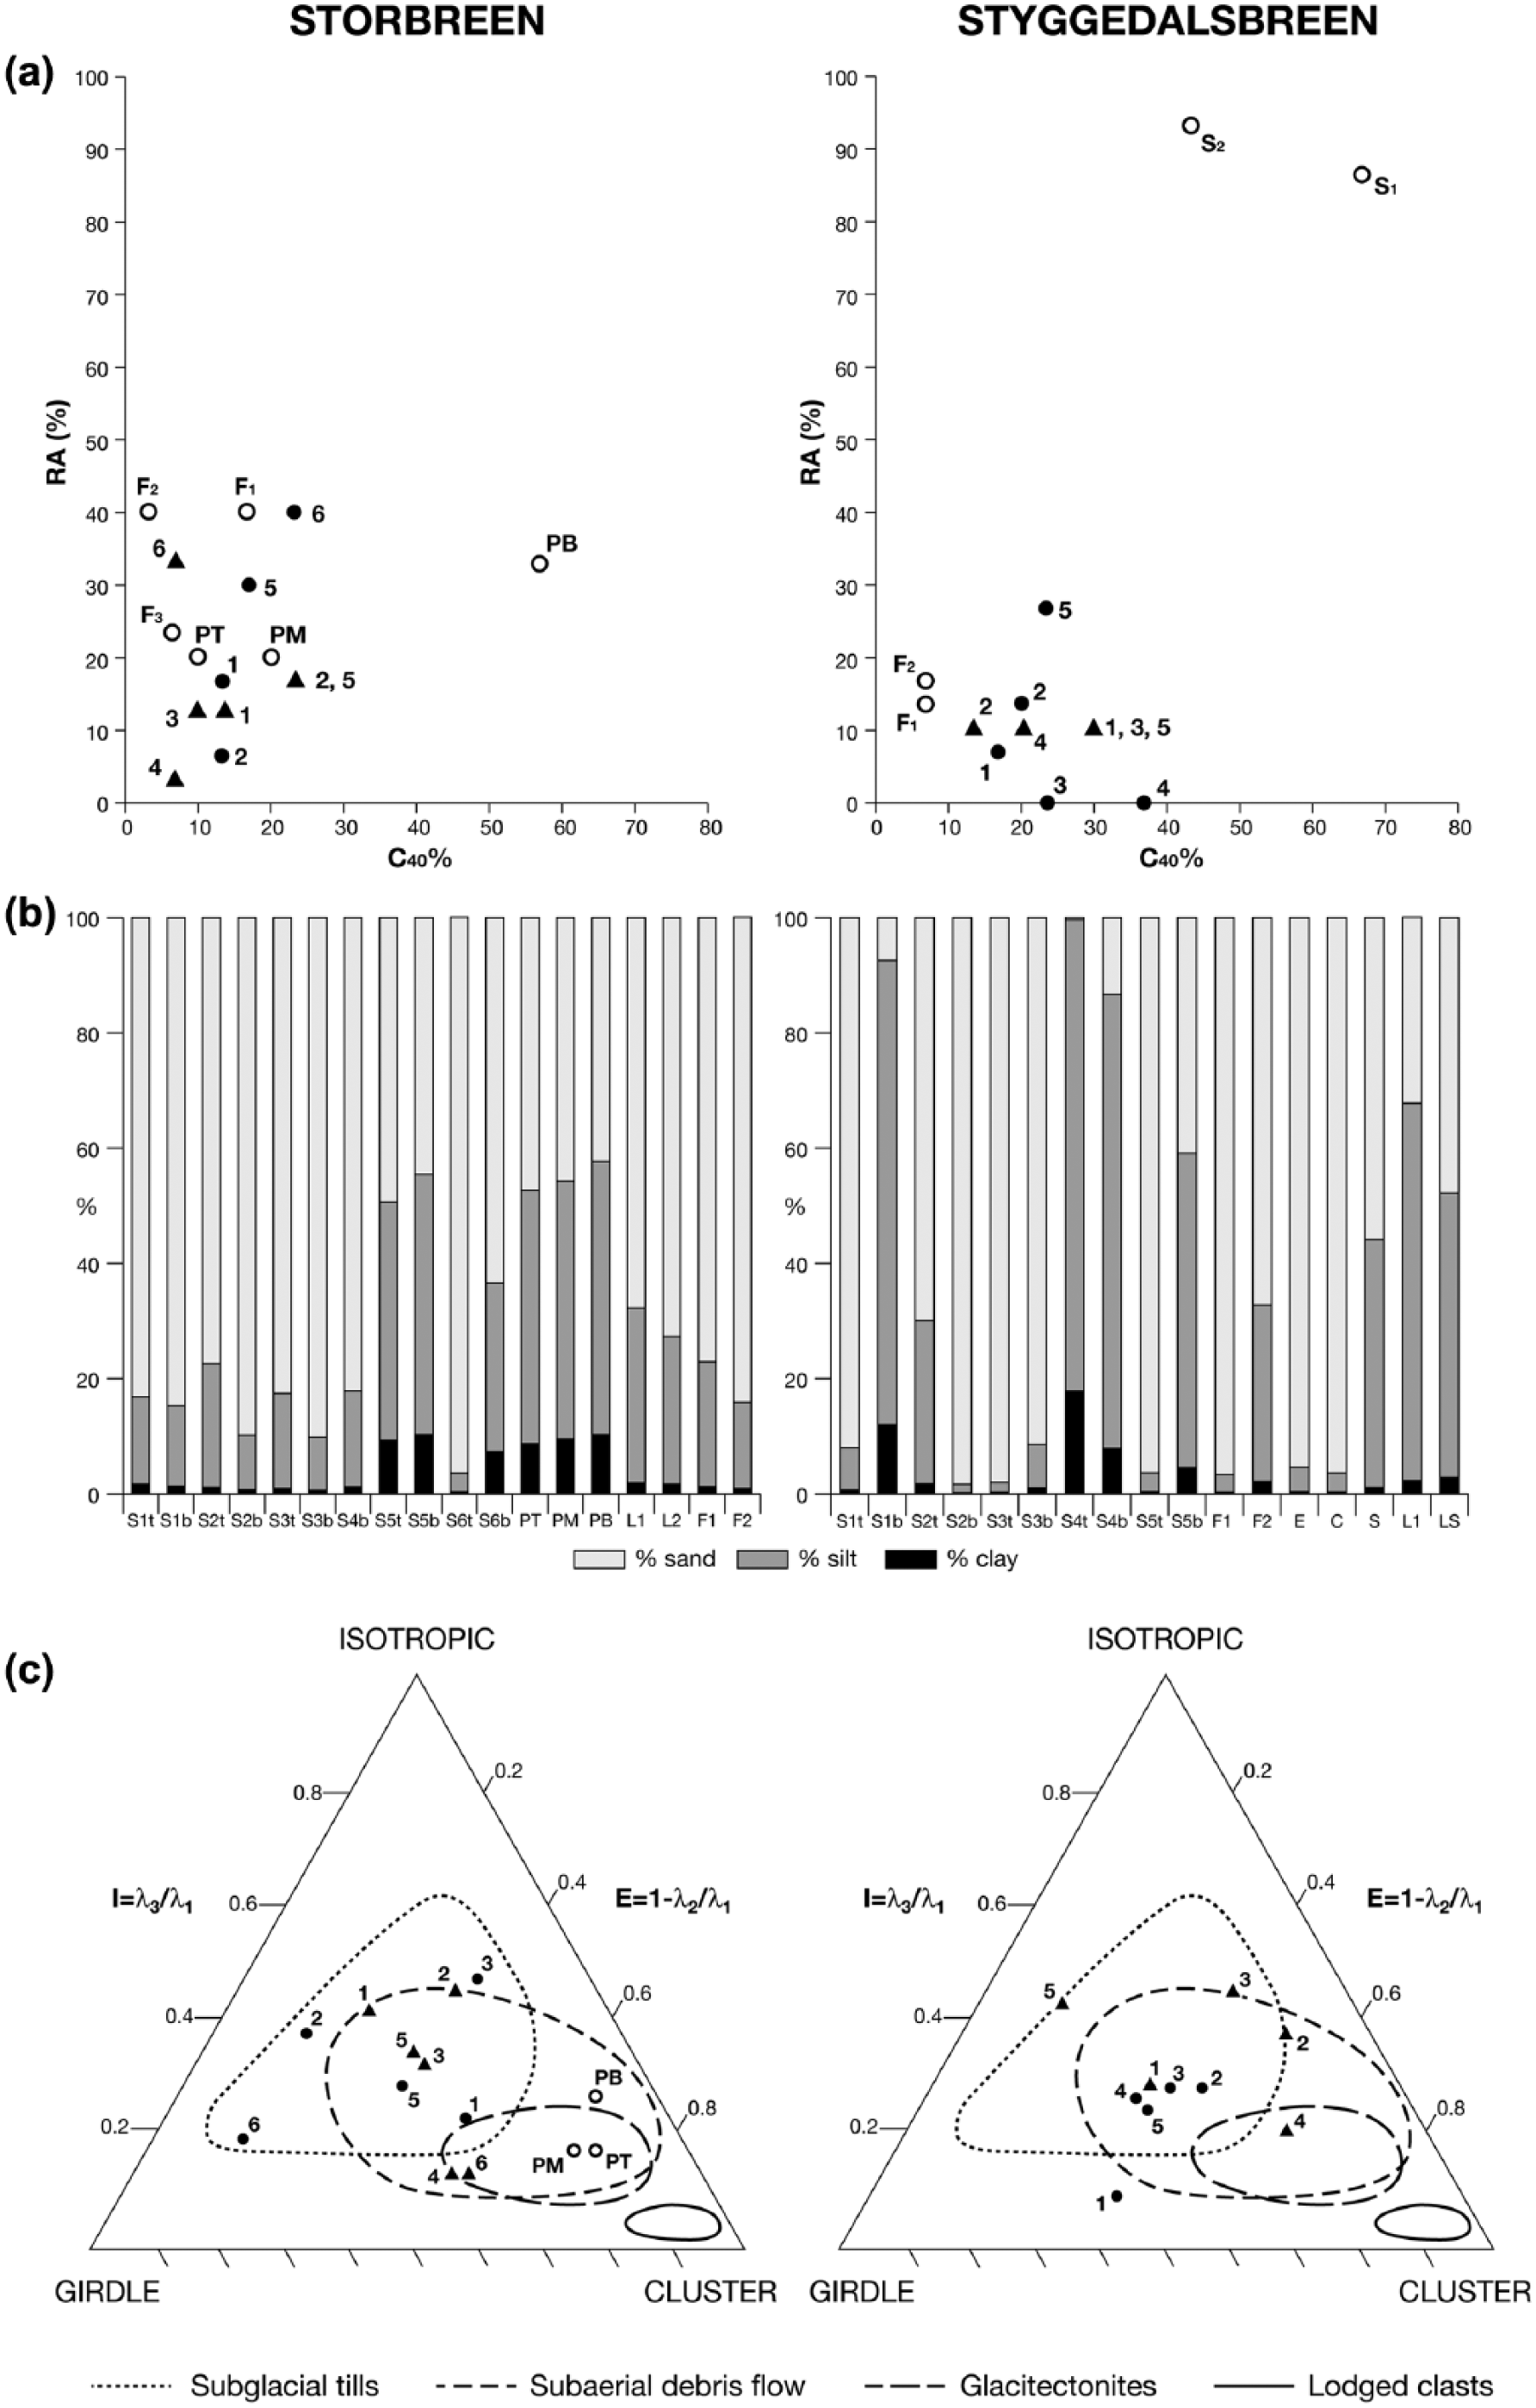
Sedimentary data from sediment slabs associated with singular and composite annual moraines at Storbreen and Styggedalsbreen: (a) clast roundness and shape, (b) matrix texture and (c) clast fabric shape.
Two of the three samples from the till plain at Storbreen, which can be interpreted as a subglacial reference, show characteristics that match those from both Storbreen and Styggedalsbreen moraine samples (see Figure 6a). Only the deepest sample from the pit (PB: 50–75 cm) presents a slight ‘outlier’ with a comparatively high C40 index. Whereas a similar range of C40 values has been recorded for subglacial control samples in other gneissic areas (see Figure 5c in Lukas et al., 2013), previous RA values for subglacial control samples at Storbreen have tended to be very low or near-zero (see Figure 2m in Lukas et al., 2013).
Covariance characteristics of the moraine samples overlap those of fluvial control samples at both locations (Figure 6a). While such overlaps are not uncommon (see Lukas et al., 2013), the similarities recorded at Storbreen are striking.
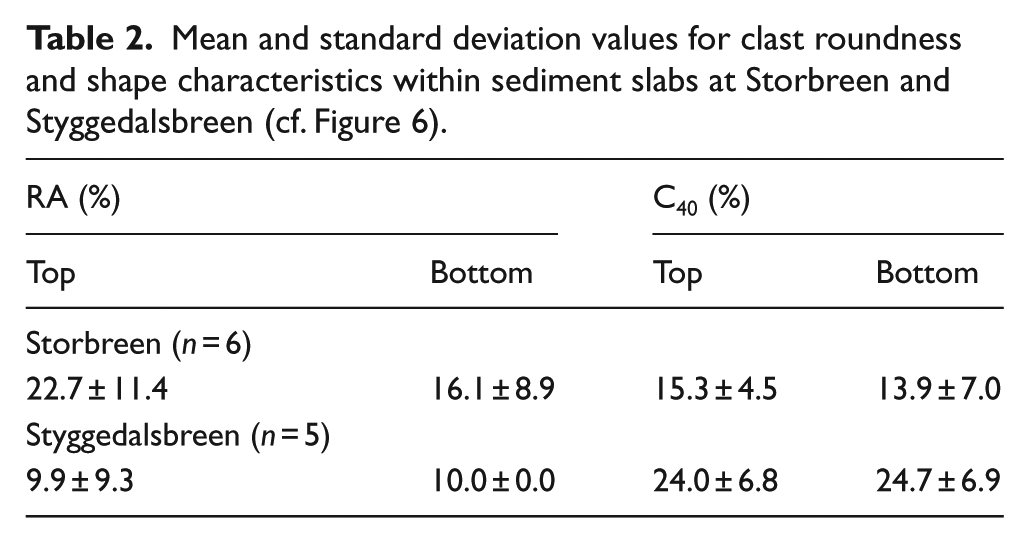
No systematic patterns or trends in covariance characteristics are apparent in relation to either moraine age or position within the sediment slab (see Figure 6a and Table 2). The only notable feature in this respect is that the oldest increments at Storbreen (S5 and S6) seem to contain clasts that are relatively slabby and angular. Neither RA nor C40 individually shows significant or systematic differences between the top and bottom of increments in either location (Table 2).
Mean and standard deviation values for clast roundness and shape characteristics within sediment slabs at Storbreen and Styggedalsbreen (cf. Figure 6).
Matrix texture
Figure 6b shows the sand, silt and clay content in the slab samples at both locations. Typically, the moraine at Styggedalsbreen is predominantly sandy, with <10% silt and <5% clay. At Storbreen, typical samples have higher silt (9–21%) but lower clay content (<2%). In detail, the textural differences within and between sediment slabs at Storbreen reveal that some samples have an excess of fines (clay–silt). The top and bottom of slab 5 (S5t, S5b) and the bottom of slab 6 (S6b), for example, are significantly more silty (45–63%) and clay-rich (7–10%) than other samples. Interestingly, S6t shows a deficiency of silt (3%) and clay (0.3%).
At Styggedalsbreen, four samples show a significant excess of fines (S1b, S4t, S4b, S5b), reflecting high silt percentages or, in the case of slab S4, a considerable amount of clay (up to 18%). Relative to these typical proportions, S2t differs in that it is similar to typical moraine samples from Storbreen. The excess of fines in samples from Styggedalsbreen seems unrelated to either age or position within the slab. At Storbreen, the two oldest slabs show an excess of fines relative to all of the younger samples. Interestingly, the same two slabs also show uncharacteristic clast shapes (see above), which may be significant. Generally, there are no systematic textural changes between tops and bottoms of slabs at Storbreen. Only within slab S6 is there a deficit of fines in the top and an excess in the bottom.
None of the control samples at Storbreen is predominantly sandy (Figure 6b); the ‘subglacial’ control samples (PT, PM, PB) all have a considerable amount of silt (44–47%) and clay (9–10%), while the lacustrine samples also show a significant proportion of silt (L1, L2: 26–30% silt, c. 2% clay). At Styggedalsbreen, lacustrine (L1, L2) and supraglacial samples have a high silt percentage (43–66% silt; 1–3% clay), while englacial samples (E1, E2) and one of the fluvial samples (F1) are overwhelmingly sandy (95–97% sand, 3–4% silt, 0.2–0.3% clay).
Clast fabric
Results of clast fabric analyses are summarized in Figure 6c and Table 3. The first eigenvector at all depths in the till plain at Storbreen (samples PT, PM and PB) indicates a consistently strong clast a-axis orientation to SW (λ1 = 0.62–0.68; azimuth 222–232°, dip 24–26°). This fabric strength is common in subglacial (traction) tills (Evans et al., 2006), where lodgement processes, for example, have played an important role. For comparison, a sample of 30 lodged boulders on the till plain of Storbreen showed a λ1 = 0.87 (cf. Carr and Rose, 2003; Evans and Hiemstra, 2005; Evans et al., 2007), while the measured orientation of a population of >20 associated flutings (formed in the 1960s) confirms the recent past local ice flow direction as SW.
Clast fabric analysis: principal eigenvalues λn and first eigenvectors V1 for sediment samples at Storbreen and Styggedalsbreen.
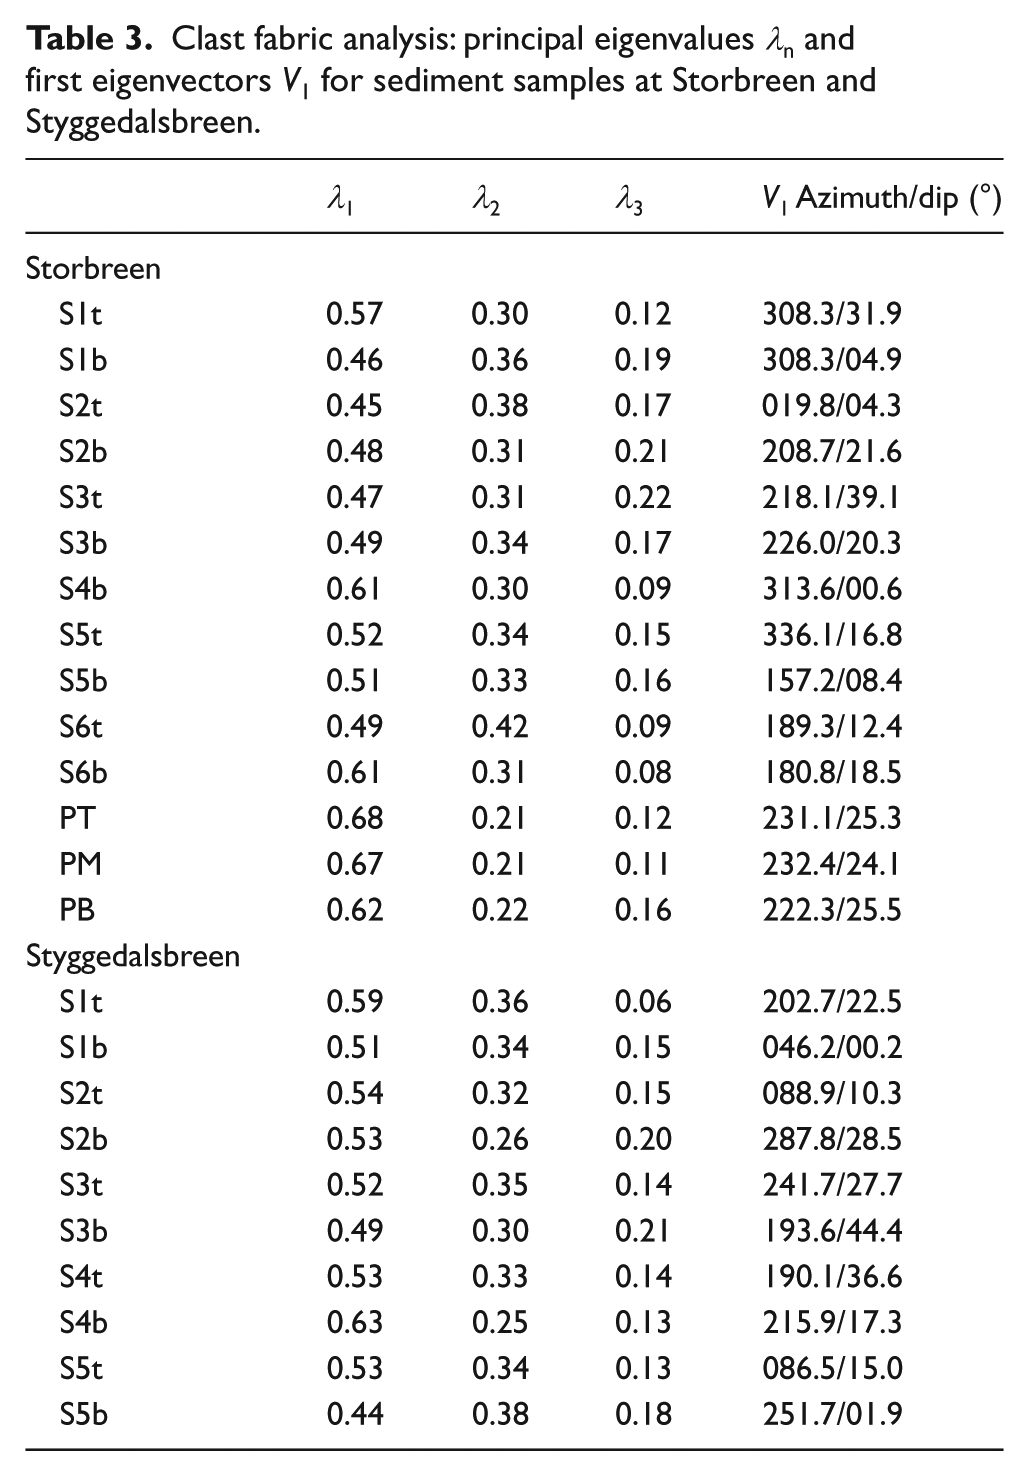
Clast fabrics in the sediment slabs at Storbreen are generally weak to moderate (λ1 = 0.45–0.57) with only samples S4b and S6b exhibiting eigenvalues that are similar (λ1 = 0.61) to those of the ‘subglacial’ control values. It may be of significance that these strongest fabrics occur in the bottoms of the sediment slabs rather than the tops and in older, rather than the youngest slabs. Mean orientations of the first eigenvectors (or secondary modes) are fairly constant within individual slabs and controlled to a larger extent by the configuration or orientation of the slabs (compare Tables 1 and 3) than by inferred glacier flow direction. Nevertheless, there tends to be a preference throughout the sequence for S or SW direction.
The clast fabric shape (Figure 6c) of the three ‘subglacial’ control samples from the till plain at Storbreen, as defined by isotropy (I = λ3/λ1) and elongation (E = 1 − λ2/λ1), shows a remarkable consistency as all plot towards the lower right corner of the ternary diagram, which is characteristic of clustered fabric distributions (cf. Evans et al., 2007). The moraine slabs, in contrast, plot away from this corner, indicating deviation, to varying degrees, from a clustered fabric distribution. The distribution of these fabrics is better described as bimodal or semi-girdle (S4b, S5t, S5b, S6t and S6b), or even isotropic (the younger slabs: S1–S3).
At Styggedalsbreen, fabric strengths in the moraine slabs are generally similar to those at Storbreen with λ1 eigenvalues ranging from 0.44 to 0.54; exceptions are S4b (λ1 = 0.63) and S1t (λ1 = 0.59). Preferred modes are towards S or SW, but again the configuration of the (basal) slab planes seems to exert a control as well. Fabric shapes (Figure 6c) show fewer anomalies than at Storbreen; only aforementioned S1t and S5b are ‘outliers’. Most samples from the top of the slabs appear intermediate between semi-girdle and (bi-)modal distributions. S2b and S3b are most isotropic and show high-angle dips. S5b is an almost perfect girdle, while S4b is the best clustered distribution with a mean orientation towards SW.
Micromorphology
The thin-section sample from S5b at Storbreen shows a silty–sandy diamicton with dispersed gneiss clasts up to 1.5 cm in diameter. Mean grain size of the dense skeleton (defined as grains >30 µm; Hiemstra, 2013) is in the medium sand range. Many grains, even in the fine sand fraction, are subrounded, which is consistent with abrasion during subglacial transport. Quartz and monoclinic feldspar are the dominant minerals, but there is a significant presence of hornblende grains (c. 5%) and subordinate biotite grains. Hornblende and biotite grains tend to be angular to subangular.
Plasma (defined as material <30 µm; Hiemstra, 2013) in S5b is characterized by a substantial amount of clay and fine silt. Areas where plasma is visually densest take the form of either (1) thin (50–150 µm) ‘silt’ (incl. clay) cappings on the upper surfaces of coarse sand grains or pebbles (Figure 7a) or (2) cutans or ‘clay’ skins within pores. The ‘silt’ cappings may show lamination or inverse grading. Upper contacts to surrounding matrix may be sharp or gradational. Plasmic fabrics (orientations of clay minerals showing as domains of birefringence; Hiemstra, 2013) are restricted to zones of dense plasma. While generally weak and insepic (scattered small areas of faintly striated birefringence), there is a weak to moderately developed masepic signal (birefringence striated and unidirectional) in some of the fine-grained cappings.
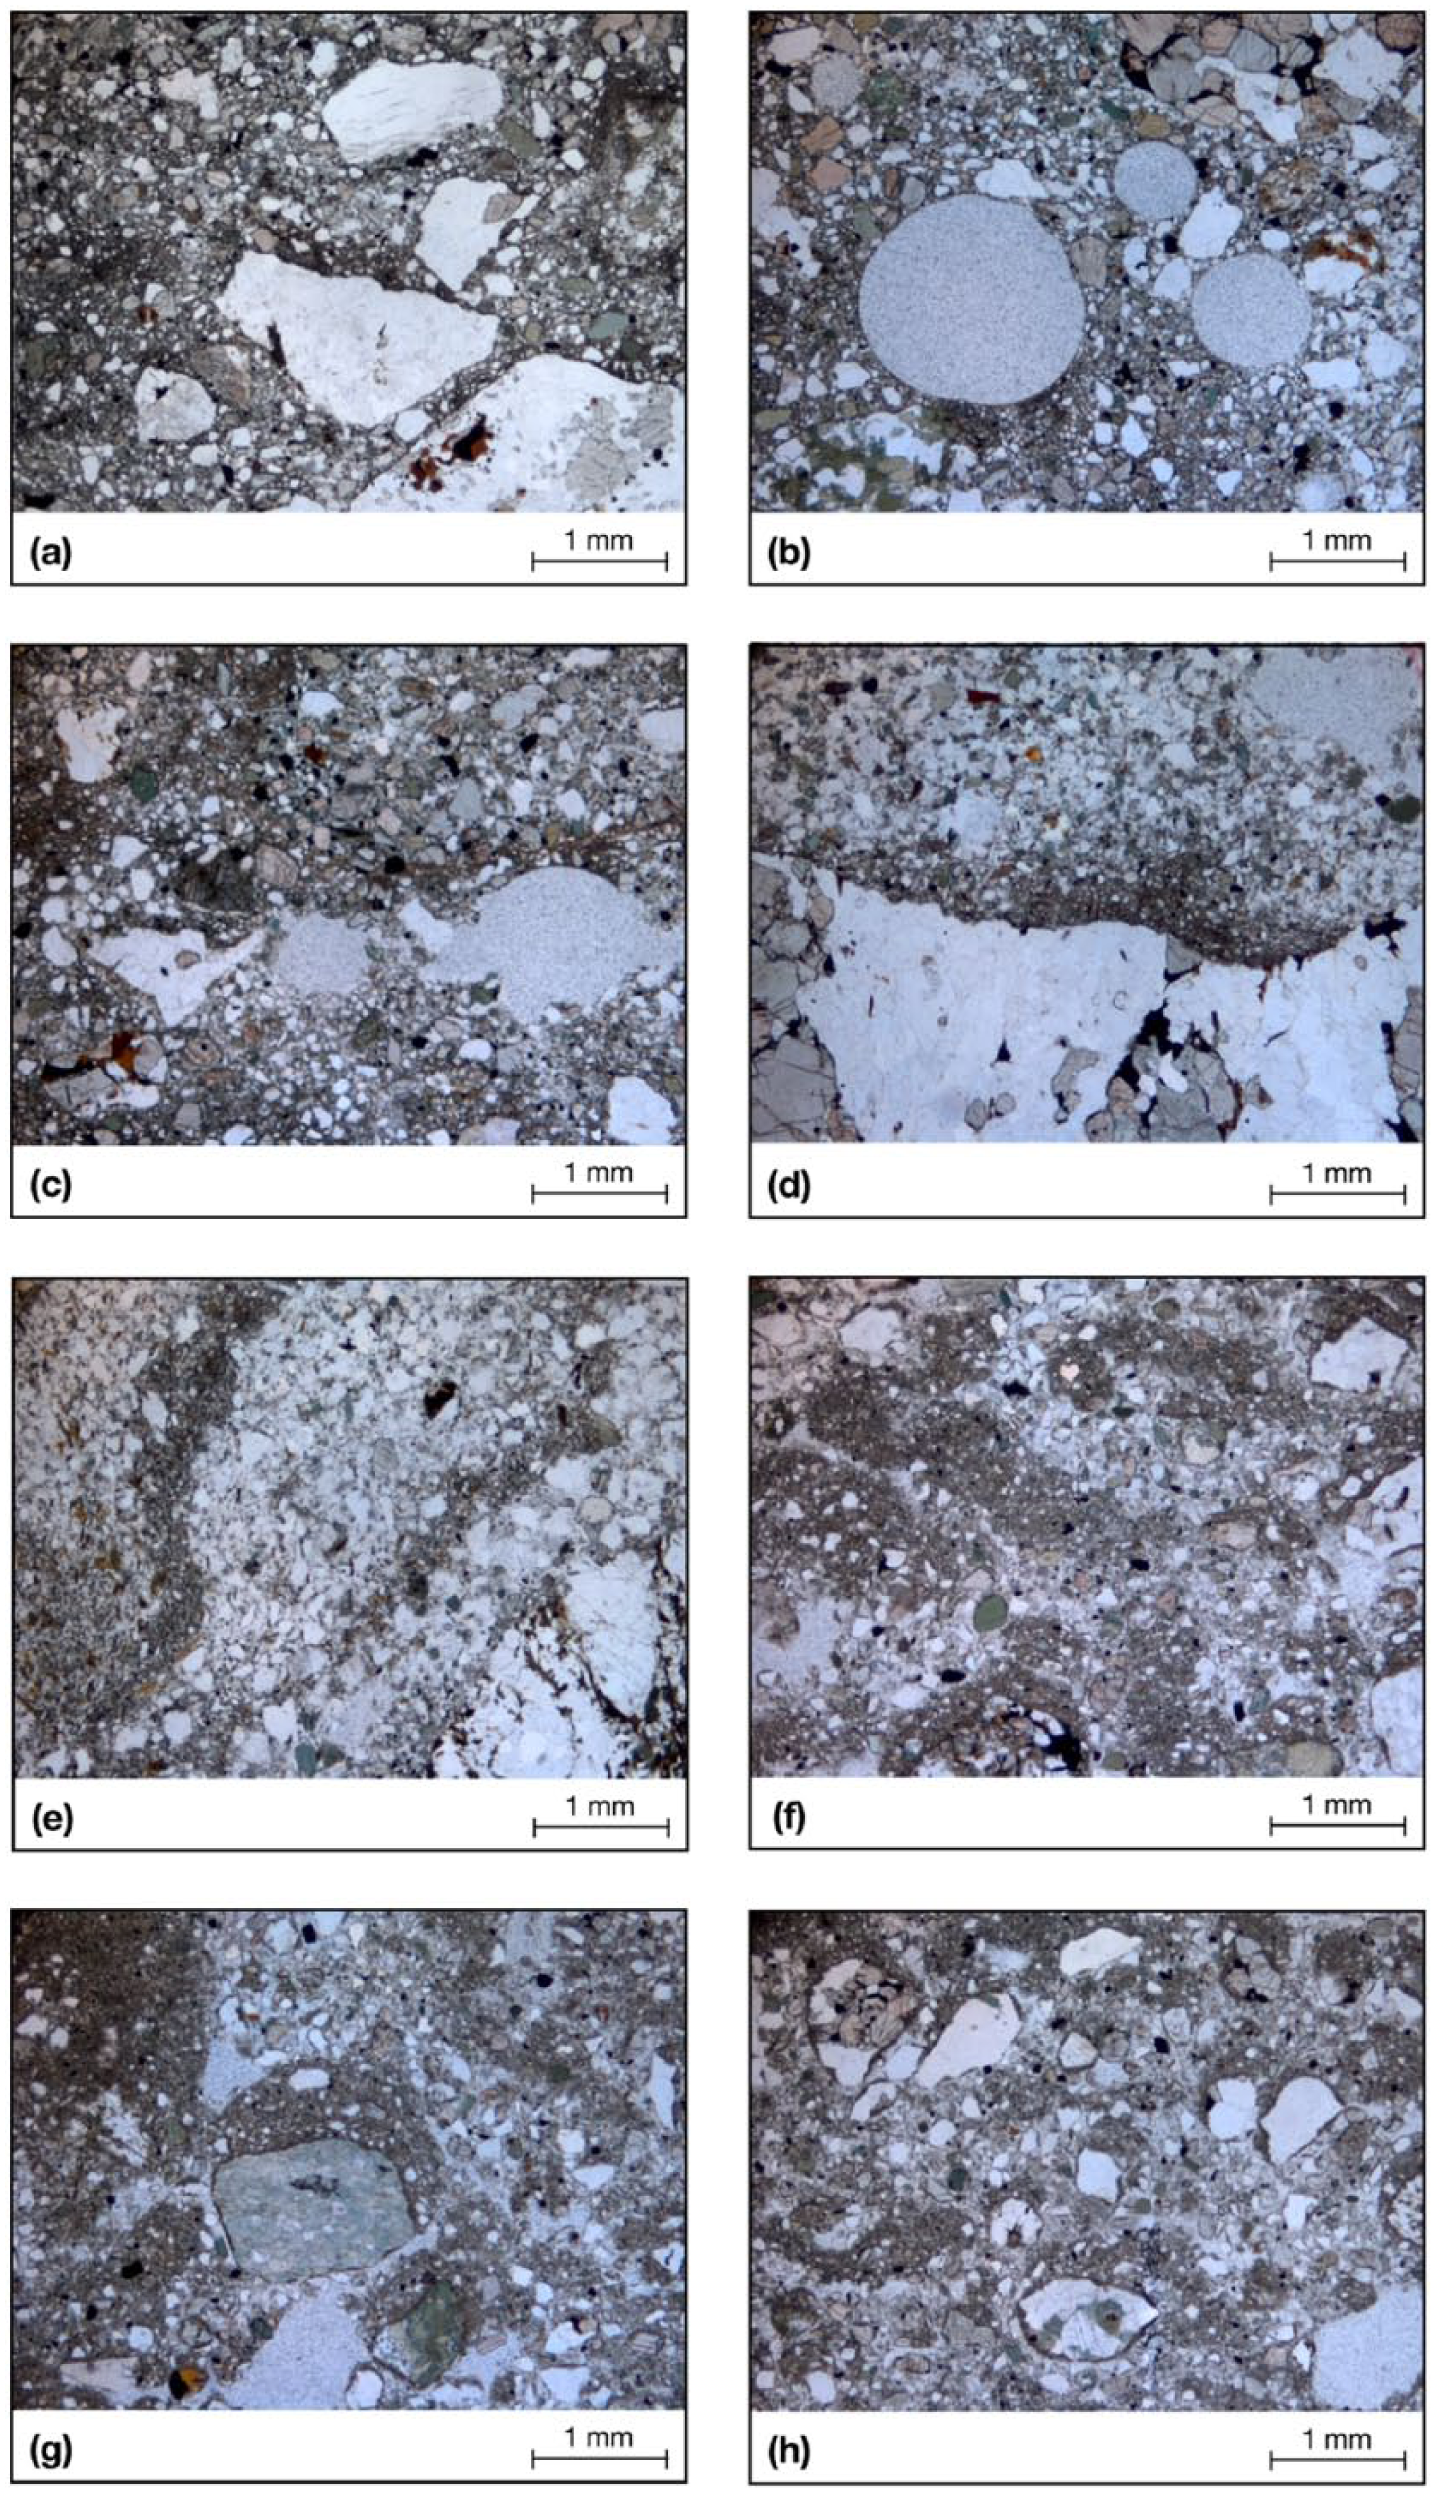
Micromorphological characteristics of sediments associated with singular and composite annual moraines at Storbreen: (a) silt concentrations (cappings) on upper surfaces of sand grains, granules and small pebbles (bottom slab 5); (b) circular pores or vesicles (bottom slab 5); (c) partly coalesced and collapsed vesicles – note associated concentrations of fine and coarser textures (bottom slab 5); (d) silt capping on gneissic pebble – note sorting within the silt concentration (top slab 2); (e) evidence of translocation of fine-textured material as a result of water percolation (top slab 2); (f) banded or ‘lenticular’ structure resulting from texture differentiation (top subglacial reference sample); (g) banded or ‘lenticular’ structure resulting from texture differentiation (top subglacial reference sample); (h) silt cappings on all sides of coarse grains or pebbles, suggesting rotation (top subglacial reference sample). All photomicrographs taken in plane polarized light.
S5b contains, predominantly in its upper half, several near-circular pores or vesicles 400–1500 µm in diameter (Figure 7b). Some of these appear to have coalesced and/or partially collapsed to form planar sub-horizontally aligned and elongated voids. In some places, the conspicuous voids appear to be associated with crinkly, sub-vertical tracks within the plasma, either showing concentrations of fines or, conversely, areas devoid of fines (Figure 7c). No lineaments or turbate structures (see Hiemstra, 2013; Hiemstra and Rijsdijk, 2003) were observed in S5b, and there is no clear visual evidence of preferred long-axis fabrics.
Thin-section sample S2t (from Storbreen) is also a silty–sandy diamicton but has, compared with S5b, a distinctly lower clay and fine silt content, and thus a visually coarser mean grain size. Clast lithology is similar to that of S5b (gneissic), although more clasts appear rich in hornblende, biotite and olivine. Throughout S2t, there is an abundance of hornblende grains. As in S5b, plasma is locally concentrated in thin silt cappings with characteristics as described above (Figure 7d). Within the fine-grained matrix, some sub-vertical and locally branching features (either devoid of fines or with an excess of fines) may indicate water movement and/or translocation processes (Figure 7e). Vesicles (of similar size to S5b) are dispersed throughout the sample and have also coalesced/collapsed locally to form sub-horizontal and sub-vertical voids. In some places, pore space exists below coarse skeleton.
Reference thin-section samples from the till plain at Storbreen PT and PM show typical fine-grained diamictons (c. 30% clay/fine silt, c. 40% fine/medium sand; Figure 6b) containing subrounded gneissic clasts up to medium pebble size. Coarse grains within the skeleton are relatively angular. Both samples, but particularly PT, exhibit plasma with a banded nature that is brought about by textural differentiation (mostly in the fine–medium silt range) (Figure 7f). Circular vesicles (250–2000 µm) are abundant in PM, with relatively few that have collapsed or coalesced. In PT, on the other hand, most voids are elongated and locally form sub-horizontal partings leading to a platy or ‘lenticular’ structure (Figure 7g). This visually enhances the banded nature of the plasma. Both PT and PM show well-developed silt cappings, similar to those described above. Interestingly, there are some examples in PT of silt cappings having formed on both sides of coarse grains or clasts, suggesting that they may have rotated (Figure 7h). This would be supported by the observation that many of the long axes of coarse grains and clasts are sub-horizontally aligned; similarly, this observation is also consistent with thaw consolidation processes (Harris, 1990, 1998, 2007). Neither of the till plain samples shows typical ‘subglacial’ microstructures such as turbates or lineaments (see Hiemstra, 2013). Despite a fairly high clay percentage (c. 10%; Figure 6b), plasmic fabrics are weakly developed at best.
Discussion
Discussion is focused on interpreting variations in the sedimentary characteristics, both within and between the annual moraine slabs, and assessing their indicative or diagnostic value in relation to mechanisms and processes of moraine-ridge formation, glacier dynamics and glacier thermal regime.
Subglacial clasts predominate
The combination of low RA and low C40 values is typical of clasts that have undergone modification by abrasion and crushing at the base of a glacier. Ballantyne and Benn (1994) showed, with specific reference to Storbreen, that subglacial clasts, which have undergone active transport, typically occupy the bottom left corner of the covariance diagram (Figure 6a; cf. Figure 4.5 of Evans and Benn, 2004). Conversely, clasts from supraglacial environments, which are generally relatively unmodified, occupy parts towards the top right in the covariance diagram. This simple inference is substantiated by our own control samples (‘subglacial’ till plain from Storbreen, supraglacial from Styggedalsbreen) and the data collected by others at Storbreen (e.g. Ballantyne and Benn, 1994; Matthews, 1987; Shakesby, 1989).
While slight compositional differences of the local gneiss may explain the slight differences between the two investigated catchments, it can be inferred that clast roundness and clast shape indicate a predominant subglacial signature in the sediments of the annual and composite moraine ridges at both Storbreen and Styggedalsbreen. Whereas the Styggedalsbreen moraine samples generally show the best resemblance to characteristics found earlier in gneissic subglacial clasts from diverse locations (cf. Figure 5c in Lukas et al., 2013), the Storbreen moraine samples tend to have comparatively high RA values (Figure 6a).
The similarity of clasts in the fluvial control samples to the moraine clasts signifies the ineffectiveness of fluvial modification at these proglacial sites (Figure 6a). This can be attributed to very short transport distances of the fluvial clasts associated with small streams draining short-lived lakes (cf. Lukas et al., 2013). The main meltwater stream at Storbreen does not drain into the proglacial lake while, at Styggedalsbreen, the study site lies at the eastern end of the proglacial lake where it is largely beyond the influence of the main meltwater stream. At both sites, therefore, the potential for fluvial modification of clasts is minimal.
The heterogeneity in clast roundness and shape exhibited between moraine samples shows no systematic pattern in relation to position within each sediment slab or its age (Figure 6a and Table 2). Absence of systematic within-slab variations indicates an absence of modifications to clasts during deposition, while absence of variation associated with moraine age indicates ineffective post-depositional modification of clasts. Somewhat more angular and less blocky clasts at Storbreen may, however, relate to slight lithological differences or to slightly less effective fluvial modification of clasts than at the Styggedalsbreen site (cf. Lukas et al., 2013).
Textural variability in matrix is mainly inherited from proglacial sediment sources
In the relatively small catchments of Storbreen and Styggedalsbreen, a predominantly silty sand matrix of glacial tills was expected, in accordance with the idea that mechanical subglacial erosion (abrasion) of the pyroxene granulite gneiss produces particles down to medium silt size but not finer (Boulton, 1978; Haldorsen, 1981). The described ‘typical’ matrix of moraine samples from both locations shows this characteristic, with Styggedalsbreen samples plotting more towards the sandy end and Storbreen samples more towards the silty end of the range (Figure 6b). The difference possibly reflects the greater size of the Storbreen catchment, and thus the higher efficacy of the abrasion process. Our findings are also consistent with previously reported textural analyses of tills from Storbreen and Styggedalsbreen glacier forelands, which typically contain <3% clay (Darmody et al., 2005; Matthews et al., 1995, 1998; Mellor, 1986).
The surplus of silt in the lacustrine control samples at both sites (Figure 6b) suggests that any apparent excess of silt in moraine samples, as well as the subglacial control samples at Storbreen, may – at least partially – have been inherited through incorporation or recycling of proglacial lacustrine sediments. The deficit of silt in the englacial controls and one of the fluvial controls (F1) at Styggedalsbreen suggests the flushing out of fines by meltwater during deposition of these sediments (cf. Fischer and Hubbard, 1999). Any relative ‘deficit’ of silt in moraine samples, such as in S6t at Storbreen, may be explained by removal of fines through water.
Interpretation of matrix variability must also take account of the possibility of post-depositional modification. This could involve processes of deflation and loess-like re-deposition, down-washing of silt (pervection) and frost sorting, as has been demonstrated in previous studies of annual moraines and till surfaces of known age (e.g. Ballantyne and Matthews, 1983; Boulton and Dent, 1974; Frenot et al., 1995; Haugland, 2006; Haugland and Haugland, 2008; Matthews, 1992; Matthews et al., 1998). It could be expected that evidence of post-depositional changes would be more pronounced in relatively old annual moraines than in relatively young ones. This is not the case at Storbreen or Styggedalsbreen, however, where the absence of consistent textural variations between annual moraines of increasing age severely limits the possible importance of post-depositional change. Nevertheless, the observation that some moraine samples at Styggedalsbreen and the subglacial reference samples at Storbreen show significant percentages of clay (Figure 6b) may imply that, in addition to inheritance from lacustrine sediments (either proglacial or partly supraglacial), there has been an additional input of fines, for example, through episodic deposition of aeolian dust (cf. Boulton and Dent, 1974; Delmonte et al., 2013).
The absence of consistent within-slab textural variations rules out the possibility of major changes to these sediments during incremental thickening of each slab as moraine deposition occurred (cf. Evans and Hiemstra, 2005). However, looking at the aforementioned slab S6 at Storbreen, it seems plausible that changes such as translocation of fines were operational immediately after emplacement. This would account for the dearth of fines in the top and the exceptionally high percentage of fines in the bottom of the slab (Figure 6b).
Notwithstanding such post-depositional modifications on a small scale, it seems that most within- and between-slab variations in texture, and also most similarities in textural characteristics between the control samples and the sediments in the adjacent moraine ridges, were established before the moraines were deposited. This textural inheritance from proglacial sediment sources is consistent with both push (bulldozing) and freeze-on mechanisms of moraine-ridge formation, which are discussed further below.
Fabric is indicative of modification during or after moraine-ridge formation
Accepting that the clast fabric signature of the Storbreen control samples (clustered, moderate to high λ1) is typical for the local subglacial tills (cf. Evans et al., 2006, 2007), the difference between these and the slab clast fabric characteristics (weak λ1, (semi-)girdle or isotropic) must be interpreted in terms of processes of deformation or disturbance that occurred during or after moraine deposition.
A previous study (Evans and Hiemstra, 2005) found a trend in fabric strength within moraine slabs, whereby λ1 values were highest at the bottoms and lowest towards the tops. Also, it was found that isotropy increased and elongation decreased moving up in the slabs, that is, that the fabrics in the bottoms of the slabs tended to be more clustered. Based on these findings, it was suggested that directional processes (e.g. shearing, lodgement) may have played a more significant role during emplacement at the base of the slabs than higher up in the slabs. In the current study, we found a similar trend in two of the older slabs at Storbreen – S4 and S6 – and in S4 at Styggedalsbreen. In all cases, values of λ1 are almost identical to the subglacial control values (Table 3). However, none of the other slabs, either at Storbreen or at Styggedalsbreen, displayed the same characteristics, showing generally weaker eigenvalues, less clustered fabric shapes and very similar values for tops and bottoms of the slabs.
These fabric signatures can be interpreted in two different ways. First, the recorded characteristics may be associated with the formation of a till matrix framework, which involves solid-state deformation of an initially dilated and saturated subglacial till layer (Evans et al., 2006). Some time after emplacement, when pore water pressure starts to fall through dissipation and dewatering, dilated structures begin to collapse, essentially ‘locking’ clasts into a solidified till. This scenario requires that the framework builds up from the bottom of the slab. Field evidence supporting this scenario comes from the observation of an apron of wet, compact subglacial till that is in situ and still in contact with the base of active glacier ice at Storbreen, which appears coherent but does liquefy and collapse when touched (Figure 8). The fact that the trends were observed in the relatively older slabs may also be used in support of this explanation: sediment in older slabs has had more time to develop a coherent till framework.
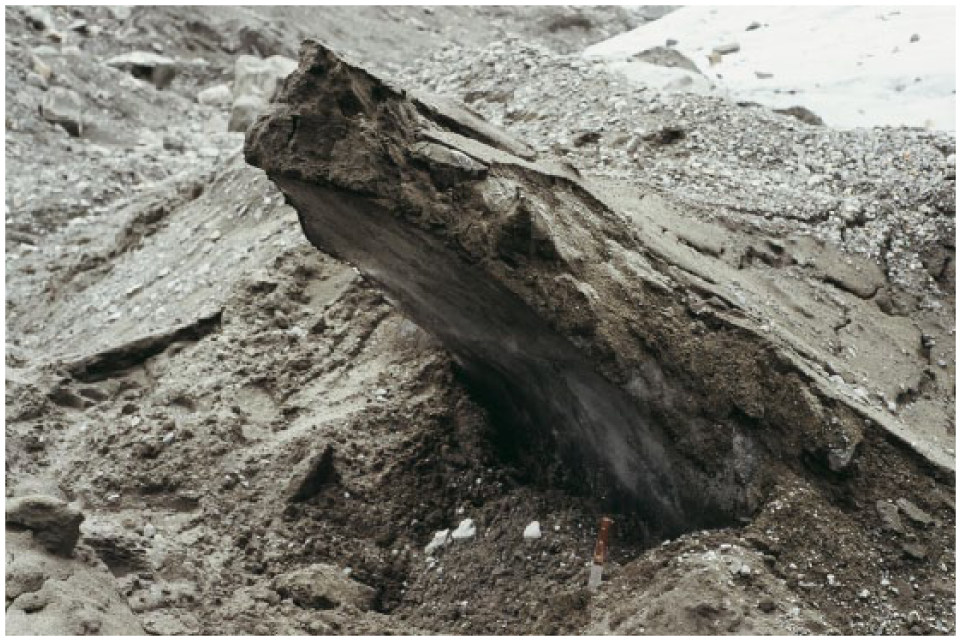
Apron of in situ dilated subglacial till at Storbreen. Note the contact of the wet diamicton with the base of active glacier ice. The diamicton was observed to lose coherence and liquefy when touched.
The alternative explanation is that the stronger till fabrics in the bottoms of slabs are pre-existing subglacial characteristics that have been inherited. The resemblance to the subglacial control samples would support this explanation. This could then also be used to support the freeze-on mechanism of moraine-ridge formation, which would be expected to preserve existing fabrics to a greater extent than the push mechanism. However, this interpretation requires the acknowledgement that syn- or post-depositional disturbance played a significant role in modifying (and weakening) an initial subglacial signal. In this context, it is noted that the azimuths of the weak fabrics are generally compatible with the configuration of the composite moraines in that clasts are aligned parallel to the bounding planes of the slabs (see Table 1).
Micromorphology indicates periglacial overprinting
Interestingly, none of the four thin-section samples (S2t, S5b and two subglacial control samples) shows an unequivocal subglacial signature (cf. Hiemstra, 2013; Menzies et al., 2010; Van der Meer et al., 2003). The lack of evidence of subglacial deposition or shearing must be explained by assuming that syn- and/or post-depositional modification of the sediments played an important role in their formation.
In all samples, there is a clear signature of frost-induced mechanical stresses of ice segregation (Figure 7). Strikingly, the micro-scale characteristics associated with the formation and thawing of ice lenses (cf. Harris, 1990, 2007; Van Vliet-Lanoë, 1998, 2010) are best developed in the reference samples PM and PT for Storbreen subglacial tills. In particular, sample PT shows excellent examples of platy and lenticular structures, silt cappings, banded fabrics, vertically oriented coarse grains and clasts, granular microstructures and vesicles.
Slab samples S2t and S5b also show predominantly periglacial features and not so much subglacial microstructure. Micro-injection features provide evidence of frost sorting and illuviation because of thaw consolidation and internal water flow. The micromorphological features in sample S5b are indicative of the downward translocation of the fine fraction: silt cappings within areas of dense plasma indicate thaw consolidation, while illuviation features within the voids suggest water flow (cf. Harris, 1990; Van Vliet-Lanoë, 1998, 2010). Particularly in sample S2t, there is evidence of sorting and translocation of fines: some of these zones are vertically aligned, which may have resulted from injections, and pore space below coarse skeleton may indicate frost heave associated with the formation of lenses of segregation ice (cf. Harris, 1990; Van Vliet-Lanoë, 1998, 2010).
Thus, the micromorphological features observed in all four thin sections are consistent with the periglacial overprinting of subglacial sediments. The well-developed indicators of periglacial processes present in the subglacial control samples (PT and PM) strongly suggest that they were inherited from before moraine-ridge formation. However, similar features could have been produced during the freeze-on and melt-out process or may even post-date moraine formation. Frost-induced mechanical stresses of ice segregation and sorting because of water flow are very clear. The periglacial fingerprint is less prominent in the annual slabs of sediment within the annual ridges (Figure 7). This may be accounted for by the ‘protoslab’ dating from the 1980s, allowing ~30 years for post-depositional changes, such as the down-washing of fines (pervection) and frost action, to occur. In contrast, the sediment slabs in the annual moraines are younger and have experienced more modest ‘overprinting’ during freeze-on (when the original inherited signal would have been disturbed) and during a relatively short period of post-depositional change (in sloping slabs).
A conceptual model linking moraine formation to glacier dynamics and thermal regime
A mechanistic model of singular and composite annual moraine-ridge formation that accounts for the observations from Storbreen and Styggedalsbreen requires a climate that is severe enough to ensure the winter freeze-on of sediments to the glacier sole at a dynamic glacier snout exhibiting winter advance and summer retreat. At Storbreen, where the extent of the summer retreat is close to that of the winter advance, annual sediment increments are superimposed to produce a relatively large, composite annual moraine (Figure 9). At Styggedalsbreen, which is somewhat lower in altitude and relatively more dynamic, the summer retreat generally exceeds the winter advance, producing isolated annual moraine ridges.
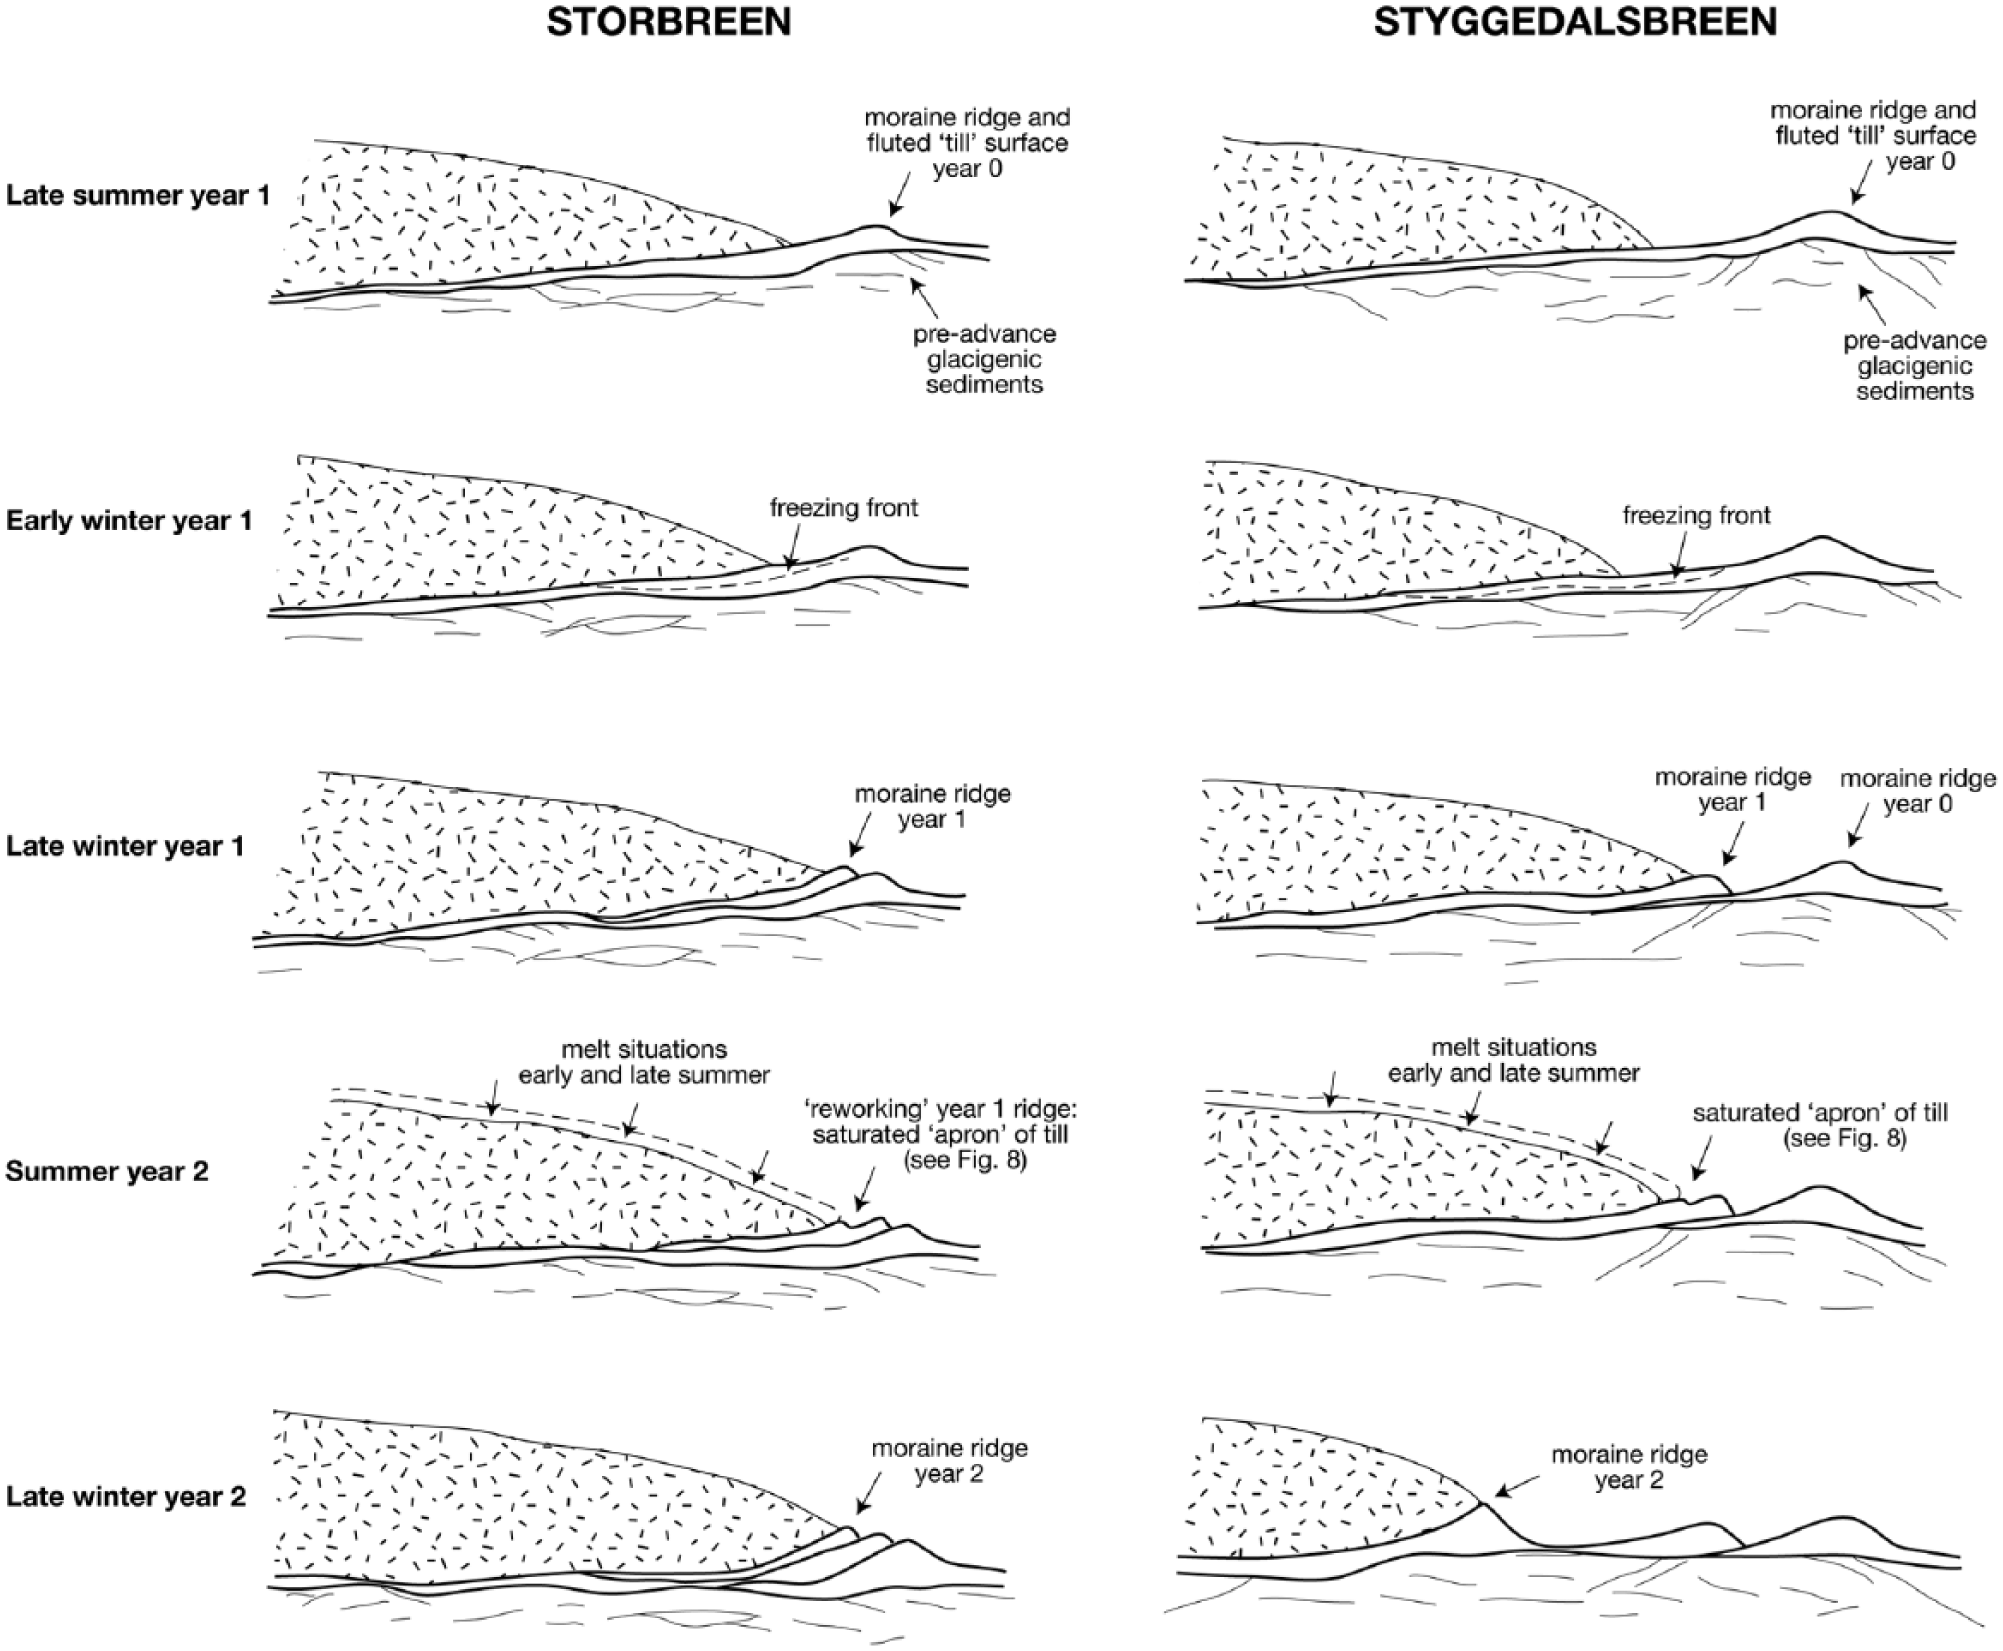
Model of singular and composite annual moraine-ridge formation. See main text for further explanation.
This model of moraine-ridge formation appears applicable to temperate glaciers, the snouts of which are subject to a seasonal ‘periglacial’ conditions. Winters must be sufficiently severe to allow deep penetration of winter cold beneath the glacier into the subglacial sediments (cf. Alley et al., 1997; Boulton, 1972; Hambrey and Glasser, 2012). However, summers must be mild enough to allow melt-out of the frozen-on layer during the following summer. In addition, ice velocity and ice melting at the glacier snout must be nearly in balance; otherwise, either the winter advance or the summer retreat would predominate and the annual cycle of freeze-on and melt-out of sediment slabs would fail to occur. Etzelmüller and Hagen (2005) have suggested that the process of seasonal marginal freezing-on and summer melting is characteristic of glaciers whose equilibrium-line altitude (ELA) lies in the zone of discontinuous and sporadic permafrost with a MAAT of −1 to −4°C. During the years of annual moraine-ridge formation, climatic conditions at the glacier snouts of Storbreen, Styggedalsbreen and also several other glaciers in Jotunheimen (cf. Winkler and Matthews, 2010) were consistent with this interpretation.
Conclusion
The evidence indicates one dominant mechanism of moraine-ridge formation at both Storbreen and Styggedalsbreen involving the annual freeze-on and subsequent melt-out of overridden proglacial slabs. While singular, well-spaced annual moraine ridges were produced at the relatively dynamic Styggedalsbreen snout, stacking of annual moraine ridges produced the larger, composite moraine at Storbreen. Each annual increment of deposition is reflected in the morphology of the moraine ridges while their sedimentology largely reflects the nature of the inherited, frozen-on material (which includes mainly subglacial sediments variously modified by glaciofluvial, glaciolacustrine and periglacial processes). Here, inherited signatures of various types account for most of the between- and within-slab variability in matrix. Hence, within-slab signatures of ‘incremental till thickening’ during slab formation are absent.
Sedimentological fingerprinting is not simple at these sites because of the dominance of inherited (pre-slab formation) signatures. This dominance can be attributed to the simplicity of the freeze-on and melt-out processes involved in annual ridge deposition at these small, relatively high-altitude temperate glaciers. The freeze-on/melt-out mechanism appears to occur at temperate glacier snouts that lie within or immediately below the zone of discontinuous/sporadic permafrost in the altitudinal zone characterized by deep seasonally frozen ground. Inheritance of sedimentological signals would be less likely in relation to other mechanisms of moraine-ridge deposition (pushing/bulldozing, squeezing), which would be expected to leave their own fingerprint more clearly. In other situations with different glacial temperature regimes and dynamics, the dominant signature might reflect processes of glacial deposition (e.g. incremental thickening) and/or post-depositional sedimentological changes rather than inheritance.
Footnotes
Acknowledgements
We thank Sven Lukas and Stefan Winkler for their helpful comments on an earlier draft of this paper. Thanks are also due to Anna Ratcliffe and Nicola Jones for preparing figures. Fieldwork was carried out on Swansea University – Jotunheimen Research Expeditions, 2006 and 2007. This paper constitutes Jotunheimen Research Expeditions, Contribution No. 193.
Funding
This research received no specific grant from any funding agency in the public, commercial or not-for-profit sectors.