
Abstract
The human modification of lake hydrology is widespread in the industrial era; however, anthropogenic impacts have occurred for thousands of years in regions of the world with long histories of human occupation. Here, we use geochemical analyses of lake sediment to document the isotopic and geochemical response of Cheng Lake (Chenghai) in southwestern China to catchment modification, including the construction of a downstream dam. The Chenghai record indicates that land-use changes affected the lake/catchment by at least AD 1150 as evidenced by an increased flux of terrestrial organic matter, sediment with high concentrations of sorbed metals, and variations in stable isotopes of oxygen in precipitated aragonite. Decreases in magnetic susceptibility and metal concentrations after AD 1360 indicate a change in sediment basin dynamics. The construction of a downstream dam between AD 1573 and 1620 caused positive shifts in the isotopic composition of aragonite, indicative of increased evaporative loss and a longer water residence time. A lake-level drop by AD 1779 is accompanied by a decrease in organic carbon and a lighter nitrogen isotopic composition that suggests the oxidation of organic matter and/or reduced primary productivity. These changes closely coincide with shifts in climate variability (such as the termination of the ‘Little Ice Age’) inferred from other, regional paleoclimate records, highlighting the challenges in distinguishing between natural and anthropogenically driven environmental variations. This study demonstrates the importance of historical and cultural context in the interpretation of lake sediment records with substantial human settlement proximal to the lake system.
Keywords
Introduction
Human engineering projects such as the construction of roads, bridges, and dams have dramatically impacted the catchment landscape, natural hydrology, and environmental setting of many lakes throughout the world. In China, human modification of lake systems began several thousand years ago and has continued at an increasingly rapid rate in the 20th and 21st centuries (e.g. Dearing et al., 2008; Hillman et al., 2014, 2015). It remains a pressing concern to improve our knowledge of the timing and magnitude of previous human impacts in order to place their effects into an appropriate context. Lake sediment records from locations with long periods of human settlement within the lake catchment can provide insight into the nature, scale, and scope of these activities.
Here, we present a sediment record from Chenghai (Cheng Lake) (26°33′N, 100°39′E, 1502 m a.s.l.) in the Yunnan Province of southwestern China near the city of Lijiang (Figure 1c). Chenghai is a suitable system within which to investigate pre-industrial anthropogenically driven environmental changes because (1) there are numerous archaeological sites dating to several thousand years before present within ~100 km of the lake (Chiou-Peng, 2009; Yao, 2010) and (2) between AD 1573 and 1620, a dam was constructed downstream of the lake (Figure 1c) for agricultural use and flood mitigation, which had historically noted effects on lake level by AD 1779 (Tang, 1989). To reconstruct changes in lake-level management and land use, we rely on measurements of the oxygen and carbon isotopic composition (δ18OCaCO3 and δ13CCaCO3) of authigenic aragonite precipitated in the water column, the isotopic composition of organic matter (δ13Corg and δ15N), the ratio of carbon to nitrogen (C/N), the concentrations of sorbed metals, and the magnetic susceptibility of sediment cores. We use these analyses to investigate the timing and magnitude of environmental changes at Chenghai in the context of coincident anthropogenic activities. This multi-proxy approach allows us to characterize the nature of pre-industrial human disturbance to watersheds in southwestern China as well as the isotopic response of the lake to the intentional manipulation of its hydrologic balance.
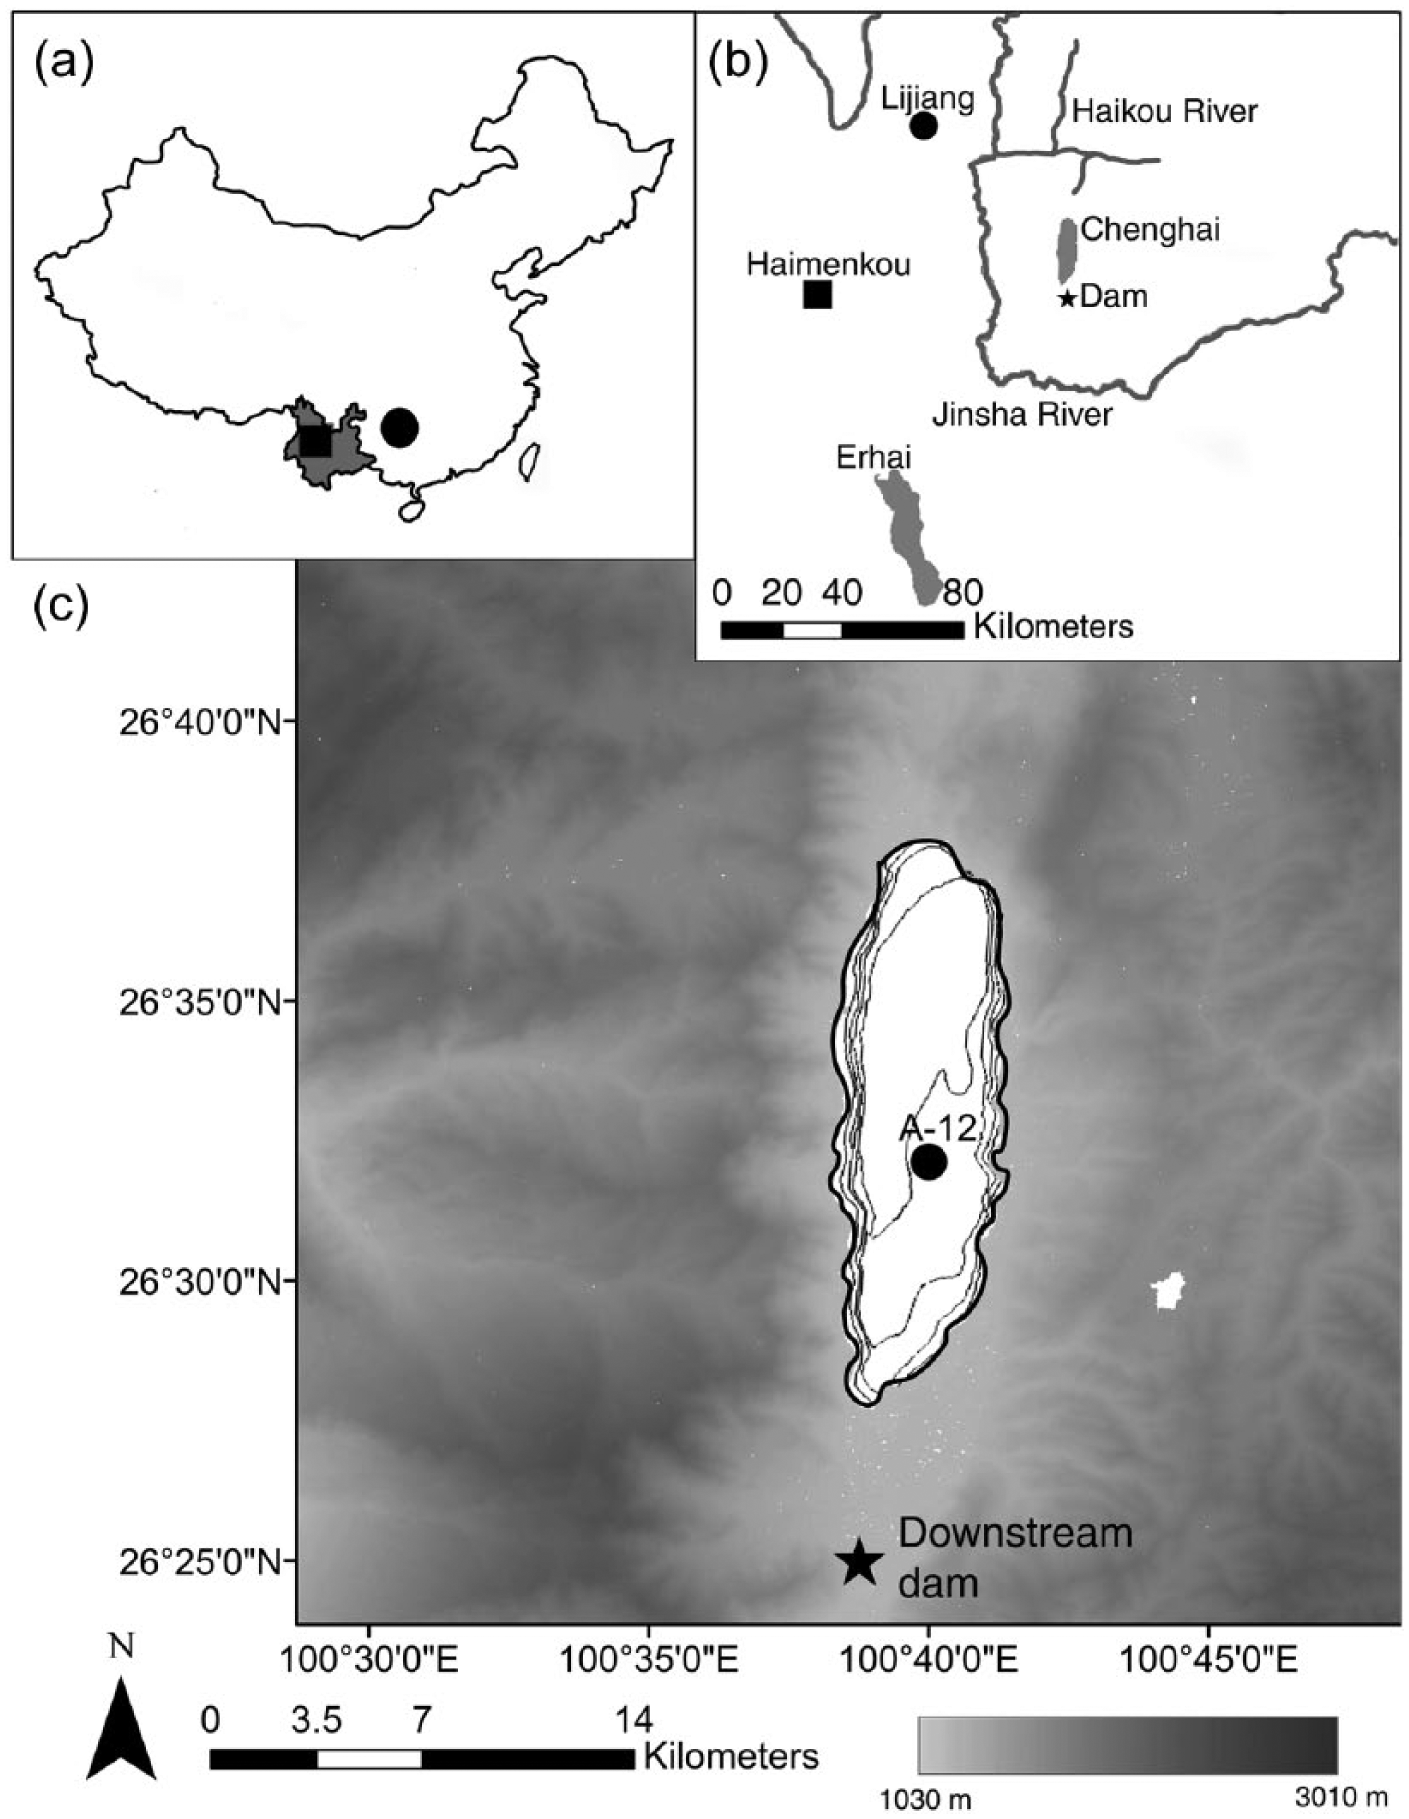
(a) Locations of Chenghai Lake (square) and Dongge Cave (circle); (b) locations of Yunnan lakes and rivers mentioned in text as well as the city of Lijiang and the archaeological site Haimenkou; (c) map of Chenghai Lake with shaded topographic relief from ASTER Global DEMs. Coring location is indicated by black circle. Bathymetric data (10 m contour intervals) (Wan et al., 2005). The location of the downstream dam is marked by the black star.
Regional setting and prior research
Chenghai is located in Yunnan Province, China (Figure 1a). The closest city with long-term meteorological records is Lijiang (46 years of data) (Figure 1b), approximately 50 km to the northwest. The climate is heavily influenced by the Indian Summer Monsoon (ISM), with annual precipitation averaging ~900 mm/yr and 80% of precipitation falling between the months of June and September (Figure 2a). Regional temperatures are generally stable, ranging between 6°C and 18°C (Figure 2a). Chenghai is a large and deep lake (Figure 1c) with a maximum depth of 35 m and an average depth of 20 m that was formed as an extensional basin during the Pleistocene (Wang et al., 1998). The lake surface area is 7.9 × 10⁷ m2 and lake volume is around 1.6 × 10⁹ m3. The bedrock and surficial geology in the Chenghai catchment is primarily Permian basalt with extensive deposits of Quaternary alluvium to the south (Bureau of Geology and Mineral Resources of Yunnan Province, 1990), resulting from the Haikou river, which once flowed through Chenghai and into the Jinsha River (Chen and Wan, 2000) (Figure 1b).
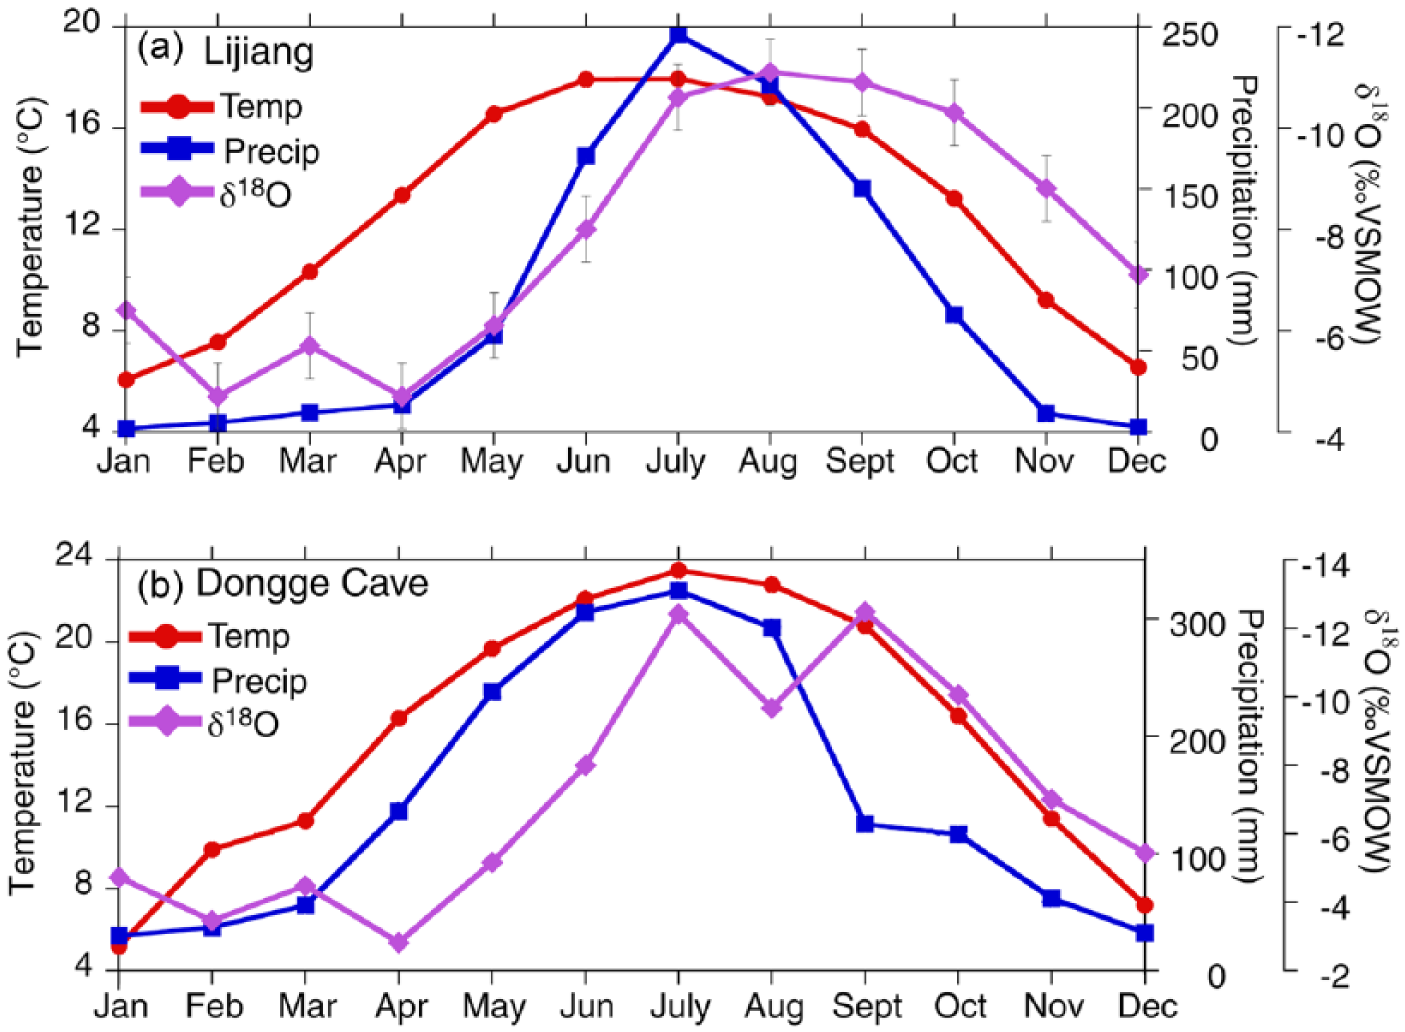
(a) Monthly average temperature (red circles) and precipitation (blue squares) from Lijiang meteorological station data and estimated precipitation oxygen isotope values for Chenghai (purple triangles) with 95% confidence intervals and an average weighted δ18O (‰VSMOW) of −9.76. Temperature data from Lawrimore et al. (2011), precipitation data from Peterson and Vose (1997), oxygen isotope data from Bowen (2013). (b) Measured monthly average temperature, precipitation, and precipitation oxygen isotope values at Dongge Cave (Dykoski et al., 2005) with an average weighted δ18O (‰VSMOW) of −8.33.
Chenghai is less than 100 km from the town of Jianchuan, the home of the Neolithic and Bronze Age site Haimenkou (Chiou-Peng, 2009) (Figure 1b), which is the largest Neolithic (ca. 1500 BC) site in China and contains the largest wooden structure identified from that period (Yao, 2010). Wheat, millet, and rice remains have also been found at this site, suggesting a wide range of agricultural practices in conjunction with large, permanent settlements (Yao, 2010). Haimenkou also contains evidence of the earliest copper-based metallurgy in western Yunnan. A study of nearby Lake Er (Erhai) (Figure 1b) found evidence to confirm the advent of copper-based metallurgy by at least 1500 BC (Hillman et al., 2015). Further archaeological and historical records documenting human activities around Chenghai are relatively limited; however, records indicate that between AD 1573 and 1620, a dam was constructed downstream of Chenghai (Figure 1c) in order to control for flooding in the summer months and for use in agricultural irrigation (Tang, 1989). A sudden drop in lake level of 30 m was noted by AD 1779 and lake water irrigation ceased thereafter (Tang, 1989). Eventually, the Haikou River became cut off from the Jinsha River, although the exact cause and date are not known, and in AD 1851, Chenghai was noted as being surficially closed (i.e. overflow of the lake basin had ceased) (Chen and Wan, 2000). In AD 1942, the population around Chenghai began to rapidly increase, causing an expansion of agricultural activities and the use of fertilizer (Wu et al., 2004). The use of lake water for irrigation expanded in AD 1982 when a pumping station was added to the lake shore (Wang and Dou, 1998). Further human modification of the lake hydrology occurred in AD 1993 when a tunnel was excavated, diverting water from the Xianren River into Chenghai to reduce drops in lake level (Wang and Dou, 1998).
Chenghai receives water from precipitation (annually averaging 0.570 × 10⁸ m3) and groundwater throughflow (annually averaging 0.275 × 10⁸ m3) (Wang and Dou, 1998). With an average pH of 8.2, the lake water chemical composition is dominated by the bicarbonate ion (HCO3−) at concentrations averaging 579.9 mg/L (Wan et al., 2005). Positive oxygen isotope values of the lake water (−2.9‰) (Whitmore et al., 1997); high concentrations of ions such as Mg2+ (63.6 mg/L), Na+ (171.4 mg/L), and K+ (11.8 mg/L) (Wan et al., 2005); and average salinity values of 1.042 g/L (Wu et al., 2004) all suggest that the lake primarily loses water through evaporation. An estimated hydrologic balance of the lake shows that output from evaporation exceeds that of total inputs, resulting in an annual water loss of ~0.11 × 10⁸ m3 (Wang and Dou, 1998). The oxygen isotopic composition of two lake water samples collected in July 2012 averaged −1.58‰ VSMOW (Figure 3), ~8‰ more enriched than the average weighted oxygen isotope composition of precipitation estimated for Chenghai (95% confidence intervals for these values are 0.65‰ for oxygen and 5.30‰ for hydrogen) (Bowen, 2013) (Figure 2a). Lake water isotopic composition can exhibit year-to-year variability, and our estimates of lake water isotopic composition derive from only one sampling year; however, the water samples collected from Chenghai plot far to the right of the Global Meteoric Water Line (GMWL) (Figure 3) further evidence that Chenghai lake water is strongly modified by evaporative enrichment.
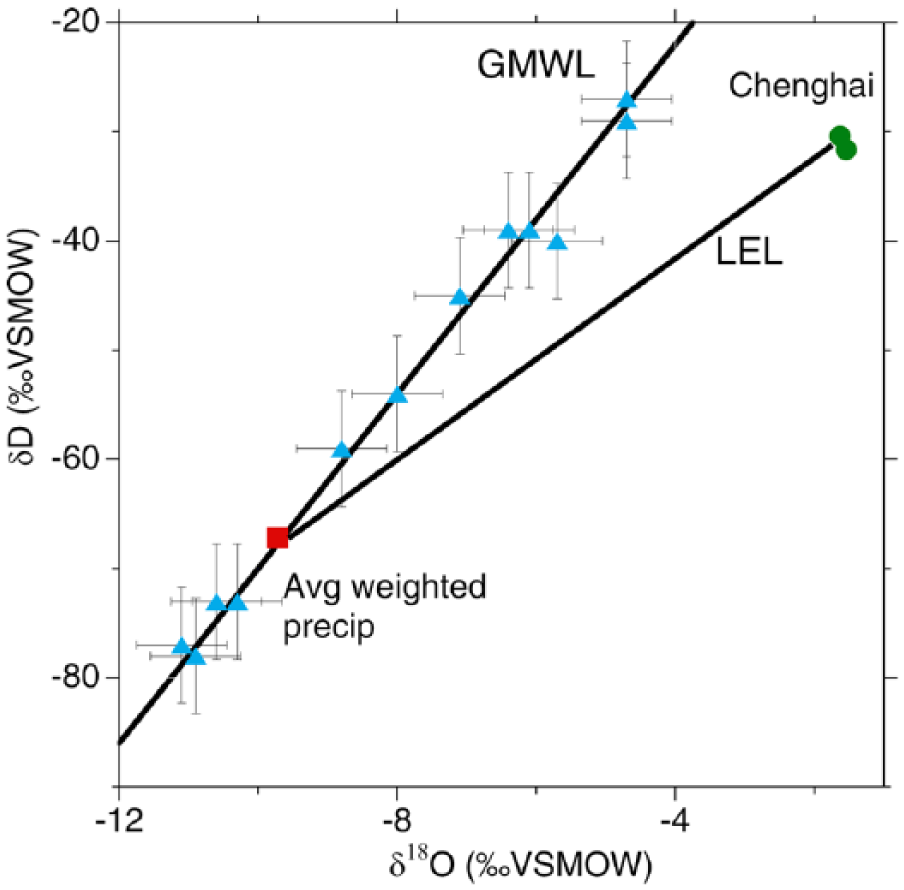
Water isotope samples from Chenghai (green circles), monthly precipitation isotope values estimated from Bowen (2013) (blue triangles) with 95% confidence intervals, and the annual weighted mean of modern rainfall for Chenghai (red square).
Advanced Spaceborne Thermal Emission and Reflection Radiometer (ASTER) global digital elevation maps (DEMs) indicate that the Chenghai catchment is steep-sided, making it prone to large lake-level changes in response to hydrologic forcing (Figure 1c). A bathymetric map of Chenghai shows that the lake basin is also steeply sloped with 10–20 m elevation change occurring over <0.5 km (Wan et al., 2005) (Figure 1c). Historical records note that by AD 1779, Chenghai had dropped 30 m, although the cause of this drop was unknown (Tang, 1989). More recent observations indicated declines in lake level of 5 m from AD 1960 to 1990 (Whitmore et al., 1997). While a drop of 30 m is substantial, DEMs confirm that if the lake were 30 m higher than present-day levels, Chenghai would be an overflowing, open-basin lake with significant outflow to the south. The Quaternary alluvium deposits to the south of Chenghai (Bureau of Geology and Mineral Resources of Yunnan Province, 1990) corroborate historical observations that suggest the lake level was once much higher (Tang, 1989).
Although suffering from limitations, several previous studies of Chenghai have nevertheless provided foundational information on lake/catchment hydrology and sedimentology. These studies relied on limited chronologies based on either 210Pb dating alone (Chen et al., 2002; Wang et al., 2002; Wu et al., 2003; Zhu et al., 2011), which is not effective prior to ~120 years ago (Binford et al., 1993) or a limited number of radiocarbon dates (Wu et al., 2004 applied only one) to constrain the age of the lowermost sediments. These underdeveloped chronologies restricted the delineation of the timing of abrupt changes in isotopic geochemistry as well as the estimation of sedimentation rates. An additional limitation of this previous work is that the stable isotope measurements were conducted on unsieved bulk material, which likely contained shell fragments subject to vital or biological effects (Leng and Marshall, 2004), and sampling was performed at a low resolution (~5-cm intervals). Of further concern, the oxygen isotope composition of the bulk carbonate material, as identified by Wu et al. (2004), shifted toward lower values over the last 120 years, which is unexpected given that observational evidence indicates that lake levels dropped over this time period (Whitmore et al., 1997).
Our study expands upon this previous work using a longer sediment core of 123 cm, an improved radiocarbon chronology based on 210Pb ages and three radiocarbon dates on terrestrial macrofossils, isotope measurements of processed (i.e., not bulk) carbonate material, and a higher resolution, multi-proxy dataset that demonstrates the limnological consequences associated with the anthropogenic manipulation of hydrologic balance.
Materials and methods
Core collection
A sediment core was collected from Chenghai using a 9-cm diameter UWITEC surface coring system with removable polycarbonate tubes. This core (A-12) was collected at a water depth of 27 m and measures 123 cm (26°32′01″N, 100°40′06″E) (Figure 1c). The upper 30 cm of the core was extruded in the field at 1 cm intervals into sterile plastic bags.
Age control
Radiocarbon ages were measured on four terrestrial macrofossils, including charcoal and leaves (Table S1, available online). Samples were analyzed at the Keck Center for Accelerator Mass Spectrometry at the University of California Irvine. Prior to analysis, samples were pretreated using a standard acid, base, acid procedure (Abbott and Stafford, 1996). The resulting ages were calibrated using CALIB 7.0 and the INTCAL13 calibration curve (Reimer et al., 2013). The upper 19 cm of the core was lyophilized and analyzed for 210Pb and 214Pb activities (Table S2, available online) by direct gamma counting in a broad energy germanium detector (Canberra BE-3825) at the University of Pittsburgh.
Geochemistry
Water content and bulk density were measured at 2 cm intervals using 1 cm3 samples. The weight percentage of organic matter and carbonate within these same samples was determined by loss-on-ignition (LOI) analysis at 550°C and 1000°C, respectively (Dean, 1974). Sediment core magnetic susceptibility was measured on split cores using a Bartington® Instruments Ltd ME2EI surface-scanning sensor equipped with a TAMISCAN-TSI automatic logging conveyer. Magnetic susceptibility values were not measured on samples from the upper 30 cm of the core that was extruded in the field. Samples for x-ray diffraction (XRD) analysis were taken every 30–40 cm, lyophilized, and homogenized using a mortar and pestle. The samples were prepared as back-filled cavity mounts and analyzed using a Phillips X’Pert MPD diffractometer. Samples from the same intervals were analyzed with a scanning electron microscope (SEM) at the University of Pittsburgh to examine mineral shape and form.
Cores were sampled continuously at 0.5 cm intervals for analysis of the oxygen and carbon isotopic composition of carbonate minerals. Samples were disaggregated with 7% H2O2 and sieved through a 63-µm screen to remove biogenic carbonates derived from ostracod and gastropod shells. Samples were soaked in a 50% bleach and 50% DI water mixture for 6–8 h to remove organic matter, rinsed with water until pH neutral, and lyophilized. Samples were reacted in ~100% phosphoric acid at 90°C and measured using a dual-inlet GV Instruments Ltd (now Isoprime Ltd) IsoPrime™ stable isotope ratio mass spectrometer and MultiPrep™ inlet module at the Regional Stable Isotope Laboratory for Earth and Environment Science Research at the University of Pittsburgh. Oxygen and carbon isotope results are expressed in conventional notation as the per mil deviation from the Vienna PeeDee Belemnite standard-δ18O (‰ VPDB) and δ13C (‰ VPDB). One sigma analytical uncertainties are within ±0.10‰ for both isotopes. Replicate measurements of δ18OCaCO3 and δ13CCaCO3 had an average standard deviation of 0.10‰ and 0.05‰, respectively.
The weight percentage of nitrogen and carbon, nitrogen and carbon isotopic composition, and the atomic C/N ratio were measured at 4 cm intervals. Samples were covered in 1 M HCl for 24 h to dissolve carbonate minerals and rinsed with water until pH neutral. Samples were then lyophilized and analyzed at the University of Pittsburgh using a Eurovector Elemental Analyzer and Isoprime Dual Inlet Isotope Ratio Mass Spectrometer. Organic carbon isotope values are expressed in conventional notation as the per mil deviation from the VPDB-δ13Corg (‰ VPDB), whereas nitrogen isotopes are reported relative to atmospheric N2-δ15N (‰). One sigma analytical uncertainties are within ±0.14‰ for δ13Corg and ±0.20‰ for δ15N. Replicate measurements of δ13Corg and δ15N had an average standard deviation of 0.30‰ and 0.5‰, respectively.
Sorbed metal concentrations were measured at 3 cm intervals. All samples were lyophilized and homogenized prior to analysis. Elements were extracted with 10 mL of 1 M HNO3 for ~24 h (Graney et al., 1995). The supernatant was separated and diluted before measurement on an inductively coupled plasma mass spectrometer (ICP-MS) at the University of Pittsburgh. Blanks were run every 10 samples to check for bleed-through and concentrations arising from memory effects were consistently below detection limits. Duplicates were run on every 10th sample and had a range of <10%.
Results
Geochronology
Radiocarbon ages were measured on four terrestrial macrofossils. One of these ages (67.5 cm) was excluded from the age model (Table S1, available online
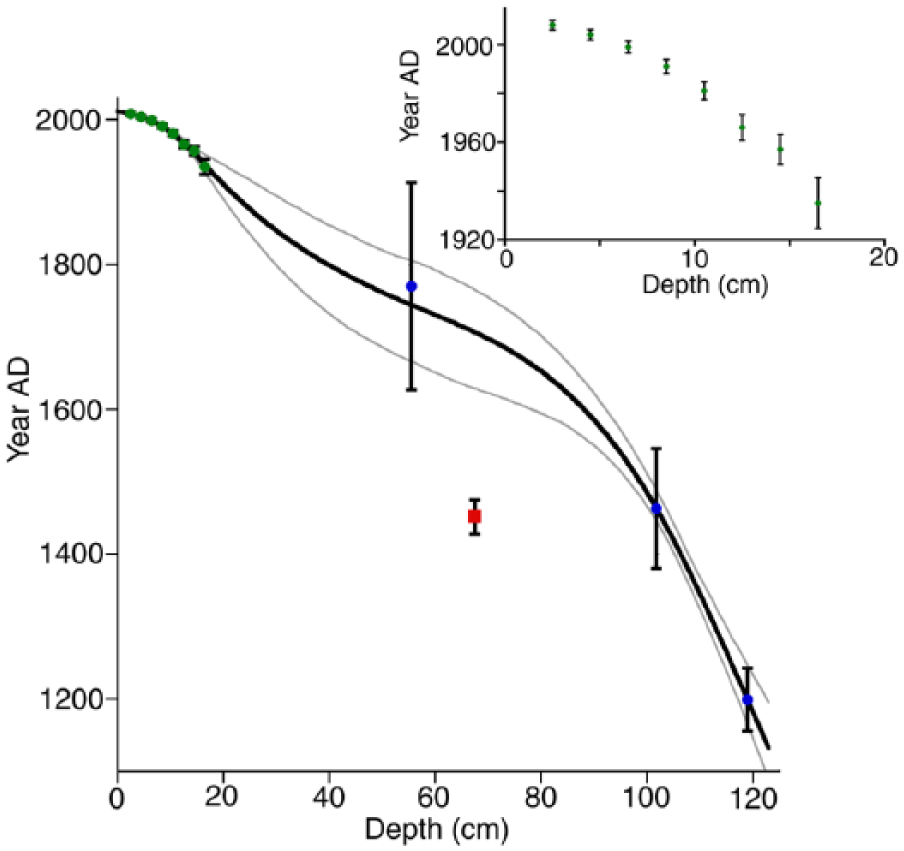
Age–depth model with 95% confidence intervals. 210Pb dates (green circles), radiocarbon dates (blue circles), excluded radiocarbon date (red square), all with 2-sigma error bars. 210Pb dates with 2-sigma error bars in inset.
Geochemistry
The entire 123 cm core lacks visible stratigraphy and is composed of reddish, fine-grained clay-sized particles. These sediments are primarily composed of quartz and a small amount of iron (between 1% and 2%). SEM and XRD analyses indicate that the primary carbonate mineral is authigenic aragonite (Figures S1 and S2, available online), which LOI results indicate range between 5% and 10% by weight. Wu et al. (2004) identified calcite in the Chenghai cores via XRD analysis; however, our XRD data and SEM images from evenly spaced samples throughout the entire length of the core confirm the presence of aragonite and the absence of calcite. Moreover, the high magnesium concentrations observed in the Chenghai waters (Mg/Ca ratio ~12) (Whitmore et al., 1997) are more amenable to aragonite formation. The lack of visible stratigraphy and general sedimentological homogeneity of the core prevents dividing the record into distinct lithological units. We therefore used the geochemical data to separate the record into three periods.
Unit I: AD 1150–1360
From AD 1150 to 1360, the sedimentation rate is 0.06 cm/yr. Magnetic susceptibility measurements are highest at the base of the core, peaking at 543 × 10−5 m3/kg. Concentrations of several sorbed metals (Al, Co, Cu, Fe, Ti, and Zn, Figure 5) display similar trends. Oxygen and carbon isotope compositions have a high covariance with an R2 value of 0.80 (Figure 6). Oxygen and carbon isotopes of aragonite gradually trend toward higher values, from −7.0‰ to −6.4‰ and 0.0‰ to +1.7‰, respectively (Figure 7). Carbon isotopic composition shifts toward lower values from +1.7‰ to +0.3‰ in the last 50 years of Unit I. Weight percent aragonite and organic matter are both constant, each at 7.5%. The composition and isotopic signature of the organic matter are relatively stable with an average C/N ratio of 6.8, δ13Corg value of −24.4‰, and δ15N value of +3.7‰.
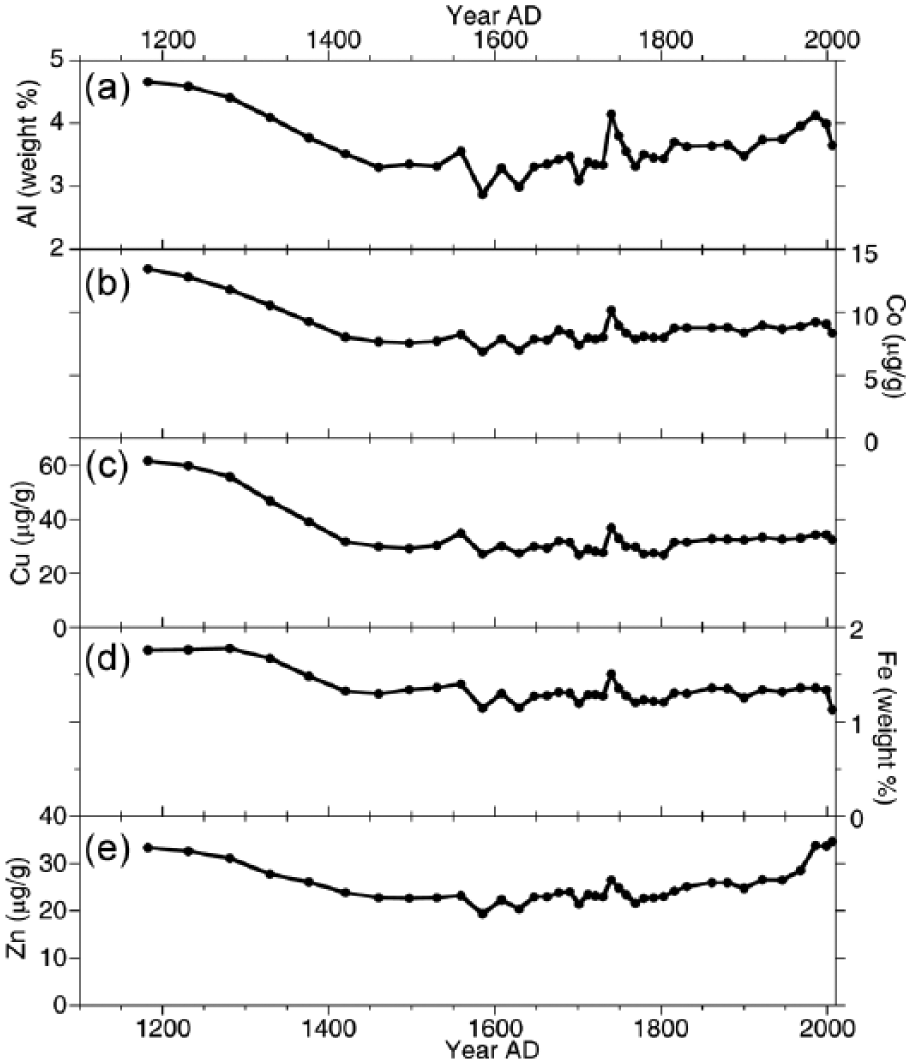
Concentrations of metals from Chenghai: (a) aluminum (Al), (b) cobalt (Co), (c) copper (Cu), (d) iron (Fe), and (e) zinc (Zn).
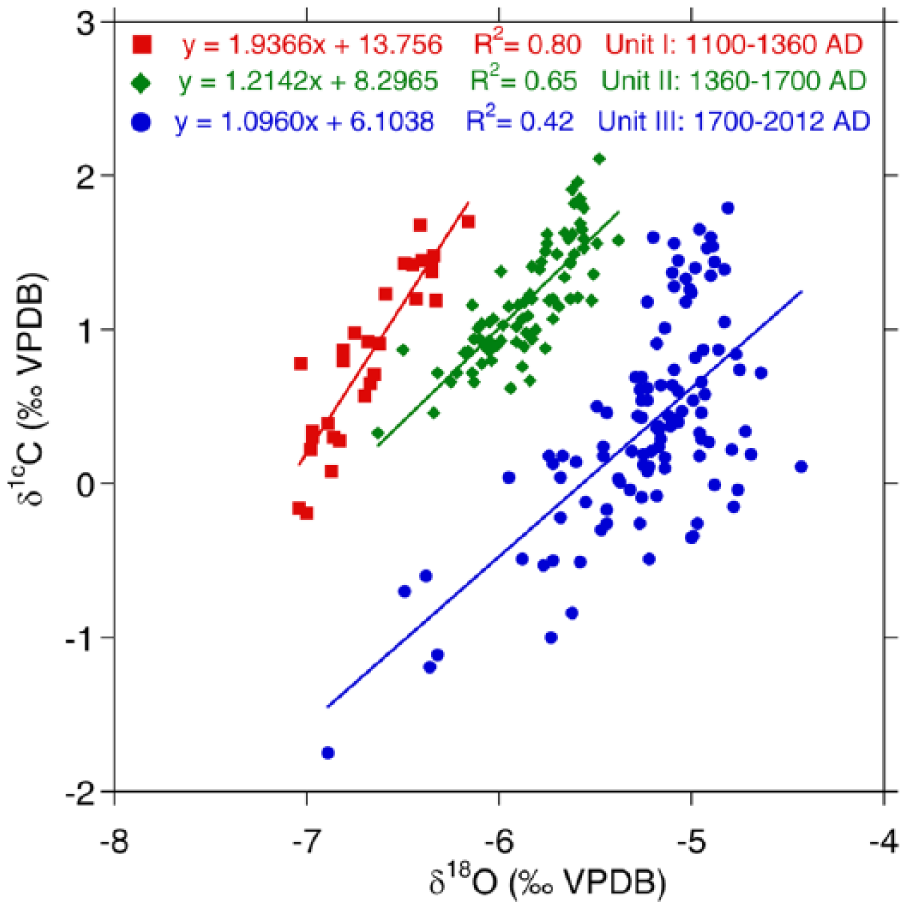
Isotopic covariance of Chenghai for three time periods: Unit I (AD 1100–1360) in red squares, Unit II (AD 1360–1700) in green triangles, and Unit III (AD 1700–2012) in blue circles.
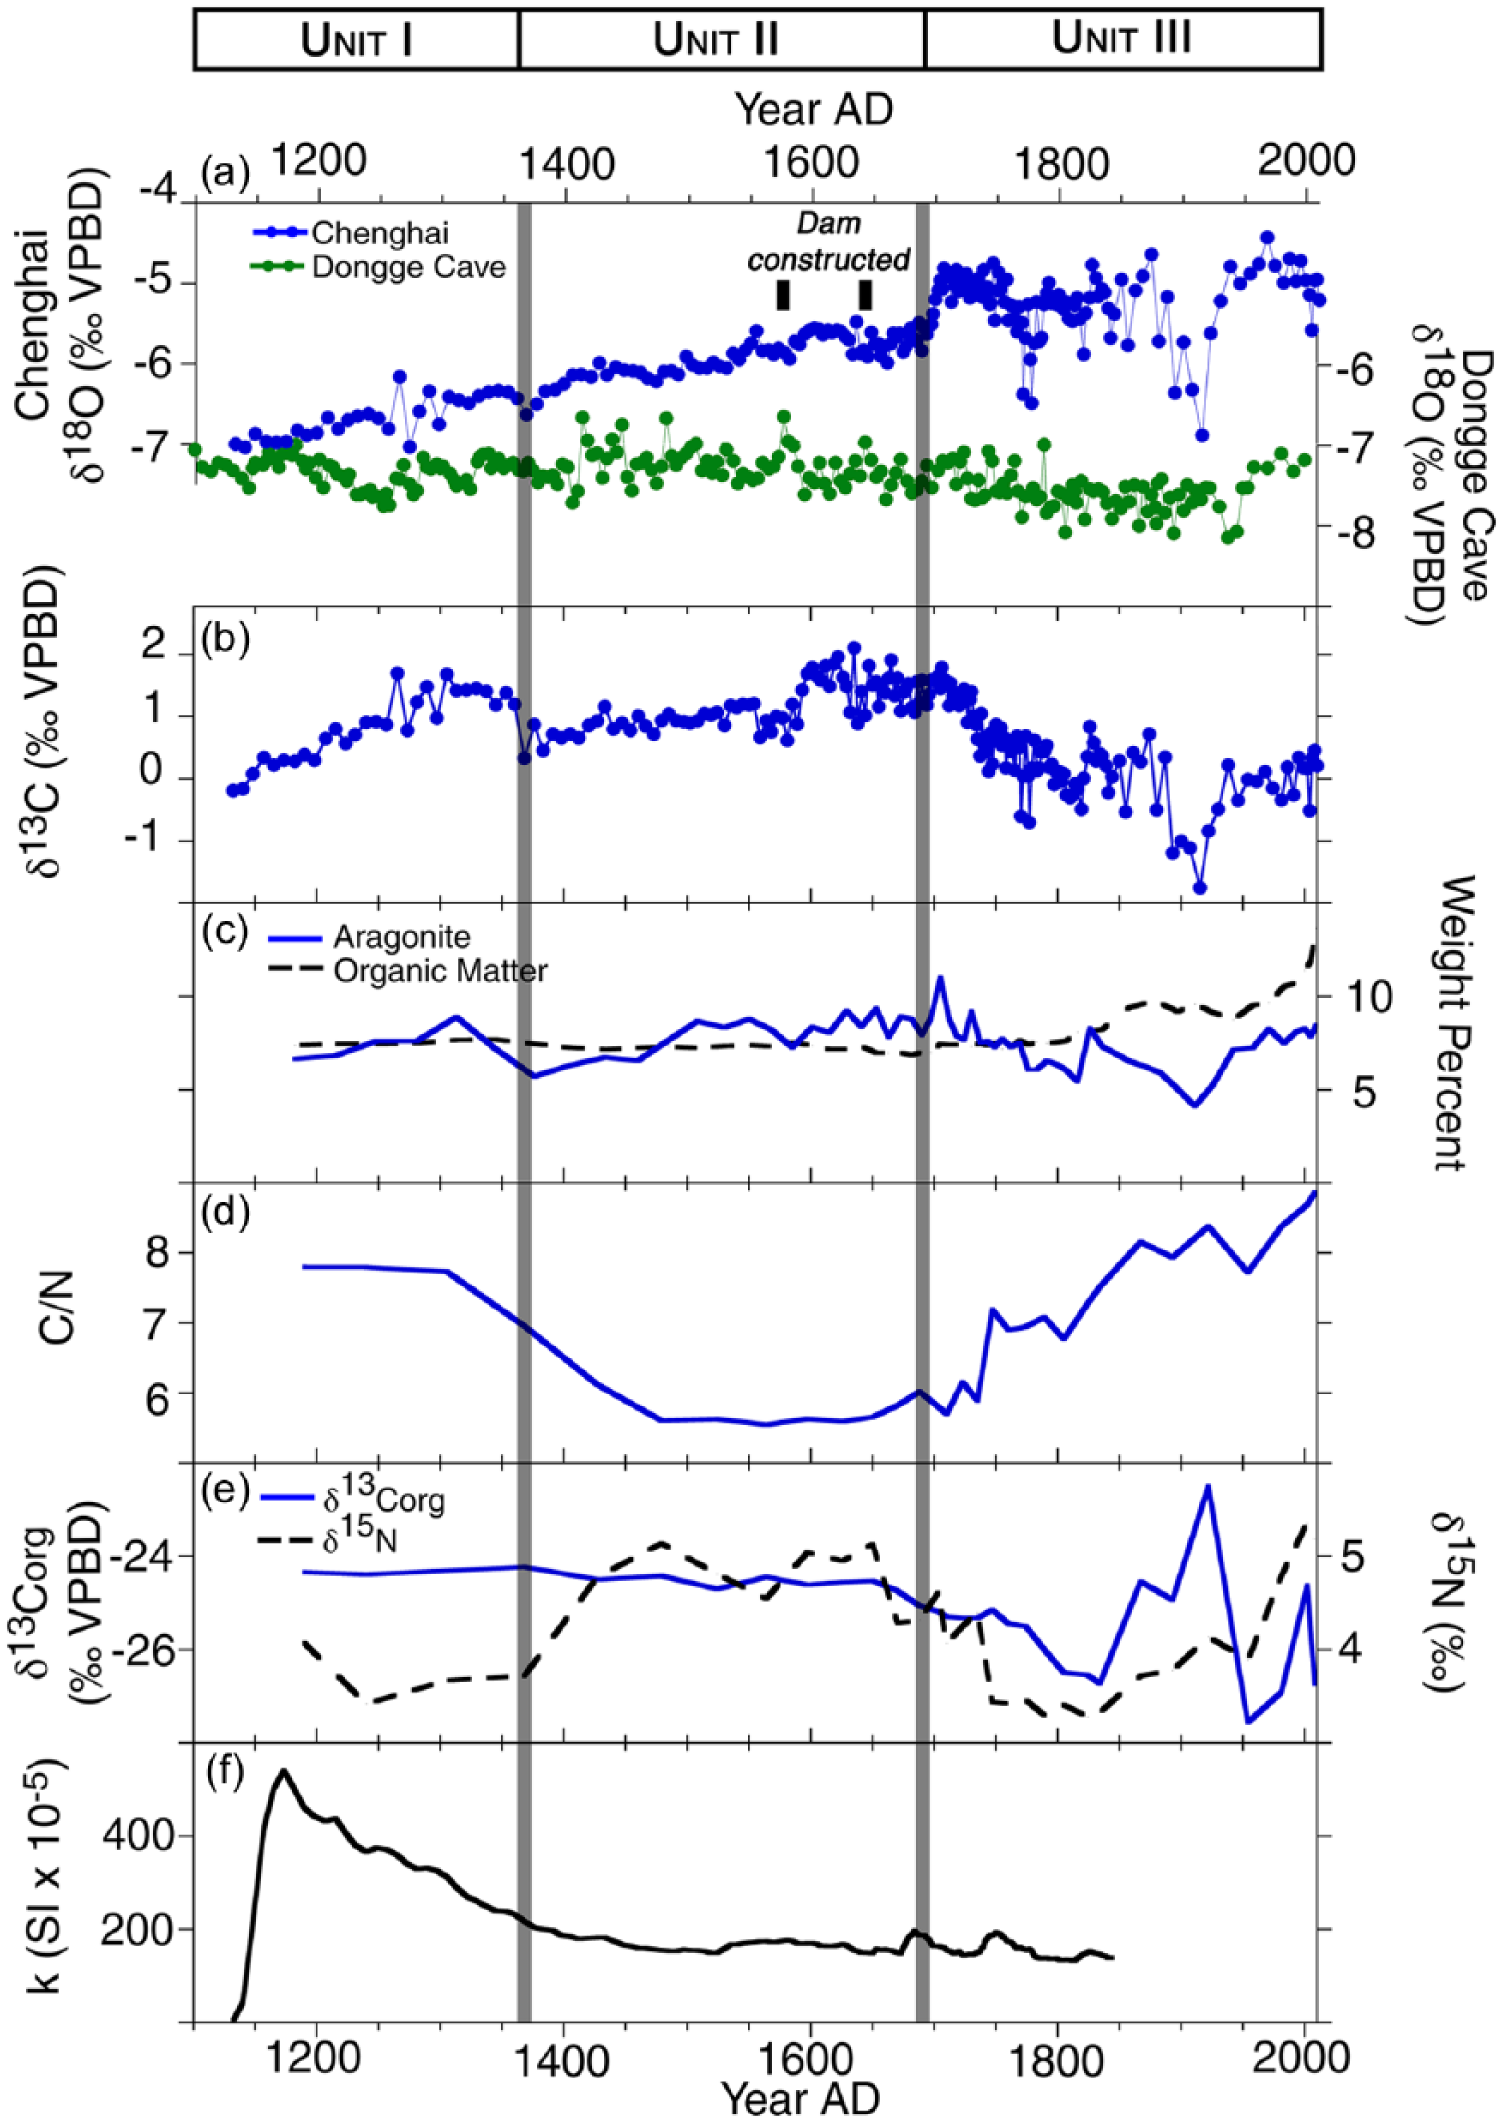
(a) Oxygen isotopic composition of aragonite from Chenghai (blue), oxygen isotopic composition from Dongge Cave (green) (Wang et al., 2005); (b) carbon isotopic composition of aragonite; (c) weight percent aragonite (blue solid line) and organic matter (black dotted line); (d) carbon to nitrogen ratio; (e) carbon isotopic composition of organic matter (blue solid line), nitrogen isotopic composition of organic matter (black dotted line); (f) magnetic susceptibility.
Unit II: AD 1360–1700
In Unit II, the sedimentation rates increase slightly to 0.10 cm/yr and substantial changes occur in the δ18OCaCO3 and δ13CCaCO3 data. The carbon isotopic composition slowly increases to +2.0‰ and the oxygen isotopic composition continues to gradually increase by ~1‰ from −6.4‰ to −5.5‰ (Figure 7). The covariance of oxygen and carbon isotope values is weaker than in Unit I (but strong overall) with an R2 value of 0.65 (Figure 6). Other variables in Unit II that decline to a minimum at AD 1570 include C/N (4.5), magnetic susceptibility (150 × 10−5 m3/kg), and the concentrations of sorbed metals (Figure 5). Nitrogen isotopic composition increases to a maximum of +5.1‰ and remains generally enriched in the middle of this unit.
Unit III: AD 1700–present
From AD 1700 to 1830, there are shifts of +1.5‰ in δ18OCaCO3, −2‰ in δ13CCaCO3, −2‰ in δ13Corg, and −1.5‰ in δ15N (Figure 7). Sedimentation rates also increase ~threefold to 0.30 cm/yr. After AD 1700, sub-decadal to decadal variability in the aragonite isotope data increases. Covariance between oxygen and carbon isotopes decreases to an R2 value of 0.42 (Figure 6). A negative isotopic excursion occurs from AD 1890 to 1930: δ18OCaCO3 values shift by −1.5‰, δ13CCaCO3 shifts by −2.5‰, δ13Corg shifts by +4‰, and δ15N shifts by +1‰. By AD 1940, pre-excursion values are reestablished, with the exception of δ15N which increases to +5‰. Around AD 1810, weight percent organic matter steadily increases and reaches a maximum of 14% in the uppermost sediments. Carbon to nitrogen ratios also steadily increase throughout Unit III to a maximum of 7.9.
Discussion
When lake levels rise or fall, the hypsographic relationships between volume, surface area, and depth, as well as groundwater outseepage rates, change and alter the proportion of water lost through evaporation, which in turn alters the isotopic composition of the remaining lake water (Gat, 1995; Gibson et al., 1996; Gonfiantini, 1986; Leng and Marshall, 2004; Steinman et al., 2010, 2013). For example, lower lake levels in closed-basin lakes may result from increased evaporation which will preferentially remove lighter isotopes of oxygen (16O) and hydrogen (H), thereby concentrating the heavy isotopes (18O, 2H) of both elements in the remaining lake water. Estimates of Chenghai hydrologic budget as well as modern water isotope data demonstrate that a large portion of lake water is lost through evaporation (Figure 3), indicating that lake water isotopic composition should strongly respond to hydrologic forcing resulting from catchment modification as well as shifts in precipitation and evaporation (P/E) balance. Authigenic carbonate minerals precipitated from the water column, such as aragonite, settle to the lake bottom, archiving the lake water isotopic composition. Information on past changes in lake levels at Chenghai can therefore be obtained by isolating these minerals and analyzing their isotopic ratio (δ18O).
One challenge with the interpretation of water and carbonate mineral isotope values is in differentiating between changes in lake hydrologic balance because of human modification as opposed to changes in hydroclimate (that in this particular case are associated with the ISM). To this end, we assess regional records of monsoon variability to provide a framework within which to interpret δ18OCaCO3 at Chenghai. Variations in the strength of the East Asian Summer Monsoon (EASM) are recorded by the isotopic composition of speleothems at Dongge Cave in the Guizhou province, ~500 km east of Chenghai (Wang et al., 2005) (Figure 1a). While the EASM is distinct from the ISM, they are both strongly influenced by Northern Hemisphere summer insolation and exhibit only slightly different responses to internal variability components of the climate system such as the El Niño Southern Oscillation (ENSO) (Wang et al., 2003). Strict spatial boundaries between the ISM and EASM are difficult to define (Cheng et al., 2012), and the difference between Lijiang and Dongge Cave annual weighted means of modern rainfall δ18O (based on estimates from the waterisotope.org online calculator; Bowen, 2013) is offset by only ~1.5‰ (Figure 2). The similarity in the isotopic composition of modern rainfall and modern-day climate (Figure 2) suggests that comparable changes in climate likely occurred at the two locations over the last millennium. The Dongge Cave record therefore provides an insightful (although less than ideal) reconstruction of monsoon strength in the Chenghai region that can serve as a baseline for interpreting lake water and sediment isotope variation through time.
In order for Chenghai aragonite to be a faithful recorder of the isotopic composition of lake water, the mineral must form in isotopic equilibrium with the water. The fractionation factor (α) between aragonite and water is temperature dependent and follows the equation:

where T is water temperature (Kim et al., 2007). Applying a value of 31.2°C for August (estimated by Wan et al., 2005) and water isotope values of −1.63‰ and −1.54‰ VSMOW (collected in July 2012), the δ18OCaCO3 values of aragonite should be between −5.2 and −5.3‰ VPDB. This value is very close to the δ18OCaCO3 value of aragonite in the surface sediments (−5.6‰). Given the euhedral aragonite displayed by the SEM images (Figure S1, available online) and these calculations, we interpret the δ18OCaCO3 values of aragonite in Chenghai sediments to primarily reflect changes in lake water isotopic composition.
Unit I: Early anthropogenic disturbance
The geochemical and isotopic shifts in Unit I can be primarily attributed to anthropogenic rather than natural factors. The color, composition, and geochemical characteristics of these sediments are similar to both catchment soils and those of sediment from other central Yunnan lakes (such as Qilu, Xing Yun, Dian) that were deposited during periods of substantial human impact (Brenner et al., 1991; Hillman et al., 2014; Sun et al., 1986; Whitmore et al., 1994). While our sediment core does not extend back far enough to capture background values of magnetic susceptibility (Figure 7) and weakly bound metal concentrations (Figure 5), we interpret the high values of these measurements at AD 1150 to indicate human disturbance within the catchment. The long-time practice of copper metallurgy (which has been confirmed through archaeological and lake sediment assessments of nearby sites) (Chiou-Peng, 2009; Hillman et al., 2015; Yao, 2010) likely contributed to metal loadings on the catchment through atmospheric transport that entered the lake system via erosion or direct fallout. In this part of Yunnan, there are few historical records that aid in the interpretation of these variables, and thus, the timing of the initial anthropogenic impact on the lake is unclear. We hypothesize that a change in land use, such as the clearance for agricultural activity, may have occurred sometime prior to AD 1150 leading to erosion and transport of clastic material into the lake. This interpretation is supported by higher C/N ratios than in subsequent units (Figure 7), suggesting an increased proportion of terrestrial organic matter (Meyers, 1994) in the Unit I sediments.
Previous studies of the Chenghai oxygen and carbon isotope record do not extend back as far as our Unit I interval (Figure S3, available online) (Chen et al., 2002; Wu et al., 2004). We interpret the δ18O and δ13C values in Unit I to indicate that the lake had restricted outflow during this period. While historical observations suggest that Chenghai was an open-basin lake prior to ~AD 1851 (Chen and Wan, 2000), we suggest an alternative hypothesis that Chenghai has been closed to surface outflow since at least AD 1150. The high degree of covariability between δ18OCaCO3 and δ13CCaCO3 values (R2 = 0.80) (Figure 6), which are typically inferred to represent hydrologically closed conditions (Talbot, 1990; Li and Ku, 1997), in Chenghai aragonite supports this assertion. Furthermore, the δ18OCaCO3 values of Chenghai at AD 1150 (−7.0‰) are very close to the δ18OCaCO3 values of the Dongge Cave speleothem at AD 1150 (−7.2‰) (Figure 7), although the annual weighted δ18O means of modern rainfall are offset by ~1.5‰ (Figure 2). This suggests that if Chenghai were an open-basin system, δ18OCaCO3 values should be 1.5‰ more negative than what is observed at the beginning of Unit I.
Historical records indicate that Chenghai was once a system linking the Haikou and Jinsha Rivers and that it was surficially closed by AD 1851, although the initial timing of the Haikou and Jinsha River cutoff which led to the transition at Chenghai from an open- to a closed-basin is not clear (Chen and Wan, 2000). It is likely that outflow to the Haikou River became progressively more limited during the ‘Little Ice Age’ (‘LIA’) (globally expressed between ~AD 1300–1850) before ceasing entirely, as historical observations confirm Chenghai had been lowering during this time (Tang, 1989). In closed-basin lakes, shifts in the oxygen isotope composition toward higher values are typically interpreted to represent increased evaporation and/or less precipitation (Talbot, 1990). The measured increase in sediment δ18O values is therefore logical in the context of the LIA, a time period of known aridity and cooler temperatures in Southwestern China (Mann et al., 2009; Morrill et al., 2003); however, the timing of the onset of the LIA does not closely match with any measured changes in Unit I. While the initiation of the LIA in Asia was spatially and temporally variable (Morrill et al., 2003), most records indicate that it began by ~AD 1300, at which time the Chenghai δ18OCaCO3 values exhibit no substantial change. Furthermore, there is disparity between the long-term trends in the Dongge Cave δ18OCaCO3 record, which exhibits variability about a relatively constant mean value throughout Units I and II (and gradually declines throughout the majority of Unit III), and that of Chenghai, which exhibits a sustained, long-term trend toward higher δ18OCaCO3 values throughout the majority of the last 900 years.
Lake sediment isotope values may also be influenced by temperature changes. For example, cooler lake water temperatures result in greater fractionation during carbonate mineral precipitation, causing higher δ18O values (0.25‰/°C) (Craig, 1965). If temperature was the only factor in causing the ~2‰ oxygen isotope increase over the AD 900–1700 time period, a temperature decrease of ~8°C would be required, which is unreasonable for this region of China during the LIA (Mann et al., 2009). Collectively, this suggests that climate change, albeit an unquestionable influence, is likely not the primary cause of oxygen isotope variability in the Chenghai sediment record.
Analysis of authigenic calcite and other proxies from Xing Yun lake sediment, in central Yunnan Province, revealed a gradual trend toward lower lake levels beginning at AD 500 that also cannot be explained by climate variability alone and likely was the result of human modification of the catchment (Hillman et al., 2014). The Xing Yun record therefore supports our assertion that anthropogenic impacts taking place many hundreds of years ago could have been substantial enough to influence water balance in the Chenghai system. Although the record from Chenghai does not extend back in time far enough to determine when human modification of the catchment and the consequent initial change in water balance occurred, nor how abrupt this transition might have been, both the geochemical and isotopic variations throughout Unit I suggest that the primary driver of change was anthropogenic activity, possibly related to the expansion of agriculture. Future work is required to extend the Chenghai sediment record further back in time to capture the timing and magnitude of the initiation of human disturbance.
Unit II: Hydrologic modification
The slow and steady increase in δ18OCaCO3 values in Unit II suggests the continued, gradual lowering of lake level (Figure 7), which may have resulted in part from catchment water diversion for agriculture. Unit II encompasses the LIA, a time of increased aridity because of reduced monsoon strength (Morrill et al., 2003), that may have contributed to lower lake levels as well as the need for freshwater resources to sustain agriculture. δ13CCaCO3 values increase at ~AD 1590, resulting in reduced covariance between δ18OCaCO3 and δ13CCaCO3 values relative to Unit I (Figure 6). A shift in δ13CCaCO3 without a concomitant shift in δ18OCaCO3 suggests that lake-level changes are not responsible. Increases in δ13CCaCO3 may be because of increased atmospheric CO2 exchange (Li and Ku, 1997), changes in the stratification regime, and/or variations in primary productivity (Drummond et al., 1995). The small (0.5‰) decreases in δ18OCaCO3 values at AD 1630 may represent briefly higher lake levels because of increases in monsoon precipitation as seen in the Dongge Cave record or reduced agricultural withdrawal of lake water. The δ18OCaCO3, δ13CCaCO3, and δ13Corg values from Unit II are consistent with previous work on Chenghai in the context of age model uncertainty (Wu et al., 2004) (Figure S3, available online).
Magnetic susceptibility and C/N values begin to decline toward the end of Unit I with further, more substantial declines in Unit II. This suggests lower erosional input to the lake, although the sedimentology (color, grain size, etc.) does not noticeably change. Variations in basin sediment dynamics such as landscape stabilization relative to the intensive land-use change of Unit I, or other non-anthropogenically driven changes such as shifts in sediment source and subsequent delivery mechanisms, could explain the shifts at this time.
These changes may have been balanced by an increase in aquatic primary productivity, demonstrated by small decreases in C/N ratios (~2) and slightly higher δ15N values (an increase of ~1.5‰) at the beginning of Unit II. Notably, there is no accompanying change in δ13Corg values. While δ15N and C/N ratio are negatively correlated with an R2 value of 0.53, δ13Corg and C/N ratio display no significant relationship (Figure S4, available online). This implies that δ15N values are influenced by the source of organic matter, with more positive values occurring when the aquatic flux of organic matter is high. Conversely, δ3Corg values are controlled by more factors than simply the source (i.e. aquatic versus terrestrial), which perhaps explains why there is no concomitant shift in δ13Corg values in concert with changes in δ15N and C/N ratios. δ13Corg is likely therefore more strongly influenced by variables such as carbon cycling, primary productivity, and the metabolic pathway (i.e. C3 versus C4) of terrestrially sourced carbon. Additional paleoclimate records from the region and/or more extensive historical records are required for a more robust attribution of these isotopic changes to any one controlling factor (e.g., human activity or climate change).
Unit III: Large magnitude isotopic changes
The substantial increase in sedimentation and the isotopic shifts at AD 1700 (Figure 7) are closely coincident with the construction of the downstream dam (Tang, 1989) within the limits of age model uncertainty. Our record shows that this hydrologic modification caused a progressively accelerating increase in δ18OCaCO3 values because of increased evaporative losses from the lake associated with higher lake levels, greater surface area, larger lake volume, and consequently longer water residence times (Steinman et al. 2010). Lake level increased and stabilized because of manipulation of outflow at the dam outlet, causing a larger proportion of water loss via evaporation relative to the undammed, greater outflow configuration that existed prior, and hence higher baseline oxygen isotope values.
It is also possible that lake water isotopic composition changes reflect a change in regional hydrogeology that caused a shift in groundwater isotopic composition or a change in groundwater throughflow flux. While we acknowledge that groundwater may contribute to the isotopic shift at Chenghai, we cannot identify mechanisms associated with dam construction that would cause such a change in regional hydrogeology. On the basis of modern-day observations that Chenghai is a closed-basin lake and thus affected by changes in P/E balance, the simplest explanation for the shift at AD 1700 is increased evaporative flux.
The high variability in both δ18OCaCO3 and δ13CCaCO3 values throughout Unit III suggests that fluctuations in lake level and volume likely occurred in response to outflow manipulation and/or water withdrawals. It is difficult to assess the validity of the historical observations indicating that Chenghai dropped 30 m by AD 1779 (Chen and Wan, 2000) and continued declining thereafter. While our oxygen isotope record exhibits substantial variability just prior to this time, a drop of 30 m seems unlikely. If such a large lake-level decline did occur, a commensurately large shift in the oxygen isotopic composition should be present in the sediment record, and a long-term trend toward higher δ18OCaCO3 values throughout Unit III should exist. The high variability and the return at times to lower oxygen isotope values later in Unit III (ca. AD 1890) suggest that while lake levels did decline, they did not do so continuously after the dam was constructed.
The reduction in δ13CCaCO3 values in Unit III is likely a result of changes in the carbon cycle of the lake rather than changes in lake-catchment hydrology and may be due to either the influence of oxidation and dissolution of organic matter at the shoreline or due to reduced primary productivity within the lake associated with the observed lake-level drop at AD 1779 (Chen and Wan, 2000). Both terrestrial and aquatic organic matter, which are relatively depleted in 13C, would have been exposed and reworked because of lake-level fluctuations. This organic matter could have oxidized and produced isotopically light CO2 which then entered the lake and became incorporated into the dissolved inorganic carbon (DIC) pool (Hammarlund et al., 1997). Plant respiration and CO2 exchange within the soil may have further influenced the carbon isotopic signature of inputs to the lake.
Alternatively, the trend toward lower δ13CCaCO3 values is coincident with a decline in δ13Corg and δ15N values during Unit III which may indicate reduced productivity in the lake. The lighter isotopes of carbon (12C) tend to be preferentially incorporated into organic matter, leaving the remaining DIC pool relatively enriched in heavy carbon isotopes (13C) (McKenzie, 1985). As productivity increases, 12C is removed from the DIC pool and sequestered in the sediment, leading to progressively greater δ13CCaCO3 and δ13Corg values over time (Schelske and Hodell, 1995). Conversely, decreases in δ13CCaCO3 and δ13Corg values may reflect declining primary productivity. The C/N ratio also increases during Unit III, suggesting either an increasing proportion of terrestrial organic matter in the sediment or, more likely, a decreased proportion of aquatic organic matter (Meyers, 1994) associated with declining lake productivity. Additionally, the covariance of δ13CCaCO3 and δ18OCaCO3 values in Unit III is lower (R2 = 0.42) than Unit I (Figure 6) likely due to the decline in δ13CCaCO3 values. Either of the above interpretations of the shift in δ13CCaCO3 values demonstrates that the anthropogenic manipulation of water outflow and subsequent lake-level drop had limnological consequences for the carbon cycle of the lake.
Collectively, the decrease in δ18OCaCO3 and δ13CCaCO3values and the increase in δ13Corg and weight percent organic matter that occur at ~AD 1890 (Figure 7) suggest increased primary productivity and higher lake levels, possibly because of greater precipitation amounts and warmer temperatures associated with the termination of the LIA. Historical records note that by AD 1851, Chenghai was a closed-basin due to the restriction of Haikou River outflow to the Jinsha River (Chen and Wan, 2000), although the exact date and reason for this cutoff are not stated. Therefore, we cannot completely discount the possibility of further anthropogenic manipulation of lake hydrology at this time. The observed changes at AD 1890 in the Chenghai record may also be driven by natural climate variability. In light of the potential for substantial spatial heterogeneity in precipitation due to orographic effects (among other variables), the decline at 1890 in δ18OCaCO3 values at Chenghai may represent the local expression of the overall return to wetter conditions associated with the termination of the LIA for southwestern China exhibited by the Dongge Cave record to have begun a century earlier (in the late 18th century) (Wang et al., 2005). The lack of a concomitant change in C/N ratio or δ15N values suggests that the source of organic matter did not vary and that the shift in δ13Corg values may be because of increased productivity associated with warmer temperatures, an inference supported by an increase in weight percent organic matter that occurs around this time.
The oxygen and carbon isotope records presented here are largely consistent with a previous study of Chenghai (Wu et al., 2004) albeit the resolution of our record is higher and consequently exhibits greater high-frequency variability (Figure S3, available online). For example, this previous study of Chenghai also reports shifts in δ18OCaCO3 of +1‰ at AD 1700 and −2‰ at AD 1900, and a shift in δ13CCaCO3 of −3‰ at AD 1900. However, there are notable differences in the carbon isotopic composition of organic matter reported by our study and this prior investigation, in that Wu et al. (2004) only observed a −2‰ shift in δ13Corg values at AD 1600 instead of the −4‰ shift that we measured. Additionally, while we report a +5‰ shift beginning at AD 1840, Wu et al. (2004) observed a −3‰ shift. They noted that this result was inconsistent with the inferred increase in blue-green algal pigments, such as oscillaxanthin and myxoxanthophyll, which were interpreted to represent a more eutrophic phytoplankton assemblage (Wu et al., 2004). Reasons for the difference between the results presented here and this previous study are unclear. The broad agreement of oxygen and carbon isotopes of aragonite suggests that it is not due to disparity in age models. The sediment core analyzed in Wu et al. (2004) was taken closer to the deepest part of the lake, which may have received differing amounts and types of organic matter than our coring location. Given the dramatic lake-level fluctuations that have taken place within the last several hundred years, the remobilization of organic matter from the shoreline and catchment may, in part, have contributed to some of these differences.
Finally, the higher nitrogen isotope values after AD 1930 (Figure 7) are caused by the expansion of agriculture and increased fertilizer use in the catchment, which was documented by Wu et al. (2004). This produced a shift in the trophic status of the lake as well as lower water levels because of diversion for rice agriculture. Further increases in the weight percentage of organic matter also occur around the same time and support these conclusions. Our data from this interval differ significantly from the previous studies of Chenghai, which documented a monotonic decline in δ18OCaCO3 and δ13CCaCO3 values of 1–2‰ in the upper 10–15 cm of the sediment core (Chen et al., 2002; Wu et al., 2004). This is unexpected given that lake level has recently declined (Whitmore et al., 1997), which should have driven δ18OCaCO3 and δ13CCaCO3 values higher, not lower. This may be because of eutrophication of the lake, which can induce rapid carbonate precipitation that does not form in isotopic equilibrium with lake water and can have a more negative isotopic values (Teranes et al., 1999). Lower lake levels are further reflected in the increase in the concentration of dissolved ions such as Mg2+ and Na+ and the overall lake salinity (Wan et al., 2005; Whitmore et al., 1997). The highest δ18OCaCO3 values of the entire record occur at AD 1960, signifying the lowest lake levels of the past 900 years and highlighting the sensitivity of the lake to recent climate change. More recent human modifications to lake hydrology such as the creation of the pumping station or the introduction of water from an adjacent watershed (Wang and Dou, 1998) cannot be discerned in our sediment record because of insufficient sampling resolution through these intervals.
Conclusion
Our study indicates that substantial anthropogenic impacts to Chenghai occurred as a result of land-use changes and catchment modification beginning by at least AD 1150. An improved estimate of the initiation of this human activity requires a longer sediment core, but our results are consistent with previous findings of enhanced erosion resulting from agricultural activity in the lake catchment at this time. We also document the hydrologic and limnological consequences of the construction of a dam downstream of the lake between AD 1573 and 1620. The resulting increase in δ18OCaCO3 values is consistent with increased evaporative flux due to restricted lake outflow and increased water residence time associated with dam construction. This intentional manipulation of lake-catchment hydrology restricted water outflow and subsequently caused dramatic lake-level fluctuations which exposed the shoreline and affected the carbon cycle and primary productivity of the lake. Our study underscores the notion that archaeological and historical context is necessary to produce rigorous interpretations of paleoenvironmental variability in regions of the world where humans have settled in large numbers for thousands of years. In such a setting, where environmental geochemistry can be influenced by a myriad of factors, a multi-proxy approach is essential for disentangling the impacts of anthropogenic changes from natural climate variability.
Footnotes
Acknowledgements
We thank David Pompeani, Matthew Finkenbinder, and Katie Redling for assistance with lab work and useful feedback and ChunLiang Gao and Jordan Abbott for assistance with fieldwork. We thank three anonymous reviewers whose feedback greatly improved the quality of this manuscript.
Funding
This work was financially supported by the National Natural Science Foundation of China (NSFC grants 40571173, 40871008, and 41171171) and the US National Science Foundation (EAR/IF grant 0948366). All data are archived at the National Oceanic and Atmospheric Administration Paleoclimatology World Data Center.